Article

Rapid Estimation of Stomatal Density and Stomatal Area of Plant Leaves Based on Object-Oriented Classification and Its Ecological Trade-Off Strategy Analysis

1
Key Laboratory for Silviculture and Conservation of Minnistry of Education, Key Laboratory for Silviculture and Forest Ecosystem of State Forestry Administration, Beijing Forestry University, Beijing 100083, China
2
Research Institude of Tropical Forestry, Chinese Academy of Forestry, Guangzhou 510520, China
*
Author to whom correspondence should be addressed.
Forests 2018, 9(10), 616; https://doi.org/10.3390/f9100616
Submission received: 21 August 2018 / Revised: 26 September 2018 / Accepted: 3 October 2018 / Published: 8 October 2018
(This article belongs to the Section Forest Ecophysiology and Biology)

Abstract

:
Leaf stomata are important structures used for exchanging matter between plants and the environment, and they are very sensitive to environmental changes. The method of efficiently extracting stomata, as well as measuring stomatal density and area, still lacks established techniques. This study focused on the leaves of Fraxinus pennsylvanica Marshall, Ailanthus altissima (Mill.) Swingle, and Sophora japonica (L.) Schott grown on different underlying surfaces and carried out an analysis of stomatal information using multiscale segmentation and classification recognition as well as microscopy images of leaf stomata via eCognition Developer 64 software (Munich, Germany). Using this method, we further analyzed the ecological significance of stomata. The results were as follows: (1) The best parameters of stomatal division and automatic extraction rules were scale parameter 120–125 + shape parameter 0.7 + compactness parameter 0.9 + brightness value 160–220 + red light band >95 + shape–density index 1.5–2.2; the accuracy of stomatal density and stomatal area using this method were 98.2% and 95.4%, respectively. (2) There was a very significant correlation among stomatal density, stomatal area, and stomatal shape index under different growing environments. When the stomatal density increased, the stomatal area lowered remarkably and the stomatal shape tended to be flat, suggesting that the plants had adopted some regulatory behavior at the stomatal level that might be an ecological trade-off strategy for plants to adapt to a particular growing environment. These findings provide a new approach and applicable parameters for stomata extraction, which can further calculate the stomatal density and stomatal area and deepen our understanding of the relationship between stomata and the environment. The study provides useful information for urban planners on the breeding and introduction of high-temperature-resistant urban plants.

1. Introduction

Stomata are an important component of the plant epidermis, and they are the channels through which leaves exchange water and gas with the outside world [1,2,3,4]. Stomata are a very important structural parameter on the leaves of terrestrial plants, and their characteristics have attracted wide attention from global ecologists [4,5]. In particular, there are many reports on the stomatal characteristics of important green plants and their influencing factors [6]. Stomatal morphological characteristics are important factors affecting their function, and they are mainly affected by the plant growth environment. Among them, stomatal density and stomata size can directly affect plant photosynthesis and transpiration [7,8,9]. Many studies have investigated plant responses to global climate warming at different scales, with most performed in a greenhouse test environment and focusing on responses of sapling to their environmental change [8]. The morphology of stomata on the blade determines whether plant moisture and gas exchange are normal. For example, the larger the stomatal area, the larger is the channel for gas and moisture exchange [9]. Conversely, the smaller the stomatal area, the more inhibited the gas and moisture exchange process may be. Similarly, it is more likely that plants will lose moisture through the leaves with an increase in stomatal density [7,8,9,10]. Stomata can also affect plant water use, material metabolism, nutrient absorption, and the accumulation of organic matter [8,10]. Studies have shown that the development of stomatal cells in different growth environments responds differently to environmental changes, such as drought, light, CO2, and so on [11]. For example, stomatal density increases with light intensity as well as rise in temperature. It has also been pointed out that plants that are grown in higher humidity environments have larger stomata and a smaller stomatal density. In addition, the morphology of the stomata varies with changes in atmospheric humidity and CO2 concentration [12]. As plant stomata are the key organ structures performing transpiration, its development—which varies with environmental factors—is an important determinant of moisture and gas exchange. Moreover, leaf stomata can be indicators of plant responses to environment, especially to temperature and moisture, because their responses are not only the basis of changes at the leaves level, but they are also among those organs that show visible impacts of their growing environments [11,12,13]. Furthermore, stomata traits can express phenotypically plastic responses to growth environments. Because of the special morphological and structural characteristics of plant stomata, their development and physiological functions are very sensitive to environmental changes [13]. Thus, the stomata of plants are often used to reflect the response and adaptation of plants to changes in the climate, which are of great significance for predicting the changing trends of the urban climate environment in the context of the accelerating urbanization process [14]. Consequently, experiments on the method of stomata extraction will provide a better understanding of the mechanism of plant responses to urban environment at the leaf level.
Although plant stomata play an important role in indicating environmental changes, the current research mainly focuses on crops such as Zea mays L., Tritium aestivum L., and Oryza sativa L. [15,16,17], with urban greening trees, especially in terms of leaf stomatal function traits based on mature plant grown in urban environments, seldom being studied. The extraction of stomata is a prerequisite for, and very important in, the study of stomatal properties [18]. The traditional method of measuring stomatal density and stomatal area mostly involves manual measurements using optical microscopy [19,20]. There are many deficiencies in this approach, which not only reduces the efficiency of the calculation but also easily leads to human error [20,21,22]. However, there are still large gaps in the development of plant stomatal extraction methods. Therefore, ways to improve extraction efficiency and extraction accuracy of stomatal information are very important in the study of stomatal properties.
The software used in this study—eCognition Developer 64—is the world’s first object-oriented classification of remote sensing image processing [23,24]. It uses a multiresolution segmentation approach, which is basically a region-merging technique starting with one-pixel objects. The software can comprehensively analyze images by simulating human thinking, which has powerful functions for logic classification, modeling, complex semantic analysis, and the integration of multisource data [24]. Object-oriented methods have incomparable advantages over traditional pixel-based analysis methods. It can effectively solve the salt-and-pepper effect of high-resolution remote sensing images, and it integrates noise into the object during segmentation [25]. Because the object-oriented method deals with objects rather than individual pixels, it can take advantage of information such as the texture features, topological features, and geometric features of the object, which improves the accuracy of the extraction [23,24,25]. At present, object-oriented classification technology has a narrow application range, which mainly applies to urban building extraction, vegetation classification, and crop remote sensing interpretation, but there are few studies on stomatal feature recognition.
Glass slides are made from the fresh leaves of plants, and high-definition images are taken of the slide-mounted samples with an optical microscope, which not only clearly captures the shape and texture of the stomata but also the special spectral and brightness characteristics of stomata [26]. If such microscopic images are regarded as remote sensing images, it is possible that the stomatal features can be extracted using the object-oriented classification method in remote sensing to further measure the stomatal density and stomatal area.
The stomatal characteristics are not only different among tree species due to their own growth characteristics, but they also differ among environments because of their strong environmental sensitivity. Based on these concepts, this paper studied the stomatal microscopy images of the common greening species Fraxinus pennsylvanica Marshall, Ailanthus altissima (Mill.) Swingle, and Sophora japonica (L.) Schott, which were grown on six typical urban underlying surfaces—asphalt, bricks, marble, cement, grass-planting bricks, and grass surfaces—in Beijing, China. We hypothesized that the stomata can be separated from the background in microscopic images using a special trait, and they were multiscale-segmented using eCognition Developer 64 software to determine the best scale parameter, shape parameter, and compactness parameter. After that, by observing the special characteristics of plant stomata via a microscope, we selected spectral features, brightness features, and geometric features for the classification and extraction of stomata. This method can not only break through the limitations of traditional measurement methods—which can be inefficient, time consuming, and laborious—but it can also achieve an efficient calculation of stomatal density and stomatal area. The method will provide reference for future research on plant stomata. Based on the growth of the sampled trees, the trade-off relationship between stomatal characteristics and the plant living environment were further analyzed.

2. Materials and Methods

2.1. Study Area

Beijing, the capital of China, lies on the northern edge of the North China Plain, between longitudes 115°125 and 117°130 E and between latitudes 39°28 and 41°05 N. Beijing is located on the eastern rim of the Eurasian land mass and belongs to the West Wind Belt. It is characterized by a warm temperate continental monsoon climate. The four seasons are quite distinct. The annual average temperature is 11.5 °C, with an average precipitation of 630 mm, about 70% of which is concentrated in July and August. On the lowlands, the frost-free period is 190–195 days [27].
The sampling locations were located in the Olympic Forest Park and the Haidian District streets. The Olympic Forest Park covers an area of 680 hm2, with a green area of 478 hm2 and a green coverage rate of 95.61%. The dominant species are Fraxinus pennsylvanica, Ailanthus altissima, Sophora japonica, Pinus tabuliformis Carr., Populus tomentosa, and so on. The main street trees in Haidian District are Fraxinus pennsylvanica, Ailanthus altissima, and Sophora japonica.

2.2. Plant Material

In order to eliminate the differences in leaf stomatal extraction in different habitats and find a set of stomatal extraction methods suitable for different leaf morphology, as well as different stomatal area, stomatal density, and stomatal morphology, this study selected common greening tree species (Fraxinus pennsylvanica, Ailanthus altissima, and Sophora japonica) growing on six urban underlying surfaces (asphalt, bricks, marble, cement, grass-planting bricks, and grass surfaces), which have different leaf sizes, leaf textures, and leaf hairs (Table 1). In July 2017, leaf samples were collected from the Olympic Forest Park in Beijing, China. Thirty trees were selected for each tree species in each urban underlying surface. Sample collection was carried out on sunny days from 6:00 to 8:00 in the morning, using high-pruning shears to extract 30 mature and healthy leaves per tree. These leaves were placed in an ice box at 5 °C for storage. The production of stomatal slides and the collection of stomatal microscopic images were completed in one hour in order to ensure the open state of stomata.

2.3. Stomatal Image Acquisition

In this test, we used a “nail polish blotting method” to make temporary stomatal slides [28]. First, we cleaned the dust off the leaves with wet cotton wool. Then, we applied a layer of clear nail polish evenly to the back of the blade. After the nail polish was completely dry, the blotting film was peeled off to make a temporary slide. We used an optical microscope (Leica DM6000B, Monroe, LA, USA) to observe the stomatal characteristics under 100 times magnification. In this experiment, a total of 600 stomatal images (881 μm × 661 μm) were collected for each tree species.

2.4. Stomatal Image Processing

2.4.1. Stomatal Image Pretreatment

In order to increase the contrast between the stomata and the background, the original microscopic images were geometrically corrected and LUT stretched using the eCognition Developer 64 software (Munich, Germany).

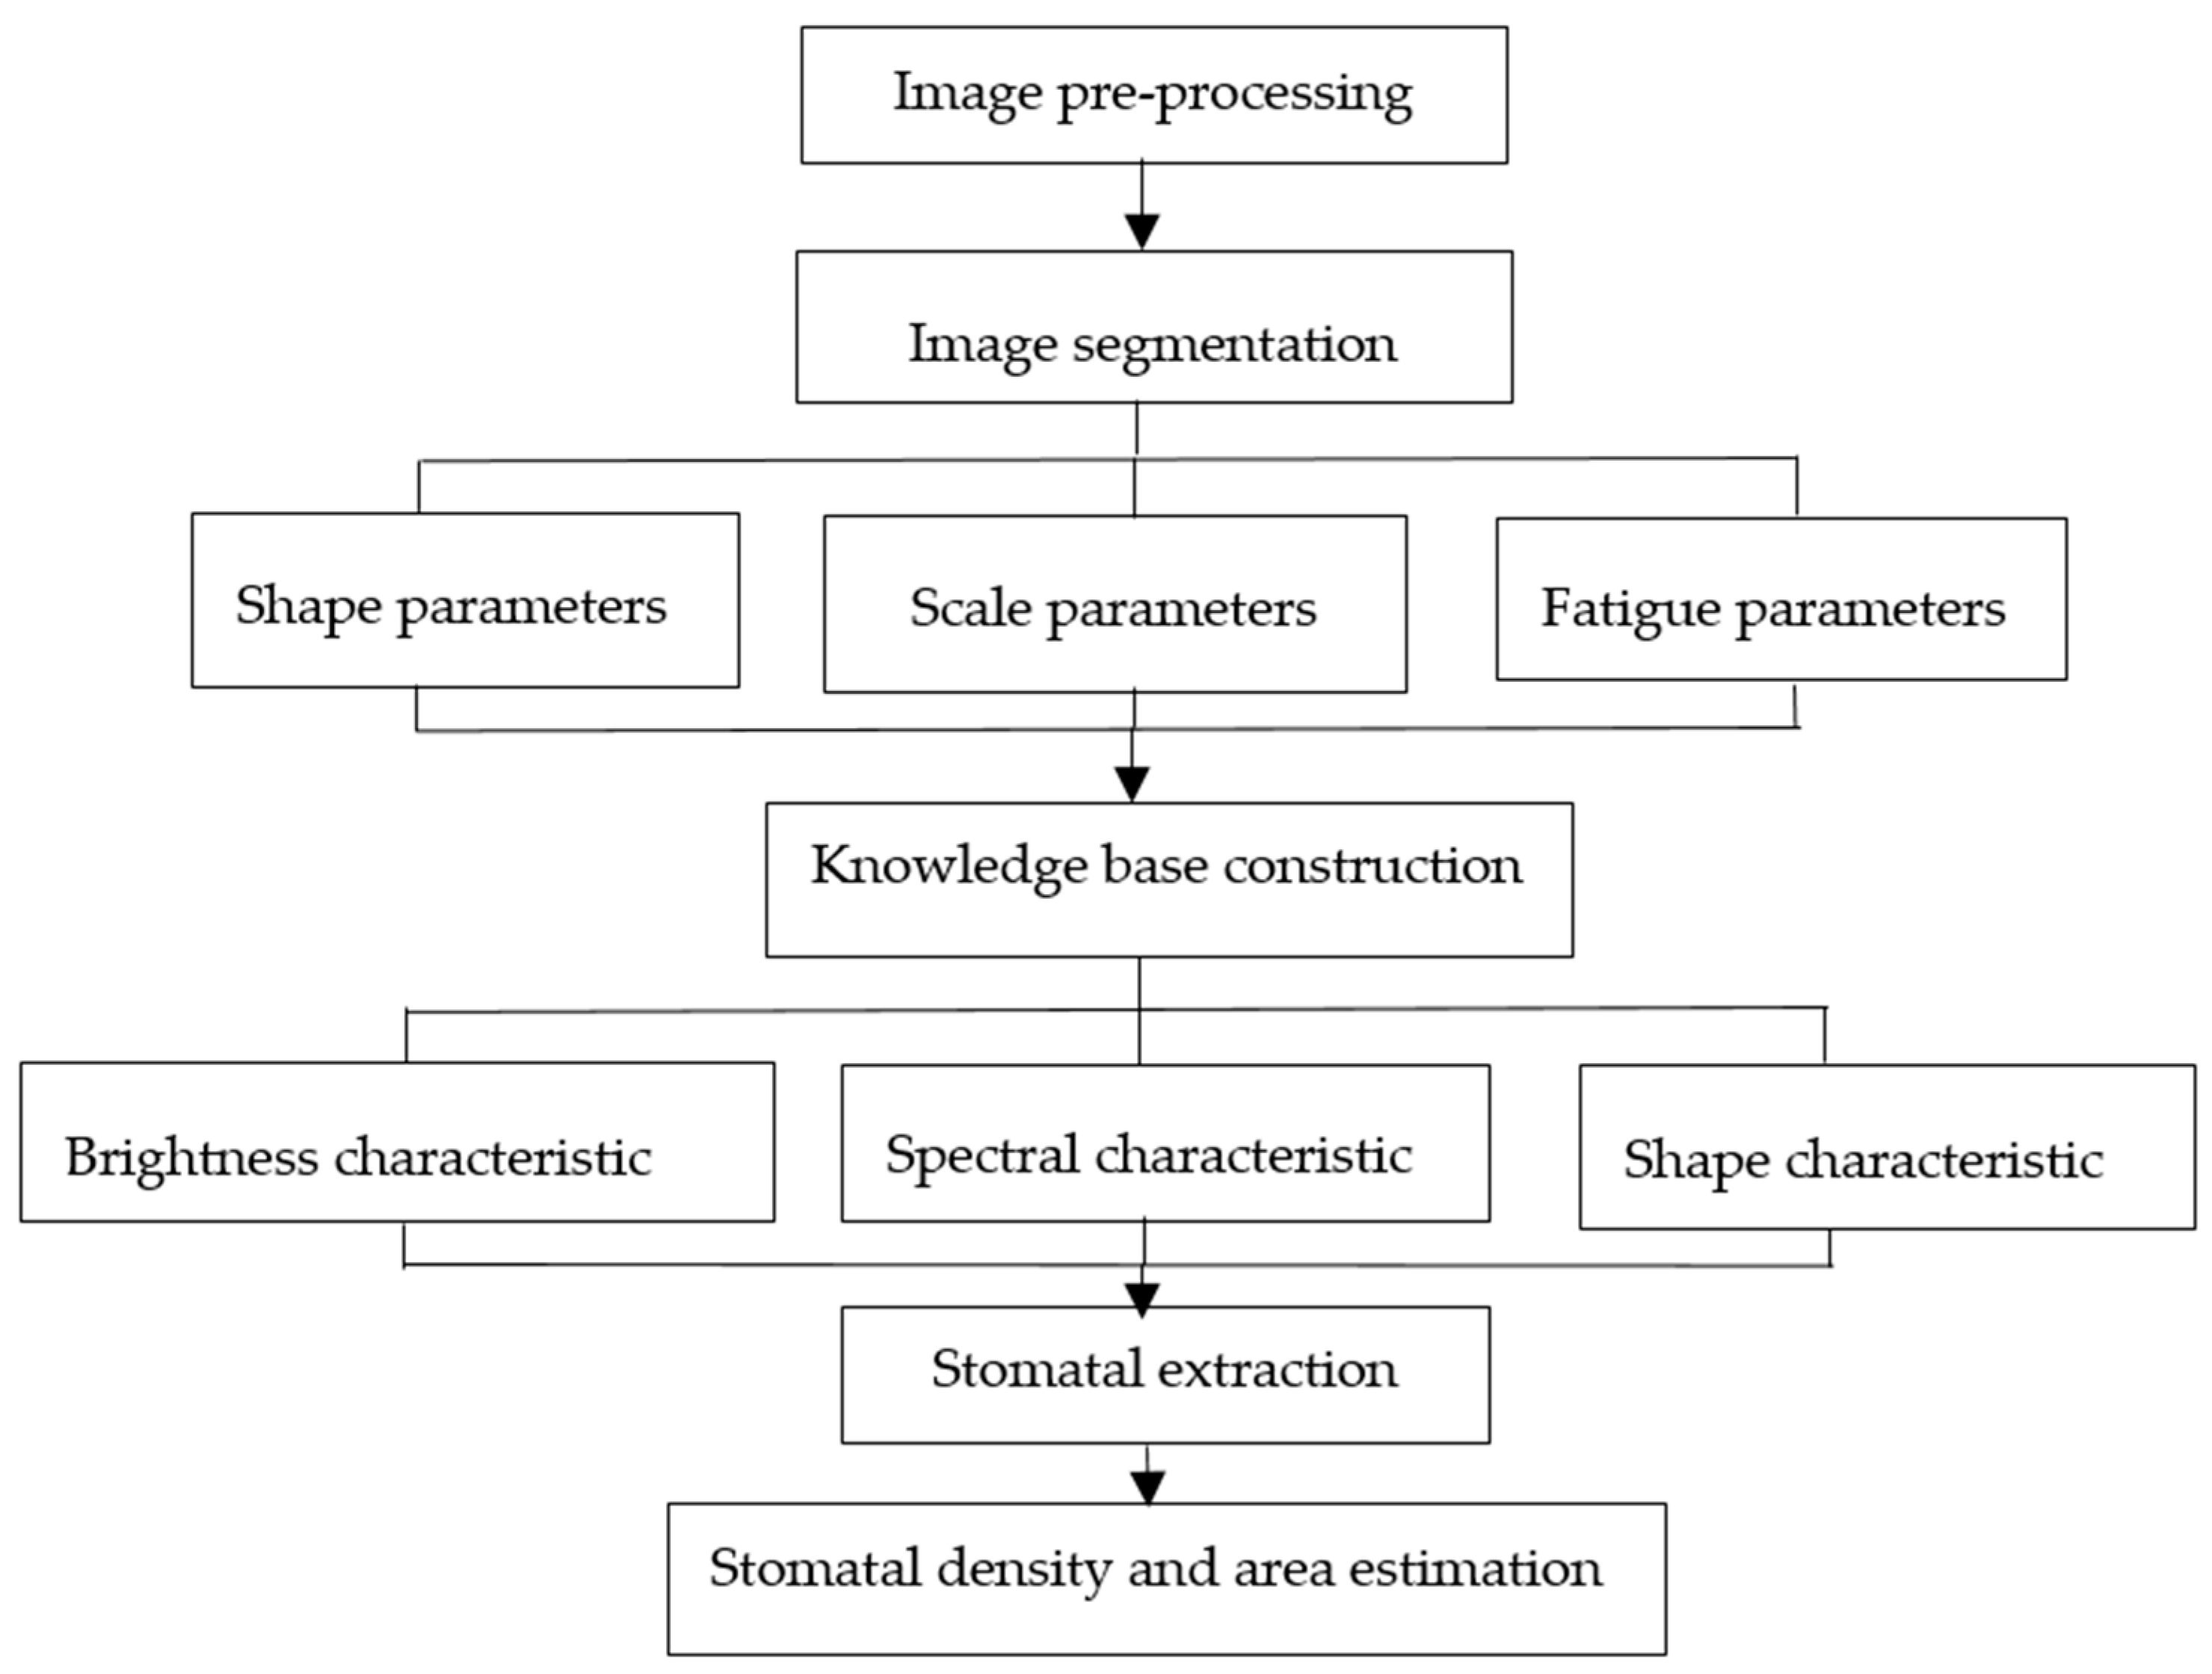
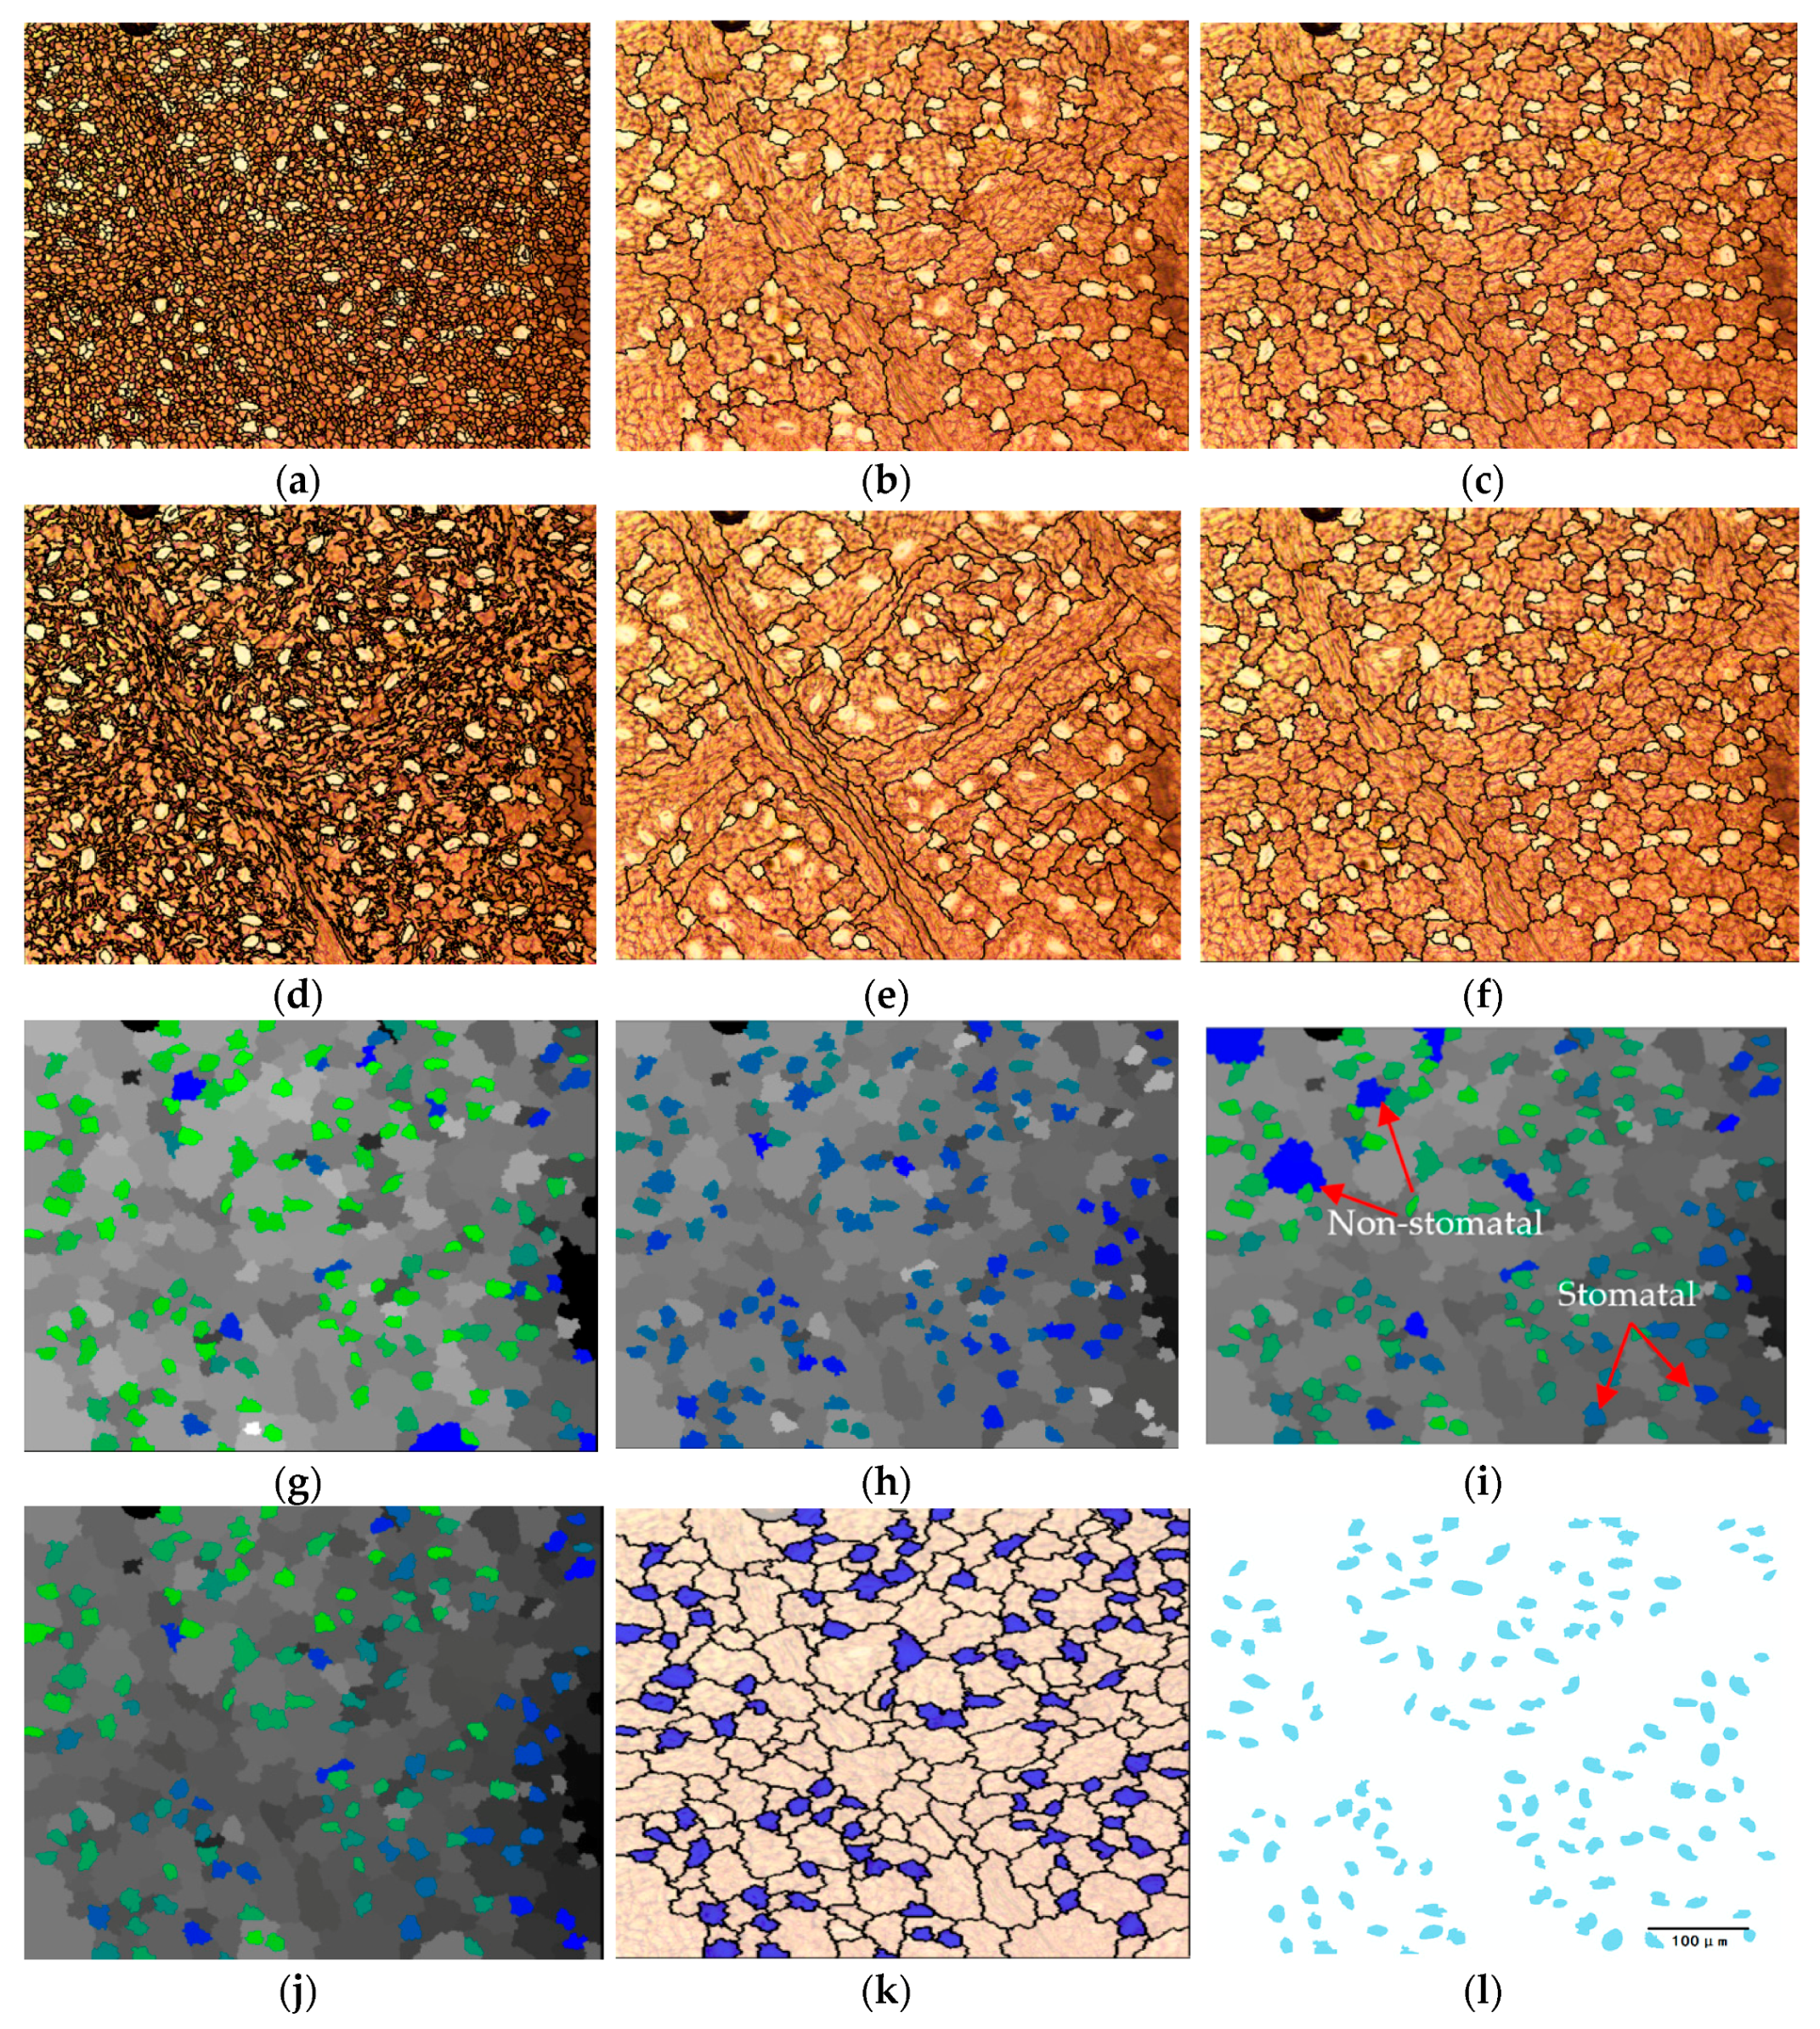
2.4.2. Extraction Process

The stomata images were processed using eCognition, which is a specialized software for object-oriented classification. The process of the object-oriented classification method included image segmentation, feature selection, rule creation, and classification extraction (Figure 1). The basic processing units of object-oriented image analysis are segments and not single pixels. The purpose of image segmentation is to subdivide an image into groups of pixels, corresponding to meaningful objects in the field. These objects are then classified. The key to object-oriented classification is multiscale segmentation, and the key to multiscale segmentation is the choice of parameters. If the classification result is poor, the multiscale segmentation parameters must be redetermined [29,30]. Based on the characteristics of the stomata, a hierarchical structure was established to separate the stomata from the nonstomata. Finally, the stomata were separated according to the characteristic values of the pixels, and the classification accuracy was evaluated. In this process, the segmentation methods mainly included chessboard segmentation, multiscale segmentation, and multithreshold segmentation, which are very essential for stomatal extraction. By observing the stomatal characteristics of the three tree species, this test used a multiscale segmentation method, which divides the entire image into subregions that do not overlap each other based on homogeneity and heterogeneity [31].
After that, the typical features of the stomata were selected in accordance with the automatically generated vector face file for extraction. A knowledge base of stomatal extraction was constructed using brightness features, spectral features, and shape features, converting them into rules for further classification and extraction.

2.5. Calculation of Stomatal Density and Stomatal Area

The traditional measurement method of stomatal density and stomatal area involves manual measurements using Photoshop software, which is very complicated to operate, is time-consuming and laborious, and is also unable to process large quantities of blade samples. This study used eCognition software to determine the optimal combination of stomatal extraction rules and then export files. It can quickly calculate the number and area of the stomata in this process.

2.6. Accuracy Analysis

A total of 120 stomatal images were randomly selected for analysis for each tree species. Among them, 60 images of stomata were calculated using object-oriented classification, and another 60 were measured by traditional methods. The final measurement precision was calculated by calculating the difference between the stomatal density and the stomatal area extraction value, and the measured value. This study used a root mean square error test with the following formula [32]:
R = 1 n Σ i = 1 n ( P 1 P 0 )
P ( % ) = P 1 ¯ R P 1 ¯ × 100 %
where P1 refers to the number of stomata and the stomatal area, as measured by DP2-BSW microscopy software (Beijing, China), and P0 is the stomatal density and the stomatal area extracted by classification.

2.7. Surface Temperature and Gas Parameter Determination

Surface Temperature Measurement

The surface temperature of the sampling zone was monitored using a thermal imaging camera (Fluke Corp., Everett, WA, USA) from 1 May 2017 to 1 October 2017. Its main parameters were as follows: detector size of 320 × 240 pixels—one pixel represented one temperature value, meaning there was a total of 320 × 240 surface temperature values; thermal sensitivity of ≤0.05 °C; field of view of 23° (horizontal) × 17° (longitudinal), with minimum focal length of 15 cm; calibration range of −20–600 °C; error degree of 2%; observation band value range of 8–14 μm. The camera was installed at the center of the research areas, and the six environmental surface temperatures were monitored synchronously. The data was recorded every hour from 8:00 to 17:00, and three thermal infrared images were collected for each record. The surface temperature value was extracted using a thermal analysis camera (Munich, Germany) (Fluke Smart View) [33].

3. Results

3.1. Stomatal Characteristics under Different Environments

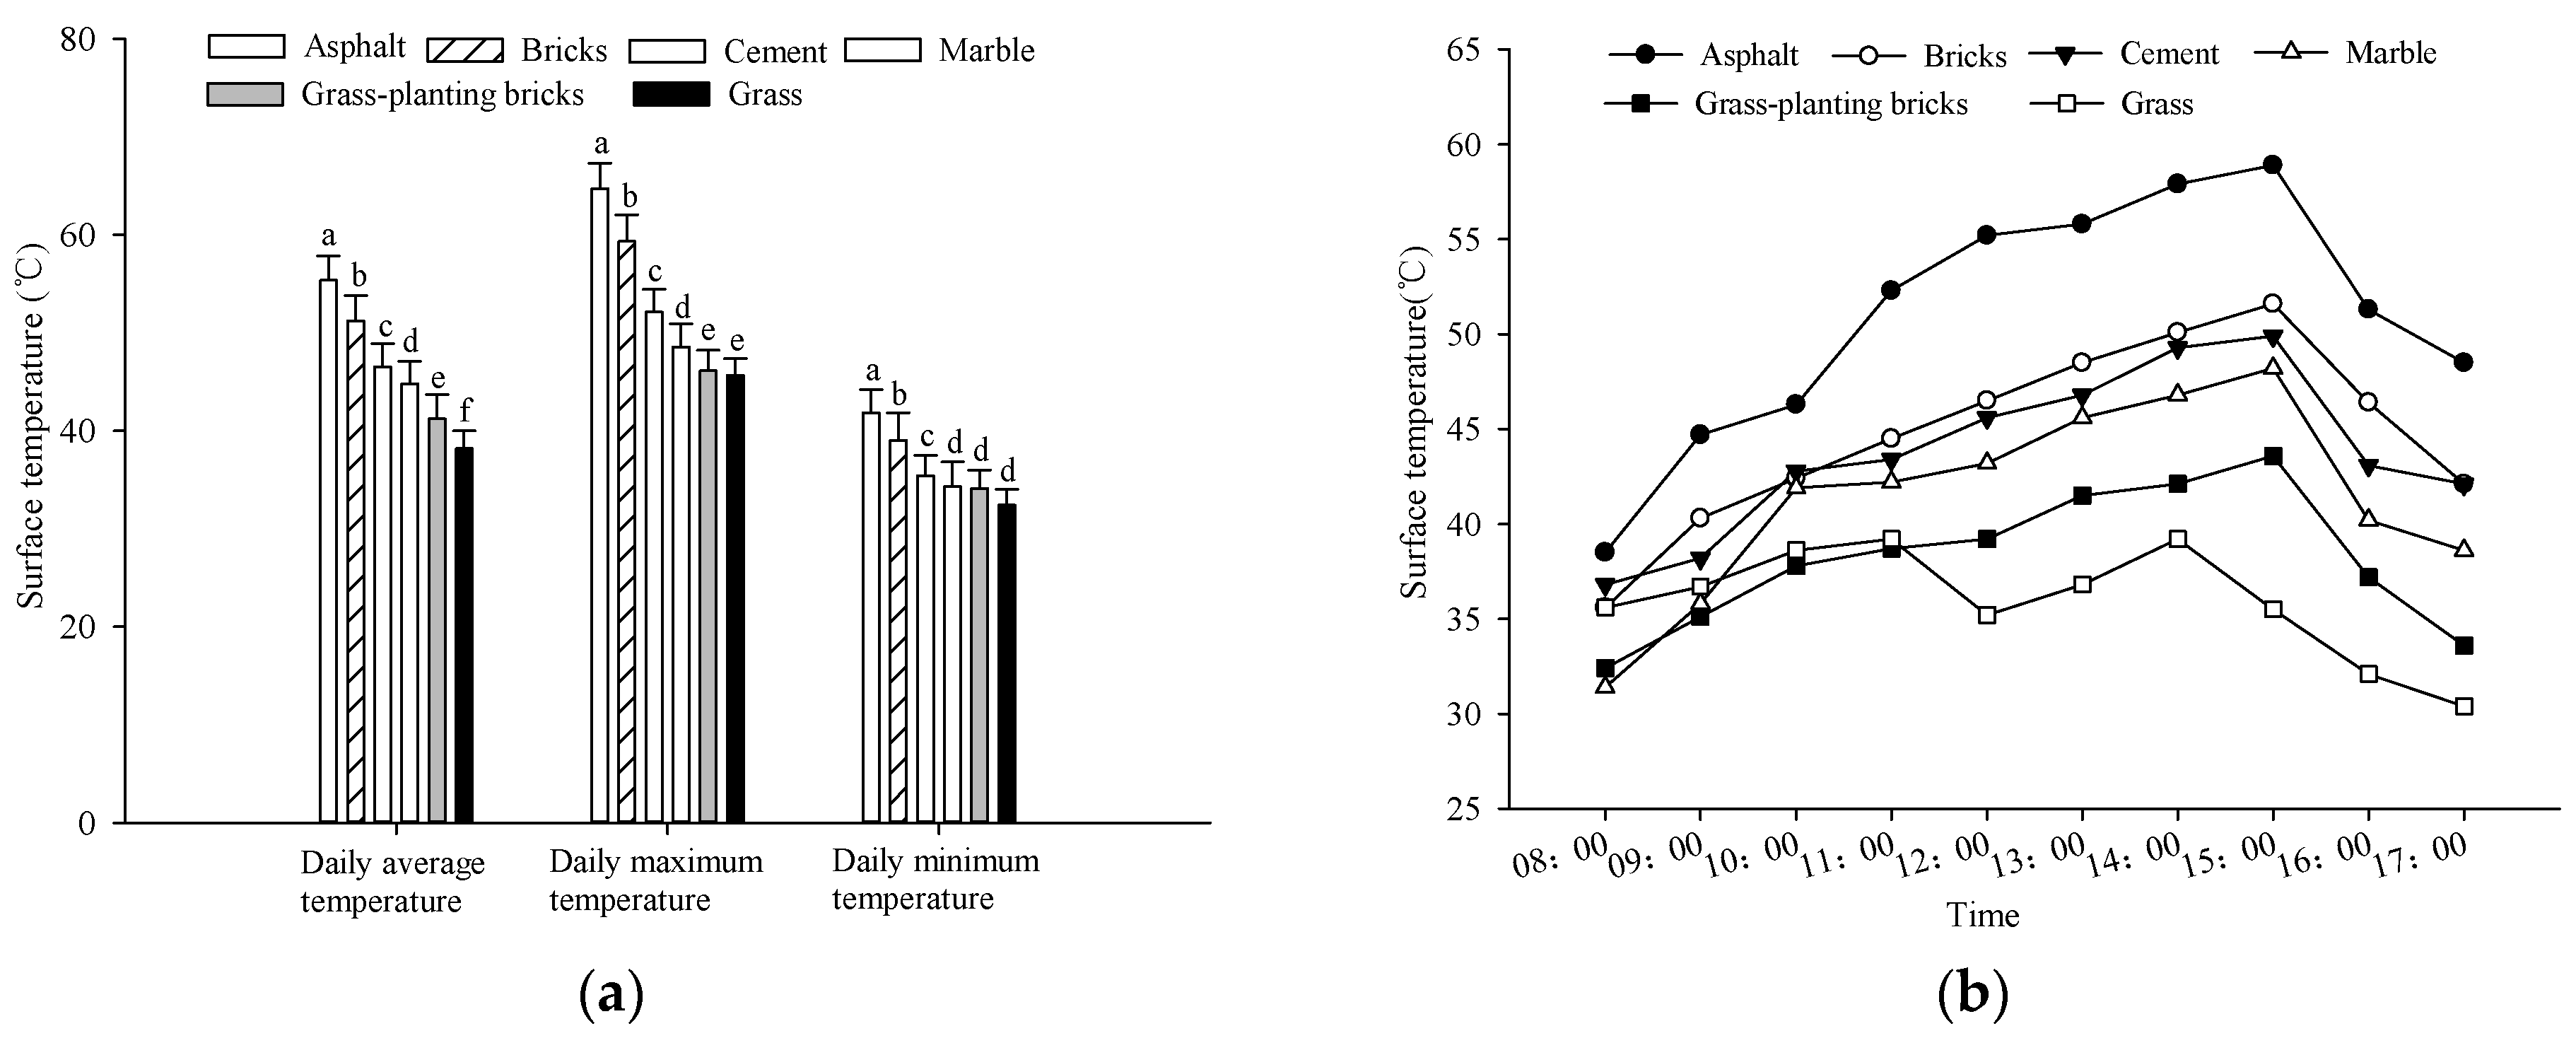
3.1.1. Surface Temperature Characteristics of Urban Underlying Surface Environments

According to the data from the Beijing Meteorological Bureau, high temperature days in Beijing are mainly distributed in summer. It can be seen from Figure 2 and Table 2 that the impact of urban underlays on urban thermal environmental effects was significant. The daily variation trends of the surface temperatures of the six underlying surfaces were basically the same, where the overall trend was an initial increase and then a decrease. As the solar radiation increased, the surface absorbed heat and the surface temperature gradually increased. This led to the surface temperature gradually increasing from 8:00 to around 15:00. A one-way analysis of variance showed that there was a significant difference between the surface temperatures of different types of underlying surfaces (p < 0.05). This reason may be related to the properties of the underlying surface.
Overall, among the six underlying surfaces, the highest surface temperature of the whole day and the whole growing season was on the asphalt surface, which was significantly higher than other underlying surface types (p < 0.05). This was expressed as asphalt surface > bricks surface > marble surface > cement surface > grass-planting bricks surface > grass surface. The results showed that the asphalt surface had the greatest impact on the urban thermal environment but that the grass-planting brick surface and the grass surface had certain mitigation effects on the urban thermal environment.

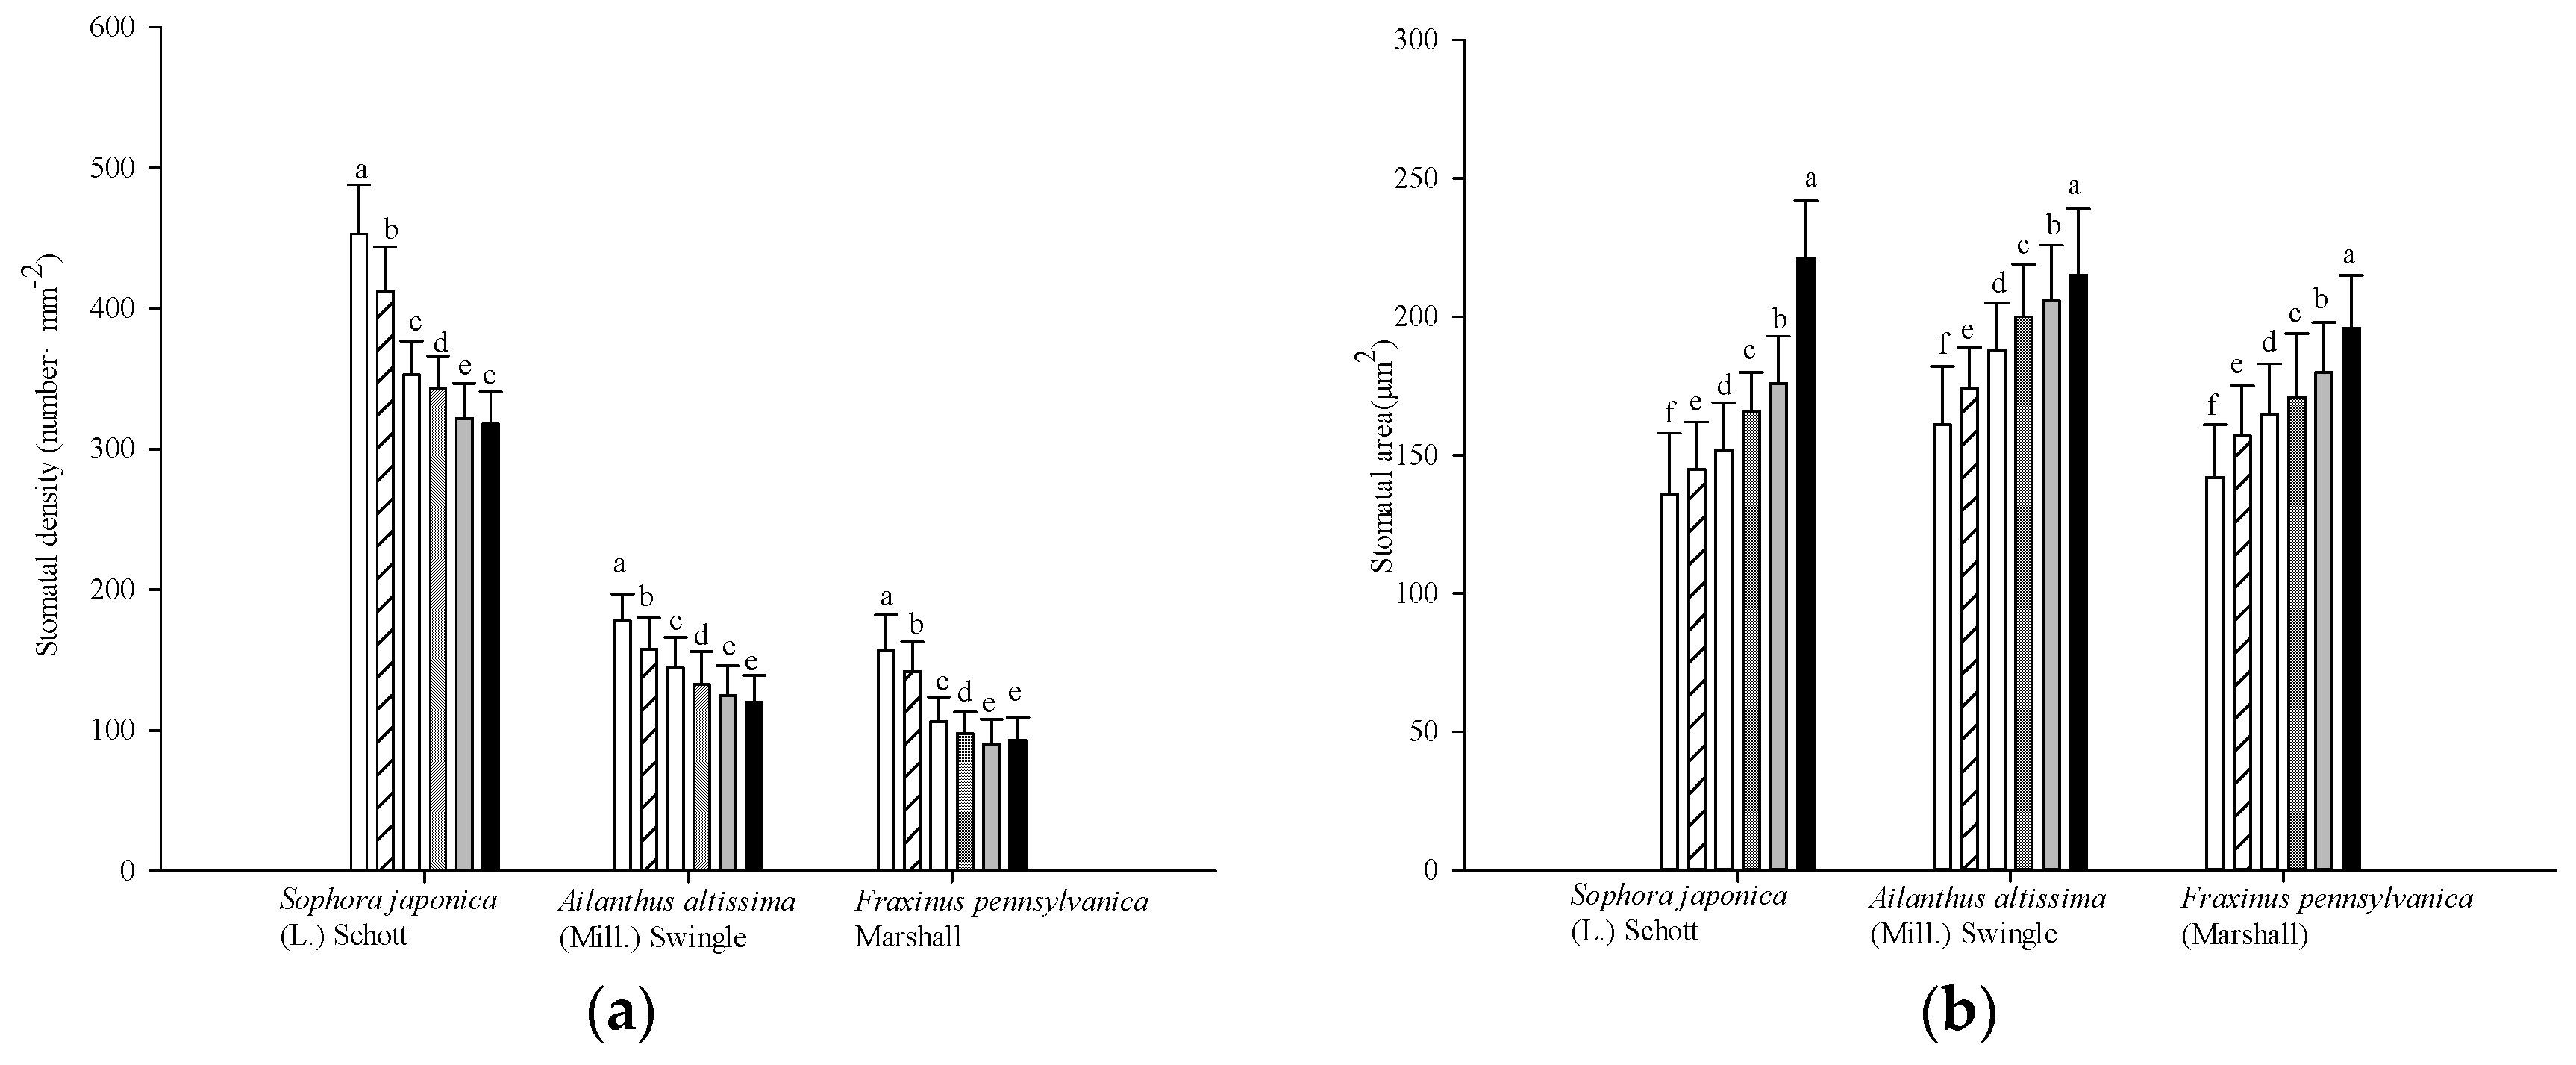
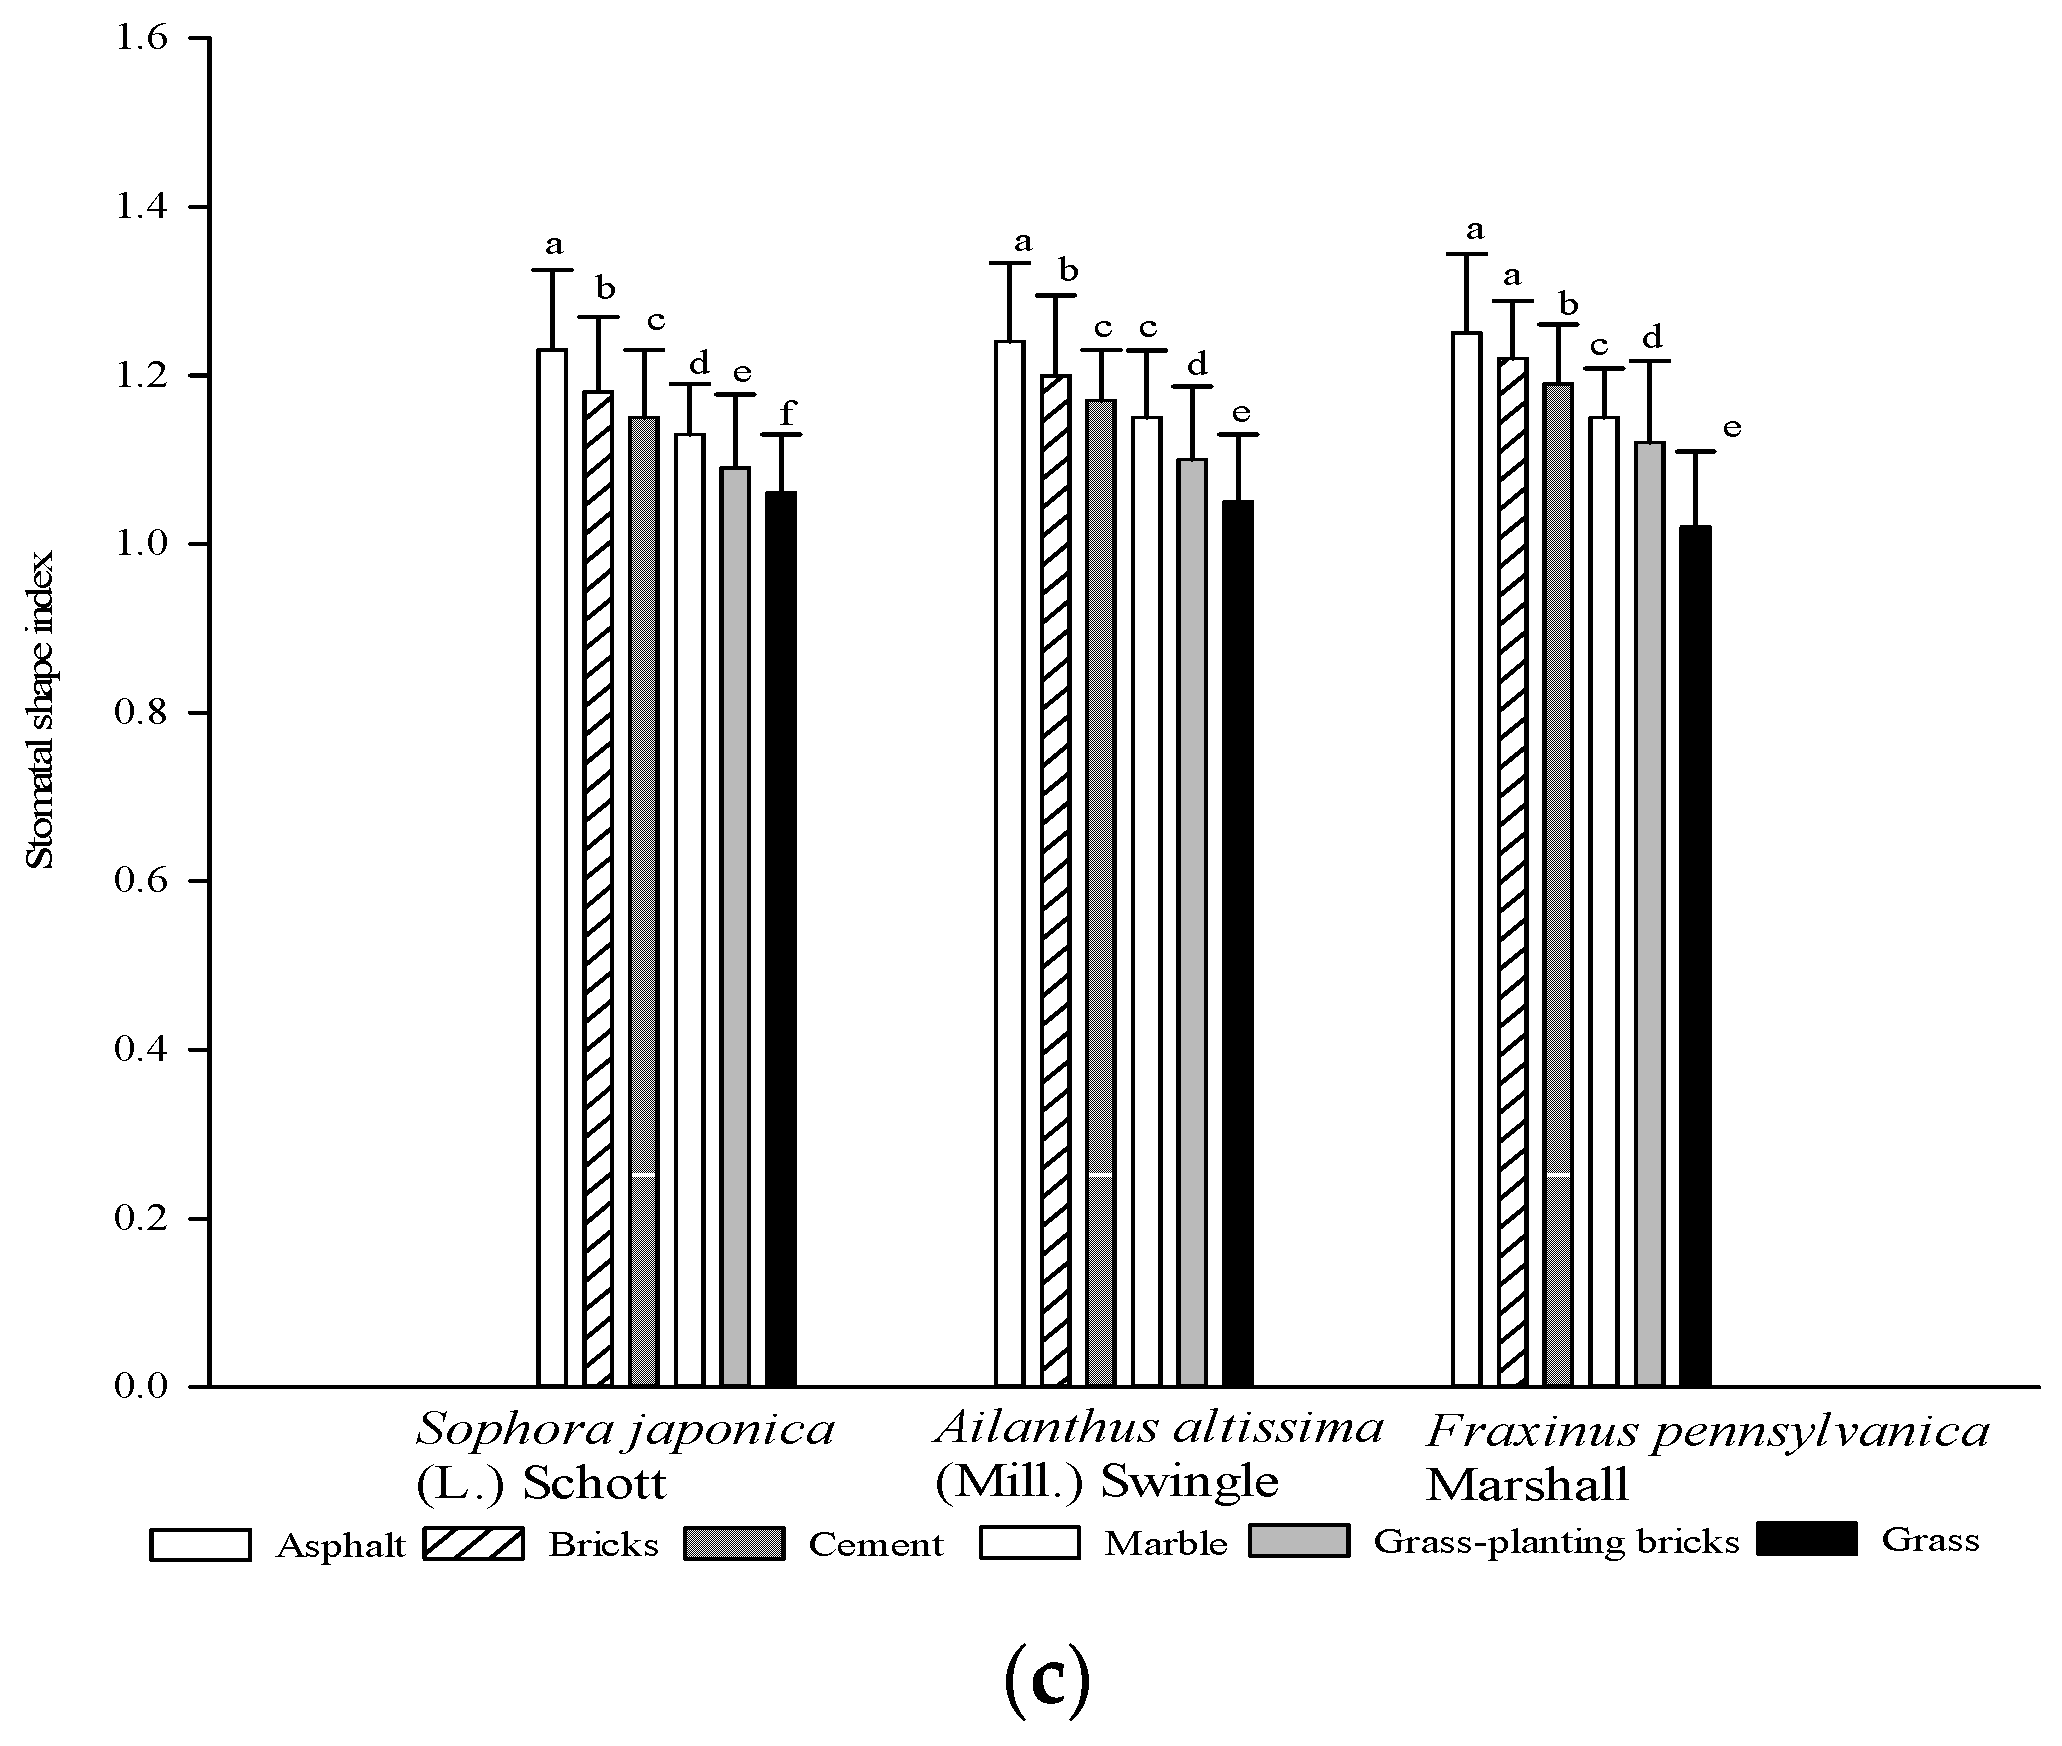
3.1.2. Stomatal Characteristics under Six Urban Underlying Surface Environments

The epidermis of plant leaves is distributed with many stomata, and this is closely related to the function of leaf resource allocation and utilization [34]. Stomata are an important channel through which plants exchange gases with the outside world. They play an extremely important role in the transpiration of plants [35]. Among them, stomatal density and stomatal area are closely related to plant transpiration intensity [36,37]. Changes in the stomatal density and stomatal area of plant leaves are often used to study the effects of drought stress and high temperature stress on plant growth [38]. Previous studies have shown that as the degree of drought stress increases, the stomatal density shows an upward trend [39]. The main reason for this is drought stress, which leads to a reduction in leaf area [40,41,42]. The results of this study showed that there was a significant difference in surface temperature under different underlying surface conditions (p < 0.05) (Figure 2). In such environments, plants showed a certain trade-off strategy in terms of stomatal morphology in order to alleviate high temperature stress. As the surface temperature increased, the stomatal density and stomatal shape index generally increased (p < 0.05), while the stomatal area showed a decreasing trend (Figure 3). Existing research shows that the larger the stomatal shape index, the flatter the stomatal shape tends to be. Conversely, the smaller the stomatal shape index, the more circular the stomatal shape tends to be. In this study, stomatal morphology was significantly affected by different growth environments, and the shape of the stomata generally flattened with an increase in the ambient temperature. Thus, there were some differences in the correlations between stomatal density, stomatal area, and stomatal shape index under different underlying surface environments.

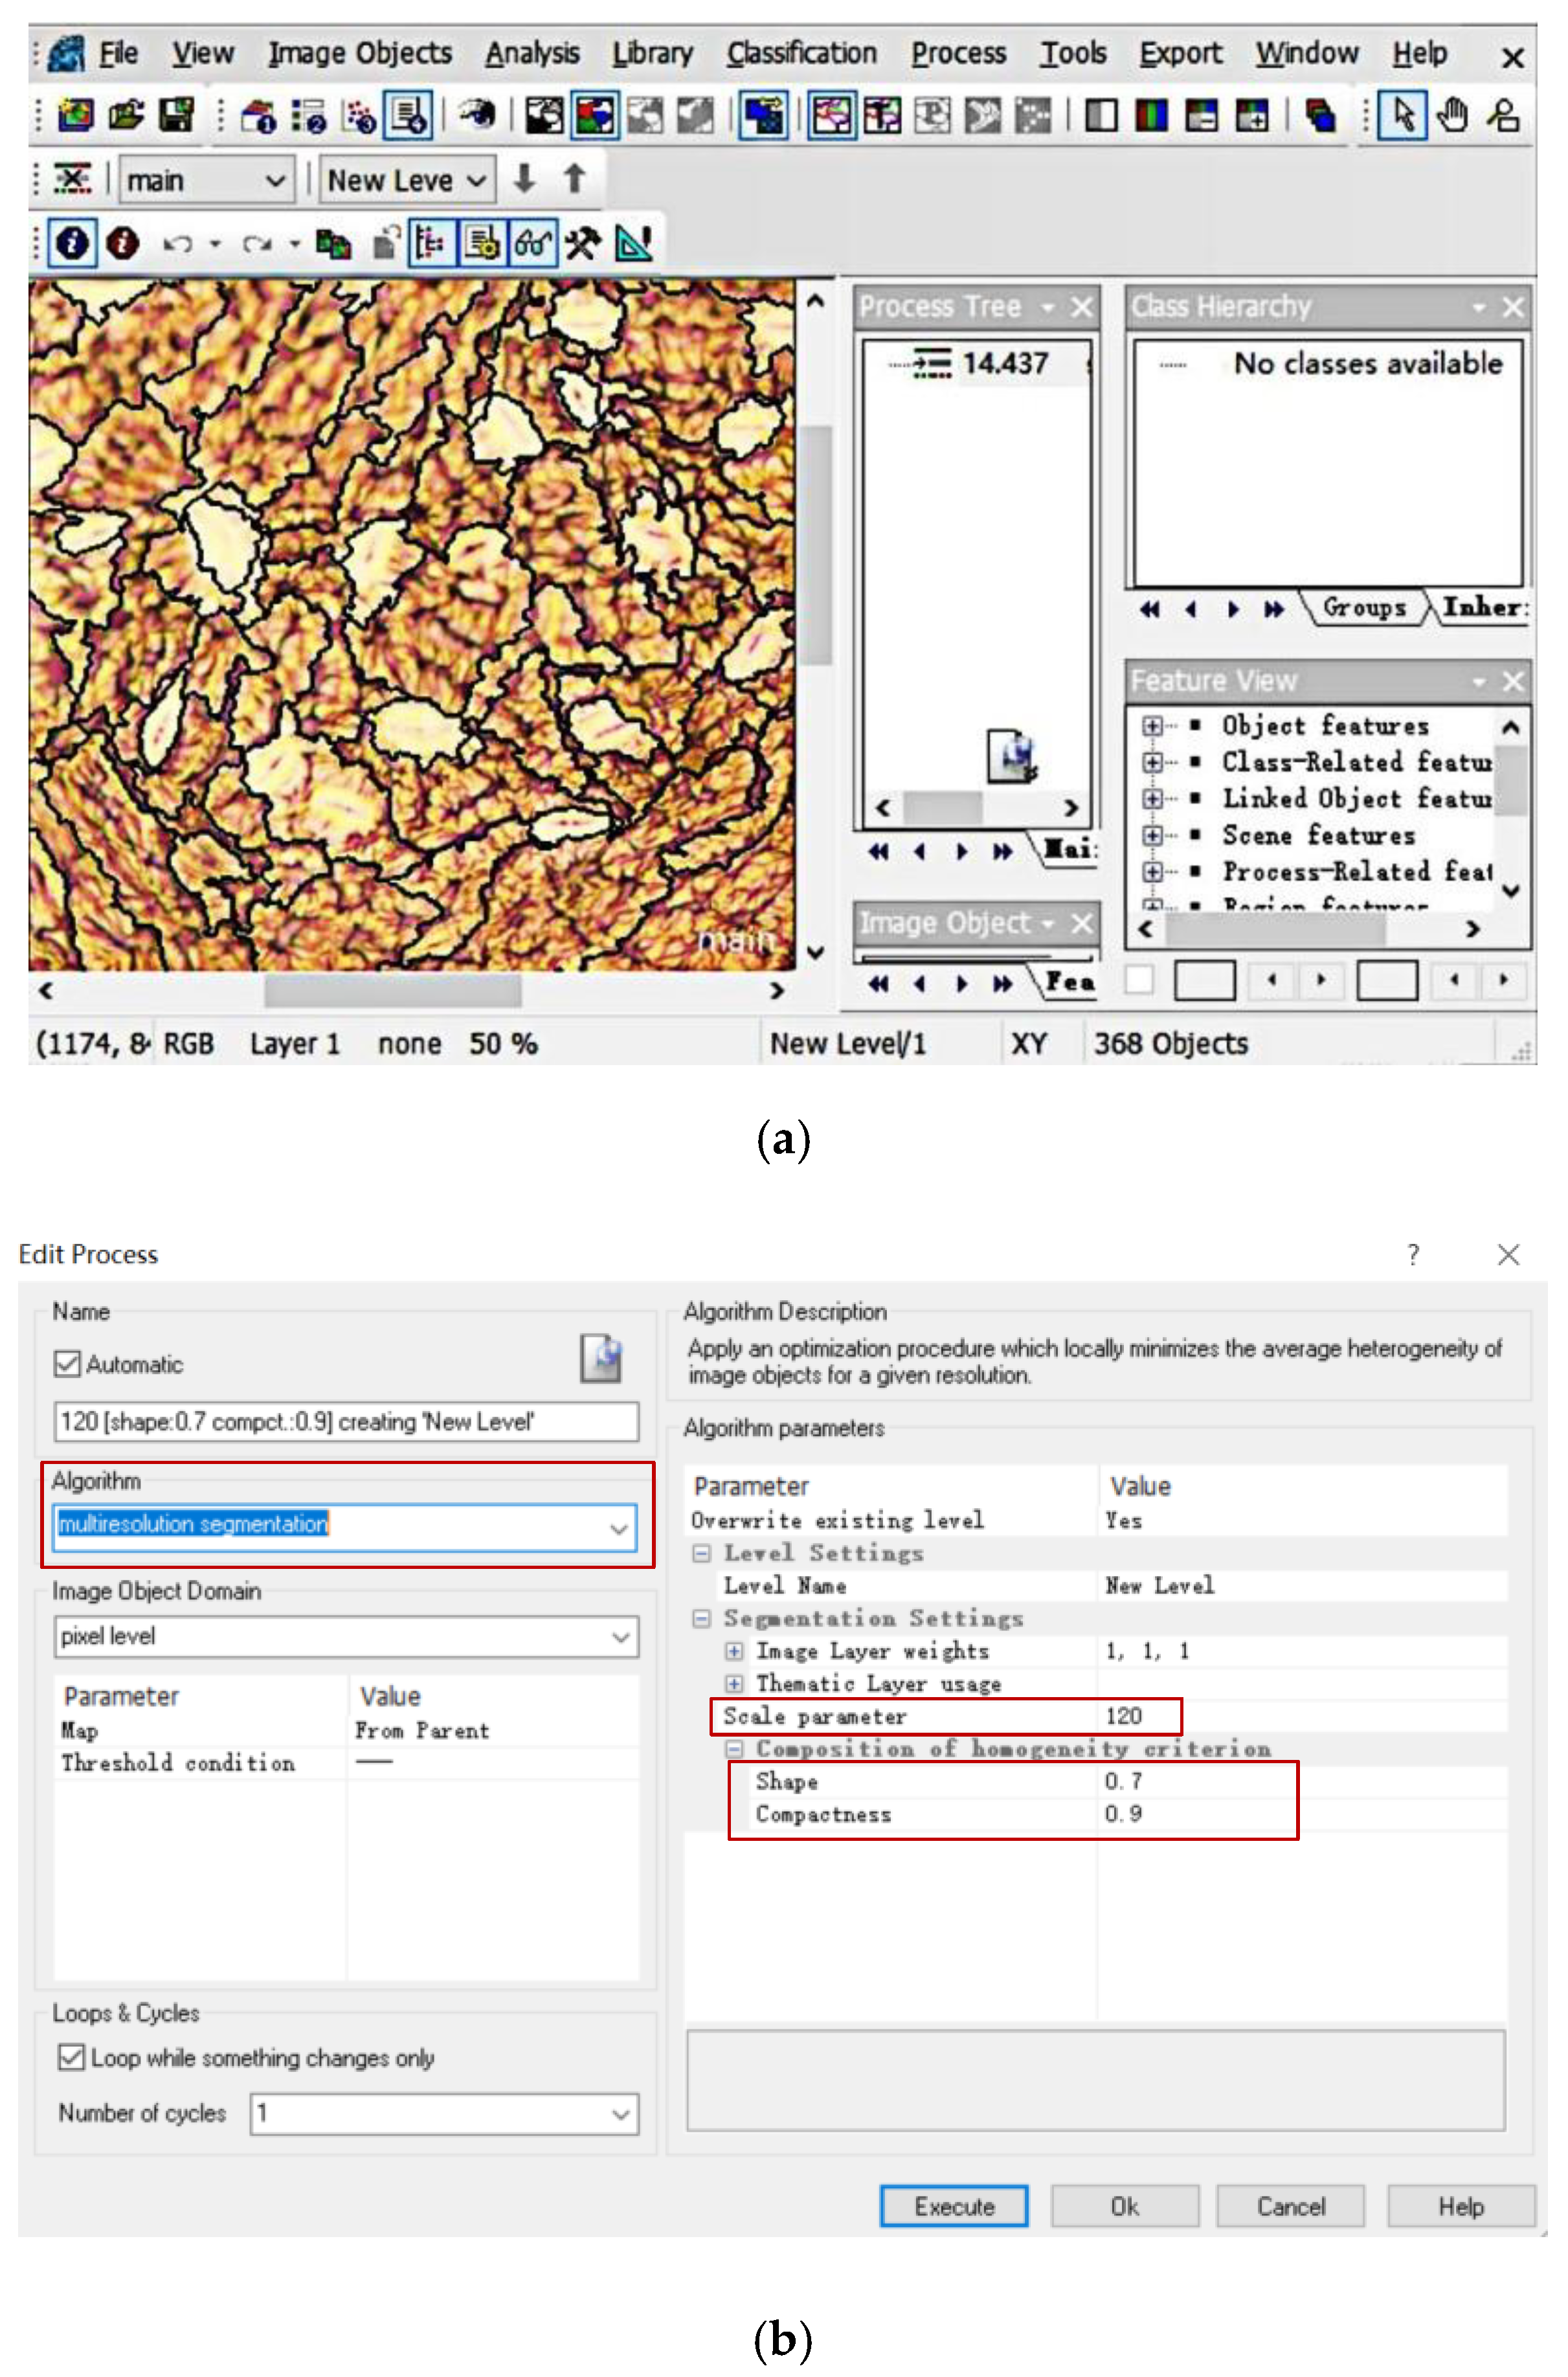
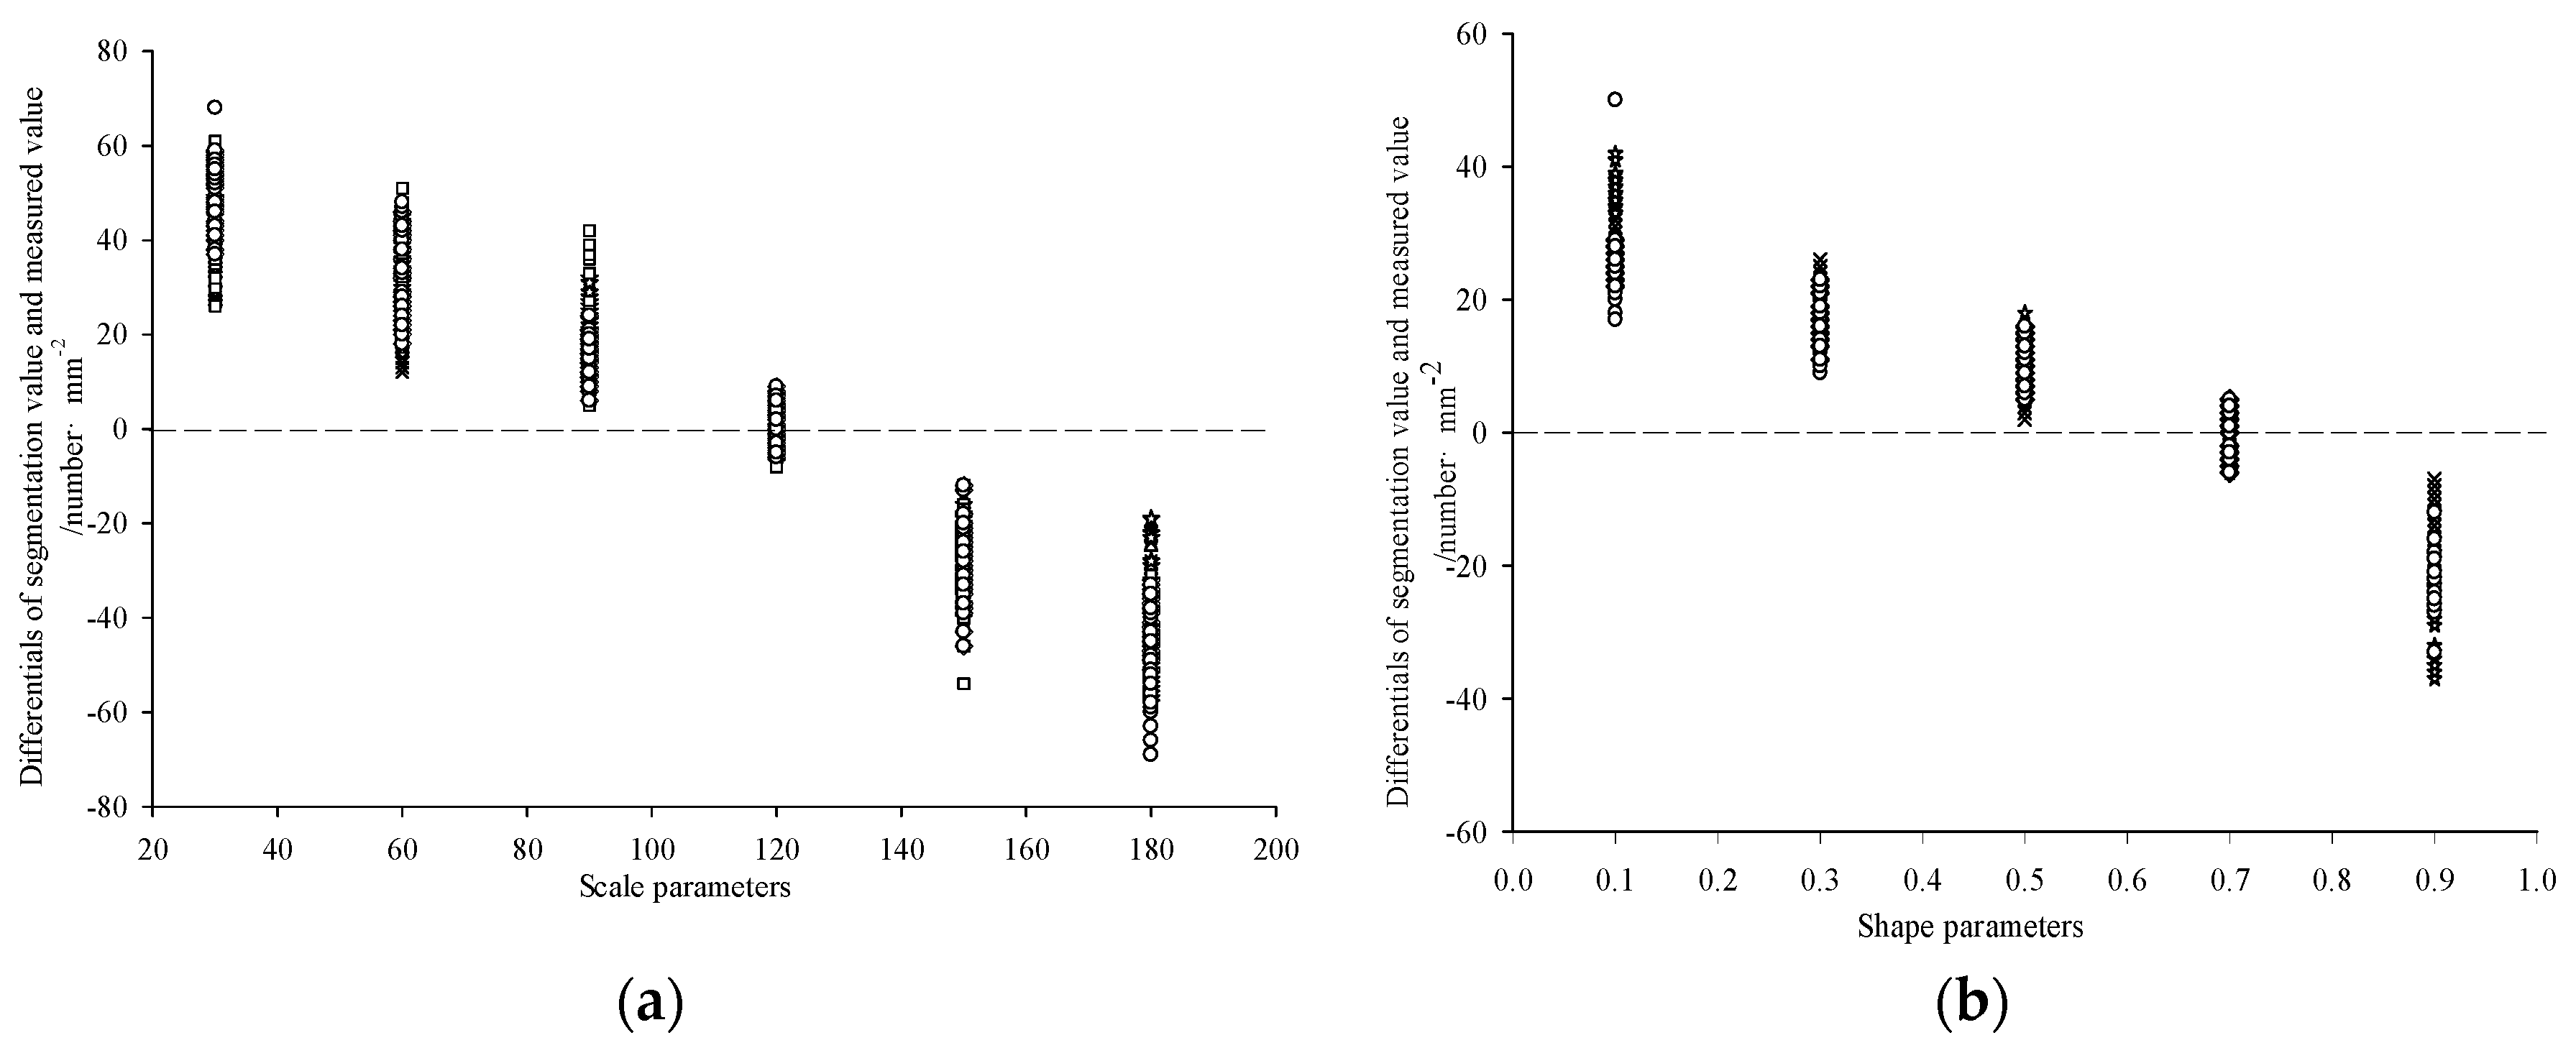
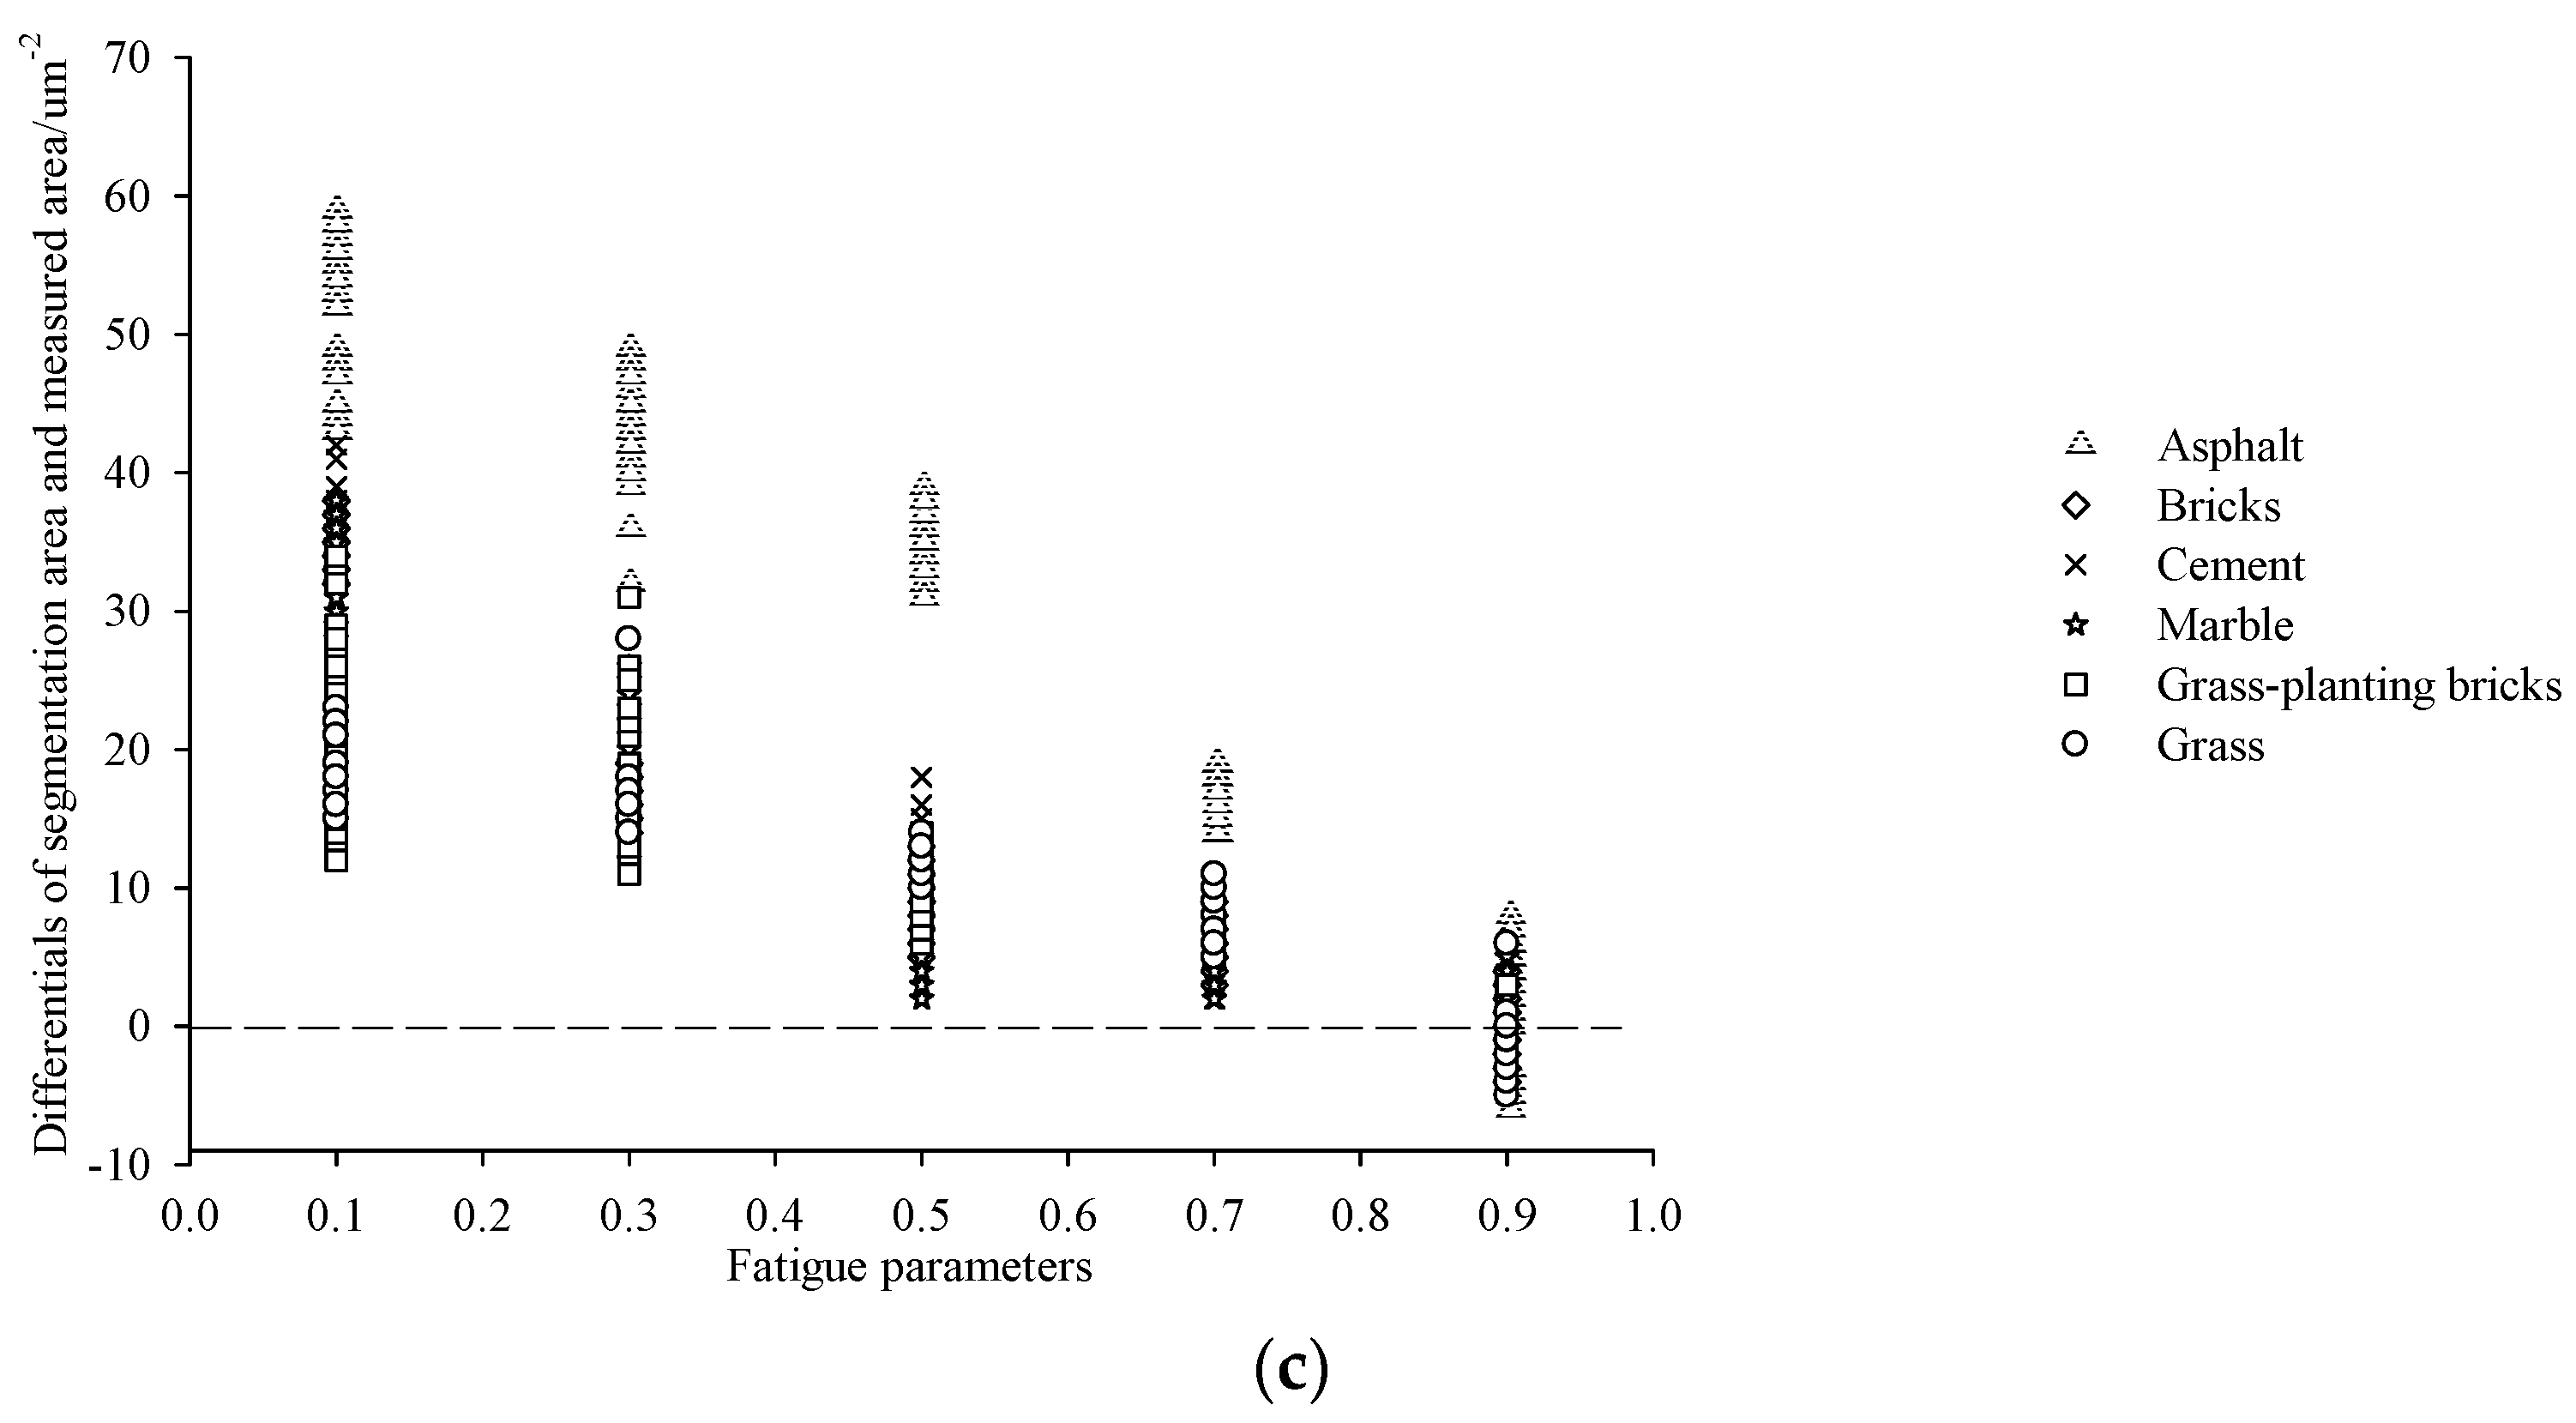
3.2. Image Optimal Segmentation Parameter Determination

Image segmentation is the first and most critical step in the object-oriented approach. Its quality directly affects the results of the postanalysis processing [32,36]. The most commonly used multiscale segmentation method was used here, which uses the least heterogeneous region merging algorithm to minimize the weight heterogeneity of the segmented image objects. When using this method, it was crucial to select the parameters for the segmentation result of the image. The quality of the segmentation mainly resulted in the degree of coincidence between the regional objects that were obtained after segmentation and the target to be acquired [37].
As shown in Table 2, the results of stomatal density and stomatal area interpretation between different segmentation parameters were significantly different (p < 0.01), but the difference in stomatal interpretation accuracy between the three tree species and the environment were not significant (p > 0.01). When the scale parameter was set to be too small, the stomata were divided and very fragmented. This made it difficult to distinguish between a stomatal structure and a nonstomatal structure. However, when the scale parameter was set to be too large, the stomata were divided very roughly. This also caused the stomata to not be completely separated. The results of microscopy examination showed that the automatic interpretation accuracy of the stomatal image did not show a linear relationship with the segmentation scale, but it showed that the error was the lowest on the same scale. According to the purpose of classification, this study repeatedly changed the parameters and found that when the segmentation scale was set to 120, the segmentation accuracy was the highest (Figure 4 and Figure 5).
In addition to the settings of scale parameter, the settings of the shape and compactness parameters are also important in image segmentation as they determine the accuracy of the image segmentation interface and the fit of the geometric segmentation [36,38]. The above segmentation parameter was chosen based on stomata and background outline in the image. Similarly, a ratio of smoothness to compactness weight is defined by emphasizing the discrete and compact nature of stomata. Usually, within a certain range, the coincidence degree of the stomatal boundary generally decreased first and then increased with an increase in the shape and the compactness parameters (Figure 4 and Figure 5). In the case where the scale parameters were consistent, if the compactness parameter was set to be too large or the shape parameter was set to be too small, this resulted in a very dense image segmentation interface. On the contrary, this strengthened the contribution of the object boundary to the image, resulting in a sparse interface.
By continuously adjusting the segmentation parameters, we found that the stomatal segmentation of the three tree species achieved the most ideal effect with the following conditions: scale parameter 120, shape parameter 0.7, and compactness parameter 0.9 (Figure 4 and Figure 5).

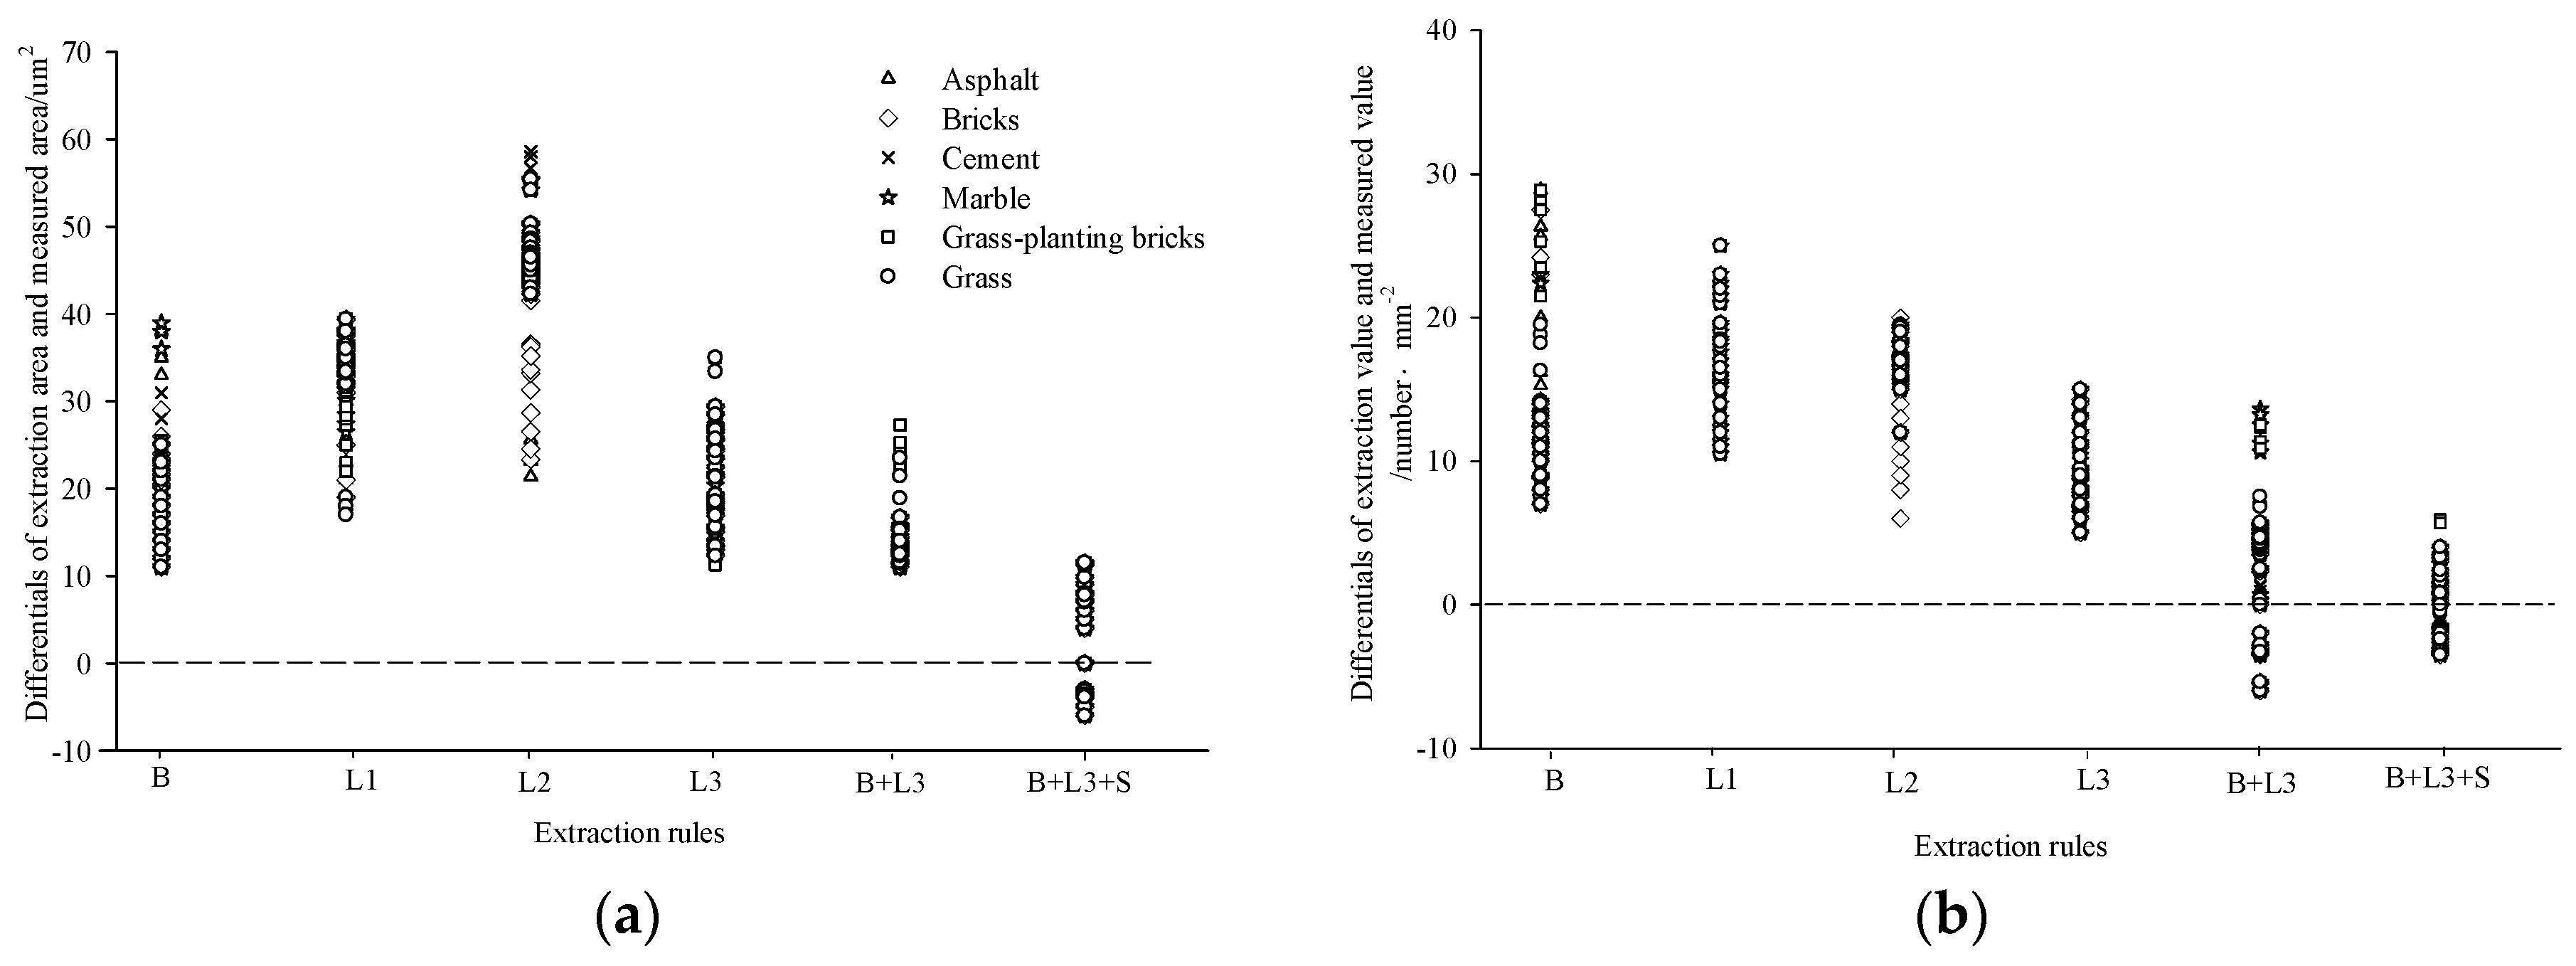
3.3. Stomatal Classification and Automatic Extraction of Image Interpretation Conditions

The stomatal micrograph contains a variety of features that can be used for classification. These features needed to be converted according to classification rules when extracting the stomata using eCognition software [39,40]. The splitting and merging process is controlled by similarity or dissimilarity measures, relying on a series of image feature combinations, e.g., brightness, texture, color, shape, or size. After the initial segmentation was completed, the typical features of the stomata were selected for extraction. The selection of features was based on the following considerations:
  • The stomata have special spectral characteristics, which can be clearly distinguished from the background structure.
  • The stomata have very regular traits and are generally elliptical in shape.
  • Due to their unique structure, the stomata are clearly different in brightness from the background in the image.
Based on the above characteristics, we used the above characteristic parameters of the stomata for classification. Here, we selected the brightness feature, spectral features, and shape features to construct a stomatal extraction knowledge base and converted these three features into the following three rules.

3.3.1. Brightness Rules

There was a significant difference in the brightness value of the stomatal extraction accuracy (p < 0.01) (Table 2). By comparing the multiband image with the selected area and adjusting this range until the coincidence accuracy was maximized, this range of threshold was then confirmed to be the stomatal identification rule. The objects classified within this threshold range were identified as stomata.
After many experiments, it was concluded that when the value of the stomatal brightness was set to 150–250, the stomata could be distinguished from the epidermal cells. However, there was still a phenomenon in which some of the stomatal boundaries did not coincide in this range (Table 3). Therefore, under this rule, the classification results still had some defects. In order to improve the accuracy, additional features needed to be added for further extraction.

3.3.2. Spectral Rules

Spectral characteristics have extremely significant differences in stomatal extraction accuracy (p < 0.01) (Table 2). By analyzing the segmentation properties of the stomatal image, most of the nonstomatal portions had a blue band (mean layer 1) value below 185, but some of the stomata were also within the range of the blue band mean, meaning the classification results of the blue band were not ideal. Similarly, the nonstomatal portion of the green band (mean layer 2) was below 185, but the stomatal green band value was between 160 and 250. Therefore, there was more overlap in this band, resulting in a larger classification error. The mean red band of the stomata (mean layer 3) was basically greater than 95, while the nonstomatal portion of the red band average was mostly below 95. Therefore, by setting the red band threshold to more than 95, the nonstomatal portion and stomatal portion could be separated (Table 3).

3.3.3. Shape Rules

The shape characteristics showed significant differences in the accuracy of stomatal extraction (p < 0.05) (Table 2). As the contrast between the brightness and the band of the image could not completely separate the stomata from the background, this led to the phenomenon of leakage and misclassification. In order to remove nonstomatal parts, all of the objects were combined in the stomatal category to make the characteristics of the stomatal objects more visible. The shape of stomata is elliptical, and the image was further extracted in accordance with the density characteristics (shape–density) in the shape rule. After extensive trials, nonstomata could be largely removed under the density range of 1.5–2.2, and most of the combined stomata remained intact (Table 3).
Through the reasonable combination of the brightness, spectral, and shape rules, the accuracy of the extraction was gradually improved (Figure 6 and Figure 7). After continuously adjusting the parameters of these three rules, the best rule combination of the stomatal classification extraction was as follows: brightness value 160–220, red light band >95, and shape–density index of 1.5–2.2.

3.4. Interpretation of Stomatal Density and Stomatal Area and an Estimation of Its Accuracy

In accordance with the obtained optimal parameters and the classification rule thresholds, 60 images were selected for each tree species for inspection. Although the stomatal densities and the stomatal areas of the three tree species varied greatly over different growth environments, the stomatal density and stomatal area accuracies calculated by this method were 99.2% and 94.5%, respectively (Table 4). At the same time, the interpretation accuracy was not different between the tree species and the environment (Table 5). This shows that it is ideal to obtain the stomatal information of the blade using the object-oriented classification method by reasonably setting the interpretation condition parameters. This method could be applied for quick calculation of the stomatal density and the stomatal area.

4. Discussion

4.1. Stomatal Extraction

With the increasing maturity of forestry remote sensing technology and the diversification of information detection and estimation methods, it is necessary to apply this technology to forestry scientific research and production [43,44]. eCognition is an important software in remote sensing classification technology, which is generally applied to large-scale remote sensing image analysis [45]. However, this method is rarely used in small-scale research, especially in the extraction of stomatal, which has not been reported. Therefore, in this study, we assumed that the microscopic image of the stomata could utilize its unique features to achieve classification and extraction of objects using remote sensing techniques. Based on the sensitive behavior of the leaf stomata to the external environment, we selected three common green trees with different leaf textures and leaf size growing in six typical urban environments for sampling to verify whether the method was applicable to different tree species and different stomata conditions. In this research, it was applied to the stomatal extraction of plant leaves, and the extraction results were very satisfactory, although there were large differences in developmental characteristics such as stomatal density, stomatal area, and stomatal shape under different growth environments. The optimal parameters of the stomatal segmentation that were obtained by this method and the automatic extraction rule combinations were: scale parameter 120–125, shape parameter 0.7, compactness parameter 0.9, brightness value 160–220, red light band >95, and shape–density index 1.5–2.2. The results showed that the estimation results of leaf stomatal density and stomatal area were very satisfactory, with overall extraction accuracy of 99.2% and 94.5%, respectively. This method can be used to obtain stomatal characterization information in large quantities, which lays a foundation for further research on stomatal characteristics in the future.
The key to the object-oriented classification methods based on eCognition is the determination of segmentation parameters and the establishment of extraction rules so as to improve the accuracy and the consistency of segmentation [45,46]. When applying this method to extract stomata, there are some problems that may affect the accuracy of the extraction. Differences in leaf characteristics of different tree species, such as leaf fluff being produced by some plants, may cause problems with stomata being masked. This may reduce the accuracy of the automatic extraction of stomatal features. Therefore, in order to improve the accuracy of the automatic interpretation results, we should pay attention to the following issues. First, the blade should be fastened during the process of making the color slide so that the stomatal shape can be maintained in the test state. Second, the fluff and impurities on the leaf surface must be removed as much as possible. The most important thing is to ensure that the imprinting solution is evenly applied during the imprinting process so as to avoid uneven brightness that will affect the extraction precision.
It has been verified that the object-oriented classification method has no significant differences in the leaf stomatal extraction results for different habitats and different tree species. The interpretation threshold derived from this method is applicable to most woody plants. Compared to the traditional method, it greatly improves the efficiency of the classification and extraction of stomatal features, which is of great significance for the extraction of stomatal classification. However, due to the limited scope of research and the limited samples, the application of stomatal characteristics in herbaceous plants needs further study. A larger and more comprehensive sample library should be established in future research work, making this method a better training sample in the field of herbs.

4.2. The Trade-Off Strategy of Stomatal Morphology under Urban Environment

With urbanization comes prosperity and progress, but it also brings many environmental, economic, and social problems [47,48]. In particular, urbanization has changed the surface cover, and natural vegetation has been replaced by large-scale artificial impervious surfaces [49,50,51]. Increased impervious surfaces and reduced vegetation have profound effects on biogeochemical cycles, hydrological processes, climate change, and biodiversity at regional and global scales. As the basic physical quantity of the energy balance of the geogas system, surface temperature has become a common indicator for urban thermal environment research [50,52]. Compared to the atmospheric temperature, the surface temperature has higher spatial and temporal differentiation on the urban scale, and it is more strongly affected by the underlying surface coverage and by human activities [52]. In the context of global warming and high-temperature heat waves, this means that the environmental characteristics of the urban underlying surfaces and their relationship with urban thermal environment need to be understood. This is of great significance for the scientific planning of cities, the restoration of eco-city systems, and improvement in the livability of cities. As one of the stomatal parameters, stomatal density is very sensitive to changes in environmental factors such as CO2 concentration, temperature, precipitation, and illumination [53,54,55]. In this study, the results showed that stomatal density was lower in the high temperature environments than in the low temperature environments, a result that is basically consistent with many studies [56,57]. Under such circumstances, the water dispersion of plants is significantly enhanced. Plants have certain responsiveness and adaptation strategies to climate change, and they have formed a self-regulating mechanism in the long evolutionary process, which can adapt to the changing environment through their own morphological changes and physiological reactions. Several findings are worth noting. Firstly, plants prevent high temperatures from damaging their photosynthetic reaction sites by reducing the stomatal area as part of a protective strategy to control the entrance or exit of gases through the blade [58]. Secondly, we found that the stomatal shape index increased significantly in the high temperature environment, which indicated that the stomatal shape tended to flatten. Relative to the circular stomata, the flat shape of the stomata are more conducive to the adjustment of the stomata opening degree, which may be one of the ecological strategies for plants to reduce water dispersion within the plant. Similar findings have been reported showing stomatal density to be significantly different in the hardened surface environment, which may be related to the difference in the thermal environment effect caused by the hardened surface [59,60]. In this study, the specific performance of the plant adjusted to the stomatal density, stomatal area, and stomatal shape index in order to adapt to changes in the environment. However, the cause of the change in stomatal characteristics may be the result of the interaction of complex urban environments, and the factors that specifically affect their changes need further study.

5. Conclusions

In this study, the object-oriented method of eCognition software was used to extract the stomata of plant leaves, and the effects of high temperature environment on stomatal characteristics were studied for different underlying surface environments. The following conclusions were obtained:
  • When eCognition object-oriented classification techniques were applied to the stomatal extraction of plant leaves, the estimation accuracy of the stomatal density and the stomatal area of the blade reached 99.2% and 94.5%, respectively. This method can be used to obtain stomatal characterization information in large quantities, which lays the foundation for further research on stomatal characteristics in the future. The optimal parameters and extraction rules obtained for stomatal splitting were as follows: scale parameter 120–125, shape parameter 0.7, compactness parameter 0.9, brightness value 160–220, red band >95, and shape–density index 1.5–2.2. These are generally applicable to the extraction of most plant stomata.
  • In the high temperature environment of the city, as the temperature increased, the plant stomatal density and its shape index increased, but the stomatal area decreased significantly. There was a regulating behavior between stomatal area, stomatal density, and stomatal shape index under different environments, which might be an ecological trade-off strategy for plants to adapt to a particular growing environment.

Author Contributions

J.Z. conceived and designed the study. J.Z., Q.Y., J.L., and C.X. contributed materials and tools. J.Z., Q.Y., and G.Q. performed the experiments. J.Z. contributed to data analysis and paper preparation.

Funding

This research is supported by “Major project of forestry public welfare industry of China (NO. 20140430102)”.

Acknowledgments

The English in this document has been checked by at least two professional editors; both were native speakers of English.

Conflicts of Interest

The authors declare no conflict of interest. The founding sponsors had no role in the design of the study; in the collection, analyses, or interpretation of data; in the writing of the manuscript, and in the decision to publish the results.

References

  1. Royer, D.L. Stomatal density and stomatal index as indicators of paleoatmospheric CO2 concentration. Rev. Palaeobot. Palynol. 2001, 114, 1–28. [Google Scholar] [CrossRef]
  2. Sugano, S.S.; Shimada, T.; Imai, Y.; Okawa, K.; Tamai, A.; Mori, M.; Hara-Nishimura, L. Stomagen positively regulates stomatal density in arabidopsis. Nature 2010, 463, 241. [Google Scholar] [CrossRef] [PubMed] [Green Version]
  3. Berger, D.; Altmann, T. Subtilisin-like serine protease involved in the regulation of stomatal density and distribution in Arabidopsis thaliana. Genes Dev. 2000, 14, 1119–1131. [Google Scholar] [PubMed]
  4. Delporte, F.; Mostade, O.; Jacquemin, J.M. Plant regeneration through callus initiation from thin mature embryo fragments of wheat. Plant Cell Tissue Organ Cult. 2001, 67, 73–80. [Google Scholar] [CrossRef]
  5. Masterson, J. Stomatal size in fossil plants: Evidence for polyploidy in majority of angiosperms. Science 1994, 264, 421. [Google Scholar] [CrossRef] [PubMed]
  6. Huang, Z.; Xu, C.; Li, Y.; Wang, P.Q.; Li, Y.K.; Xiang, Y. Induction of somatic embryogenesis by anther-derived callus culture and plantlet ploidy determination in poplar (Populus × beijingensis). Plant Cell Tissue Organ Cult. 2015, 120, 949–959. [Google Scholar] [CrossRef]
  7. Flexas, J.; Medrano, H. Drought-inhibition of photosynthesis in C3 plants: Stomatal and non-stomatal limitations revisited. Ann. Bot. 2002, 89, 183–189. [Google Scholar] [CrossRef] [PubMed]
  8. Lawson, T.; Blatt, M.R. Stomatal size, speed, and responsiveness impact on photosynthesis and water use efficiency. Plant Physiol. 2014, 164, 1556–1570. [Google Scholar] [CrossRef] [PubMed]
  9. Flexas, J.; Bota, J.; Escalona, J.M.; Sampol, B.; Medrano, H. Effects of drought on photosynthesis in grapevines under field conditions: An evaluation of stomatal and mesophyll limitations. Funct. Plant Biol. 2002, 29, 461–471. [Google Scholar] [CrossRef]
  10. Chen, Z.C.; Feng, J.X.; Wan, X.C. Stomatal behaviours of aspen (Populus tremuloides) plants in response to low root temperature in Hydroponics. Russ. J. Plant Physiol. 2018, 65, 512–517. [Google Scholar] [CrossRef]
  11. Yun, S.C.; Laurence, J.A. The response of clones of Populus tremuloides differing in sensitivity to ozone in the field. New Phytol. 1999, 141, 411–421. [Google Scholar] [CrossRef]
  12. Boer, H.J.D.; Price, C.A.; Wagner-Cremer, F.; Dekker, S.C.; Franks, P.J.; Veneklaas, E.J. Optimal allocation of leaf epidermal area for gas exchange. New Phytol. 2016, 210, 1219–1228. [Google Scholar] [CrossRef] [PubMed] [Green Version]
  13. Paudel, I.; Halpern, M.; Wagner, Y.; Raveh, E.; Yermiyahu, U.; Hoch, G.; Klein, T. Elevated CO2, compensates for drought effects in lemon saplings via stomatal down regulation, increased soil moisture, and increased wood carbon storage. Environ. Exp. Bot. 2018, 148, 117–127. [Google Scholar] [CrossRef]
  14. Zheng, Y.P.; Ming, X.U.; Wang, J.S.; Qin, S.; Wang, H.X. Responses of the stomatal traits and gas exchange of Maize leaves to climate warming. Acta Agron. Sin. 2015, 41, 601. [Google Scholar] [CrossRef]
  15. Panteris, E.; Galatis, B.; Quader, H.; Apostolakos, P. Cortical actin filament organization in developing and functioning stomatal complexes of Zea mays and Triticum turgidum. Cytoskeleton 2007, 64, 531. [Google Scholar] [CrossRef] [PubMed]
  16. Xu, M. The optimal atmospheric CO2 concentration for the growth of winter wheat (Triticum aestivum). J. Plant Physiol. 2015, 184, 89–97. [Google Scholar] [CrossRef] [PubMed]
  17. Kato, Y.; Okami, M. Root growth dynamics and stomatal behaviour of rice (Oryza sativa L.) grown under aerobic and flooded conditions. Field Crops Res. 2010, 117, 9–17. [Google Scholar] [CrossRef]
  18. Montserrat-Martí, G.; Camarero, J.J.; Palacio, S.; Pérez-Rontomé, C.; Milla, R.; Albuixech, J.; Maestro, M. Summer-drought constrains the phenology and growth of two co-existing Mediterranean oaks with contrasting leaf habit: Implications for their persistence and reproduction. Trees 2009, 23, 787–799. [Google Scholar] [CrossRef] [Green Version]
  19. Cochard, H.; Breda, N.; Granier, A. Whole tree hydraulic conductance and water loss regulation in Quercus during drought: Evidence for stomatal control of embolism? Ann. For. Sci. 1996, 53, 197–206. [Google Scholar] [CrossRef]
  20. Jones, H.G. Use of infrared thermometry for estimation of stomatal conductance as a possible aid to irrigation scheduling. Agric. For. Meteorol. 1999, 95, 139–149. [Google Scholar] [CrossRef]
  21. Jones, H.G.; Stoll, M.; Santos, T.; Sousa, C.D.; Chaves, M.M.; Grant, O.M. Use of infrared thermography for monitoring stomatal closure in the field: Application to grapevine. J. Exp. Bot. 2002, 53, 2249–2260. [Google Scholar] [CrossRef] [PubMed]
  22. Guilioni, L.; Jones, H.G.; Leinonen, I.; Lhomme, J.P. On the relationships between stomatal resistance and leaf temperatures in thermography. Agric. For. Meteorol. 2008, 148, 1908–1912. [Google Scholar] [CrossRef]
  23. Ghassemian, H.; Landgrebe, D.A. Object-oriented feature extraction method for image data compaction. IEEE Control Syst. Mag. 2002, 8, 42–48. [Google Scholar] [CrossRef]
  24. Niu, C.Y.; Jiang, W.S.; Huang, X.F.; Xie, J.F. Analysis and comparison between two object-oriented information extraction software of feature analyst and ecognition. Remote Sens. Inf. 2007, 43, 66–70. [Google Scholar]
  25. Anheier, H.K.; Gerhards, J.; Romo, F.P. Forms of capital and social structure in cultural fields: Examining Bourdieu’s social topography. Am. J. Sociol. 1995, 100, 859–903. [Google Scholar] [CrossRef]
  26. Lopez, O.R.; Farrislopez, K.; Montgomery, R.A.; Givnish, T.J. Leaf phenology in relation to canopy closure in southern Appalachian trees. Am. J. Bot. 2008, 95, 1395–1407. [Google Scholar] [CrossRef] [PubMed] [Green Version]
  27. Yu, M.H.; Ding, G.D.; Gao, G.L.; Zhao, Y.Y.; Sai, K. Leaf temperature fluctuations of typical psammophytic plants and their application to stomatal conductance estimation. Forests 2018, 9, 313. [Google Scholar] [CrossRef]
  28. Elisabet, M.S.; Lizeth, K.; Vásconez, N.; Hannes, S.; Isabel, D.L.; Annette, M. Responses of contrasting tree functional types to air warming and drought. Forests 2017, 8, 450. [Google Scholar]
  29. Garnier, E.; Berger, A. The influence of drought on stomatal conductance and water potential of peach trees growing in the field. Sci. Hortic. 1987, 32, 249–263. [Google Scholar] [CrossRef]
  30. Alkhudhairy, D.H.A.; Caravaggi, I.; Giada, S. Structural damage assessments from Ikonos data using change detection, object-oriented segmentation, and classification techniques. Photogramm. Eng. Remote Sens. 2005, 71, 825–838. [Google Scholar] [CrossRef]
  31. Liu, W.; Wang, C.H.; Zhao, E.P.; Du, H.J. Extraction of small river information based on object-oriented classification. Trans. Chin. Soc. Agric. Eng. 2014, 45, 237–244. [Google Scholar]
  32. Jian, S.Q.; Zhao, C.Y.; Zhao, Y.; Peng, S.Z.; Peng, H.H. Based on image processing technology estimatingleaves stomatal density of Populus euphratica and analysis of its ecological significance. Acta Ecol. Sin. 2011, 31, 4818–4825. [Google Scholar]
  33. Maimaitijiang, M.; Alimujiang, K. Study on land surface characteristics and its relationship with land surface thermal environment of typical city in arid region. Ecol. Environ. Sci. 2015, 24, 1865–1871. [Google Scholar]
  34. Rogiers, S.Y.; Hardie, W.J.; Smith, J.P. Stomatal density of grapevine leaves (Vitis vinifera, L.) responds to soil temperature and atmospheric carbon dioxide. Austr. J. Grape Wine Res. 2011, 17, 147–152. [Google Scholar] [CrossRef]
  35. Shpak, E.D.; Mcabee, J.M.; Pillitteri, L.J.; Torii, K.U. Stomatal patterning and differentiation by synergistic interactions of receptor kinases. Science 2005, 309, 290–293. [Google Scholar] [CrossRef] [PubMed]
  36. Pillitteri, L.J.; Sloan, D.B.; Bogenschutz, N.L.; Torii, K.U. Termination of asymmetric cell division and differentiation of stomata. Nature 2007, 445, 501–505. [Google Scholar] [CrossRef] [PubMed]
  37. Irvine, J.; Perks, M.P.; Magnani, F.; Grace, J. The response of Pinus sylvestris to drought: Stomatal control of transpiration and hydraulic conductance. Tree Physiol. 1998, 18, 393–402. [Google Scholar] [CrossRef] [PubMed]
  38. Klein, T. The variability of stomatal sensitivity to leaf water potential across tree species indicates a continuum between isohydric and anisohydric behaviours. Funct. Ecol. 2014, 28, 1313–1320. [Google Scholar] [CrossRef] [Green Version]
  39. Martínez-Vilalta, J.; Garcia-Forner, N. Water potential regulation, stomatal behaviour and hydraulic transport under drought: Deconstructing the ISO/anisohydric concept. Plant. Cell Environ. 2016, 40, 962–976. [Google Scholar] [CrossRef] [PubMed]
  40. Wheeler, J.K.; Huggett, B.A.; Tofte, A.N.; Rockwell, F.E.; Holbrook, N.M. Cutting xylem under tensionor supersaturated with gas can generate PLC and the appearance of rapid recovery from embolism. Plant Cell Environ. 2013, 36, 1938–1949. [Google Scholar] [PubMed]
  41. Pierce, S.; Cerabolini, B.E.L. Allocating CSR plant functional types: The use of leaf economics and size traits to classify woody and herbaceous vascular plants. Funct. Ecol. 2013, 27, 1002–1010. [Google Scholar] [CrossRef]
  42. Pierce, S.; Bottinelli, A.; Bassani, I.; Ceriani, R.M.; Cerabolini, B.E.L. How well do seed production traits correlate with leaf traits, whole plant traits and plant ecological strategies? Plant Ecol. 2014, 215, 1351–1359. [Google Scholar] [CrossRef]
  43. Phonphan, W.; Diep, N.T.H.; Korsem, T. Determination aquaculture area in Thanh Phu District, Ben Tre Province, Vietnam using remote sensing technology. J. Comput. Theor. Nanosci. 2018, 24, 5355–5358. [Google Scholar] [CrossRef]
  44. Wang, C.; He, H.S.; Kabrick, J.M. A remote sensing-assisted risk rating study to predict oak decline and recovery in the Missouri Ozark highlands, USA. GISci. Remote Sens. 2008, 45, 406–425. [Google Scholar] [CrossRef]
  45. Benz, U.C.; Hofmann, P.; Willhauck, G.; Lingenfelder, I.; Heynen, M. Multi-resolution, object-oriented fuzzy analysis of remote sensing data for GIS-ready information. ISPRS J. Photogramm. Remote Sens. 2004, 58, 239–258. [Google Scholar] [CrossRef] [Green Version]
  46. Hu, Q.; Wu, W.; Xia, T.; Yu, Q.; Yang, P.; Li, Z.; Song, Q. Exploring the use of google earth imagery and object-based methods in land use/cover mapping. Remote Sens. 2013, 5, 6026–6042. [Google Scholar] [CrossRef]
  47. Swyngedouw, E.; Moulaert, F.; Rodriguez, A. Neoliberal urbanization in Europe: Large-scale urban development projects and the new urban policy. Antipode 2002, 34, 542–577. [Google Scholar] [CrossRef]
  48. Yan, P.; Yang, J. Species diversity of urban forests in China. Urban For. Urban Green. 2017, 28, 160–166. [Google Scholar] [CrossRef]
  49. Iijima, H.; Shibuya, M.; Saito, H. Effects of surface and light conditions of fallen logs on the emergence and survival of coniferous seedlings and saplings. J. For. Res. 2007, 12, 262–269. [Google Scholar] [CrossRef] [Green Version]
  50. Sharpe, D.M.; Stearns, F.; Leitner, L.A.; Dorney, J.R. Fate of natural vegetation during urban development of rural landscapes in Southeastern Wisconsin. Urban Ecol. 1986, 9, 267–287. [Google Scholar] [CrossRef]
  51. Magle, S.B.; Crooks, K.R. Interactions between black-tailed prairie dogs (Cynomys ludovicianus) and vegetation in habitat fragmented by urbanization. J. Arid Environ. 2008, 72, 238–246. [Google Scholar] [CrossRef]
  52. Hart, M.A.; Sailor, D.J. Quantifying the influence of land-use and surface characteristics on spatial variability in the urban heat island. Theor. Appl. Climatol. 2008, 95, 397–406. [Google Scholar] [CrossRef]
  53. Imhoff, M.L.; Zhang, P.; Wolfe, R.E.; Bounoua, L. Remote sensing of the urban heat island effect across biomes in the continental USA. Remote. Sens. Environ. 2010, 114, 504–513. [Google Scholar] [CrossRef] [Green Version]
  54. Linden, J. Nocturnal cool island in the Sahelian city of Ouagadougou, Burkina Faso. Int. J. Climatol. 2010, 31, 605–620. [Google Scholar] [CrossRef]
  55. Abrams, M.D.; Mostoller, S.A. Gas-exchange, leaf structure and nitrogen in contrasting successional tree species growing in open and understory sites during a drought. Tree Physiol. 1995, 15, 361–370. [Google Scholar] [CrossRef] [PubMed]
  56. Yano, K. Stomatal density of cowpea correlates with carbon isotope discrimination in different phosphorus, water and CO2 environments. New Phytol. 2008, 179, 799–807. [Google Scholar]
  57. Khazaei, H.; Street, K.; Santanen, A.; Bari, A.; Stoddard, F.L. Do faba bean (Vicia faba L.) accessions from environments with contrasting seasonal moisture availabilities differ in stomatal characteristics and related traits? Genet. Resour. Crop Evol. 2013, 60, 2343–2357. [Google Scholar] [CrossRef]
  58. Collatz, G.J.; Ball, J.T.; Grivet, C.; Berry, J.A. Pysiological and environmental regulation of stomatal conductance, photosyntesis and transpiration: A model that includes a laminal boundary layer. Agric. For. Meteorol. 1991, 54, 107–136. [Google Scholar] [CrossRef]
  59. Orsini, F.; Alnayef, M.; Bona, S.; Maggio, A.; Gianquinto, G. Low stomatal density and reduced transpiration facilitate strawberry adaptation to salinity. Environ. Exp. Bot. 2012, 81, 1–10. [Google Scholar] [CrossRef]
  60. Smith, W.K. Temperatures of desert plants: Another perspective on the adaptability of leaf size. Science 1978, 201, 614–616. [Google Scholar] [CrossRef] [PubMed]
Figure 1. Flow chart of stomatal extraction on the basis of eCognition.
Forests 09 00616 g001
Figure 2. Surface temperature of the urban underlying surface environment. (a) Different underlying surface temperatures; (b) daily changes in surface temperature.
Forests 09 00616 g002
Figure 3. Stomatal characteristics under six urban underlying surface environments. (ac) Refers to stomatal density, stomatal area and stomatal shape index under different underlying surface types.
Forests 09 00616 g003aForests 09 00616 g003b
Figure 4. Object-oriented classification extraction process interface. (a) Total interface; (b) split parameter setting interface.
Forests 09 00616 g004
Figure 5. Scatter plot of the d-values between the multiscale segmentation and the measured density. (a) Scale parameters; (b) shape parameters; (c) fatigue parameters.
Forests 09 00616 g005aForests 09 00616 g005b
Figure 6. Scatter plot of stomatal division accuracy. B: brightness, L1: layer 1, L2: layer 2, L3: layer 3, S: shape. (a) Accuracy of stomatal area extraction under different rules, (b) Accuracy of stomatal density extraction under different rules.
Forests 09 00616 g006
Figure 7. Segmented and extracted process of a stomatal image. (ac) Partitioning scales of 30, 180, and 120; (d) shape parameter 0.1 and compactness parameter 0.9; (e) shape parameter 0.9 and compactness parameter 0.1; (f) shape parameter 0.7 and compactness parameter 0.9. (gl) Brightness characteristics: blue band, green band, red band, brightness value + red band, brightness value + red band + shape feature (Ailanthus altissima used as an example).
Forests 09 00616 g007
Table 1. Leaf traits of three tree species.
Tree SpeciesTree Age/aTree Height/mDiameter/cmLeaf Area/cm2TextureLeaf Hair
Fraxinus pennsylvanica Marshall1810.8 ± 2.6a18.6 ± 3.5a24.637 ± 1.432bCoriaceousSmooth
Ailanthus altissima (Mill.) Swingle1810.5 ± 2.3a17.0 ± 2.7a45.017 ± 5.230aThin coriaceousRough
Sophora japonica (L.) Schott1811.4 ± 2.0a17.5 ± 3.3a11.134 ± 2.005cPaperyHair cover
Different lowercase letters mean extremely significant differences at p < 0.05 level, the same as below.
Table 2. Differences in the interpretation results of the stomatal images based on segmentation parameters and extraction rules.
Source of VariationInterparametersInterenvironmentInterspecies
FpFpFp
Interpretation accuracySplit parameters24.0650.000115.2240.687324.0920.3150
Brightness characteristic65.2040.001527.9210.802515.6770.4437
Spectrum characteristic35.4710.004754.9370.077233.3210.3245
Shape characteristic7.0940.00012.0030.058418.2630.9220
Note: The interpretation accuracy is the d-value between the eCognition automatic interpretation value and the microscopy examination.
Table 3. Classification object feature threshold range.
ObjectBrightnessSpectralShape
Layer 1Layer 2Layer 3
Stomatal150–250>170160–250>951.5–2.2
Nonstomatal>200<185<185<95<1.5
Table 4. Accuracy of stomatal extraction.
Trees SpeciesStomatal Density/(number·mm−2)Stomatal Area/μm2
Extraction ValueMeasured ValueDifferenceAccuracyExtraction ValueMeasured ValueDifferenceAccuracy
Ailanthus altissima179 ± 9179 ± 70 ± 2100.0341 ± 15.7331 ± 22.410.5 ± 1.397.1
Fraxinus pennsylvanica284 ± 6285 ± 71 ± 199.5185 ± 16.4196 ± 19.611.1 ± 2.694.5
Sophora japonica247 ± 10249 ± 92 ± 199.2310 ± 21.5318 ± 21.28.4 ± 3.297.5
Table 5. Variance analysis of extraction and measured value deduction.
Stomatal DensityStomatal Area
SquaresdfM.s.FSig.SquaresdfM.s.FSig.
Inter-environment0.00310.0030.0050.9280.31610.2551.6090.211
Inter-species2.72721.4332.1950.1180.43620.2571.8440.193
Error242.1263570.653 45.6273570.156
Total244.856360 46.379360

