Article

Increased Forest Soil CO2 and N2O Emissions During Insect Infestation

by
Maren Marine Grüning
1,*,
Franziska Germeshausen
1,
Carsten Thies
1,2 and
Anne L.-M.-Arnold
1
1
Department of Soil Science of Temperate and Boreal Ecosystems, Faculty of Forest Sciences and Forest Ecology, University of Goettingen, 37077 Goettingen, Germany
2
Natural Resources Research Laboratory, Bremer Str. 15, 29308 Winsen, Germany
*
Author to whom correspondence should be addressed.
Forests 2018, 9(10), 612; https://doi.org/10.3390/f9100612
Submission received: 23 August 2018 / Revised: 21 September 2018 / Accepted: 3 October 2018 / Published: 5 October 2018

Abstract

:
Forest soils are major sinks of terrestrial carbon, but this function may be threatened by mass outbreak events of forest pests. Here, we measured soil CO2-C and N2O-N fluxes from a Scots pine (Pinus sylvestris L.) forest that was heavily infested by the nun moth (Lymantria monacha L.) and an adjacent noninfested (control) forest site during one year. In the infested forest, net emissions of CO2-C were higher during main defoliation, summer and autumn, while indications of increased N2O-N emissions were found at one sampling date. On basis of this, a microcosm incubation experiment with different organic matter treatments was conducted. Soil treatments with needle litter, insect feces plus needle litter, and insect feces showed 3.7-, 10.6-, and 13.5-fold higher CO2-C emissions while N2O-N of the insect feces plus needle litter, and insect feces treatment was 8.9-, and 10.4-fold higher compared with soil treatments without added organic matter (control). Hence, the defoliation in combination with high inputs of organic matter during insect outbreaks distinctly accelerate decomposition processes in pine forest soils, which in turn alters forests nutrient cycling and the functioning of forests as carbon sinks.

1. Introduction

The worldwide forest area affected annually by insect outbreaks amounts about 36.5 million hectares [1], thereby representing a thread to the function of forests as a carbon sink [2,3,4,5]. Insect defoliation not only leads to decreased canopy biomass, tree growth, and inhibits the production new foliage, but can be accompanied by changes in the N nutritional status of infested trees (e.g., decreased net N uptake, N accumulation in fine roots and needles) [6,7]. Defoliation of forest areas during forest pest outbreaks distinctly increase organic input into the soil in the form of insect feces, cadavers, litter, and other plant material [7,8,9]. Such changes of litter quality and quantity affect the soil organic matter composition [10], and alter nutrient cycling [11,12,13]. Depending on the outbreak intensity, insect feces can account for up to 46% of the total litterfall amount in Scots pine forests [14]. The easy soluble structure of insect feces, with high amounts of labile C and extractable N, can facilitate nutrient release in soils [15,16,17]. Therefore, decomposition processes in the course of defoliations may be enhanced [10,18], thereby triggering CO2 emissions from forest soils [15,19,20]. In contrast, findings from xylophagous insects (compared to phytophagous insects) showed contradictory results. For example, Ponderosa pine (Pinus ponderosa Laws.) stands infested by different bark beetle species (Scolytinae) [21] as well as temperate mixed forests infested by the emerald ash borer (Agrilus planipennis F.) [22] showed no effect on soil CO2 emissions. Bark beetle induced tree diebacks in lodgepole pine (Pinus contorta Dougl. ex Loud.) forests caused even decreased CO2 emissions [23,24].
N2O flux changes during insect outbreaks are less well studied. No effects on N2O emission and nitrate leaching were detected in a manipulation experiment with intensive defoliation of hybrid poplar (Populus x euroamericana cv. Eugeneii) stands by gypsy moth (Lymantria dispar L.) [25]. A rather decelerating effect on nutrient cycling in the course of insect outbreaks, with reduced litter decomposition and accumulation of the soil nitrogen storage was assumed by Madritch and Lindroth (2015) [26], Verkaik et al. (2006) [27], and Ritchie et al. (1998) [18], which may be related to high amounts of tannins in feces, that can build recalcitrant protein–tannin complexes, and impair soil microbial activity. Therefore, nitrogen deriving from insect outbreaks is hypothesized to be rather redistributed in the ecosystem than to be lost [28].
Carbon and nitrogen cycling is a function of complex effects and interdependencies between climate, topography, soil properties and microbial soil community structures [25]. Moreover, forest soils seem to have a certain resistance to biotic disturbances. This may explain why effects of organic input from insect outbreaks on microbial respiration or nitrogen immobilization in soils are often only detectable at relatively high levels of defoliation (>70%) [19,29]. Nevertheless, the effects of forests pests on greenhouse gas emissions are not sufficiently understood to predict environmental effects. The lack of knowledge about C and N balances at the soil–atmosphere interface during biotic disturbances contributes to this unpredictability.
In this study, we analyzed CO2-C and N2O-N fluxes in the course of a nun moth (Lymantria monacha L.) outbreak in Scots pine (Pinus sylvestris L.) forests in Germany. Moth larvae regularly hatch in April/May, feed on pine needles until July, and can completely defoliate trees during this period [30]. We quantified net CO2-C and N2O-N fluxes from a forest soil in an infested compared with a noninfested forest stand. In a consecutive microcosm incubation experiment, we analyzed net CO2-C and N2O-N fluxes under controlled conditions with treatment additions of pine needles, insect feces, and pine needles plus insect feces. We expected that (i) decomposition processes would be accelerated by organic inputs in the course of the insect outbreak and (ii) CO2-C and N2O-N emissions from soils would respond to these biogeochemical changes.

2. Materials and Methods

2.1. Field Measurement

The measurements were conducted in a 65-year-old Scots pine forest (52°8′38′′ N, 13°45′14′′ E, 42 m above sea level) heavily infested by the nun moth (~80% crown defoliation) compared with a noninfested 65-year-old Scots pine forest growing on a site with similar site conditions (52°9′29′′ N, 13°36′47′′; 35 m above sea level). Both forests are characterized as “white moss pine forests” (Leucobryo-Pinetum W.Mat.) grown on podzol (Food and Agriculture Organization of the United Nations (FAO) classification) on aeolian sand (0.2–0.63 mm), with little gravel and a pH (1:10 in H2O) ranging from 3.2 to 3.9 in the mineral soil (Ah) horizon. Soil C/N ratio of the infested site was 29.4 and of the noninfested site 30.3. Both sites did not differ significantly in their soil microbial community composition in early May prior the nun moth population peak [31]. Average annual temperature was 9.2 and 10.8 °C and average annual precipitation was 611 and 474 mm for the study sites in 2013 and 2014, respectively (German Federal Meteorological Service (DWD) and Climate Data Center (CDC), Weather Station Lindenberg (Station ID: 3015), 13.07.2018, see also Supplementary Figure S1; for a description of site properties, see [6,31]). We measured the CO2-C and N2O-N fluxes across one year (August 2013–July 2014), i.e., on three dates in 2013 (August–October with n = 18 for each date) and five dates in 2014 (March–July with n = 30 for each date). The study sites were arranged in a paired sample comparison of noninfested versus infested forests that were located in spatial proximity to each other with n = 9 in 2013 and n=15 in 2014 for each plot.
To quantify soil CO2-C and N2O-N emissions, a polyvinyl chloride (PVC) lid (25 cm diameter, 13 cm high) was applied to a cylindrical PVC-U-frame (25 cm diameter, 10 cm high) which was permanently inserted (7–8 cm deep) in the organic layer and Ah horizon of sampling sites. Litter was not removed within the frames. CO2-C fluxes were measured with a four-point-sampling method, where 20 mL air samples were taken with a syringe via a septum from the closed chamber after 0, 20, 40, and 60 min following its sealing and stored in evacuated glass exetainers. CO2-C and N2O-N concentrations were determined by gas chromatography (ECD, Shimadzu, Duisburg, Germany). Fluxes were calculated from the linear change of the gas concentrations during chamber closure, the volume of the chamber and the enclosed surface area, according to Lessard et al. (1993) [32]. Values were corrected for air temperature and air pressure using the following equation:
factor = air   pressure   ( p a ) ×   molar   weight   ( g m o l ) gas   constant   ( J m o l   K ) × temperature   ( K ) × 10 3
and projected to one square meter and one hour. Simultaneously, temperature of the top 10 cm soil depth, gravimetric soil water content of the Ah, and sampling time were recorded for each plot.

2.2. Incubation Experiment

For the microcosm incubation experiment, randomly collected upper mineral soil (Ah) of the control site was used, homogenized, sieved at 2 mm and 200 g fresh weight were transferred to 20 glass incubators (1000 cm3). Incubators were attached to an automated gas chromatographic system (GC) with a 63Ni electron capture detector (ECD) for the measurement of CO2 and N2O concentrations (Shimadzu, Duisburg, Germany) (for a description, see also [33]). The air space of the incubators was flushed with synthetic air and the flux was calculated by determining the differences between inlet air and exhausted air (12 measurements per incubator and day). Experimental runtime was 31 days, including six days of soil pre-incubation. Treatments were added on day seven in form of feces, Scots pine needle litter and a mixture of both with five biological replicates for each treatment. The feces was produced under laboratory conditions from Dendrolimus pini L. Feces was mixed, dried at 20 °C for 72 h and needle and bark residues were removed. Needle litter was collected from the noninfested control site in 2014 and dried at 20 °C for 72 h. The total amount of needle and feces input was 5 g dry-weight-equivalent of total C, resulting in the addition of 49.2 mg feces (feces treatment), 48.9 mg needle (needle treatment) and 24 mg of both (feces plus needle litter treatment), respectively, per gram soil. Temperature was constant 20 °C and no light exposure during the experiment. On day 4 and day 18, 60 mL dH2O were added to the incubators. The amount of added water was adjusted to reach 70–80% of the soils maximum water holding capacity. The analyses of element contents of Aluminum (Al), Calcium (Ca), Iron (Fe), Potassium (K), Magnesium (Mg), Manganese (Mn), Sodium (Na), Phosphorus (P), Sulphur (S) of the used soil, feces, and needle litter samples are given in Supplementary Table S1. Values are based on HNO3 extraction (described in [34]) and subsequent measurement by using an ICP-OES (iCAP 6300 Duo VIEW ICP Spectrometer, Thermo Fischer Scientific GmbH, Dreieich, Germany). For the measurement of total carbon (Ctot) and nitrogen (Ntot) content soil was dried at 105 °C for 24 h, finely ground, and analyzed by a total organic carbon analyzer multi C/N (Analytik Jena, Jena, Germany).

2.3. Statistical Analyses

Statistical analyses were conducted in R 3.3.3 [35]. All data sets were tested for distribution of normality and homogeneity of variances by applying the Shapiro–Wilk test and Levene’s test, respectively. CO2-C and N2O-N fluxes were analyzed separately for each of the seven sampling dates by paired Wilcoxon signed-rank tests, with n = 18 (for each of the three the dates in 2013), and n = 30 (for each of the five dates in 2014), respectively. The Kruskal–Wallis test was used to detect differences between the accumulated CO2-C and N2O-N fluxes from the four treatments of the incubation experiment. In addition, Spearman’s rank correlations (rS) were used to assess the relationships between soil greenhouse gas fluxes (CO2-C and N2O-N) and soil temperature as well as soil water content from the field study.

3. Results

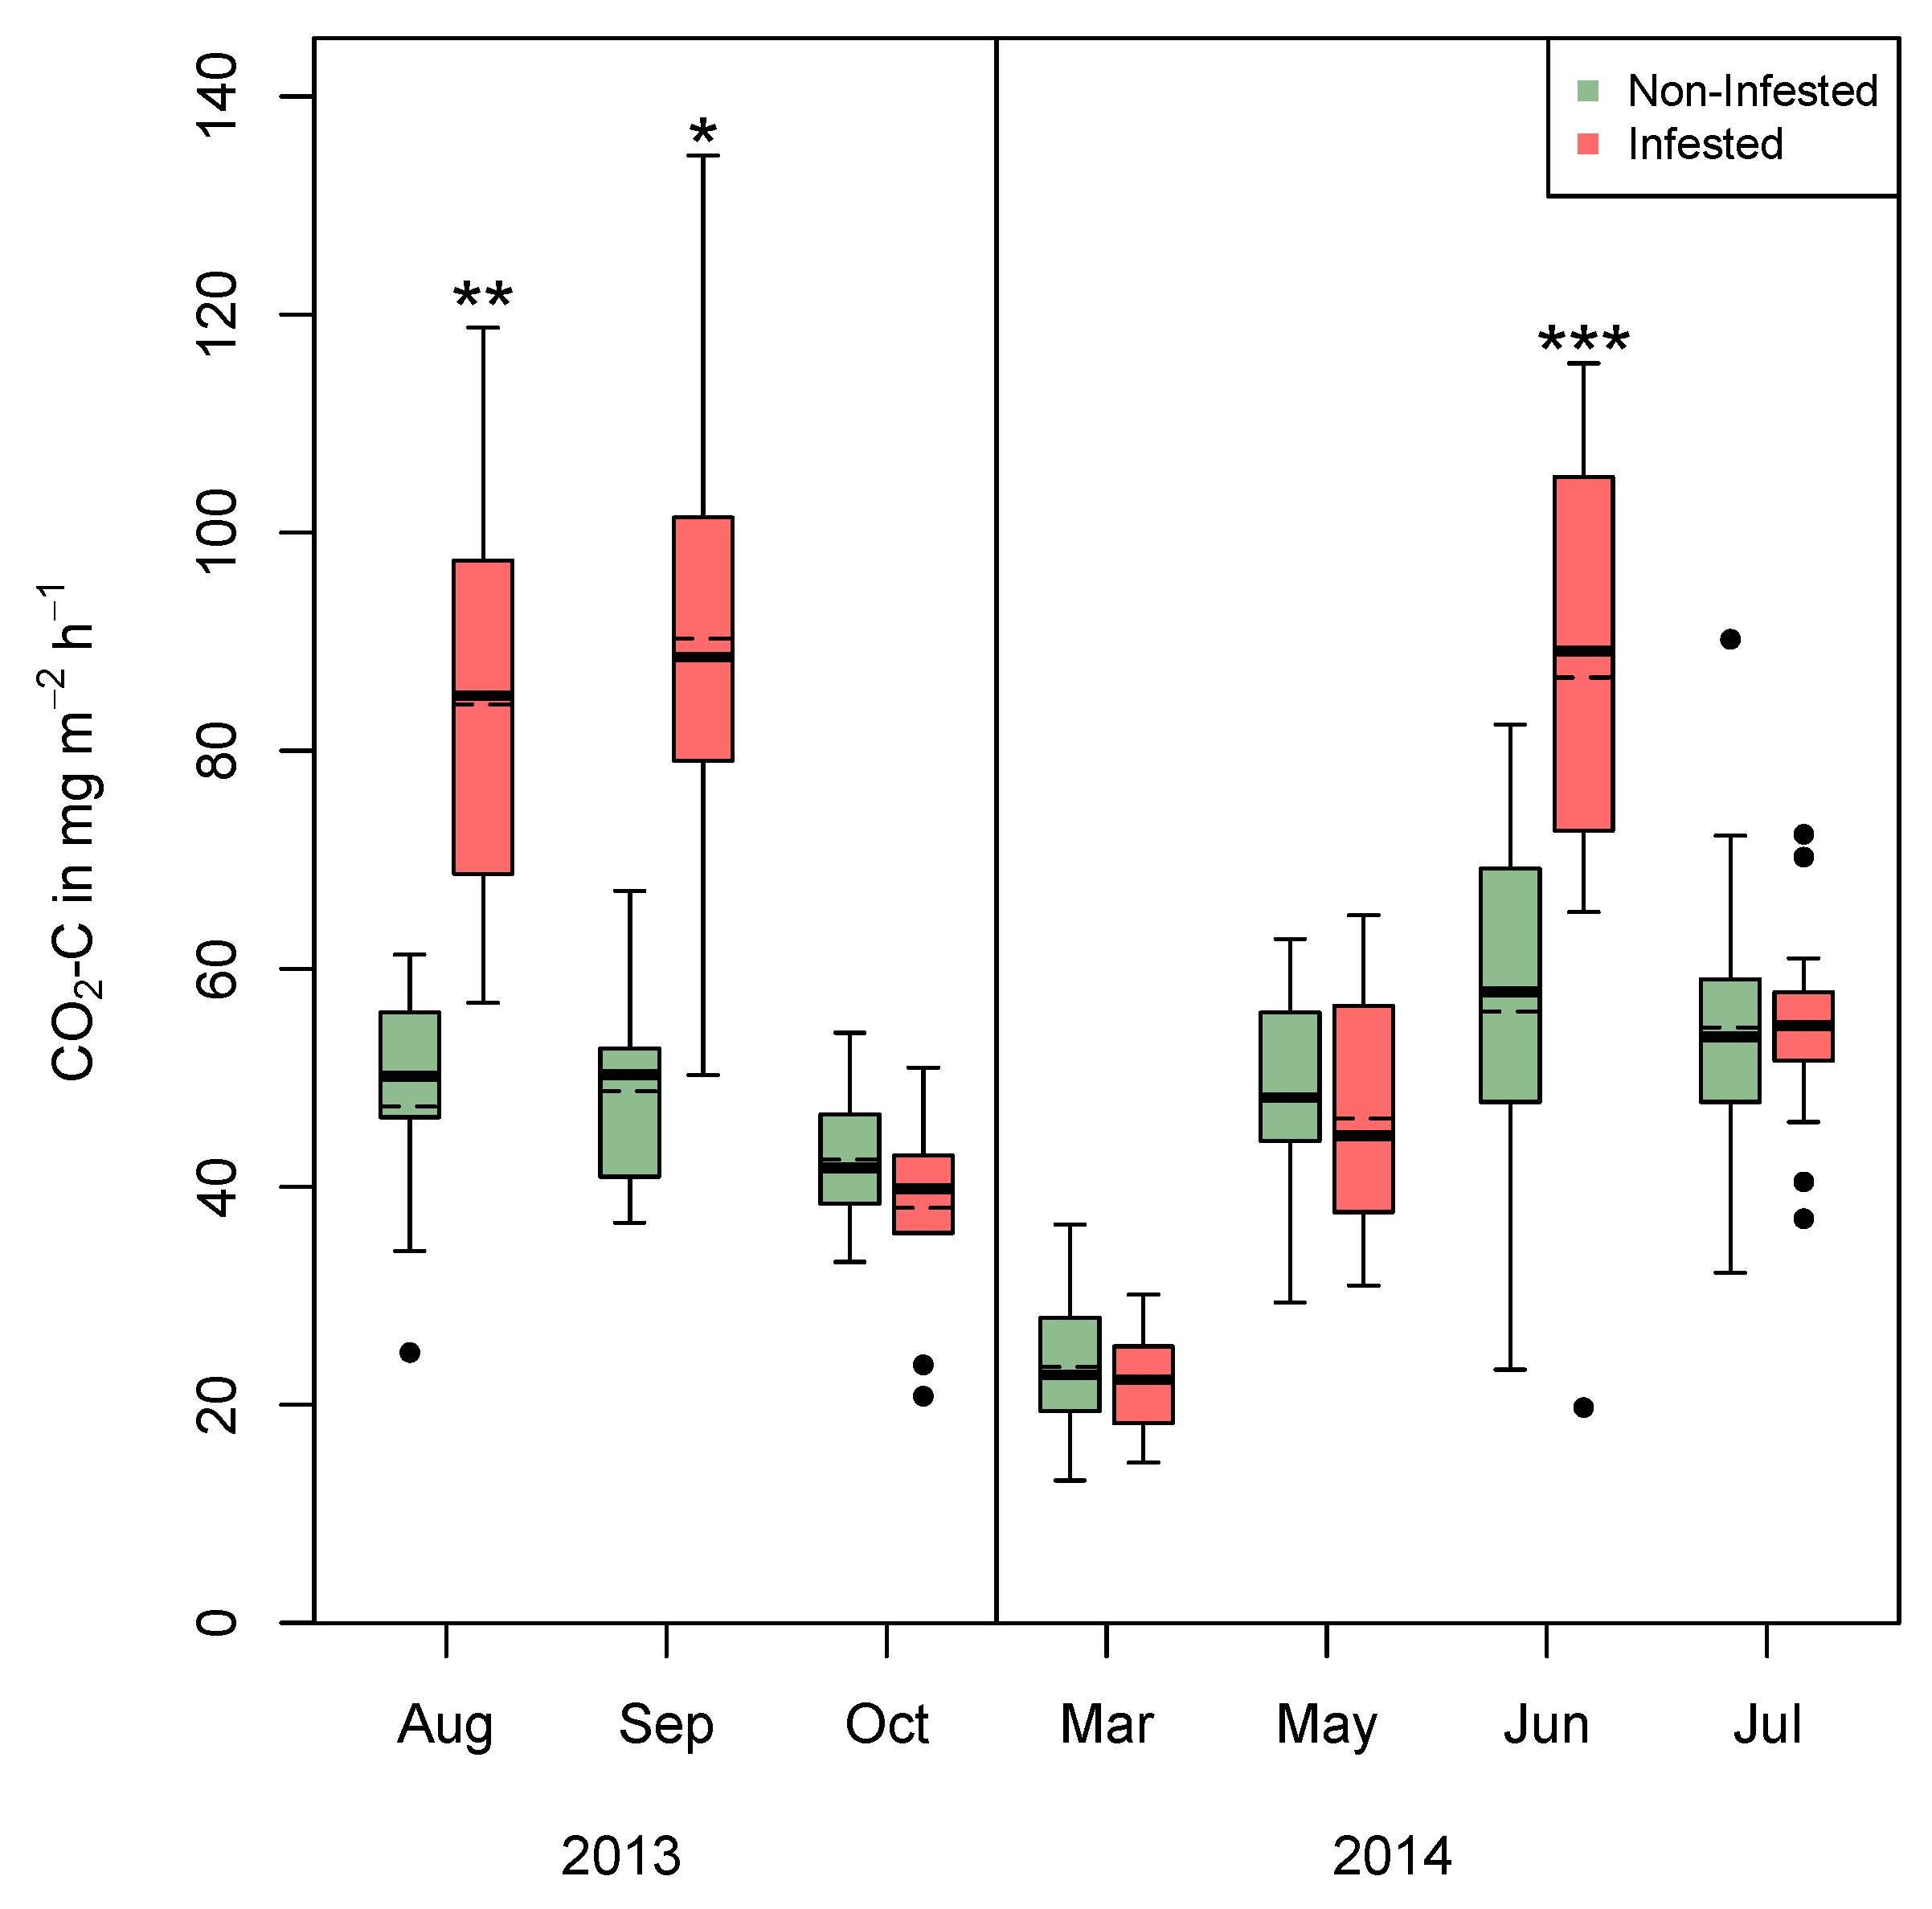
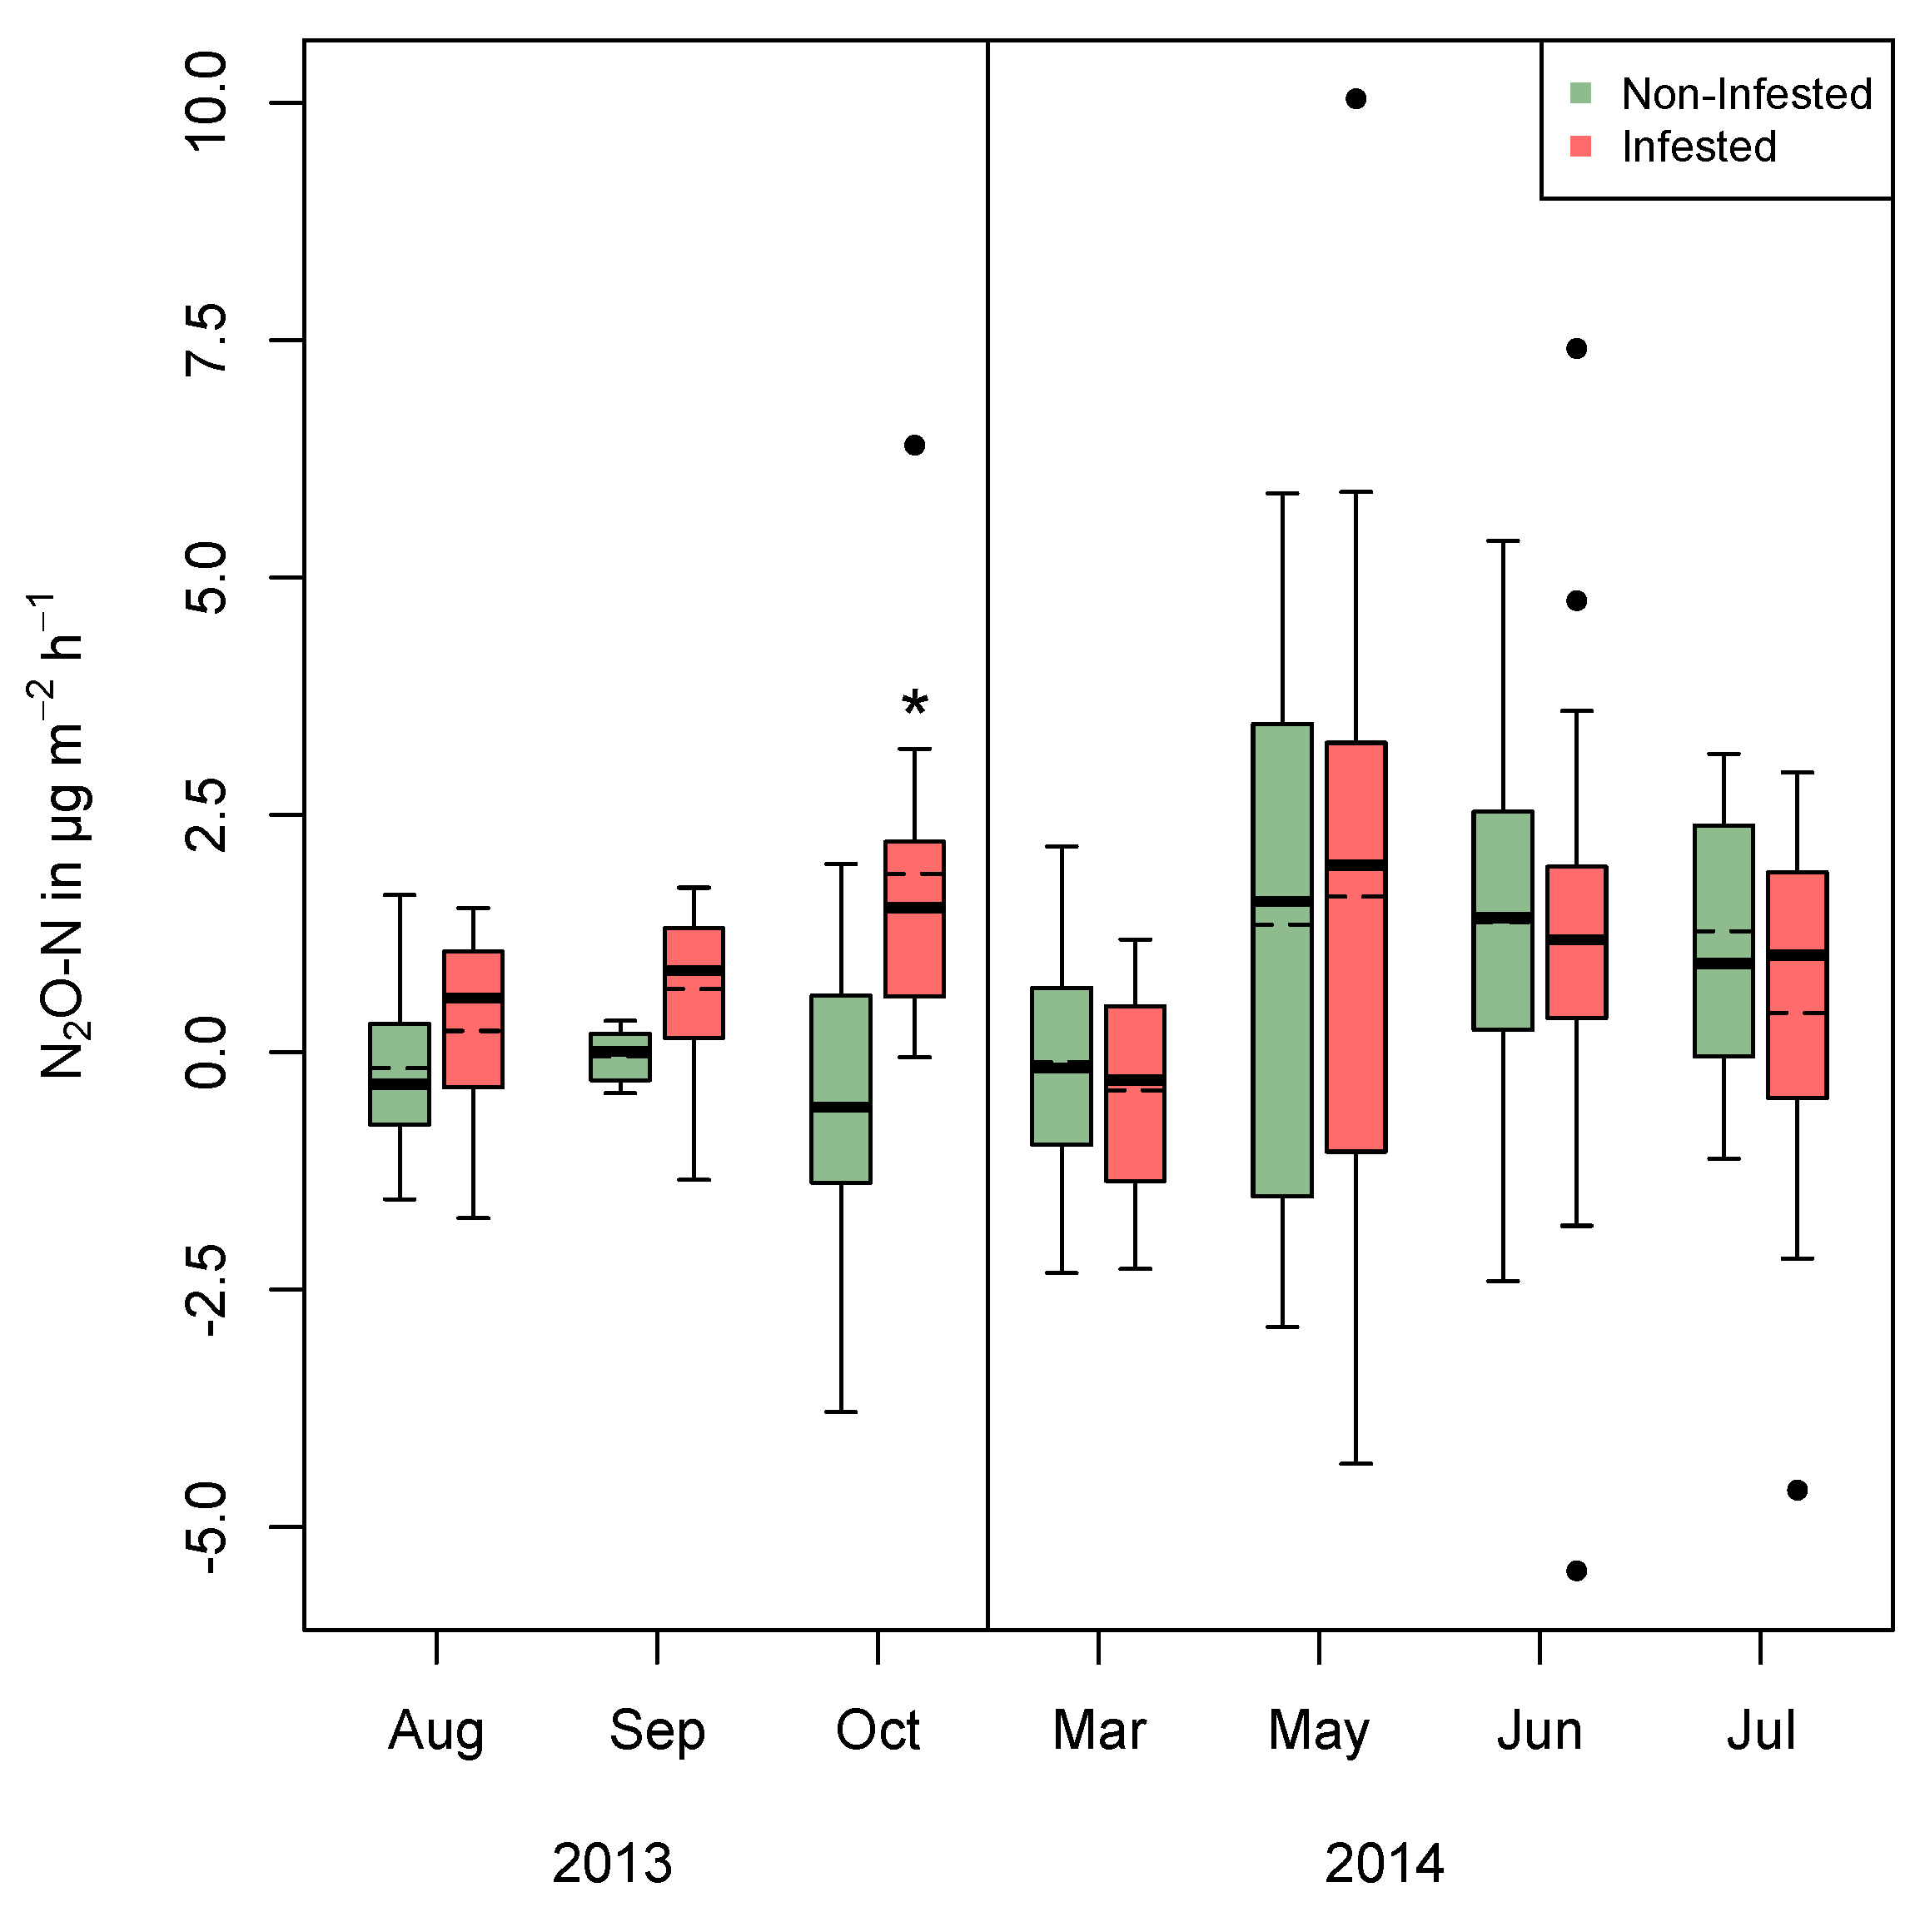
3.1. Field Measurement

CO2-C fluxes averaged 47.33 ± 7.83 mg CO2-C m−2 h−1 in noninfested forests and 61.28 ± 21.98 mg CO2-C m−2 h−1 in infested forests. They considerably increased during summer, early in the autumn and during main defoliation in the infested forest site with 1.8- (p = 0.004), 1.9- (p = 0.016) and 1.5-fold (p < 0.001) increased emissions in August and September 2013 and June 2014, respectively (Figure 1). N2O-N fluxes averaged 0.27 ± 0.41 µg N2O-N m−2 h−1 in noninfested forests and 0.91 ± 0.74 µg N2O-N m−2 h−1 in infested forests. N2O-N emissions were significantly increased in the infested forest in October 2013 (p = 0.039), while N2O-N flux of the noninfested forest was negative from August 2013 to March 2014 (Figure 2).
CO2-C fluxes correlated positively with soil temperature (rS = 0.738, p = 0.046, Supplementary Figure S2), but not with soil water content (rS = −0.700, p = 0.233). N2O-N emissions were neither correlated with soil temperature (rS = −0.095, p = 0.840) nor with soil water content (rS = −0.300, p = 0.683).

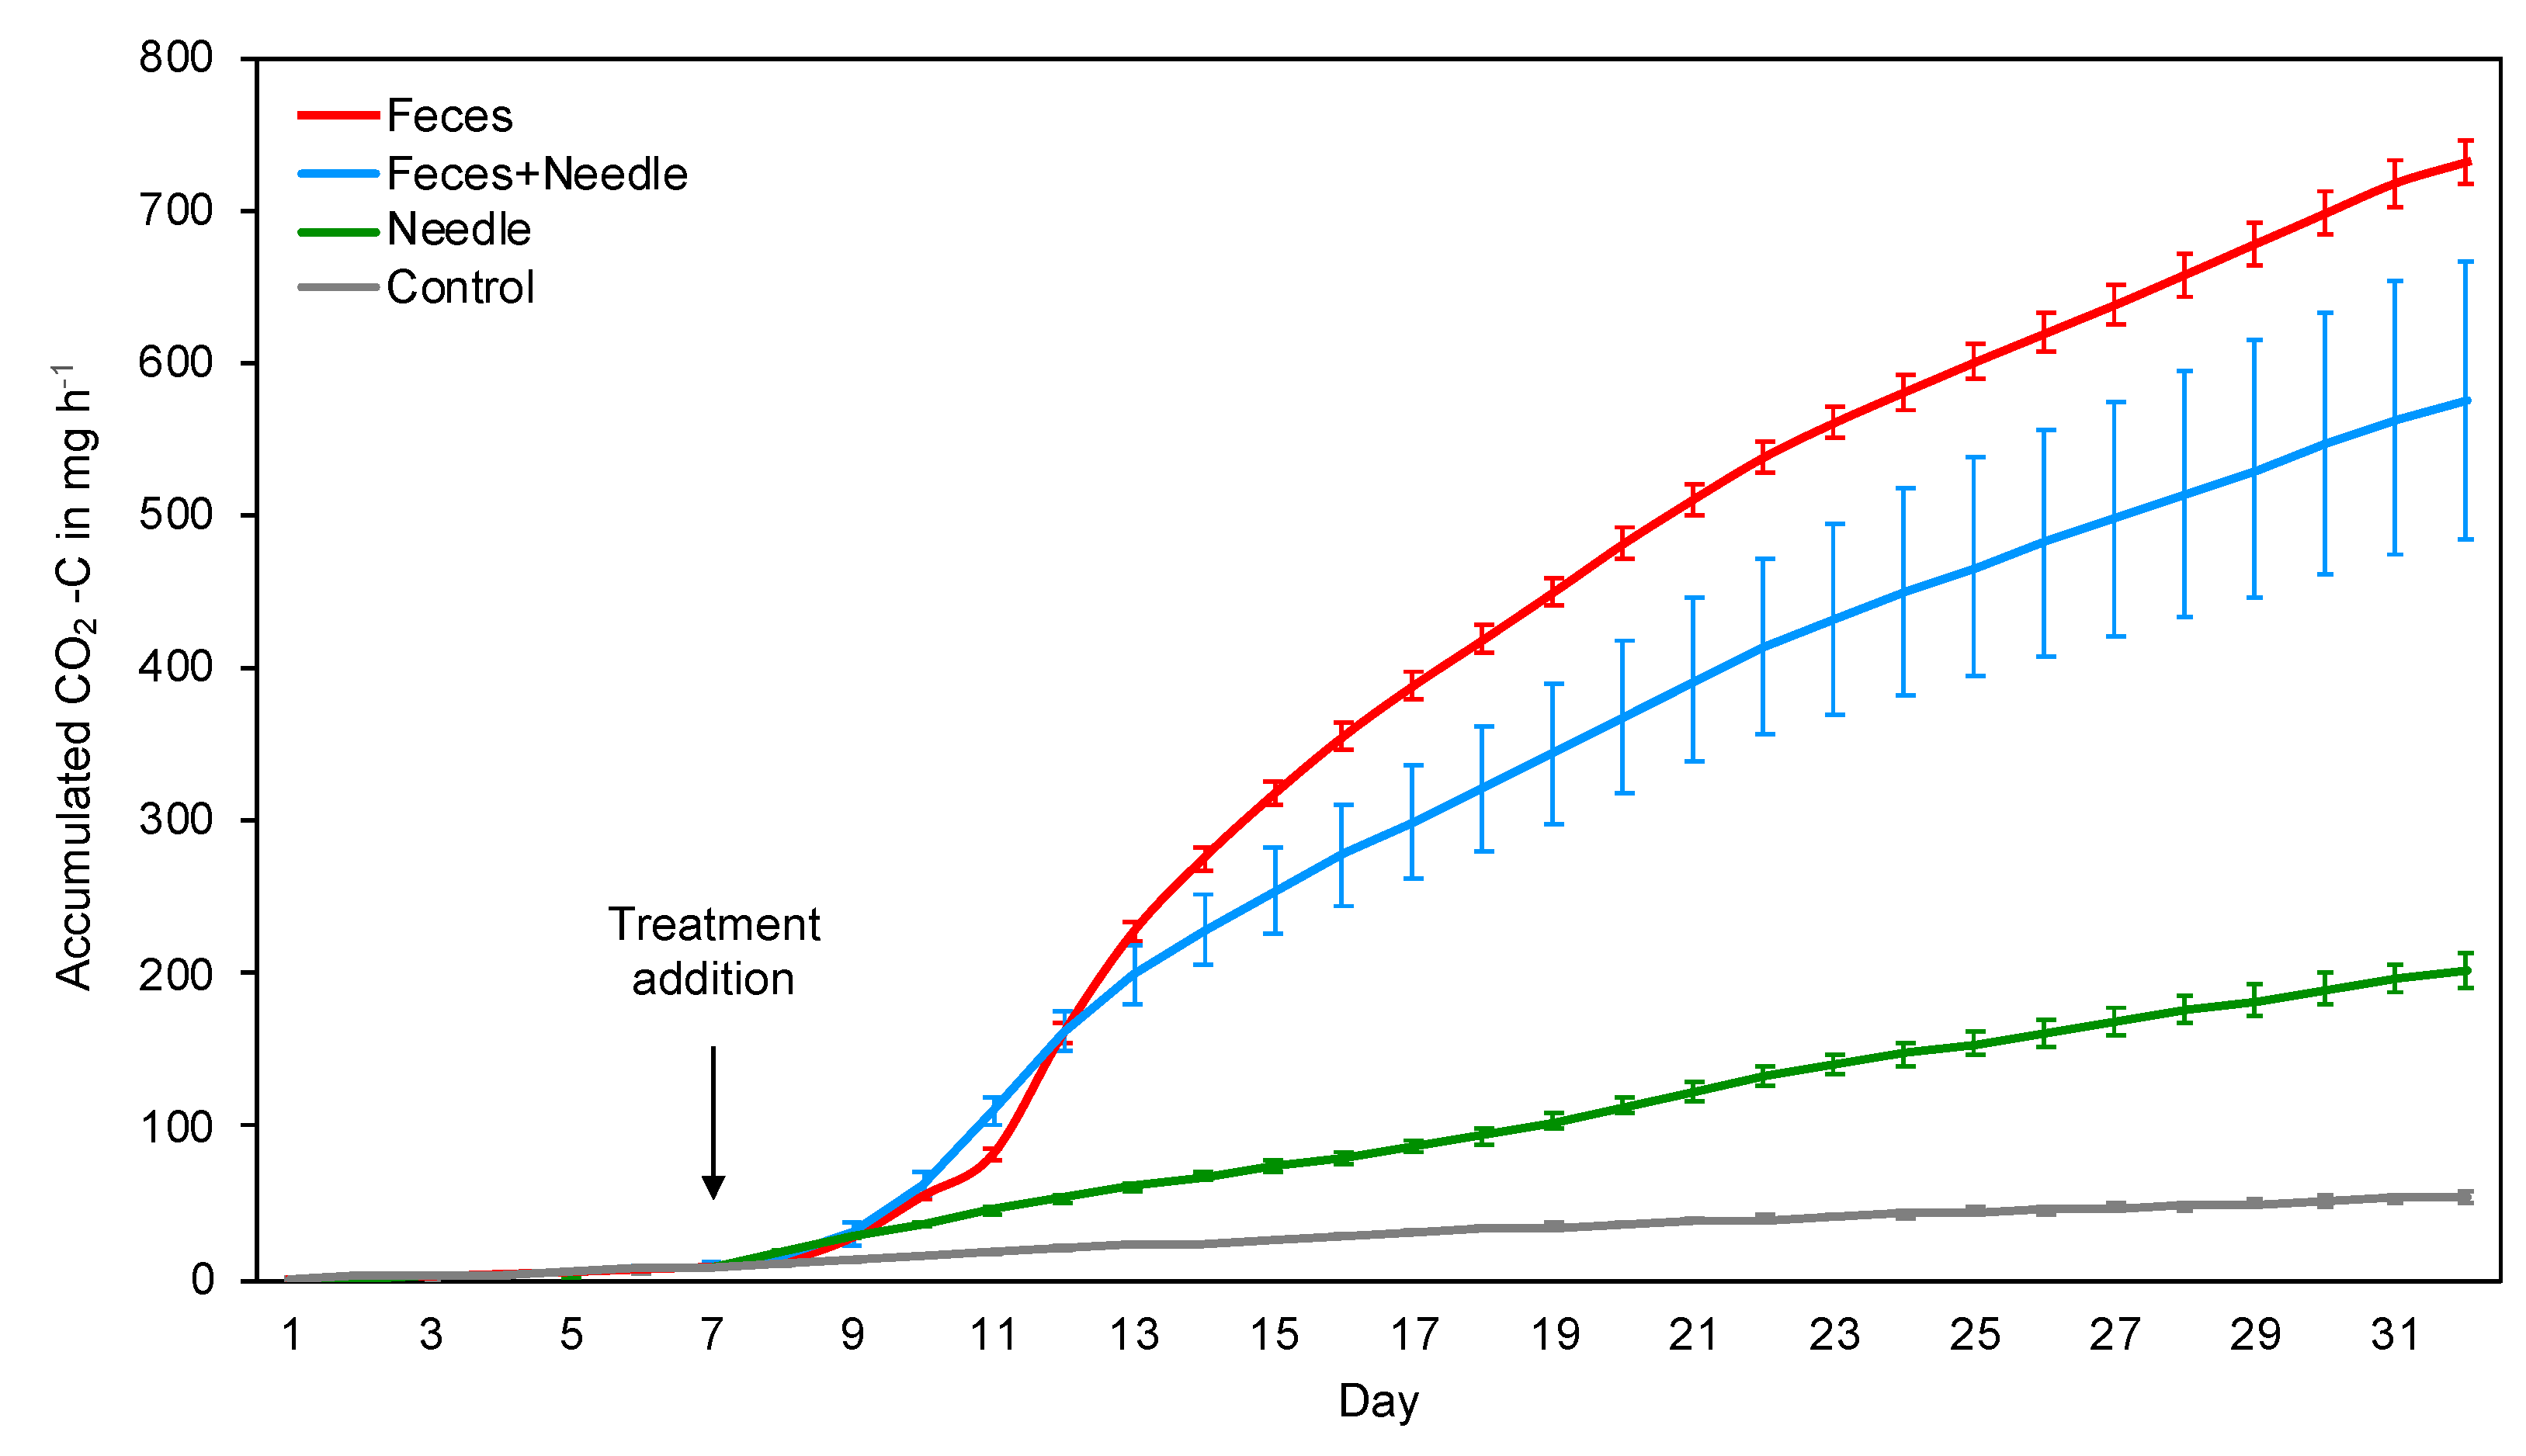
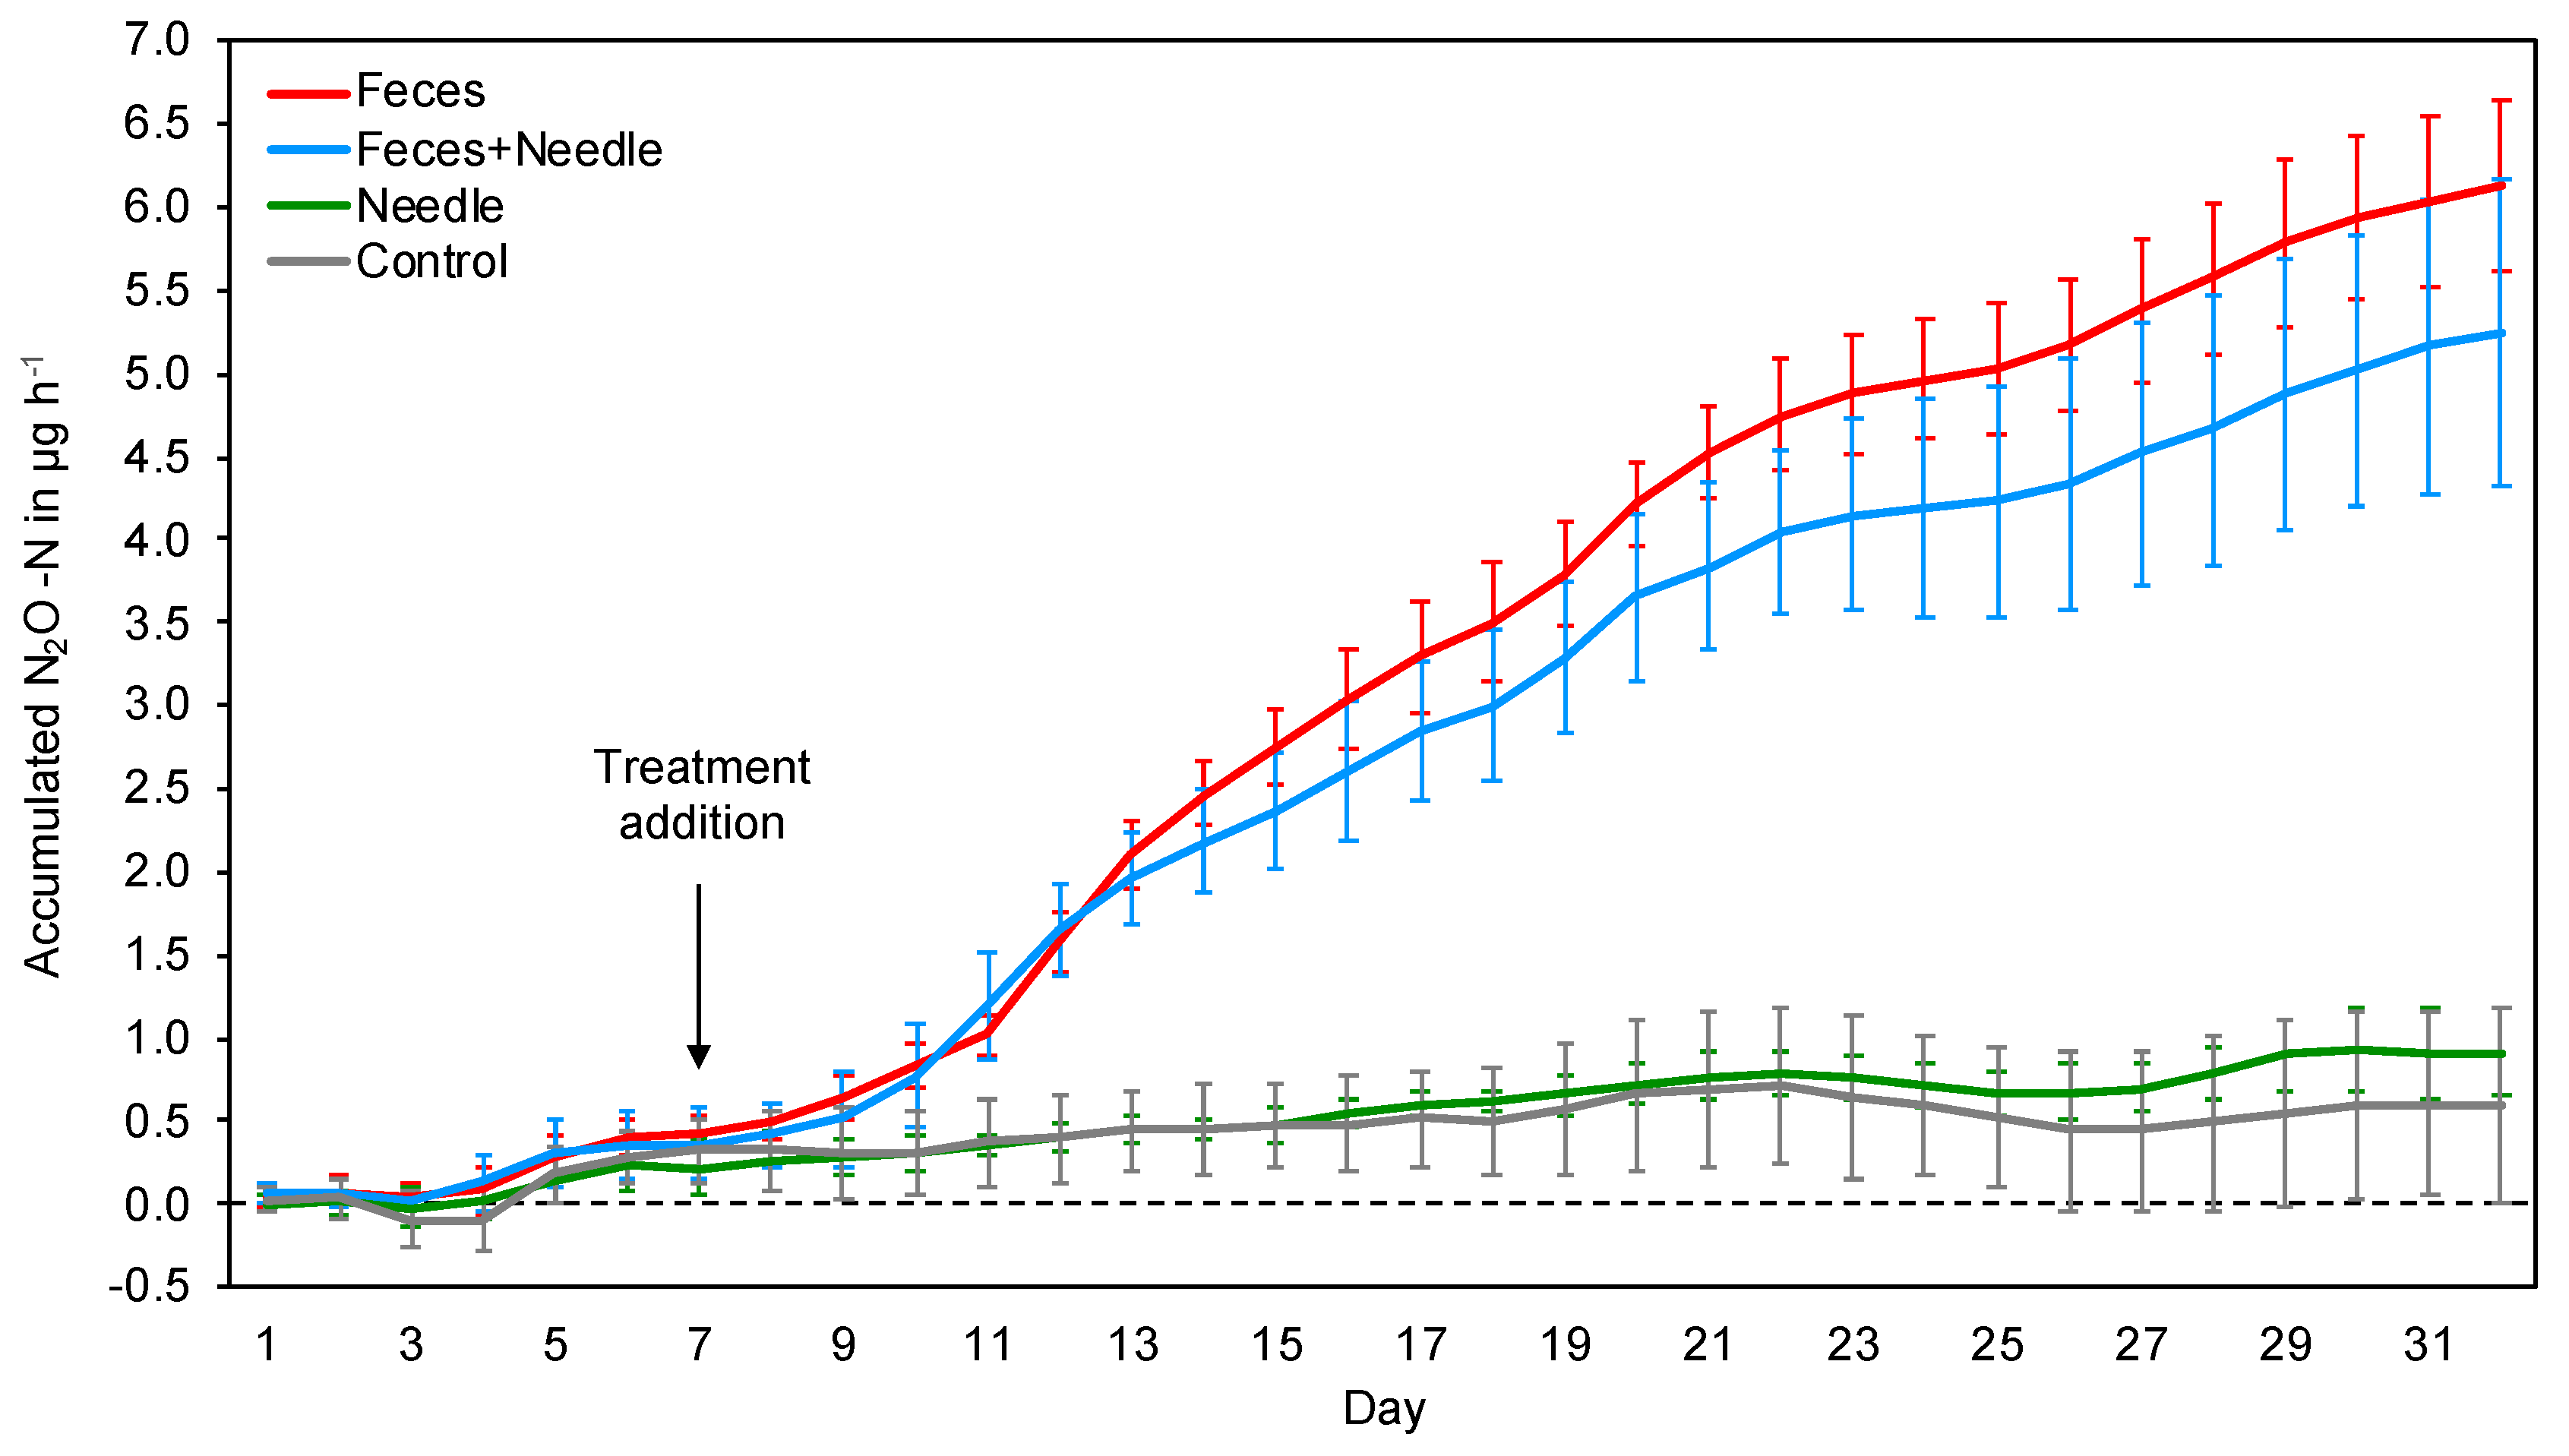
3.2. Incubation Experiment

The accumulated carbon and nitrogen fluxes across the 31-day study period were 54.04 ± 1.27 mg CO2-C h−1 in soil treatments without addition of organic matter (control), 202.11 ± 4.39 mg CO2-C h−1 in soil treatments with addition of needles, and 574.83 ± 37.85 mg CO2-C h−1 in soil treatments with addition of needles plus insect feces, and 731.46 ± 7.30 mg CO2-C h−1 in soil treatments with addition of insect feces (Figure 3). N2O-N fluxes amounted 0.59 ± 0.34 µg N2O-N h−1 in soil treatments without addition of organic matter (control), 0.91 ± 0.13 µg N2O-N h−1 in soil treatments with addition of pine needles, 5.25 ± 0.45 µg N2O-N h−1 in soil treatments with addition of pine needles plus insect feces, and 6.14 ± 0.27 µg N2O-N h−1 emissions in soil treatments with addition of insect feces (Figure 4).
Maximum emissions of 10.98 mg CO2-C h−1 were reached by the insect feces treatment on the fourth day after treatment addition (with 48-fold higher emissions compared with the control). Similarly, maximum N2O-N fluxes of 0.07 µg N2O-N h−1 were reached by the feces treatment at the fourth day after treatment addition (with 13-fold higher emissions compared with the control). From that day, fluxes of both gases, decreased slowly with time.
Despite similar element contents of needles and feces (see Supplementary Table S1), inputs of feces significantly accelerated soil CO2-C and N2O-N fluxes. When compared with the soil treatment without addition of organic matter (control), the experimental inputs of C and N via needles and feces accelerated CO2-C emissions 3.7-fold in treatments with addition of needles, 10.6-fold in treatments with addition of needles plus feces, 13.5-fold in treatments with addition of feces (all p-values < 0.009). N2O-N emissions were accelerated averagely 8.9-fold in treatments with addition of needles plus feces (p < 0.010) and 10.4-fold in treatments with addition of feces (p < 0.010), while it was not increased compared to the treatments with addition of needles (p = 0.117).
Soil C/N ratio before treatment addition 32.06 in all incubators. At the end of the experiment, C/N ratio of the control almost stayed the same with 32.08, while in the feces treatment C/N increased to 32.23. In contrast, the needle treatment and the needle plus feces treatment decreased to 31.43 and 31.46, which was significantly lower compared to the feces treatment (p = 0.018 and p = 0.024).

4. Discussion

Scots pine forests infested with the nun moth showed increased soil emissions of CO2-C during several sampling dates and indications of increased N2O-N emissions at one date, which both may be related to the altered quality and quantity of organic inputs during the pest outbreak. In the incubation experiment, feces input rapidly accelerated CO2-C and N2O-N emissions from soil with up to 14- and 25-fold, respectively, higher fluxes compared to those from needle litter. The increased deposition of organic matter during the defoliation of a pine stand provides large amounts of labile organic C and N, which in turn may positively influence microbial decomposition processes [36]. An experiment with feces from Melanoplus borealis F. and Chorthippus curtipennis F. feeding on different diets demonstrated that up to 46% of the emitted CO2-C from soil can originate from the added feces [37]. Considering that the organic input during nun moth outbreaks can be much higher compared to those from natural (noninfested) conditions (e.g., 300% higher feces and needle litter N input on our study site in 2014 [6]), as well as the easily biodegradable structure of feces can be an explanation for the higher CO2-C emissions from the infested forest site (even following the outbreak when the actual defoliation activity has already ceased). For example, fir forests (Abies spec.) defoliated by the siberian moth (Dendrolimus superans sibiricus Tschtvrk.) showed increased rates of soil respiration even three years after the pest outbreak [38]. Therefore, increased deposition of organic matter (especially feces) during our nun moth defoliation may have contributed to the enhanced greenhouse gas emissions from forest soils during the outbreak years.
The biogeochemical pathways by which carbon is transformed and moves through forest ecosystems are strongly coupled with those of nitrogen [39]. High inputs of labile carbon enhance microbial growth and nitrogen immobilization, while low C inputs rather promote N leaching [19]. The increased soil C/N ratios of the feces treatment in our incubation experiment may therefore be an indicator of microbial immobilization, and this is supported by the relatively slow decrease of the gas emission rates following peak emissions. In contrast, C/N ratios under field conditions are often observed to decrease during insect outbreaks [20,23,24,40], even on our sampling sites [41].
The availability of organic inputs, microbial activity and emerging greenhouse gas emissions are influenced by soil aeration, fluctuation of the water table, nutrient availability, temperature, and favorable microclimatic conditions (e.g., temperature and precipitation) [42,43,44,45]. Our field study was conducted in a continental climate, with (temporally) semi-arid conditions during summer and autumn which can hamper a fast microbial decomposition [46,47]. This might have a negative impact on the microbial decomposition of organic matter during pest outbreaks, and explain the relative differences in CO2-C and N2O-N emissions between noninfested and infested real forests compared with those from our microcosm experiment under optimized conditions (see also [15]). Further, N2O emissions from forest soils are spatial and temporal highly variable (“hot spots” and “hot moments” of N2O emissions [48]), which makes measurement and comparability across sites difficult [45]. However, on our infested study site, the abundance of NO2- reducers (nirK genes) in the soil was also found to be increased [41], indicating a genetic potential for accelerated N2O emissions. To our knowledge, we show for the first time that both CO2 and N2O emissions can be triggered simultaneously by organic inputs deriving from pest insects.
Nitrification and NO3 losses as well as denitrification and N2O losses are expected to increase as the fraction of mineralized ammonium increases [49] These processes can take place simultaneously in the same soil, e.g., in large, air-ducting pores and inside large soil aggregates, respectively [44,45,50]. Further, accelerated tree growth and increased carbon storage in biomass as well as increased autotrophic respiration from the rhizosphere and decreased heterotrophic respiration from soil microorganisms are consequences of N inputs, thereby contributing to the carbon-sink potential of a forest [39]. However, infested forest trees are often physically impaired in their N nutrition, N uptake and reduced in biomass growth rates as consequence of the defoliation [6,51,52]. Additionally, our results suggest increased microbial decomposition and CO2 emissions during insect outbreaks. All this can have the potential to reduce the forests carbon sequestration capacity or even switch the forest to a carbon source [2,3,4,5].

5. Conclusions

Climate change appears to be a major driver of forest pest outbreaks [53,54,55] and most insects are expected to benefit from a high temperature to precipitation quotient [56,57]. Our results indicate that organic input during a pest outbreak in a pine forest can trigger considerable CO2 and N2O emissions via a transformation of tree biomass into fast decomposable organic matter, which in turn has implications for nutrient cycling and forests functioning as a carbon sink. Future studies on nitrifying and denitrifying microorganisms under variable conditions are necessary to better understand the effects of insect-derived input and the implications for soil C and N turnover processes.

Supplementary Materials

The following are available online at https://www.mdpi.com/1999-4907/9/10/612/s1, Figure S1: Monthly average precipitation (mm; blue bars) and mean air temperature (°C; red line) during the sampling period (August 2013–July 2014), Figure S2: Relationship between mean soil CO2-C emissions (mg m−2 h−1) and soil temperature (°C of the top 10 cm of soil depth), Table S1: Elemental composition of the mineral soil, Pine-tree lappet (Dendrolimus pini L.) feces, and Scots pine (Pinus sylvestris L.) needle litter used in the incubation experiment.

Author Contributions

Investigation, M.M.G., F.G.; Formal analysis and Visualization, F.G., M.M.G.; Writing—Original Draft Preparation, M.M.G.; Writing—Review & Editing, M.M.G, C.T. and A.l.-M.-A.; Conceptualization and Supervision, A.l.-M.-A.

Funding

This study was funded by the Germany Research Foundation (DFG) (DFG Project No. ME 3861/2-1).

Acknowledgments

We thank Annett Reinhardt for assistance with the field work and during the incubation experiment, Karin Schmidt for elemental analyses and help in the laboratory, Ignacy Korczyński for providing the feces used for the incubation experiment, Norman S. Loftfield for guidance and advices regarding the experimental setup and methods of CO2 and N2O measurement and Hermann Jungkunst for expert advice on N2O fluxes. We acknowledge support by the German Research Foundation and the Open Access Publication Funds of the Goettingen University.

Conflicts of Interest

The authors declare no conflict of interest.

References

  1. Kautz, M.; Meddens, A.J.H.; Hall, R.J.; Arneth, A. Biotic disturbances in Northern Hemisphere forests—A synthesis of recent data, uncertainties and implications for forest monitoring and modelling. Glob. Ecol. Biogeogr. 2017, 26, 533–552. [Google Scholar] [CrossRef]
  2. Kurz, W.A.; Dymond, C.C.; Stinson, G.; Rampley, G.J.; Neilson, E.T.; Carroll, A.L.; Ebata, T.; Safranyik, L. Mountain pine beetle and forest carbon feedback to climate change. Nature 2008, 452, 987–990. [Google Scholar] [CrossRef] [PubMed]
  3. Clark, K.L.; Skowronski, N.; Hom, J. Invasive insect impact forest carbon dynamics. Glob. Chang. Biol. 2010, 16, 88–101. [Google Scholar] [CrossRef]
  4. Dymond, C.C.; Neilson, E.T.; Stinson, G.; Porter, K.; MacLean, D.A.; Gray, D.R.; Campagna, M.; Kurz, W.A. Future Spruce Budworm Outbreak May Create a Carbon Source in Eastern Canadian Forests. Ecosystems 2010, 13, 917–931. [Google Scholar] [CrossRef]
  5. Hadden, D.; Grelle, A. Net CO2 emissions from a primary boreo-nemoral forest over a 10 year period. For. Ecol. Manag. 2017, 398, 164–173. [Google Scholar] [CrossRef]
  6. Grüning, M.M.; Simon, J.; Rennenberg, H.; L.M.-Arnold, A. Defoliating Insect Mass Outbreak Affects Soil N Fluxes and Tree N Nutrition in Scots Pine Forests. Front. Plant. Sci. 2017, 8, 954. [Google Scholar] [CrossRef]
  7. Stadler, B.; Müller, T.; Orwig, D.; Cobb, R. Hemlock Woolly Adelgid in New England Forests: Canopy Impacts Transforming Ecosystem Processes and Landscapes. Ecosystems 2005, 8, 233–247. [Google Scholar] [CrossRef]
  8. Müller, T.; Strobel, K.; Ulrich, A. Microorganisms in the phyllosphere of temperate forest ecosystems in a changing environment. In Microbial Ecology of Aerial Plant Surfaces; Chapter 4; Bailey, M.J., Lilley, A.K., Timms-Wilson, T.M., Spencer-Phillips, P.T.N., Eds.; CAB International: Wallingford, UK, 2006; p. 51. [Google Scholar] [CrossRef]
  9. Le Mellec, A.; Michalzik, B. Impact of a pine lappet (Dendrolimus pini) mass outbreak on C and N fluxes to the forest floor and soil microbial properties in a Scots pine forest in Germany. Can. J. For. Res. 2008, 38, 1829–1841. [Google Scholar] [CrossRef]
  10. Chapman, S.K.; Hart, S.C.; Cobb, N.S.; Whitham, T.G.; Koch, G.W. Insect Herbivory increases litter quality and decomposition: An extension of the acceleration hypothesis. Ecology 2003, 84, 2867–2876. [Google Scholar] [CrossRef]
  11. Belovsky, G.E.; Slade, J.B. Insect herbivory accelerates nutrient cycling and increases plant production. Proc. Natl. Acad. Sci. USA 2000, 97, 14412–14417. [Google Scholar] [CrossRef] [PubMed] [Green Version]
  12. Frost, C.F.; Hunter, M.D. Insect herbivory and frass deposition affect soil nutrient dynamics and export in oak mesocosms. Ecology 2004, 85, 3335–3347. [Google Scholar] [CrossRef]
  13. Le Mellec, A.; Habermann, M.; Michalzik, B. Canopy herbivory altering C to N ratios and soil input patterns of different organic matter fractions in a Scots pine forest. Plant Soil. 2009, 325, 255–262. [Google Scholar] [CrossRef]
  14. Fogal, W.H.; Slansky, F. Contribution of feeding by European pine sawfly larvae to litter production and element flux in Scots pine plantations. Can. J. For. Res. 1985, 15, 484–487. [Google Scholar] [CrossRef]
  15. Lovett, G.M.; Ruesink, A.E. Carbon and nitrogen mineralization from decomposing gypsy moth frass. Oecologia 1995, 104, 133–138. [Google Scholar] [CrossRef] [PubMed]
  16. Zimmer, M.; Topp, W. The role of coprophagy in nutrient release from feces of phytophagous insects. Soil Biol. Biochem. 2002, 34, 1093–1099. [Google Scholar] [CrossRef]
  17. Stremińska, M.A.; Błaszczyk, M.; Kolk, A. Microbial abundance and some of their physiological activities in soil organic horizon of pine forest affected by insect herbivory. Pol. J. Environ. Stud. 2006, 15, 905–914. [Google Scholar]
  18. Ritchie, M.; Tilman, D.; Knops, J. Herbivore effects on plant and nitrogen dynamics in oak savanna. Ecology 1998, 79, 165–177. [Google Scholar] [CrossRef]
  19. Hillstrom, M.; Meehan, T.D.; Kelly, K.; Lindroth, R.L. Soil carbon and nitrogen mineralization following deposition of insect frass and greenfall from forests under elevated CO2 and O3. Plant Soil. 2010, 336, 75–85. [Google Scholar] [CrossRef]
  20. L.-M.-Arnold, A.; Grüning, M.; Simon, J.; Reinhardt, A.B.; Lamersdorf, N.; Thies, C. Forest defoliator pests alter carbon and nitrogen cycles. R. Soc. Open Sci. 2016, 3, 160361. [Google Scholar] [CrossRef] [PubMed] [Green Version]
  21. Morehouse, K.; Johns, T.; Kaye, J.; Kaye, M. Carbon and nitrogen cycling immediately following bark beetle outbreaks in southwestern ponderosa pine forests. For. Ecol. Manag. 2008, 255, 2698–2708. [Google Scholar] [CrossRef]
  22. Matthes, J.H.; Lang, A.K.; Jevon, F.V.; Russel, S.J. Tree Stress and Mortality from Emerald Ash Borer Does Not Systematically Alter Short-Term Soil Carbon Flux in a Mixed Northeastern U.S. Forest. Forests 2018, 9, 37. [Google Scholar] [CrossRef]
  23. Mikkelson, K.M.; Brouillard, B.M.; Bokman, C.M.; Sharp, J.O. Ecosystem resilience and limitations revealed by soil bacterial community dynamics in a bark beetle- impacted forest. mBio 2017, 8, e01305-17. [Google Scholar] [CrossRef] [PubMed]
  24. Brouillard, B.M.; Mikkelson, K.M.; Bokman, C.M.; Berryman, E.M.; Sharp, J.O. Extent of localized tree mortality influences soil biogeochemical response in a beetle-infested coniferous forest. Soil Biol. Biochem. 2017, 114, 309–318. [Google Scholar] [CrossRef]
  25. Russel, C.A.; Kosola, K.R.; Paul, E.A.; Robertson, G.P. Nitrogen cycling in poplar stands defoliated by insects. Biogeochemistry 2004, 68, 365–381. [Google Scholar] [CrossRef]
  26. Lindroth, R.L.; Dearing, D.M. Herbivory in a World of Elevated CO2. In A History of Atmospheric CO2 and Its Effects on Plants, Animals, and Ecosystems. Ecological Studies (Analysis and Synthesis); Baldwin, I.T., Caldwell, M.M., Heldmaier, G., Jackson, R.B., Lange, O.L., Mooney, H.A., Schulze, E.-D., Sommer, U., Ehleringer, J.R., Dearing, M.D., et al., Eds.; Springer: New York, NY, USA, 2005; Volume 177, pp. 468–486. [Google Scholar]
  27. Verkaik, E.; Jongkind, A.G.; Berendse, F. Short-term and long-term effects of tannins on nitrogen mineralization and litter decomposition in kauri (Agathis australis (D.Don) Lindl.) forests. Plant Soil. 2006, 287, 337–345. [Google Scholar] [CrossRef]
  28. Lovett, G.M.; Christenson, L.M.; Groffman, P.M.; Jones, C.G.; Hart, J.E.; Mitchell, M.J. Insect Defoliation and Nitrogen Cycling in Forests. BioScience 2002, 52, 335–341. [Google Scholar] [CrossRef]
  29. Hunter, M.D.; Linnen, C.R.; Reynolds, B.C. Effects of endemic densities of canopy herbivores on nutrient dynamics along a gradient in elevation in the southern Appalachians. Pedobiologia 2003, 47, 231–244. [Google Scholar] [CrossRef]
  30. Bejer, B. The Nun Moth in European Spruce Forests. In Dynamics of Forest Insect Populations, Population Ecology (Theory and Application); Berryman, A.A., Ed.; Springer: Boston, MA, USA, 1988; pp. 211–231. [Google Scholar]
  31. Beule, L.; Grüning, M.M.; Karlovsky, P.; l-M.-Arnold, A. ; Changes of Scots Pine Phyllosphere and Soil Fungal Communities during Outbreaks of Defoliating Insects. Forests 2017, 8, 316. [Google Scholar] [CrossRef]
  32. Lessard, R.; Rochette, P.; Topp, E.; Pattey, E.; Desjardins, R.; Beaumont, G. Methane and carbon fluxes from poorly drained adjacent cultivated and forest sites. Can. J. Soil Sci. 1994, 74, 139–146. [Google Scholar] [CrossRef]
  33. Loftfield, N.; Flessa, H.; Augustin, J.; Beese, F. Automated gas chromatographic system for rapid analysis of the atmospheric trace gases methane, carbon dioxide, and nitrous oxide. J. Environ. Qual. 1997, 26, 560–564. [Google Scholar] [CrossRef]
  34. Heinrichs, H.; Brumsack, H.-J.; Loftfield, N.; König, N. Verbessertes Druckaufschlußsystem für biologische und anorganische Materialien. J. Soil Sci. Plant Nutr. 1986, 149, 350–353. [Google Scholar] [CrossRef]
  35. R Core Team. R: A Language and Environment for Statistical Computing, R Foundation for Statistical Computing, Vienna, Austria. 2017. Available online: https://www.r-project.org (accessed on 10 August 2018).
  36. Christenson, L.M.; Lovett, G.M.; Mitchell, M.J.; Groffman, P.M. The fate of nitrogen in gypsy moth frass deposited to an oak forest floor. Oecologia 2002, 131, 444–451. [Google Scholar] [CrossRef] [PubMed]
  37. Fielding, D.J.; Trainor, E.; Zhang, M. Diet influences rates of carbon and nitrogen mineralization from decomposing grasshopper frass and cadavers. Biol. Fertil. Soils. 2013, 49, 537–544. [Google Scholar] [CrossRef]
  38. Baranchicov, Y.N.; Perevoznikova, V.D.; Vishnyakova, Z.V. Carbon Emission by Soils in Forests Damaged by the Siberian Moth. Russ. J. Ecol. 2002, 33, 398–401. [Google Scholar] [CrossRef]
  39. Janssens, I.A.; Dieleman, W.; Luyssaert, S.; Subke, J.-A.; Reichstein, M.; Ceulemans, R.; Ciais, P.; Dolman, A.J.; Grace, J.; Matteucci, G.; et al. Reduction of forest soil respiration in response to nitrogen deposition. Nat. Geosci. 2010, 3, 315–322. [Google Scholar] [CrossRef]
  40. Kaukonen, M.; Ruotsalainen, A.L.; Wöli, P.R.; Männistö, M.L.; Setälä, H.; Saravesi, K.; Huusko, K.; Markkola, A. Moth herbivory enhances resource turnover in subarctic mountain birch forests? Ecology 2013, 94, 267–272. [Google Scholar] [CrossRef] [PubMed] [Green Version]
  41. Grüning, M.M.; Beule, L.; Meyer, S.; Karlovsky, P.; L.M.-Arnold, A. The Abundance of Fungi, Bacteria and Denitrification Genes during Insect Outbreaks in Scots Pine Forests. Forests 2018, 9, 497. [Google Scholar] [CrossRef]
  42. Brady, N.C.; Weil, R.R. The Nature and Properties of Soils, 11th ed.; Prentice Hall: Upper Saddle River, NJ, USA, 1996; p. 740, ISBN-10: 1292162236. [Google Scholar]
  43. Sinsabaugh, R.L. Phenol oxidase, peroxidase and organic matter dynamics of soil. Soil Biol. Biochem. 2010, 42, 391–404. [Google Scholar] [CrossRef]
  44. Jungkunst, H.F.; Fiedler, S.; Stahr, K. N2O emissions of a mature Norway spruce (Picea abies) stand in the Black Forest (southwest Germany) as differentiated by the soil pattern. J. Geophys Res. 2004, 109, D07302. [Google Scholar] [CrossRef]
  45. Butterbach-Bahl, K.; Baggs, E.M.; Dannenmann, M.; Kiese, R.; Zechmeister-Boltenstern, S. Nitrous oxide emissions from soils: How well do we understand the processes and their controls? Phil. Trans. R. Soc. B. 2013, 368, 20130122. [Google Scholar] [CrossRef] [PubMed]
  46. Jung, P.; Lunderstädt, J. Effect of feces from pine-fed larvae of Dendrolimus pini L. (Lep., Lasiocampidae) on the germination and development of pine, birch and oak seeds. J. Appl. Ent. 2000, 124, 253–258. [Google Scholar] [CrossRef]
  47. Riek, W.; Stähr, F. Eigenschaften Typischer Waldböden im Nordostdeutschen Tiefland unter Besonderer Berücksichtigung des Landes Brandenburg. Hinweise für die Waldbewirtschaftung; Eberswalder Forstliche Schriftenreihe, Ministerium für ländliche Entwicklung, Umwelt und Verbraucherschutz des Landes Brandenburg: Eberswalde, Germany, 2004; Volume 19, pp. 1–180. [Google Scholar]
  48. Groffman, P.M.; Butterbach-Bahl, K.; Fulweiler, R.W.; Gold, A.J.; Morse, J.L.; Stander, E.K.; Tague, C.; Tonitto, C.; Vidon, P. Challenges to incorporating spatially and temporally explicit phenomena (hotspots and hot moments). Biogeochemistry 2009, 93, 49–77. [Google Scholar] [CrossRef]
  49. Aber, J.; McDowell, W.; Nadelhoffer, K.; Magill, A.; Berntson, G.; Kamakea, M.; McNulty, S.; Currie, W.; Rustad, L.; Fernandez, I. Nitrogen Saturation in Temperate Forest Ecosystems: Hypotheses revisited. BioScience 1998, 48, 921–934. [Google Scholar] [CrossRef]
  50. Stevenson, F.J.; Cole, M.A. Cycles of Soils: Carbon, Nitrogen, Phosphorus, Sulfur, Micronutrients, 2nd ed.; Wiley: Hoboken, NJ, USA, 1999; p. 448. ISBN 978-0-471-32071-5. [Google Scholar]
  51. Kosola, K.R.; Dickmann, D.I.; Parry, E.A.; Parry, D. Repeated insect defoliation effects on growth, nitrogen acquisition, carbohydrates, and root demography of poplars. Oecologia 2001, 129, 65–74. [Google Scholar] [CrossRef] [PubMed]
  52. Simmons, M. J.; Lee, T. D.; Ducey, M. J.; Elkinton, J. S.; Boettner, G. H.; Dodds, K. J. Effects of Invasive Winter Moth Defoliation on Tree Radial Growth in Eastern Massachusetts, USA. Insects 2004, 5, 301–318. [Google Scholar] [CrossRef] [PubMed]
  53. Ayres, M.P.; Lombardero, M.J. Assessing the consequences of global change for forest disturbance from herbivores and pathogens Sci. Total Environ. 2000, 262, 263–286. [Google Scholar] [CrossRef]
  54. Dale, V.H.; Joyce, L.A.; McNulty, S.; Neilson, R.P.; Ayres, M.P.; Flannigan, M.D.; Hanson, P.J.; Irland, L.C.; Lugo, A.E.; Peterson, C.J.; et al. Climate change and forest disturbances. BioScience 2001, 51, 723–734. [Google Scholar] [CrossRef]
  55. Flower, C.E.; Gonzales-Meler, M.A. Responses of temperate forest productivity to insect and pathogen disturbances. Ann. Rev. Plant. Biol. 2015, 66, 547–569. [Google Scholar] [CrossRef] [PubMed]
  56. Wenk, M.; Apel, K.H. Die Regenerationsfähigkeit von durch Fraß des Kiefernspinners (Dendrolimus pini L.) und der Nonne (Lymantria monacha L.) geschädigten Kiefernbeständen in Brandenburg. In Die Kiefer im nordostdeutschen Tiefland—Ökologie und Bewirtschaftung, Kätzel, R., Möller, K., Löffler, S., Engel, J., Liero, K., Eds.; Eberswalder Forstliche Schriftenreihe; Ministerium für ländliche Entwicklung, Umwelt und Verbraucherschutz des Landes Brandenburg: Eberswalde, Germany, 2007; Volume 32, pp. 280–287. [Google Scholar]
  57. Mitton, J.B.; Ferrenberg, S.M. Mountain Pine Beetle Develops an Unprecedented Summer Generation in Response to Climate Warming. Am. Nat. 2012, 179, E163–E171. [Google Scholar] [CrossRef] [PubMed]
Figure 1. CO2-C emissions (mg m−2 h−1) from the mineral soil during an outbreak of the nun moth (Lymantria monacha L.) in 2013 and 2014, and the adjacent noninfested control of Scots pine (Pinus sylvestris L.) forest sites. Infested = red, noninfested = green, Aug = August, Sep = September, Oct = October, Mar = March, Jun = June, Jul = July. Box plots show means (dotted lines) and medians (solid lines) (n = 9 in 2013 and 15 in 2014 for each plot). Whisker extension equals 1.5 times interquartile range distance. Asterisks indicate significant differences between infested and control plots within one sampling time (paired Wilcoxon signed-rank tests, p ≤ 0.050).
Forests 09 00612 g001
Figure 2. N2O-N emissions (µg m−2 h−1) from the mineral soil during an outbreak of the nun moth (Lymantria monacha L.) in 2013 and 2014 and the adjacent noninfested control of Scots pine (Pinus sylvestris L.) forest sites. Infested = red, noninfested = green, Aug = August, Sep = September, Oct = October, Mar = March, Jun = June, Jul = July. Box plots show means (dotted lines) and medians (solid lines) (n = 9 in 2013 and 15 in 2014 for each plot). Whisker extension equals 1.5 times interquartile range distance. Asterisks indicate significant differences between infested and control plots within one sampling time (paired Wilcoxon signed-rank tests, p ≤ 0.050).
Forests 09 00612 g002
Figure 3. Accumulated CO2-C flux (mg h−1) of the incubators with treatments of feces from the pine-tree lappet (Denrolimus pini L.), feces plus Scots pine (Pinus Sylvestris L.) needle litter, needle litter, and a control with soil only during the 31 days of the incubation experiment. Treatments were added on day 7 with n = 5. A total of 12 measurements per day were conducted.
Forests 09 00612 g003
Figure 4. Accumulated N2O-N flux (µg h−1) of the incubators with treatments of feces from the Pine-tree lappet (Denrolimus pini L.), feces plus Scots pine (Pinus Sylvestris L.) needle litter, needle litter, and a control with soil only during the 31 days of the incubation experiment. Treatments were added on day 7 with n = 5. A total of 12 measurements per day were conducted.
Forests 09 00612 g004

