Article

Branch Development of Five-Year-Old Betula alnoides Plantations in Response to Planting Density

1
Research Institute of Tropical Forestry, Chinese Academy of Forestry, Longdong, Guangzhou 510520, China
2
Agricultural College, Shihezi University, Shihezi, Xinjiang 832003, China
3
University of Applied Forest Sciences, Schadenweilerhof, 72108 Rottenburg, Germany
*
Author to whom correspondence should be addressed.
The authors contributed to this work equally.
Forests 2018, 9(1), 42; https://doi.org/10.3390/f9010042
Submission received: 15 November 2017 / Revised: 11 January 2018 / Accepted: 17 January 2018 / Published: 19 January 2018
(This article belongs to the Section Forest Ecology and Management)

Abstract

:
Branch development in the lower part of stem is critical to both early stem growth and wood quality of the most valuable section of tree, and its regulation through planting density has always been greatly concerned. Here the effect of planting density on branch development was examined in a five-year-old plantation of Betula alnoides with six planting densities (625, 833, 1111, 1250, 1667, and 2500 stems per hectare (sph)) in Guangdong Province, South China. Branch quantity (number, proportion, and density), morphology (diameter, length, and angle), position (height and orientation), and branch status (dead or alive) were investigated for 54 dominant or co-dominant trees under six treatments of planting density after the growth of each tree was measured. Factors influencing branch development were also explored by mixed modelling. The results showed that the mean tree heights of 1250 and 1667 sph treatments were higher than those of other planting density treatments. The quantity of live branches decreased with increasing planting density. However, planting density had no significant effect on the number of all branches, and there existed no remarkable difference in branch number and proportion among four orientations. As for branch morphology, only the largest branch diameter had a significantly negative correlation with planting density. In addition, high planting density significantly increased the height of the largest branch within the crown. Mixed effects models indicated that branch diameter, length, and angle were closely correlated with each other, and they were all in positively significant correlation to the branch height at the stem section below six meters. It was concluded that properly increasing planting density will promote natural pruning, improve early branch control, and be beneficial for wood production from the most valuable section of the stem.

1. Introduction

Betula alnoides Buch. Ham. ex D. Don is a valuable deciduous tree species mainly distributed in Southeast Asia and South China. As a fast-growing, high-yield tree species, it has a wide adaptability to soil type, altitude, and climate condition [1]. It has been widely accepted by farmers and many private companies in South China. The planting areas have exceeded more than 150,000 hectares in these areas [2]. The wood of B. alnoides is of moderate density with beautiful texture and less likely to crack and warp. It is normally used for floor and high-grade furniture making, and especially for high-class interior decoration and overlaid veneer [3]. It is well-known that timber quality is very important in these applications [4,5], and the price of high-quality wood of B. alnoides is generally two to three times higher than that of common wood in the local wood market. The production of high-value wood with B. alnoides is, thus, paid more and more attention by forest owners.
Quality grade and value of the timber depend largely on branchiness, as the size and number of branches along the stem influence the development of knots and the occurrence of knot-related defects [2,6,7]. This has also been demonstrated for a large quantity of species with a specific focus on branch and knot development [4,7,8,9,10]. For artificial commercial forests, producing high quality wood should also be economically viable. Thus, high-quality timber production through branch development control under strict economic timeframes is the target for forest managers.
There are numerous factors influencing branch development; for example, nutrient [11,12], genotype [13,14,15], competition [16,17], etc. The main measures regulating branch development, such as artificial pruning [8,18] and stand density control [16,17,19,20,21], have been used in practice for a long time. Planting density may have no effect on early bud formation, but it does influence subsequent growth and persistence of branches, which then affects branch occlusion [21,22,23]. Hence, proper planting density is important for the improvement of timber quality.
In our previous study, we have examined the effect of planting density on branch attributes within crown of mid-aged (14-year-old) B. alnoides [21]. Niemistö [24] and Mäkinen [19] also studied the influence of planting densities on branch development of 11 to 22-year-old Betula pendula. Umeki and Kikuzawa [25] and Umeki and Seino [26] focused on the population dynamics and growth of first–order branches on Betula platyphylla. However, most of the branches in these studies exceeded eight meters in height along the upper part of the stem, and branch development in the lower part of stem is more deserved to study, because the lower part of stem represented generally up to 90% of future tree value [27]. Furthermore, information on branch development of the most valuable stem section in response to planting density is also still unavailable for B. alnoides. Here, we took five-year-old spacing trial plantations of B. alnoides as an example, in which branches are all concentrated in the most valuable part of stem for future harvesting, to find out relationships between branchiness and planting density. The aims of this study were to test the effect of planting density on branch development and explore potential influencing factors on branch development for young B. alnoides as well as to compare the differences in branch development linked to planting density between young and mid-aged B. alnoides. The study could give a better instruction for determination of optimal planting density and, thus, for high-quality wood production of this species in these regions.

2. Materials and Methods

2.1. Experimental Site and Design

The spacing trial plantation is located at Zhenlongmiao, Xijiang Forest Farm, Yunfu City, Guangdong Province, China (111°53′56″ E, 23°05′01″ N, 430 m altitude). It belongs to the subtropical monsoon climate zone with a mean annual air temperature of 21.6 °C. The extreme minimum and maximum air temperature is 0 °C and 36.2 °C, respectively. The annual precipitation ranges from 1400 mm to 1700 mm, and mainly concentrates from April to September. The mean annual air humidity is about 82%. The density trial plantation was established at a cutover land of Cunninghamia lanceolata in April 2012 with the same clonal seedling form Experimental Center of Tropical Forestry, Chinese Academy of Forestry. Six treatments viz. 2500 (2 m × 2 m, spacing), 1667 (2 m × 3 m), 1250 (2 m × 4 m), 1111 (3 m × 3 m), 833 (3 m × 4 m), and 625 (4 m × 4 m) stems per hectare (sph) were arranged in a randomized complete block design with three replicates. Two replicates lied on an east slope and the other was exposed on a southwest-oriented slope. The mean slope degree is about 25°. Each plot was 0.4 hectare in size.

2.2. Measurements

In March 2017, a subplot (30 m × 30 m) was designed in the middle of each plot to avoid edge-effects. Tree height (H), diameter at breast height (DBH), height to crown base (Hcb), and crown diameter (CW) were measured for all trees in each subplot. Explanations of all abbreviations and symbols in text were given in Table 1. H, Hcb, and CW were measured with telemeter rod (0.1 m), and CW was the horizontal projection of crown in four directions. DBH was measured with steel measuring tape (0.1 cm). Three dominant or co-dominant trees per plot were sampled for further branch measurement. All sampled trees were required to have a single leader, be free of broken tops, wood damage, obvious insect attack, and disease. Furthermore, the sampled trees were also completely surrounded by healthy trees in all directions.
The number of dead (NDB) and live (NLB) branches on each sampled tree were counted from the first live branch to the top of the tree. Dead branches were defined as those without green leaves and with evidence of desiccation, as well as branch stubs that had not been completely occluded. Branch density was the mean number of branches per meter along the stem in crown. All live branches with branch height lower than 6 meters on each sampled tree were numbered and marked with plastic cards. The following attributes of the live branches were measured: the branch height (BH), branch length (BL), branch diameter (BD), branch angle (BA) and branch orientation. BH was the height of the joint point of branch and stem above ground. BL was the length from the attachment of the branch on the stem to the top of the branches as a bowstring. Both BH and BL were also measured with telemeter rod. BD was the diameter over bark at branch base and measured by an electronic Vernier caliper (0.01 mm). BA was defined as the vertical intersection angle between branch pith and stem pith, and measured with electronic protractor (1°). Branch orientation was equally separated into four quadrants: east, south, west, and north. A total of 1885 branches were measured from 54 trees (three trees per plot × three plots per treatment × six treatments). All branches on each tree were measured in situ by climbing a telescopic ladder.

2.3. Data Analysis

One-way analysis of variance (ANOVA) and Duncan’s multiple range tests were conducted to explore the differences among planting density treatments for tree attributes at stand level. Due to the hierarchical nature of the data for branch characteristics of the sampled dominant and co-dominant trees, linear mixed-effects models (Equations (1) and (2)) were used to test the significance of difference between treatments for branch attributes at tree and branch level:
ybpt = μ + ρD + λr + λrp + λrpt (tree level)
ybptb = μ + ρD + λr + λrp + λrpt + λrptb (branch level)
where y is a dependent variable, μ is the overall mean, ρD is the effect of planting density; λr, λrp, λrpt, and λrptb are the random effects for block (r), plot (p), tree (t), and branch (b), respectively. Restricted maximum likelihood estimation (REML) was used in the mixed-model analysis, and multiple range tests were performed between treatments with least significant difference (LSD). Since the branch portion was expressed as a proportion, a transformation using the arcsine square root function was performed before analysis.
Regarding model building, generalized linear mixed models (GLMM) were used for count variables (e.g., branch number), and linear mixed models (LMM) were adopted for continuous variables (e.g., BD, BL, etc.). The following strategy was applied for modeling. Firstly, a multiple linear regression analysis was performed for each dependent variable with all available predictive factors involved so as to select candidate descriptors. The candidate predictive variables with statistical significance, reasonable ecological explanation and variance inflation factor (VIF) not larger than three were used for further mixed effects models building. Then all the above selected candidate and random factors (e.g., block, plot and tree effects) were tested using likelihood ratio tests when employing the restricted maximum likelihood estimation during mixed effects model building. Factors were included into models at a significance level of 0.05. If no significant random effect was observed, linear models (LM) or generalized linear models (GLM) were adopted instead. Finally, the models were refitted with above selected fixed and random factors, and the best-fit models were selected from different variance functions mainly on the basis of Akaike’s Information Criterion (AIC) and model simplicity. Parameters were estimated using the restricted maximum likelihood estimation method. For count data, a dispersion parameter Φ was added to the variance function to prevent misinterpretations from inflated or deflated test statistics. Φ was estimated directly in the GLM procedure. For model prediction, the predicted values were corrected using the method proposed by Newman [28].
Model performance was evaluated using root mean squared error (RMSE), which was calculated for each model on the original data scale. The predictive power R2 was also calculated as the squared correlation between observations and predictions for GLM, and marginal R2 ( R m 2 , only the fixed effects) as well as conditional R2 ( R c 2 , both the fixed and random effects) for LMM. Simulation plots based on the fitting models were also presented so as to expressing the relationships between the dependent and all independent variables. All data analyses and modelling were performed using SPSS 21.0 for Windows (IBM-SPSS Inc., Chicago, IL, USA).

3. Results

3.1. Tree Growth Performance

Planting density had no significant effect on diameter at breast height (DBH) in five-year-old plantations of B. alnoides both at stand level and for dominant or co-dominant trees. However, the height to crown base (Hcb) was significantly positively, and crown diameter (CD) negatively, correlated with planting density (Table 2). For dominant and co-dominant trees, there was no significant difference in tree height between planting density treatments, while at the stand level, tree heights of 1250 and 1667 sph treatments were significantly higher than those of other treatments (Table 2).

3.2. Branch Quantity (Number, Proportion, Density)

There was no significant difference in the number of all branches within the crown among six planting density treatments. However, the number, proportion and density of live branches decreased and those of dead branches increased significantly with increasing planting density (Table 3). As for density of all branches, it varied with planting density more complexly. The lowest density of all branches on stem was seen in 1667 sph treatments, which differed significantly from treatments of 625, 833, and 1111 sph, and no remarkable difference was observed between 2500 sph treatment and any of above treatments (Table 3).
Comparing the number and proportion of branches at four orientations, there was no significant difference among four directions for each planting density treatment. Thus, branches within the crown were almost equally divided into four orientations (Table 4).

3.3. Branch Morphology (Diameter, Length, Angle, the Largest Diameter)

Planting density did not significantly affect mean branch diameter, angle, and length for B. alnoides at the age of five years, although there existed an increasing trend for them with decreasing planting density (Table 3). The mean branch diameter, angle, and length ranged from 11.05 to 12.11 mm, 69.0° to 71.9°, and 1.18 to 1.31 m, respectively. Nevertheless, a significant increasing trend of the largest branch was seen with the decrement of planting density. The diameter of the largest branch for 625 sph treatment was significantly larger than those in four treatments of higher planting density (2500, 1667, 1250, and 1111 sph) (Table 3).
Similar to height to crown base, height of the largest branch on stem increased significantly with increasing planting density. The heights of the largest branch for 625 and 833 sph treatments were significantly higher than those for 1250, 1667, and 2500 sph treatments.

3.4. Modeling and Simulation on Branch Attributes

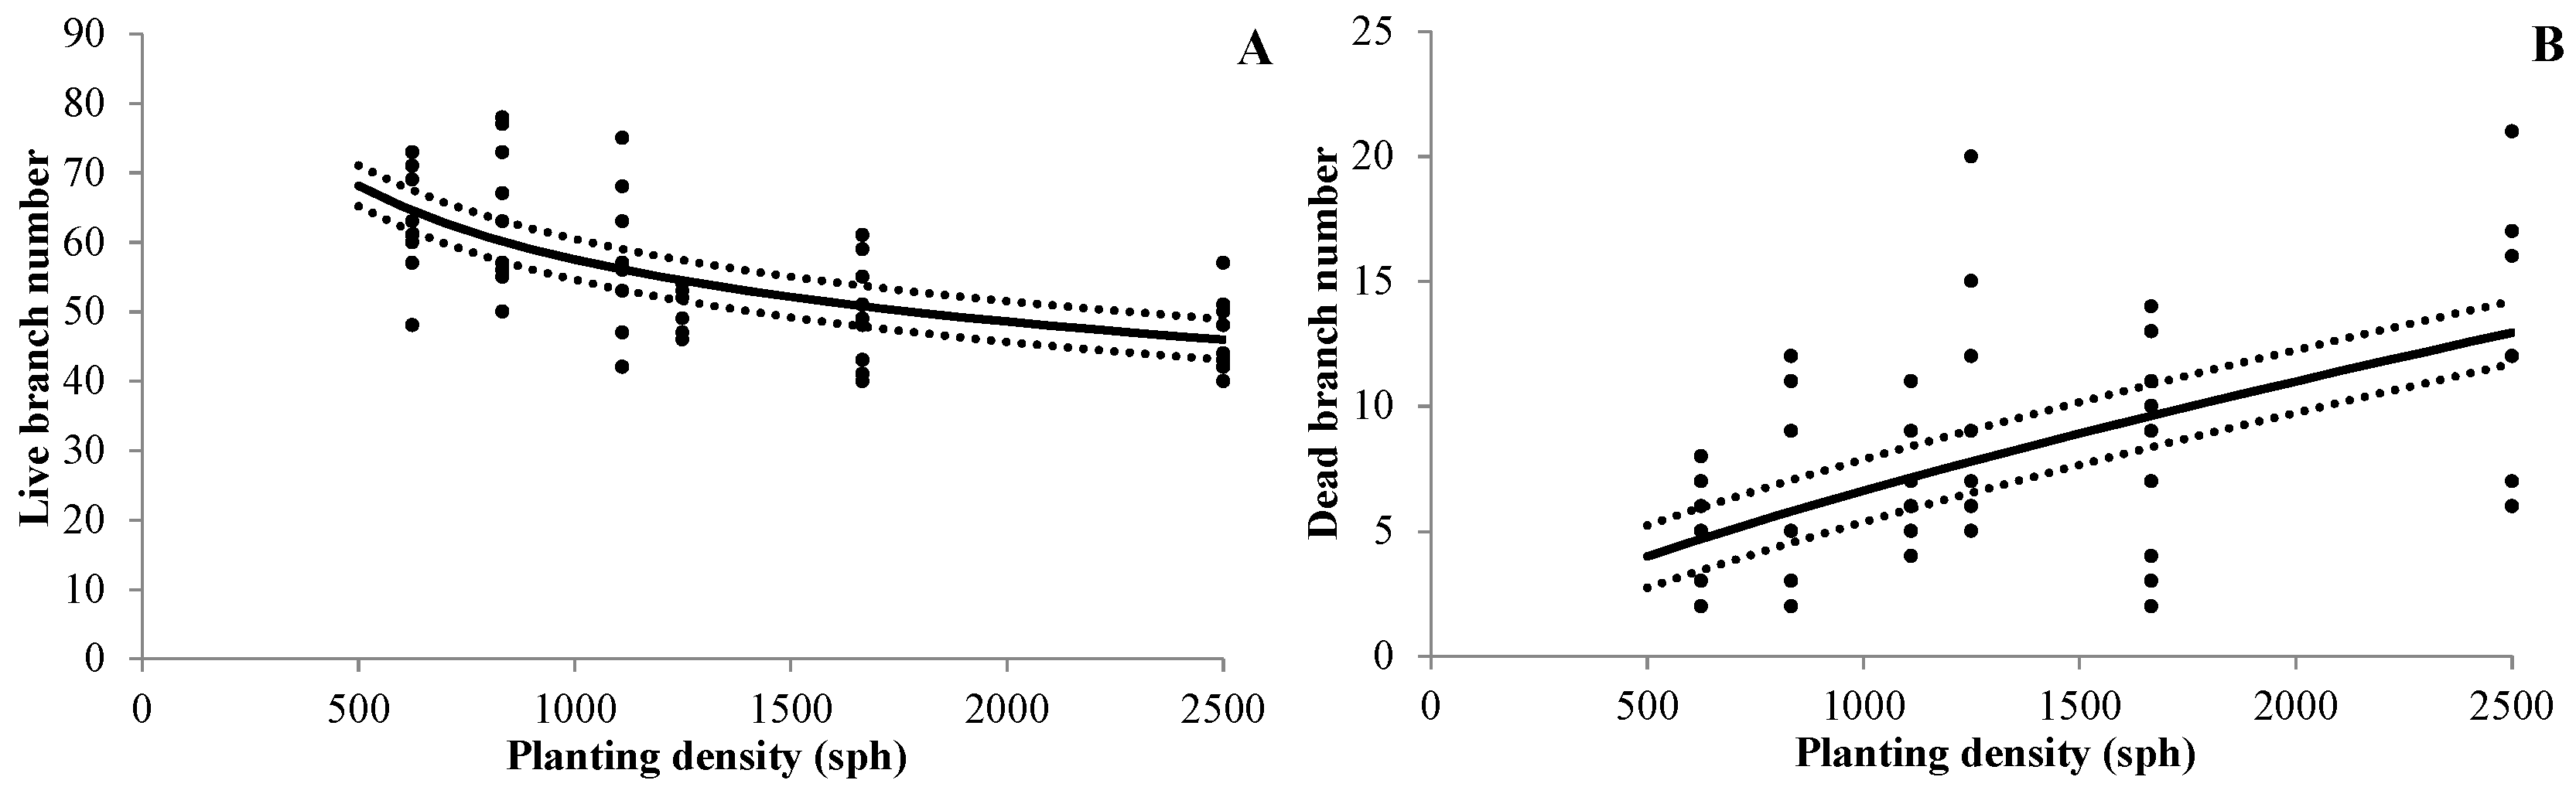
3.4.1. Branch Number

As shown in Table 3, numbers of live (NLB) and dead (NDB) branches were significantly correlated with planting density (PD). In our fitted models, PD was also the only predictive variable for the models of NLB and NDB (Equations (3) and (4)). The equations are as follows:
ln(NLB) = a0 + a1 × ln(PD)
ln(NDB) = b0 + b1 × ln(PD)
Parameter estimates, standard errors and statistical significance of the intercepts and predictors of both equations were presented in Table 5. It was indicated that NLB decreased and NDB increased with planting density from 500 to 2500 sph (Figure 1). However, both models explained a lower proportion of total variance (R2 = 0.368 for NLB, R2 = 0.308 for NDB). The model precision was not high, either (RMSE = 7.9 for NBL, RMSE = 4.1 for NDB).
Due to the fact that no predictor was statistically significant for predicting the number of all branches on the basis of routine measurements, the model is not presented here.

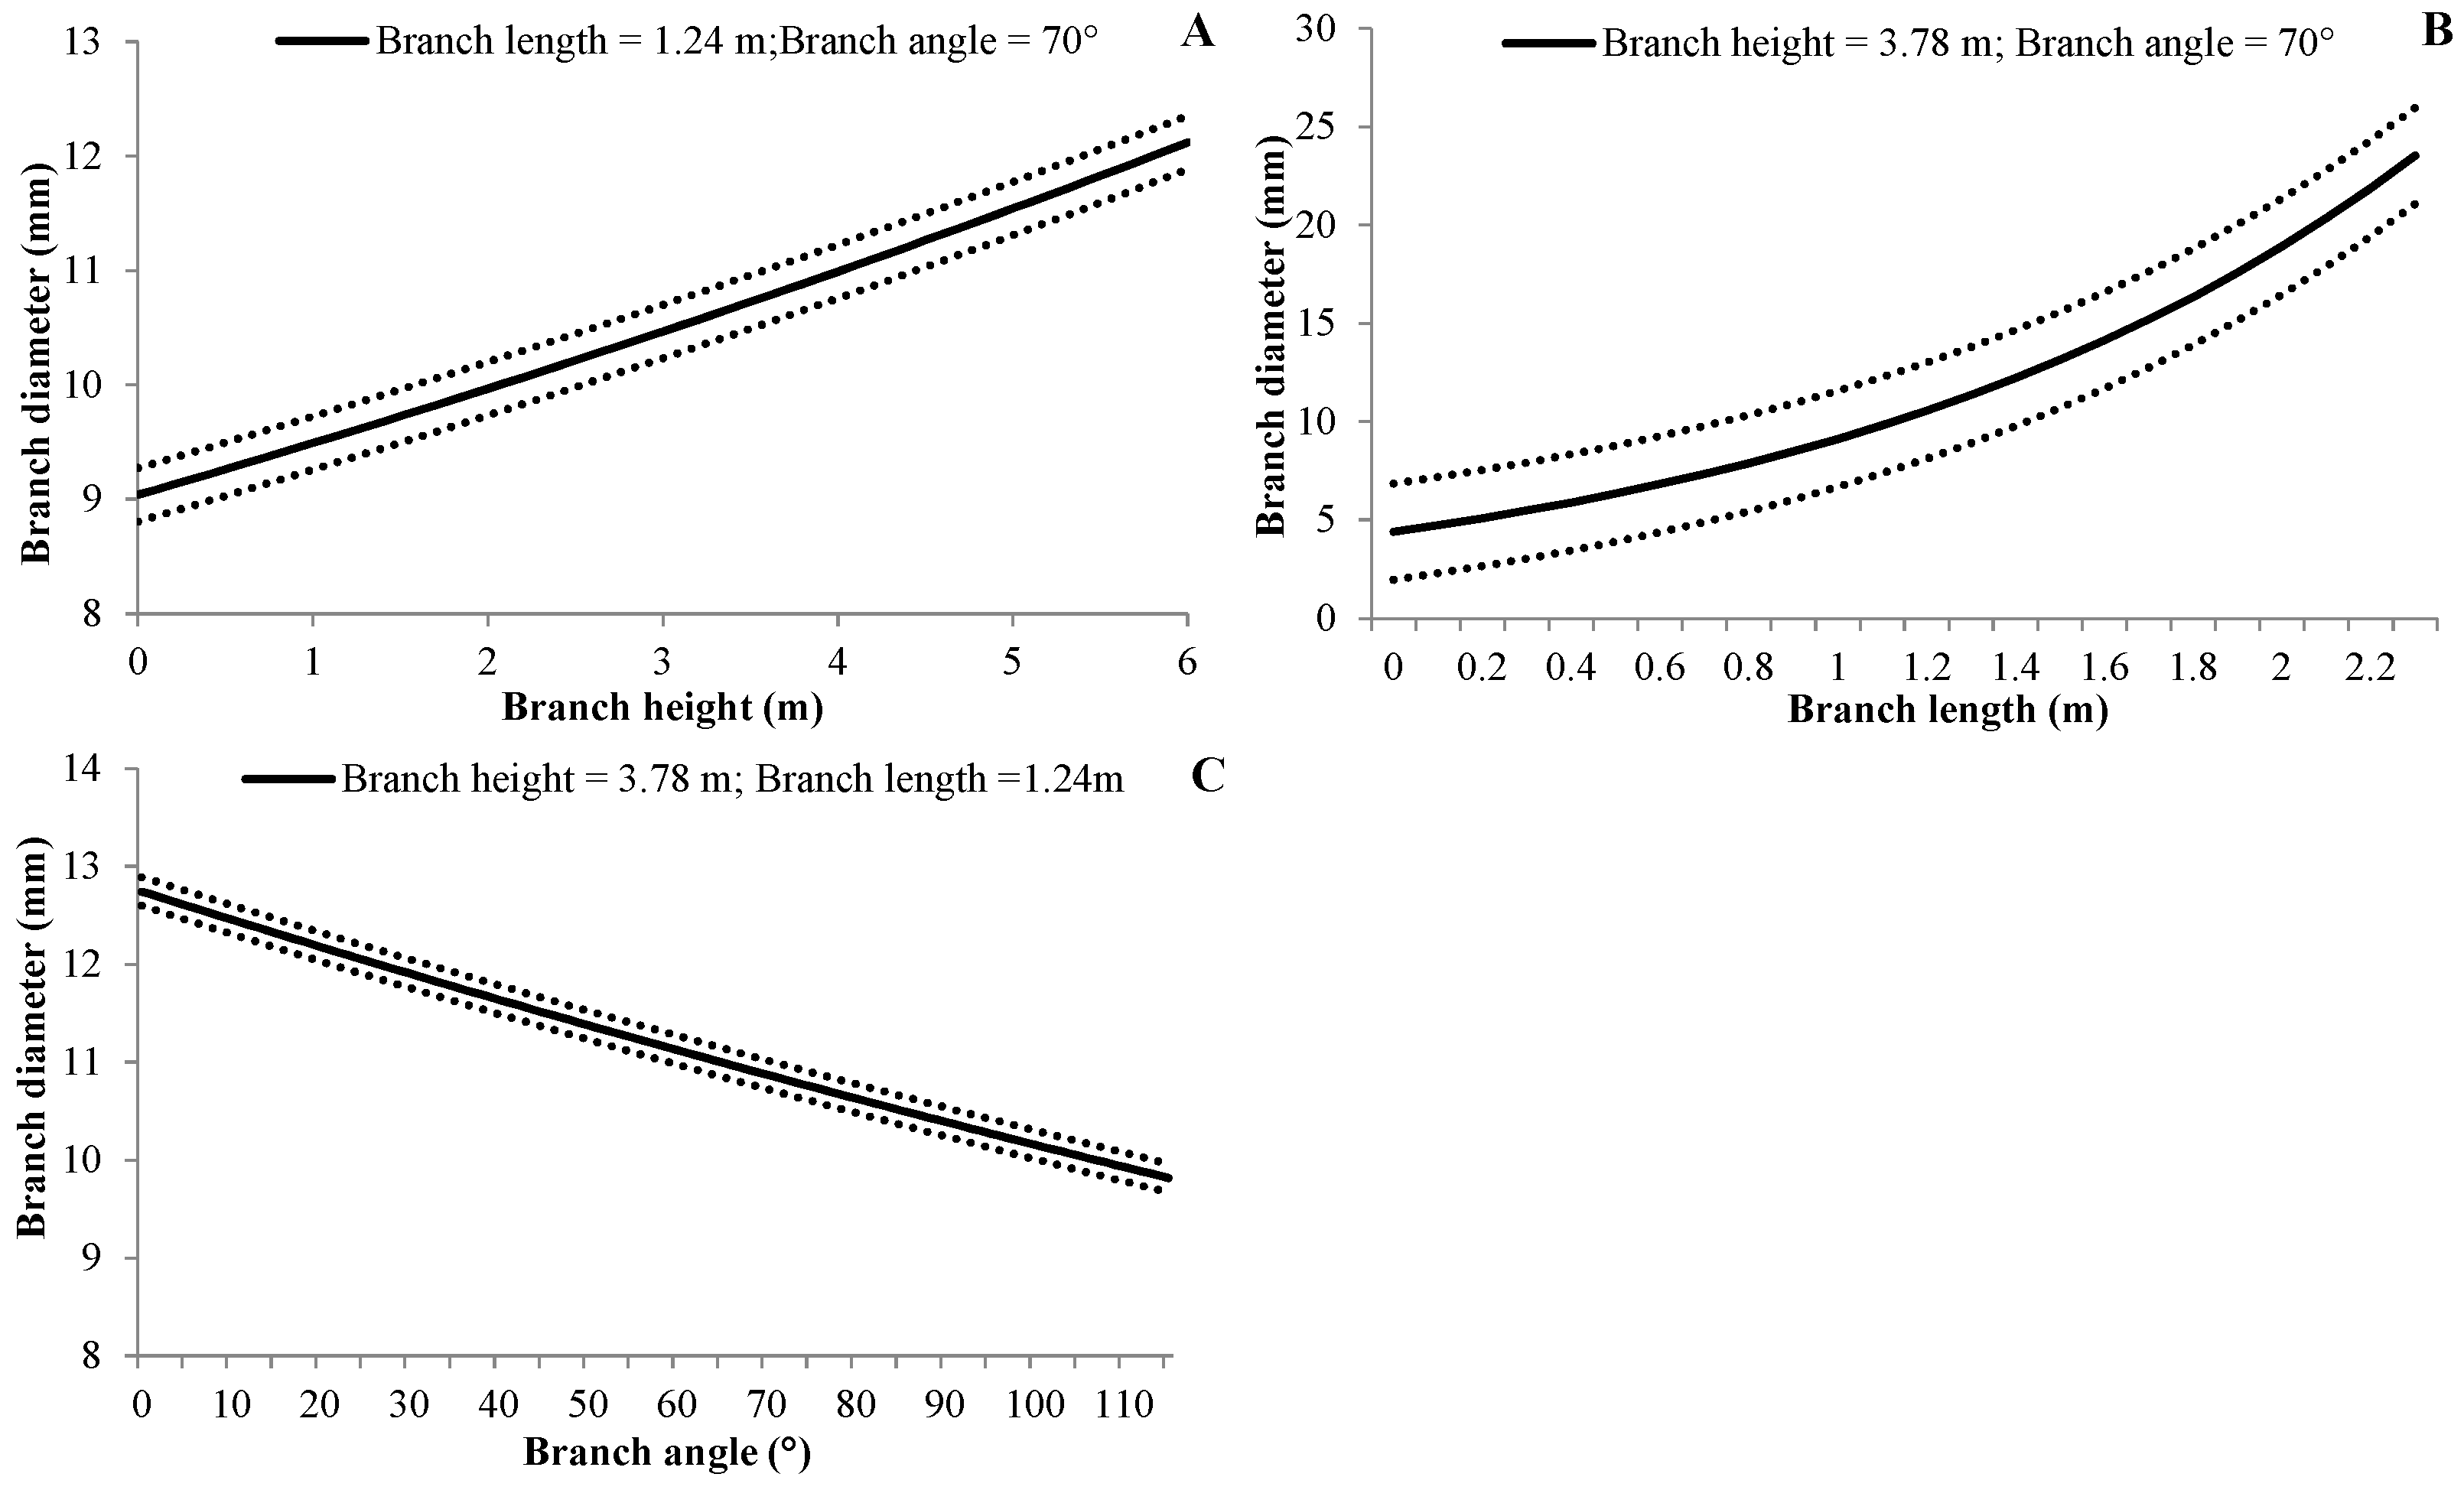
3.4.2. Branch Diameter

Branch diameter (BD) was closely correlated with branch height (BH), length (BL) and angle (BA) (Equation (5)). Parameter estimates, standard errors and statistical significance of the intercepts, fixed and random effects of all the following equations were listed in Table 5.
ln(BD) = c0 + c1 × BH + c2 × BL + c3 × BA + αrp + αrptb
The model prediction indicated that branch diameter was positively correlated with branch height (Figure 2A) and length (Figure 2B), and negatively correlated with branch angle (Figure 2C). Moreover, branch length played more important role than branch height and angle in determining branch diameter over the whole range of our dataset sampled. The present mixed-effects models explained approximately 70% of total variance ( R m 2 = 0.659 , R c   2 = 0.683 ), and performed well (RMSE = 2.18 mm).

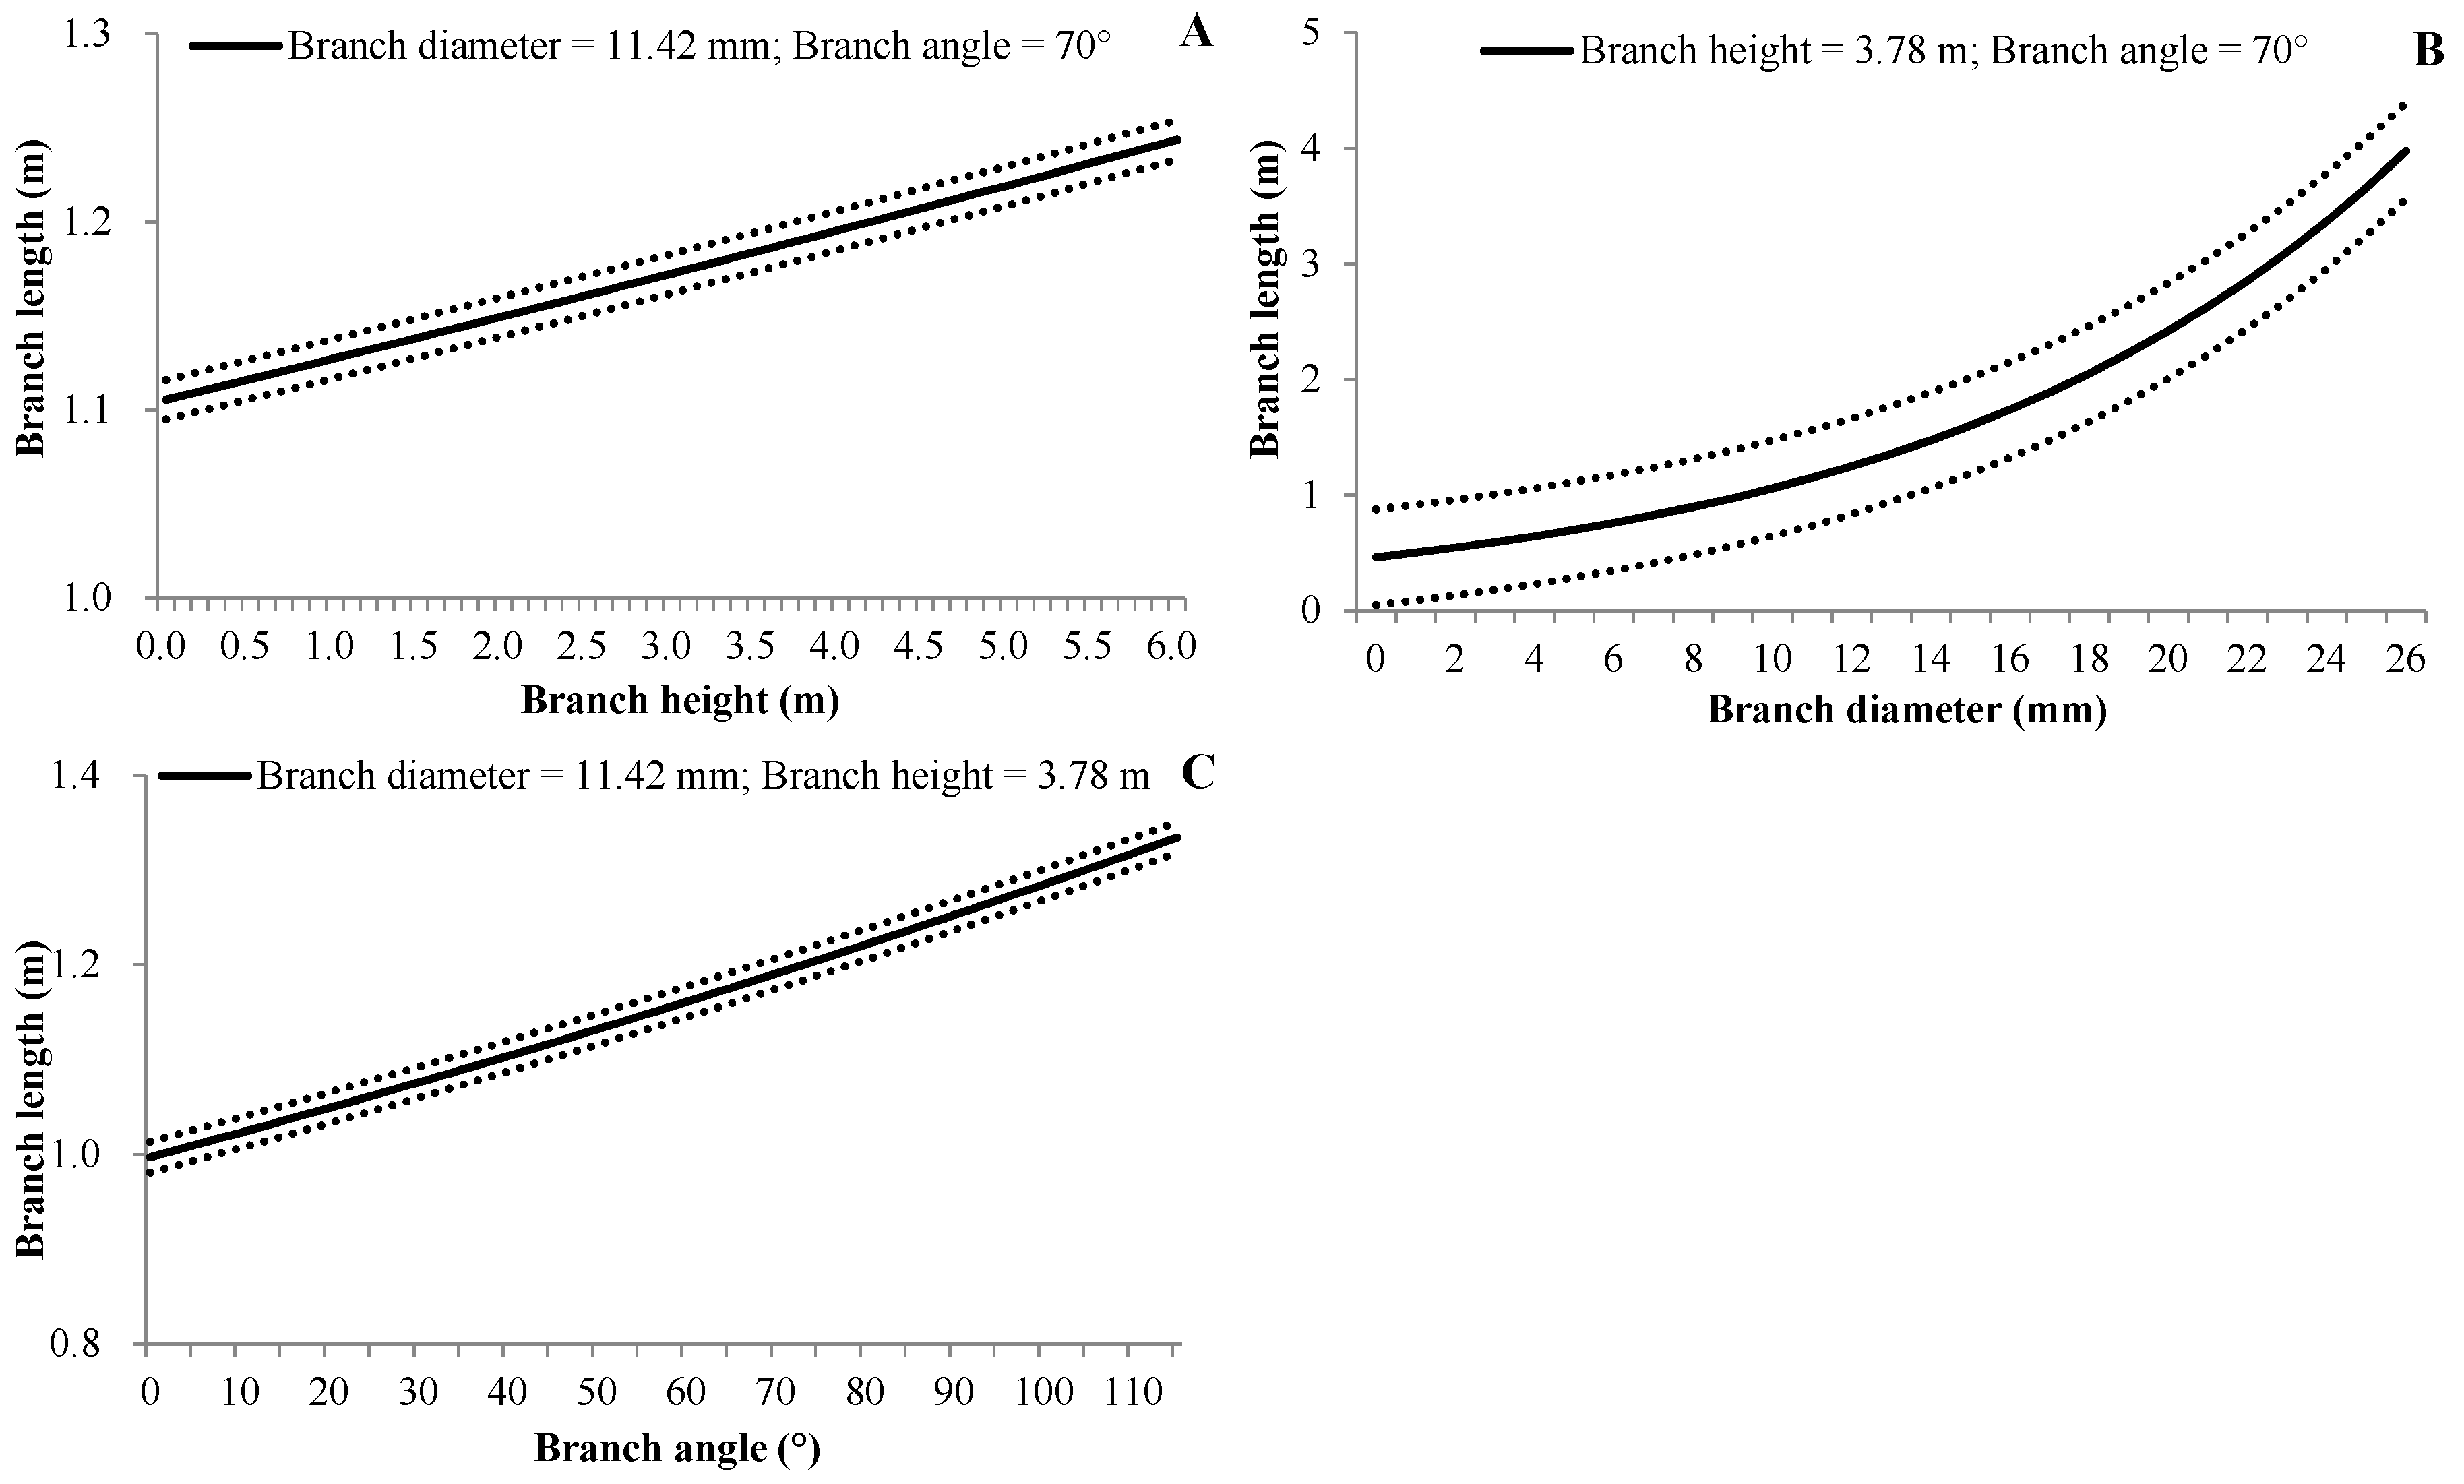
3.4.3. Branch Length
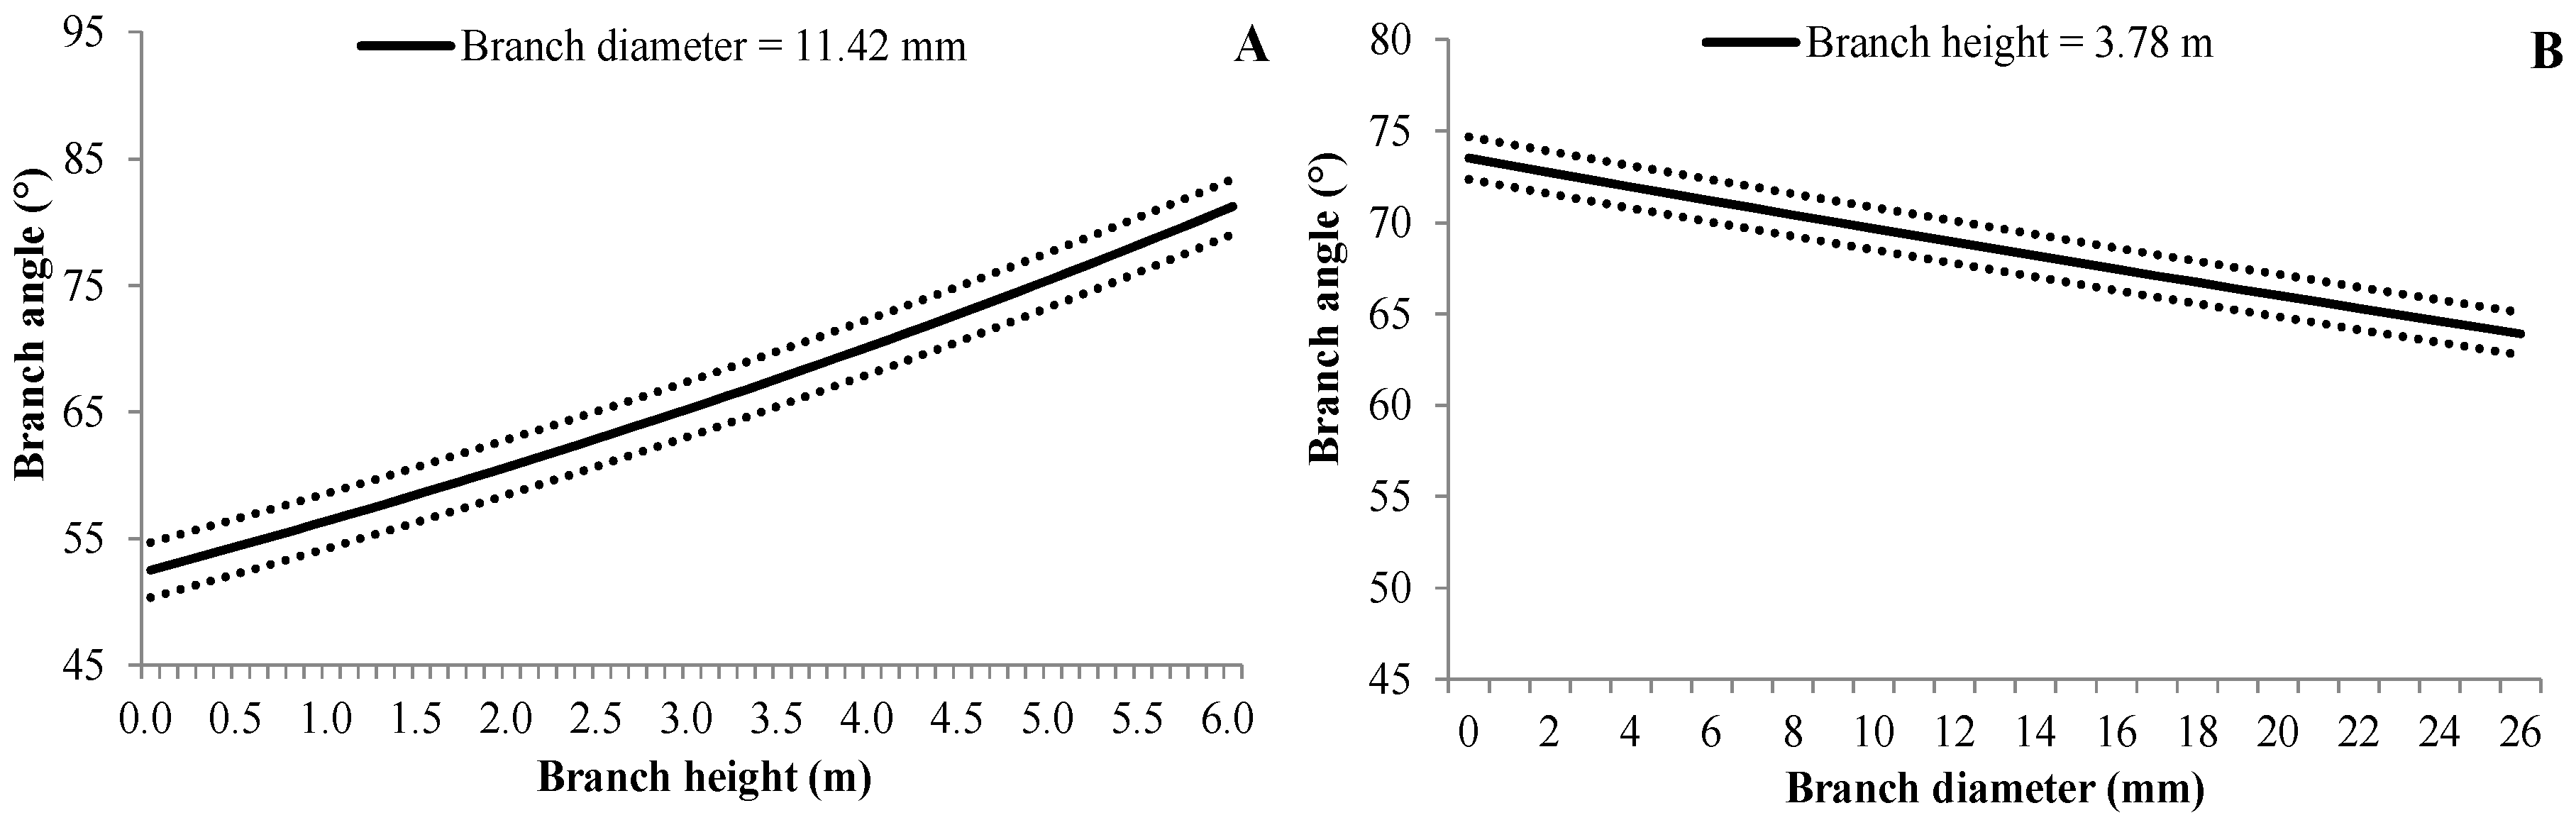
The fitting branch length (BL) model showed that BL was significantly correlated with branch height (BH), diameter (BD) and angle (BA) (Equation (6)):
ln(BL) = d0 + d1 × BH + d2 × BA + d3 × BD + βrp + βrptb
It was indicated from simulated plots based on Equation (6) that branch length increased with the increases of branch height (Figure 3A), diameter (Figure 3B), and angle (Figure 3C) over the whole range of our sampled datasets. Branch diameter played more important role than branch length and angle. The present model also explained a higher proportion of the total variance ( R m 2 = 0.615 , R c 2 = 0.657 ), and provided a good performance in predicting precision (RMSE = 0.25 m).

3.4.4. Branch Angle

In the present study, branch angle was significantly correlated with branch height (BH) and diameter (BD) (Equation (7)):
ln(BA) = e0 + e1 × BH + e2 × BD + γrp + γrptb
As revealed from the simulation plot of branch angle, branch angle increased with the increase of branch height (Figure 4A) and decreased with increasing branch diameter (Figure 4B). The effect of branch height on branch angle was larger than that of branch diameter over the whole range of our sampled datasets. The model only explained really a small portion of the total variation ( R m 2 = 0.056 , R c 2 = 0.153 ), and its precision was also relatively low (RMSE = 12.6°). This inferred that branch angle was codetermined by many other unknown factors.

4. Discussion

4.1. Tree Growth Performance

The increment in height to crown base and the reduction in crown diameter with increasing planting density for young B. alnoides is consistent with previous studies on the spacing and planting density for a number of tree species, such as Cordia alliodora [29], Eucalyptus globulus [30], and Pinus taeda [31], etc. However, due to the fact that the trial plantation has just been established for five years, canopy closure did not occur in the stands with lower planting densities (e.g., 1111, 833, and 625 sph), and for other stands with higher planting density, the canopy had fully closed or had closed only between trees in the same row for a short time, this might lead to the insignificant difference in the diameter at breast height between them. Additionally, the mean stand tree height of 1667 and 1250 sph treatments were significantly higher than that of other treatments. This was different from our previous study on mid-aged B. alnoides in which planting density had no significant effect on the mean stand tree height [21]. This inferred that planting at a proper high density could accelerate early tree height growth of B. alnoides, and this kind of effect would gradually disappear as tree age increased. While for dominant and co-dominant trees, planting density had no significant effect on their height. The results coincided with Alcorn’s [32] study on Eucalyptus pilularis and Eucalyptus cloeziana, where he explained that planting density might affect early tree height growth at stand level, but not for dominant and co-dominant trees.

4.2. Branch Quantity

Branch quantity (number, density) is critical to both quality and quantity of wood production. Here, the number of all branches within crown of five-year-old B. alnoides did not differ significantly among stands with six planting densities. This confirmed the results of our previous study on mid-aged B. alnoides [21]. Kint et al. [27] and Mäkinen and Hein [23] also explained that branch number was under moderate genetic control, and branch formation was not affected by planting density. Our branch distribution of four directions in the present study also proved the above viewpoint, where planting density and orientations had no significant effect on branch distribution.
Although the number of all branches within the crown was not significantly affected by planting density, higher planting density increased the number of dead branches and decreased the quantity of live branches. This is partly in line with relevant studies on E. pilularis and E. cloeziana [32], where the number of live branches on the lower stem (≤5.5 m height) were proved to be negatively correlated with planting density, but planting density had no significant effect on the number of dead branches. In addition, the increasing competition within stands with high planting densities led to the higher proportion and density of dead branches, as well as lower proportion and density of live branches. This was in accordance with study on branches in the lower part (below 5 m) of stem for young Pseudotsuga taxifolia [20]. However, our previous studies on mid-aged B. alnoides showed that densities of live and all branches were positively correlated with planting density [21]. This may be attributed to the differences in size and position height of branches between young and mid-aged B. alnoides. Pinkard and Neilsen also found that branch density of all branches within the crown of seven-year-old Eucalyptus nitens did not vary significantly with planting density from 500 to 1667 sph [33].

4.3. Branch Morphology

Branch morphology, like branch diameter, angle, and length, determines the crown architecture and greatly influences stem growth and knot development [34,35,36]. In the present study, planting density had no significant effect on mean branch diameter and length, and only influenced the diameter of the largest branch. This was partly different from our previous studies on mid-aged B. alnoides [21], as well as studies on B. pendula [24], several Eucalyptus species [9,37,38], and Endospermum medullosum [16]. They all illustrated that mean branch size was significantly negatively correlated with planting density. This might be attributed to the short time of canopy closure, and large variation between branches within each tree might be another explanation for this. With increasing tree age the effect of planting density on mean branch diameter will emerge gradually while, for the largest branch in crown, due to the fact that branches with large diameters were also longer (Figure 3), competition effects between trees appeared firstly on the larger branches. The largest branch on stem may form great knot-related defects after shedding; the height position of the largest branch is, thus, of great concern to forest managers. High planting density promoted natural pruning and also lifted the branch height of the largest branch in the present study. That is to say, the height to the largest branch was closely correlated with the height to crown base. Previous studies on Pseudotsuga menziesii [34,39] also testified the largest branch was located at about the position of a quarter of the lower canopy. In addition, our fitting branch diameter model also showed that branch diameter increased with branch height at the stem section below six meters. Therefore, proper higher planting densities are beneficial for wood quality improvement at the most valuable stem section.
Steep branch angle may increase time of branch stub occlusion, and then cause discoloration and other severe knot-related defects in wood. Planting density appeared to exert little control over mean branch angle in the present study. The result has also been acknowledged by researchers on many tree species with different ages, such as 14-year-old B. alnoides [21], five-year-old Eucalyptus nitens [38], 20-year-old Pinus sylvestris [14], and eight to 60-year-old Pseudotsuga menziesii [34,39,40]. However, it was also showed that angle of live branches became steeper with increasing planting density in Henskens et al.’s study on E. globulus [30] and Alcorn et al.’s study on E. pilularis and E. cloeziana [32]. This might be properly explained from their differences in age, branching habit of species and other compound effects. Branch angle was affected by many factors, and some of them were still not taken into consideration in the related study. This could also be demonstrated from our fitting model on branch angle, which only explained a relatively low total variance, although branch height on stem and branch diameter were statistically significant. The simulation plot based on branch model showed that branch angle increased with increasing branch height over the whole range of our sampled dataset (<6.0 m). On the contrary, Weiskittel et al. illustrated that branch angle of Pseudostuga menziesii decreased with increasing relative height [39]. The striking difference may be due in part to branching habit and crown shape between B. alnoides and P. menziesii, since the crown profile of conifer species is triangular, while broadleaves are oval in general. In addition, branch development was codetermined by some attributes or factors at branch level, e.g., branch status [9,41] and branch age; at individual level, for example tree vigor and social position [26,39]; and at stand level, such as site quality [12,26,39,42]. While in our predicting models on branch attributes, factors at branch level were only taken into account, this led to lower predictive power of the models.

5. Conclusions

Branch attributes were found to be much more sensitive to planting density than diameter at breast height and tree height for five-year-old B. alnoides. Branches may, thus, be seen as early indicators for the onset of horizontal competition among trees. Planting at a proper high density (e.g., 1250 or 1667 sph) could observably promote early tree height growth and increased the number, proportion, and density of dead branches within the crown. Orientation had no obvious effect on branch distribution for each planting density. Since canopy closure did not occur for a long time in the present B. alnoides plantations for higher planting densities (e.g., 2500, 1667, and 1250 sph) and large variations of values for branch attributes within a tree, planting density did not significantly influence the mean diameter and length of branches below 6 m in the crown. Only the size and height of the largest branch, which was commonly concerned for the wood quality at lower stem section, negatively correlated with planting density. Owing to relationships between branch attributes (e.g., branch number, diameter, length, angle, etc.) and planting density were highly dependent on time (e.g., tree age, branch age), monitoring, and highlighting branch development in response to planting density with time is, thus, more helpful for branch development regulation. This is also our central focus in future investigations. In addition, due to the fact that our fitting models on branch attributes were mainly based on routine measurements of nearly 2000 branches from 54 trees (nine trees per treatment) at branch level, some models did not perform well and had some limitations in practice. Nonetheless, the findings of the present study still can be applied in fine-tuning the current strategies for management of B. alnoides plantations, and be used as reference in the practices for high-quality timber production of other valuable tree species in tropical and sub-tropical regions.

Acknowledgments

The authors would like to thank Xijiang Forest Farm for providing the experimental site. This work was financially supported by the Natural Science Foundation of Guangdong Province (2016A030310008), the National Natural Science Foundation of China (31600501) and the Natural Key Research and Development Program of China (2016YFD0600604).

Author Contributions

Jie Zeng, Cheng Tang, and Chun-Sheng Wang designed the experiment. Chun-Sheng Wang, Zhi-Gang Zhao, and Jun-Jie Guo performed the experiments and collected the data. Chun-Sheng Wang and Sebastian Hein analyzed the data. Chun-Sheng Wang, Cheng Tang, Sebastian Hein, and Jie Zeng contributed to writing the manuscript.

Conflicts of Interest

The authors declare no conflict of interest.

References

  1. Zeng, J.; Zheng, H.S.; Weng, Q.J. Betula alnoides—A valuable tree species for tropical and warm-subtropical areas. For. Farm Commun. Tree Res. Rep. 1999, 4, 60–63. [Google Scholar]
  2. Wang, C.S.; Hein, S.; Zhao, Z.G.; Guo, J.J.; Zeng, J. Branch occlusion and discoloration of Betula alnoides under artificial and natural pruning. For. Ecol. Manag. 2016, 375, 200–210. [Google Scholar] [CrossRef]
  3. Zeng, J.; Zou, Y.P.; Bai, J.Y.; Zheng, H.S. RAPD analysis of genetic variation in natural populations of Betula alnoides from Guangxi, China. Euphytica 2003, 134, 33–41. [Google Scholar] [CrossRef]
  4. Mäkinen, H.; Verkasalo, E.; Tuimala, A. Effects of pruning in Norway spruce on tree growth and grading of sawn boards in Finland. Forestry 2014, 87, 417–424. [Google Scholar] [CrossRef]
  5. Macdonald, E.; Hubert, J. A review of the effects of silviculture on timber quality of Sitka spruce. Forestry 2002, 75, 107–138. [Google Scholar] [CrossRef]
  6. Dănescu, A.; Ehring, A.; Bauhus, J.; Albrecht, A.; Hein, S. Modelling discoloration and duration of branch occlusion following green pruning in Acer pseudoplatanus and Fraxinus excelsior. For. Ecol. Manag. 2015, 335, 87–98. [Google Scholar] [CrossRef]
  7. Hein, S. Knot attributes and occlusion of naturally pruned branches of Fagus sylvatica. For. Ecol. Manag. 2008, 256, 2046–2057. [Google Scholar] [CrossRef]
  8. Seeling, U.; Reck, P.; Becker, G.; Bücking, M. Quality of veneer and sawn timber, produced of pruned, high dimension Norway spruce trees with long crowns. Forst Holz 2004, 59, 63–68. [Google Scholar]
  9. Kearney, D.; James, R.; Montagu, K.; Smith, R.G.B. The effect of initial planting density on branching characteristics of Eucalyptus pilularis and E. grandis. Aust. For. 2007, 70, 262–268. [Google Scholar] [CrossRef]
  10. Wang, C.S.; Zhao, Z.G.; Hein, S.; Zeng, J.; Schuler, J.; Guo, J.J.; Guo, W.F.; Zeng, J. Effect of planting density on knot attributes and branch occlusion of Betula alnoides under natural pruning in southern China. Forests 2015, 6, 1343–1361. [Google Scholar] [CrossRef]
  11. DeBell, J.D.; Tappeiner, I.; John, C.; Krahmer, R.L. Branch diameter of western hemlock: Effects of precommercial thinning and implications for log grades. West. J. Appl. For. 1994, 9, 88–90. [Google Scholar]
  12. Mäkinen, H.; Saranpää, P.; Linder, S. Effect of nutrient optimization on branch characteristics in Picea abies (L.) Karst. Scand. J. For. Res. 2001, 16, 354–362. [Google Scholar] [CrossRef]
  13. Clair, J.B.S. Genetic variation in tree structure and its relation to size in Douglas-fir. II. Crown form, branch characters, and foliage characters. Can. J. For. Res. 1994, 24, 1236–1247. [Google Scholar] [CrossRef]
  14. Gort, J.; Zubizarreta-Gerendiain, A.; Peltola, H.; Kilpeläinen, A.; Pulkkinen, P.; Jaatinen, R.; Kellomäki, S. Differences in branch characteristics of Scots pine (Pinus sylvestris L.) genetic entries grown at different spacing. Ann. For. Sci. 2010, 67, 750. [Google Scholar] [CrossRef]
  15. Lowell, E.C.; Maguire, D.A.; Briggs, D.G.; Turnblom, E.C.; Jayawickrama, K.J.; Bryce, J. Effects of silviculture and genetics on branch/knot attributes of coastal Pacific Northwest Douglas-fir and implications for wood quality—a synthesis. Forests 2014, 5, 1717–1736. [Google Scholar] [CrossRef]
  16. Glencross, K.; Nichols, J.D.; Grant, J.C.; Sethy, M.; Smith, R.G.B. Spacing affects stem form, early growth and branching in young whitewood (Endospermum medullosum) plantations in Vanuatu. Int. For. Rev. 2012, 14, 442–451. [Google Scholar] [CrossRef]
  17. Briggs, D.; Ingaramo, L.; Turnblom, E. Number and diameter of breast-height region branches in a Douglas-fir spacing trial and linkage to log quality. For. Prod. J. 2007, 57, 28–34. [Google Scholar]
  18. Víquez, E.; Pérez, D. Effect of pruning on tree growth, yield, and wood properties of Tectona grandis plantations in Costa Rica. Silva Fenn. 2005, 39, 381–390. [Google Scholar] [CrossRef]
  19. Mäkinen, H. Effect of stand density on the branch development of silver birch (Betula pendula Roth) in central Finland. Trees-Struct. Funct. 2002, 16, 346–353. [Google Scholar]
  20. Newton, M.; Lachenbruch, B.; Robbins, J.M.; Cole, E.C. Branch diameter and longevity linked to plantation spacing and rectangularity in young Douglas-fir. For. Ecol. Manag. 2012, 266, 75–82. [Google Scholar] [CrossRef]
  21. Wang, C.S.; Zeng, J.; Hein, S.; Zhao, Z.G.; Guo, J.J.; Zeng, J. Crown and branch attributes of mid-aged Betula alnoides plantations in response to planting density. Scand. J. For. Res. 2017, 32, 679–687. [Google Scholar] [CrossRef]
  22. Hein, S.; Mäkinen, H.; Yue, C.; Kohnle, U. Modelling branch characteristics of Norway spruce from wide spacings in Germany. For. Ecol. Manag. 2007, 242, 155–164. [Google Scholar] [CrossRef]
  23. Mäkinen, H.; Hein, S. Effect of wide spacing on increment and branch properties of young Norway spruce. Eur. J. For. Res. 2006, 125, 239–248. [Google Scholar] [CrossRef]
  24. Niemistö, P. Influence of initial spacing and row-to-row distance on the crown and branch properties and taper of silver birch (Betula pendula). Scand. J. For. Res. 1995, 10, 235–244. [Google Scholar] [CrossRef]
  25. Umeki, K.; Kikuzawa, K. Patterns in individual growth, branch population dynamics, and growth and mortality of first-order branches of Betula platyphylla in northern Japan. Ann. For. Sci. 2000, 57, 587–598. [Google Scholar] [CrossRef]
  26. Umeki, K.; Seino, T. Growth of first-order branches in Betula platyphylla saplings as related to the age, position, size, angle, and light availability of branches. Can. J. For. Res. 2003, 33, 1276–1286. [Google Scholar] [CrossRef]
  27. Kint, V.; Hein, S.; Campioli, M.; Muys, B. Modelling self-pruning and branch attributes for young Quercus robur L. and Fagus sylvatica L. trees. For. Ecol. Manag. 2010, 260, 2023–2034. [Google Scholar] [CrossRef]
  28. Newman, M.C. Regression analysis of log-transformed data: Statistical bias and its correction. Environ. Toxicol. Chem. 1993, 12, 1129–1133. [Google Scholar] [CrossRef]
  29. Hummel, S. Height, diameter and crown dimensions of Cordia alliodora associated with tree density. For. Ecol. Manag. 2000, 127, 31–40. [Google Scholar] [CrossRef]
  30. Henskens, F.L.; Battaglia, M.; Cherry, M.L.; Beadle, C.L. Physiological basis of spacing effects on tree growth and form in Eucalyptus globulus. Trees-Struct Funct. 2001, 15, 365–377. [Google Scholar] [CrossRef]
  31. Akers, M.K.; Kane, M.; Zhao, D.; Teskey, R.O.; Daniels, R.F. Effects of planting density and cultural intensity on stand and crown attributes of mid-rotation loblolly pine plantations. For. Ecol. Manag. 2013, 310, 468–475. [Google Scholar] [CrossRef]
  32. Alcorn, P.J.; Pyttel, P.; Bauhus, J.; Smith, R.G.B.; Thomas, D.; James, R.; Nicotra, A. Effects of initial planting density on branch development in 4-year-old plantation grown Eucalyptus pilularis and Eucalyptus cloeziana trees. For. Ecol. Manag. 2007, 252, 41–51. [Google Scholar] [CrossRef]
  33. Pinkard, E.; Neilsen, W. Crown and stand characteristics of Eucalyptus nitens in response to initial spacing: Implications for thinning. For. Ecol. Manag. 2003, 172, 215–227. [Google Scholar] [CrossRef]
  34. Hein, S.; Weiskittel, A.R.; Kohnle, U. Branch characteristics of widely spaced Douglas-fir in south-western Germany: Comparisons of modelling approaches and geographic regions. For. Ecol. Manag. 2008, 256, 1064–1079. [Google Scholar] [CrossRef]
  35. Forrester, D.I.; Collopy, J.J.; Beadle, C.L.; Baker, T.G. Interactive effects of simultaneously applied thinning, pruning and fertiliser application treatments on growth, biomass production and crown architecture in a young Eucalyptus nitens plantation. For. Ecol. Manag. 2012, 267, 104–116. [Google Scholar] [CrossRef]
  36. Nelson, A.S.; Weiskittel, A.R.; Wagner, R.G. Development of branch, crown, and vertical distribution leaf area models for contrasting hardwood species in Maine, USA. Trees-Struct. Funct. 2014, 28, 17–30. [Google Scholar] [CrossRef]
  37. Kearney, D. Characterisation of Branching Patterns, Changes Caused by Variations in Initial Stocking and Implications for Silviculture, for E. grandis and E. pilularis Plantations in the North Coast Region of NSW. Bachelor’s Thesis, Department of Forestry, The Australian National University, Canberra, Australia, 1999. [Google Scholar]
  38. Neilsen, W.A.; Gerrand, A.M. Growth and branching habit of Eucalyptus nitens at different spacing and the effect on final crop selection. For. Ecol. Manag. 1999, 123, 217–229. [Google Scholar] [CrossRef]
  39. Weiskittel, A.R.; Maguire, D.A.; Monserud, R.A. Modeling crown structural responses to competing vegetation control, thinning, fertilization, and Swiss needle cast in coastal Douglas-fir of the Pacific Northwest, USA. For. Ecol. Manag. 2007, 245, 96–109. [Google Scholar] [CrossRef]
  40. Hein, S.; Weiskittel, A.R.; Kohnle, U. Effect of wide spacing on tree growth, branch and sapwood properties of young Douglas-fir [Pseudotsuga menziesii (Mirb.) Franco] in south-western Germany. Eur. J. For. Res. 2008, 127, 481–493. [Google Scholar] [CrossRef]
  41. Florence, R.G. Ecology and Silviculture of Eucalypt Forests; CSIRO: Collingwood, Australia, 2004; p. 413. [Google Scholar]
  42. Alcorn, P.J.; Forrester, D.I.; Rgb, S.; Thomas, D.S.; James, R.N.; Nicotra, A.B.; Bauhus, J. Crown structure and vertical foliage distribution in 4-year-old plantation-grown Eucalyptus pilularis and Eucalyptus cloeziana. Trees-Struct. Funct. 2013, 27, 555–566. [Google Scholar] [CrossRef]
Figure 1. Predicted branch number (solid line) based on simulated equations of live branch (Equation (3); (A)) and dead branch (Equation (4); (B)) with 95% confidence intervals (dashed lines), the solid black spots were the observed data of branch number.
Forests 09 00042 g001
Figure 2. Simulated plots (solid lines) based on marginal model (Equation (5)) for predicting branch diameter with 95% confidence intervals (dashed lines). (A) Predicted branch diameter versus branch height based on mean branch length and angle; (B) predicted branch diameter versus branch length based on mean branch height and angle; and (C) predicted branch diameter versus branch angle based on mean branch height and length.
Forests 09 00042 g002
Figure 3. Simulated plots (solid lines) based on marginal model (Equation (6)) for predicting branch length with 95% confidence intervals (dashed lines). (A) Predicted branch length versus branch height based on mean branch diameter and angle; (B) predicted branch length versus branch diameter based on mean branch height and angle; and (C) predicted branch length versus branch angle based on mean branch height and diameter.
Forests 09 00042 g003
Figure 4. Simulated plots (solid lines) based on marginal model (Equation (7)) for predicting branch angle with 95% confidence intervals (dashed lines). (A) Predicted branch angle versus branch height based on mean branch diameter; and (B) predicted branch angle versus branch diameter based on mean branch angle.
Forests 09 00042 g004
Table 1. Explanation of abbreviations and symbols.
AbbreviationAttributes RepresentPrecision
Stand attributes
PDPlanting density treatments/
Tree attributes
HTree height0.1 m
DBHStem diameter at breast height0.1 cm
HcbHeight to crown base0.1 m
CWCrown diameter0.1 m
NLBNumber of live branches/
NDBNumber of dead branches/
Branch attributes
BDBranch diameter0.01 mm
BLBranch length0.1 m
BABranch angle
BHBranch height0.01 m
Model descriptors
a, b, c, d, eCoefficients of fixed effects and intercepts/
r, rp, rpt, rptbSubscripts for replicate, plot, tree and branch/
α, β, γ, δVariance components (random effects)/
ΦDispersion parameter/
ln()Natural log-link/
RMSERoot mean squared error/
R2(c), R2(m)Conditional and marginal R2/
Table 2. Plot and sampled dominant and co-dominant tree attributes of Betula alnoides. For abbreviations see Table 1.
Planting Density (sph)Spacing (Row × Tree)DBH (cm)H (m)Hcb (m)CD (m)
Stand level6254 m × 4 m6.85 (0.21)a5.16 (0.15)b1.46 (0.06)c3.33 (0.08)a
8334 m × 3 m6.51 (0.13)a5.00 (0.09)b1.40 (0.04)c3.07 (0.06)b
11113 m × 3 m6.70 (0.14)a5.33 (0.11)b1.59 (0.04)bc2.81 (0.05)c
12504 m × 2 m6.65 (0.14)a5.65 (0.10)a1.80 (0.06)ab2.64 (0.05)d
16673 m × 2 m6.93 (0.14)a5.69 (0.12)a1.94 (0.08)a2.63 (0.04)d
25002 m × 2 m6.46 (0.13)a5.21 (0.10)b1.89 (0.11)a2.43 (0.05)e
Sampled dominant and co-dominant trees6254 m × 4 m8.19 (0.48)a7.09 (0.26)a1.48 (0.09)b3.82 (0.15)a
8334 m × 3 m7.70 (0.21)a7.00 (0.28)a1.66 (0.25)ab3.56 (0.09)ab
11113 m × 3 m7.84 (0.28)a6.41 (0.16)a1.67 (0.10)ab3.42 (0.16)ab
12504 m × 2 m7.73 (0.24)a7.46 (0.20)a2.09 (0.09)a3.55 (0.09)ab
16673 m × 2 m7.79 (0.28)a7.46 (0.17)a1.97 (0.15)a3.34 (0.10)bc
25002 m × 2 m8.13 (0.41)a7.62 (0.16)a2.52 (0.19)a3.11 (0.09)c
Note: The number in parentheses is the standard error of mean; totally different letters in the same column indicate significant differences between planting density treatments at the 0.05 level. The data on stand level all met the preconditions of one-way ANOVA on the original scale or after transformation.
Table 3. Summary statistics of main branch attributes for Betula alnoides under six treatments of planting density.
Branch AttributesPlanting Density (sph)
6258331111125016672500
Branch numberLive63 (3)a64 (3)a57 (3)ab51 (1)bc50 (3)bc47 (2)c
Dead5 (1)d6 (1)cd6 (1)cd10 (2)b8 (1)bc13 (2)a
Total68 (3)a70 (3)a64 (4)a61 (2)a58 (2)a61 (2)a
Branch proportionLive0.93 (0.01)a0.92 (0.02)a0.90 (0.01)ab0.84 (0.02)c0.86 (0.03)bc0.78 (0.03)d
Dead0.07 (0.01)d0.08 (0.02)d0.10 (0.01)cd0.16 (0.02)ab0.14 (0.03)bc0.22 (0.03)a
Branch densityLive11.4 (0.9)a12.1 (0.8)a12.1 (0.6)a9.6 (0.5)b9.1 (0.5)b9.4 (0.5)b
Dead0.8 (0.1)d1.0 (0.2)cd1.3 (0.1)cd1.8 (0.3)b1.5 (0.3)bc2.6 (0.3)a
Total12.3 (0.9)a13.2 (0.7)a13.4 (0.6)a11.4 (0.4)b10.6 (0.3)b11.9 (0.4)ab
Branch diameter (mm)12.11 (0.21)a11.21 (0.19)a11.04 (0.21)a11.85 (0.24)a11.05 (0.22)a11.15 (0.25)a
Branch angle (°)71.9 (0.6)a70.3 (0.7)a69.3 (0.7)a69.5 (0.8)a69.2 (1.0)a69.0 (0.9)a
Branch length (m)1.31 (0.02)a1.23 (0.02)a1.21 (0.02)a1.26 (0.02)a1.23 (0.03)a1.18 (0.03)a
The largest branch dimeter (mm)21.75 (0.69)a19.94 (0.64)ab19.05 (1.05)b19.35 (0.47)b18.06 (0.51)b18.45 (0.86)b
Branch height of the largest branch (m)4.00 (0.39)b3.80 (0.26)b4.18 (0.06)ab4.91 (0.28)a4.72 (0.25)a4.90 (0.25)a
Note: The number in parentheses is the standard errors of mean; totally different letters in the same row indicate significant differences between treatments of planting density at the 0.05 level.
Table 4. Summary statistics of branch attributes at four orientations for Betula alnoides under six treatments of planting density.
Branch AttributesPlanting Density (sph)
6258331111125016672500
Branch numberEast12 (1)11 (1)10 (1)10 (0)7 (1)7 (1)
South11 (1)13 (1)11 (1)9 (1)9 (1)8 (1)
West12 (1)10 (1)10 (1)8 (1)7 (1)7 (1)
North11 (1)12 (0)11 (1)9 (1)8 (1)8 (1)
Branch proportionEast0.26 (0.01)0.23 (0.01)0.24 (0.01)0.29 (0.01)0.23 (0.03)0.24 (0.02)
South0.23 (0.02)0.29 (0.02)0.27 (0.02)0.24 (0.02)0.29 (0.03)0.26 (0.02)
West0.26 (0.02)0.22 (0.01)0.24 (0.02)0.21 (0.02)0.21 (0.03)0.23 (0.02)
North0.24 (0.02)0.26 (0.01)0.25 (0.02)0.26 (0.02)0.26 (0.02)0.27(0.03)
Note: The number in parentheses is the standard errors of mean value.
Table 5. Parameter estimates of fixed and random variables for Equations (3)–(7). Abbreviations see Table 1.
EquationResponse VariablesRegression ParametersPredictor VariablesEstimateStandard ErrorSignificance
(3)NLBa0Intercept5.7380.2973<0.0001
a1PD−0.2440.0421<0.0001
Φ 1.125
(4)NDBb0Intercept−3.1660.7910<0.0001
b1PD0.7320.1089<0.0001
Φ 2.051
(5)BDc0Intercept1.43410.0331<0.0001
c1BH0.04890.0051<0.0001
c2BL0.72830.0128<0.0001
c3BA−0.00230.0004<0.0001
αbp 0.00110.00060.041
αbptb 0.04400.0015<0.0001
(6)BLd0Intercept−1.04840.0423<0.0001
d1BH0.01960.0058<0.0001
d2BA0.00250.0004<0.0001
d3BD0.08270.0016<0.0001
βbp 0.00170.00080.037
βbptb 0.05410.0018<0.0001
(7)BAe0Intercept4.00020.0331<0.0001
e1BH0.07260.0051<0.0001
e2BD−0.00540.0014<0.0001
γbp 0.00210.00100.027
γbptb 0.04660.0015<0.0001

