Article

Tree Stress and Mortality from Emerald Ash Borer Does Not Systematically Alter Short-Term Soil Carbon Flux in a Mixed Northeastern U.S. Forest

1
Department of Biological Sciences, Wellesley College, 106 Central St., Wellesley, MA 02481, USA
2
Department of Biological Sciences, Dartmouth College, 78 College St., Hanover, NH 03755, USA
*
Author to whom correspondence should be addressed.
Forests 2018, 9(1), 37; https://doi.org/10.3390/f9010037
Submission received: 22 December 2017 / Revised: 11 January 2018 / Accepted: 13 January 2018 / Published: 16 January 2018
(This article belongs to the Special Issue Understanding and Managing Emerald Ash Borer Impacts on Ash Forests)

Abstract

:
Invasive insect pests are a common disturbance in temperate forests, but their effects on belowground processes in these ecosystems are poorly understood. This study examined how aboveground disturbance might impact short-term soil carbon flux in a forest impacted by emerald ash borer (Agrilus planipennis Fairmaire) in central New Hampshire, USA. We anticipated changes to soil moisture and temperature resulting from tree mortality caused by emerald ash borer, with subsequent effects on rates of soil respiration and methane oxidation. We measured carbon dioxide emissions and methane uptake beneath trees before, during, and after infestation by emerald ash borer. In our study, emerald ash borer damage to nearby trees did not alter soil microclimate nor soil carbon fluxes. While surprising, the lack of change in soil microclimate conditions may have been a result of the sandy, well-drained soil in our study area and the diffuse spatial distribution of canopy ash trees and subsequent canopy light gaps after tree mortality. Overall, our results indicate that short-term changes in soil carbon flux following insect disturbances may be minimal, particularly in forests with well-drained soils and a mixed-species canopy.

1. Introduction

Invasive forest insects can create biotic disturbances that critically alter ecosystem processes and ecosystem services [1,2,3]. However, the impacts of invasive insects on the ecosystem carbon cycle remain uncertain, particularly for indirect impacts such as changes to soil carbon cycling [4,5]. Many invasive insects cause tree stress and mortality through wood-boring, phloem-feeding, or defoliation, which potentially changes plant carbon and nutrient allocation strategies and subsequent plant-soil feedbacks [6,7]. This study examined the short-term, two-year impact of the invasive emerald ash borer (EAB; Agrilus planipennis Fairmaire) on soil carbon dioxide (CO2) and methane (CH4) fluxes shortly following the first detection of EAB in a mixed deciduous forest in New Hampshire, USA.
EAB is an invasive wood-boring insect that kills trees of the genus Fraxinus by effectively girdling stem xylem tissue with larval feeding tunnels [8]. EAB was first identified in the state of New Hampshire, USA, in 2013. Mortality in Fraxinus trees infested with EAB is rapid and trees generally die 1–2 years after EAB activity is detected [9,10,11]. Initial stages of infestation are characterized by a visible thinning of the canopy [12]. Currently there are several management strategies under consideration, including preemptive and salvage logging, insecticide, and biological control; however, none of these have been particularly effective in slowing the spread of EAB [13]. Although losses to aboveground biomass due to EAB-induced mortality have been documented in previous studies [14], impacts to the soil carbon processes beneath Fraxinus are less well understood. Given that forest soil carbon stocks are approximately twice the size of aboveground carbon stocks, it is critical that we understand how invasive pests impact this globally important carbon pool [15].
Previous studies have examined the complex feedbacks between biotic disturbances and soil carbon flux in other systems, which might provide a useful analog to EAB impacts for short-term changes in soil respiration. Defoliation studies in grasslands have found that moderate clipping or defoliation can increase [16], decrease [17,18], or have no significant effect [19,20] on soil CO2 flux within a year of vegetation removal. In forest ecosystems, the effects of biotic disturbances are similarly variable, with evidence for higher [21,22], lower [23,24], or no net change [25] in soil CO2 flux following disturbance. Higher soil respiration following defoliation may result from stress-induced root carbon exudation [26], higher soil temperature caused by canopy gaps, and higher soil moisture caused by reduced transpiration under defoliated trees [27]. However, insect disturbances that are severe enough to cause host mortality or significant loss of active tissues may also dampen soil carbon emissions by reducing root respiration [28]. All together, these factors suggest a complex set of mechanisms that could enhance, reduce, or produce no net change in soil CO2 efflux. For many insect disturbances, these mechanisms are likely to change with time and infestation severity [29].
In addition to the effects of insect disturbance on soil CO2 flux, these disturbances may alter rates of CH4 oxidation in forest soils. Globally, methanotrophic bacteria in upland forest soils oxidize approximately 28 teragrams of CH4 each year to CO2 [30]. This CH4 uptake reduces the radiative forcing of greenhouse gases in the atmosphere, as CH4 has a stronger radiative forcing capacity than CO2, and is an important component of the global CH4 budget [31,32]. Rates of CH4 uptake in soil may depend on several chemical and biological factors, including soil temperature, pH, texture, moisture, nutrient content, and the dynamics of the soil microbial community [33,34,35,36,37]. Previous studies that manipulated precipitation in forests have found lower CH4 oxidation rates as soil moisture increased, likely due to a corresponding decrease in diffusivity [38,39]. However, to our knowledge, no previous studies have assessed potential changes in CH4 oxidation in forest soils beneath trees experiencing biotic disturbance. Biotic disturbances may have important indirect effects on this component of the forest carbon cycle, particularly through changes in soil microclimate that follow tree mortality and tissue loss.
The two primary goals of this study were: (1) to identify patterns in soil CO2 and CH4 fluxes that related to EAB impact; and (2) to suggest mechanisms for changes in these fluxes under EAB infestation. Because different environmental parameters control soil CO2 efflux and CH4 uptake, we formulated independent sets of alternative hypotheses for each process. Our null expectation was that EAB disturbance does not produce a net change in CO2 nor CH4 flux, either because stress and mortality produce no effect on soil CO2 or CH4 flux or because multiple concurrent changes to the soil environment counteract each other such that no net effect is produced. In this study, we assessed two alternate hypotheses for the potential effects of EAB impact on either soil CO2 flux or CH4 uptake (Figure 1):
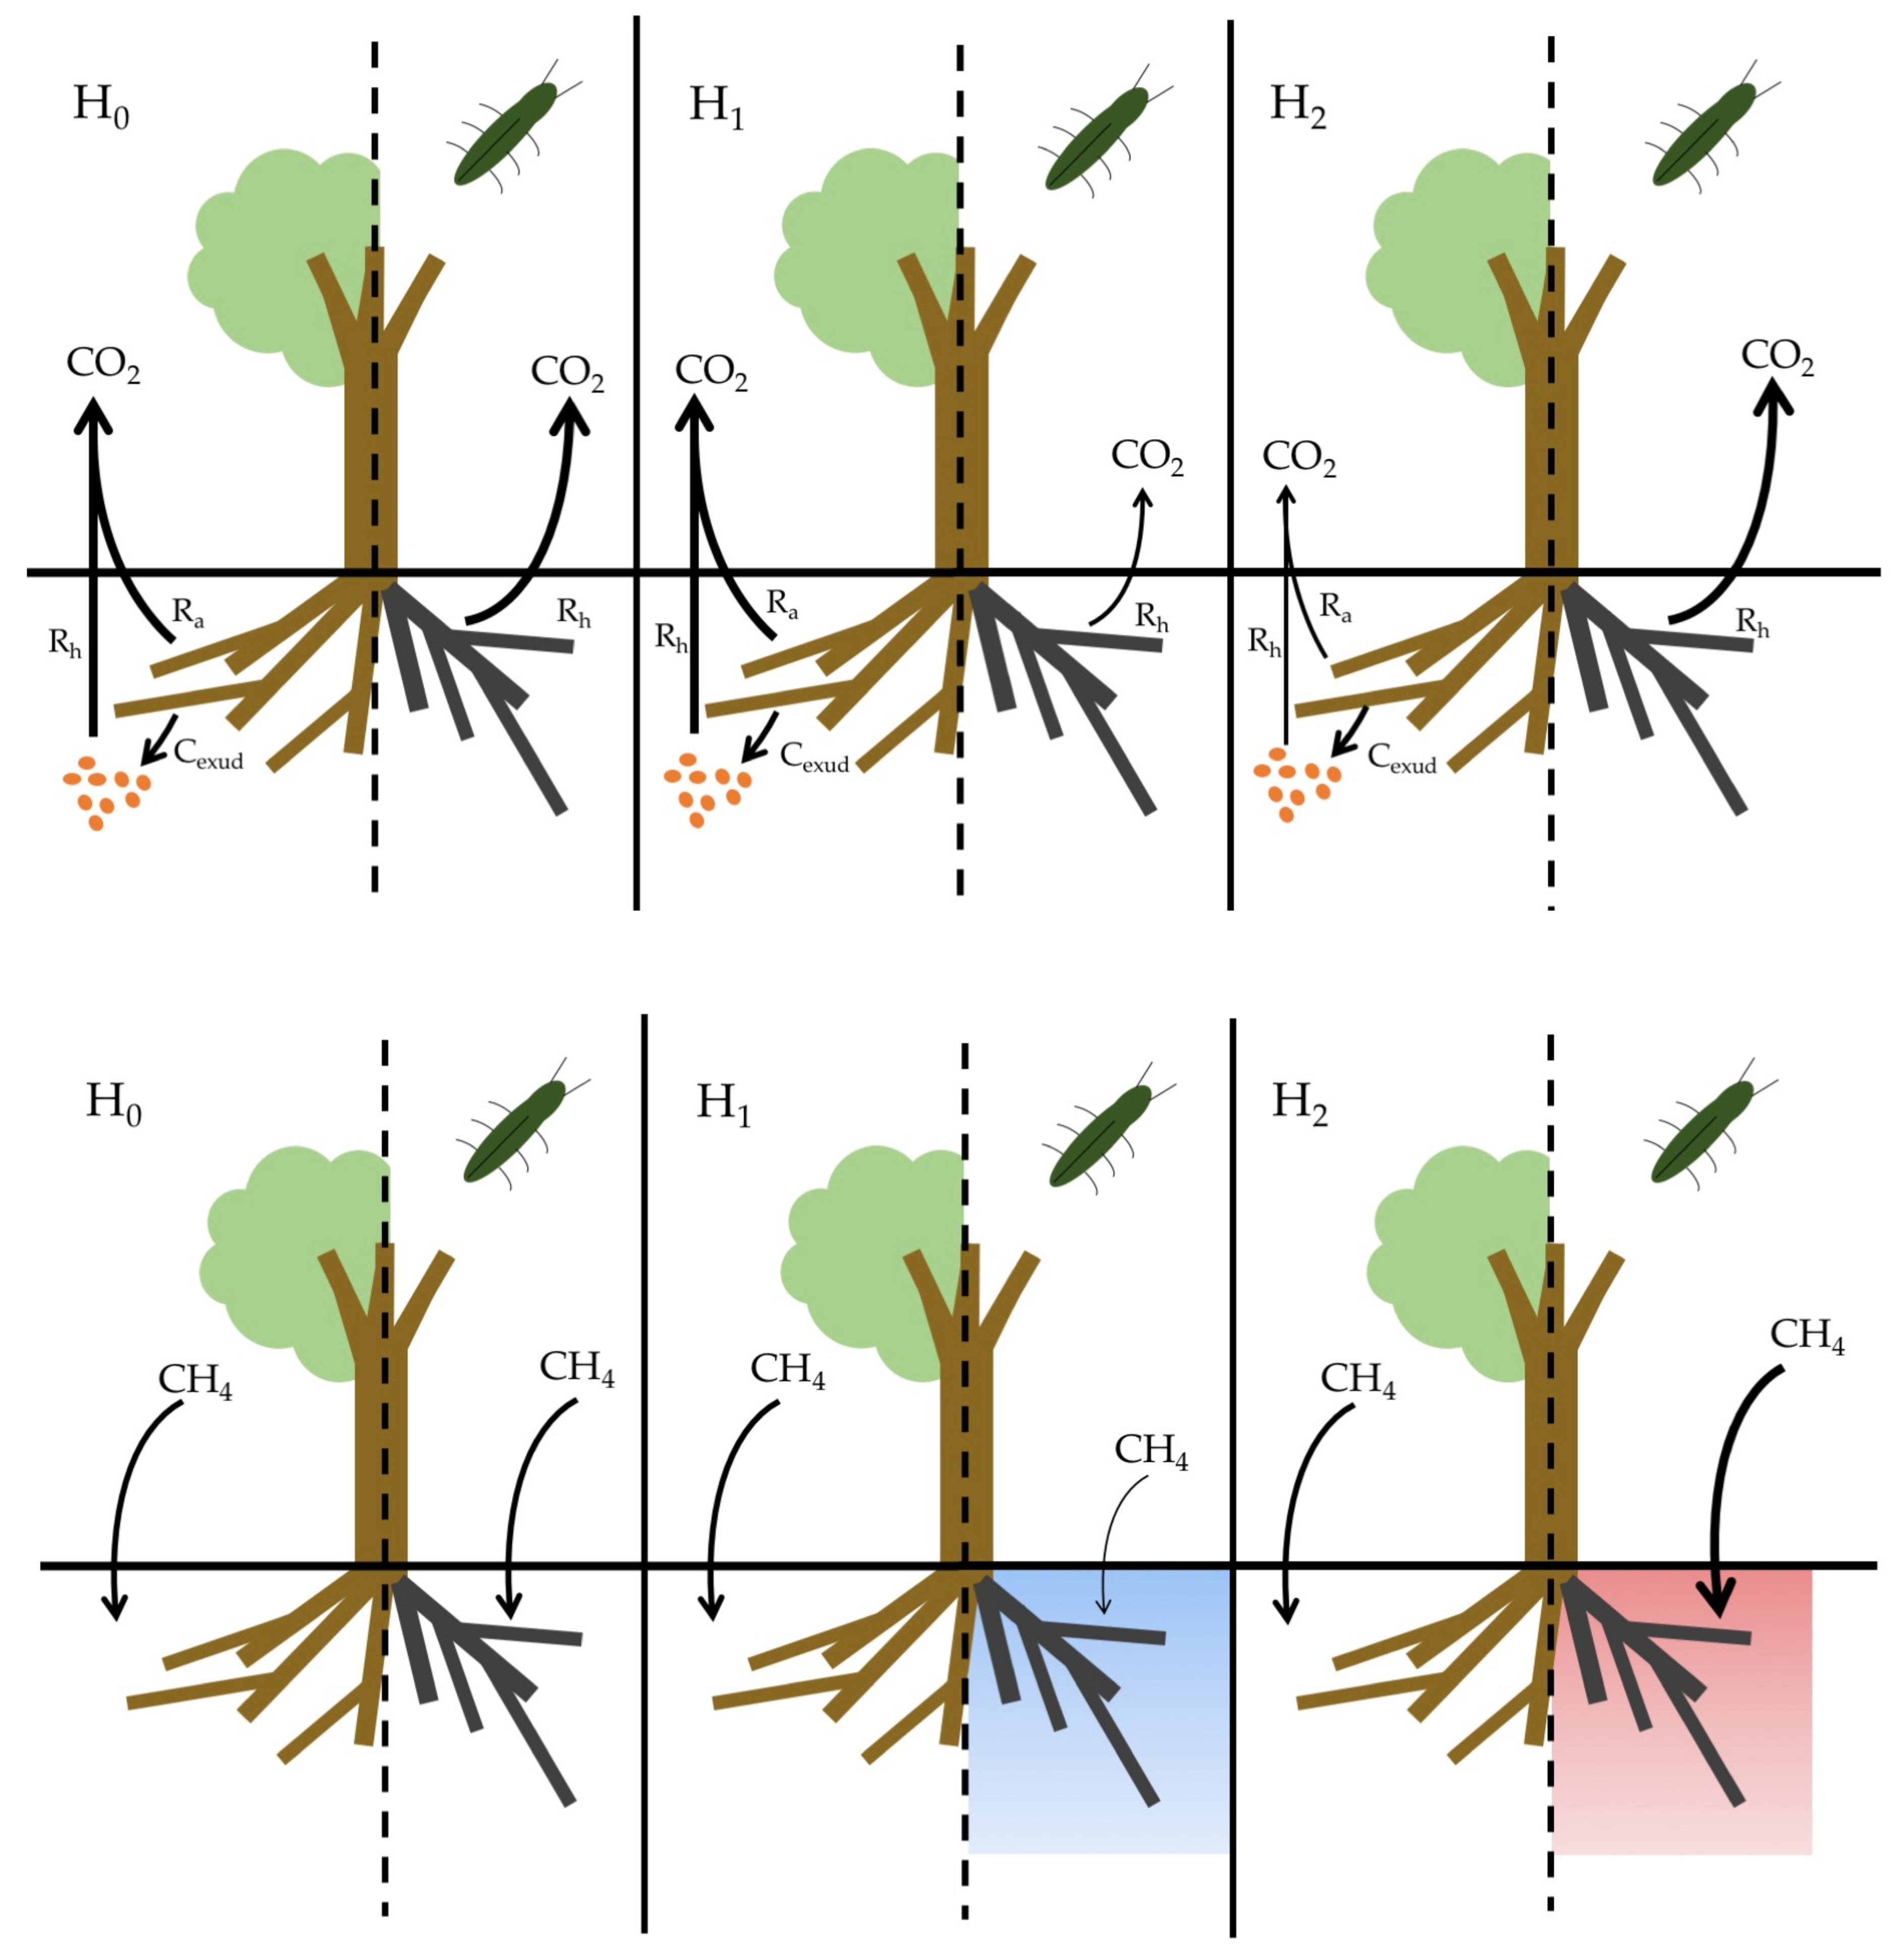
  • CO2 flux, H1: Soils beneath EAB-impacted Fraxinus americana L. (F. americana) will have lower rates of CO2 flux due to lower active root metabolism and exudation of labile carbon substrates compared to soil beneath visibly healthy trees.
  • CO2 flux, H2: Soils beneath EAB-impacted F. americana will have higher rates of CO2 flux due to an increase in dead root biomass available for decomposition, as well as an increase in soil temperature and moisture, as infestation results in large canopy gaps and reduced evapotranspiration.
  • CH4 uptake, H1: Soils beneath EAB-impacted F. americana will have lower rates of CH4 uptake due to an increase in soil moisture from decreased evapotranspiration.
  • CH4 uptake, H2: Soils beneath EAB-impacted F. americana will have higher rates of CH4 uptake due to an increase in soil temperature, as canopy gaps allow more sunlight to reach the forest floor.

2. Materials and Methods
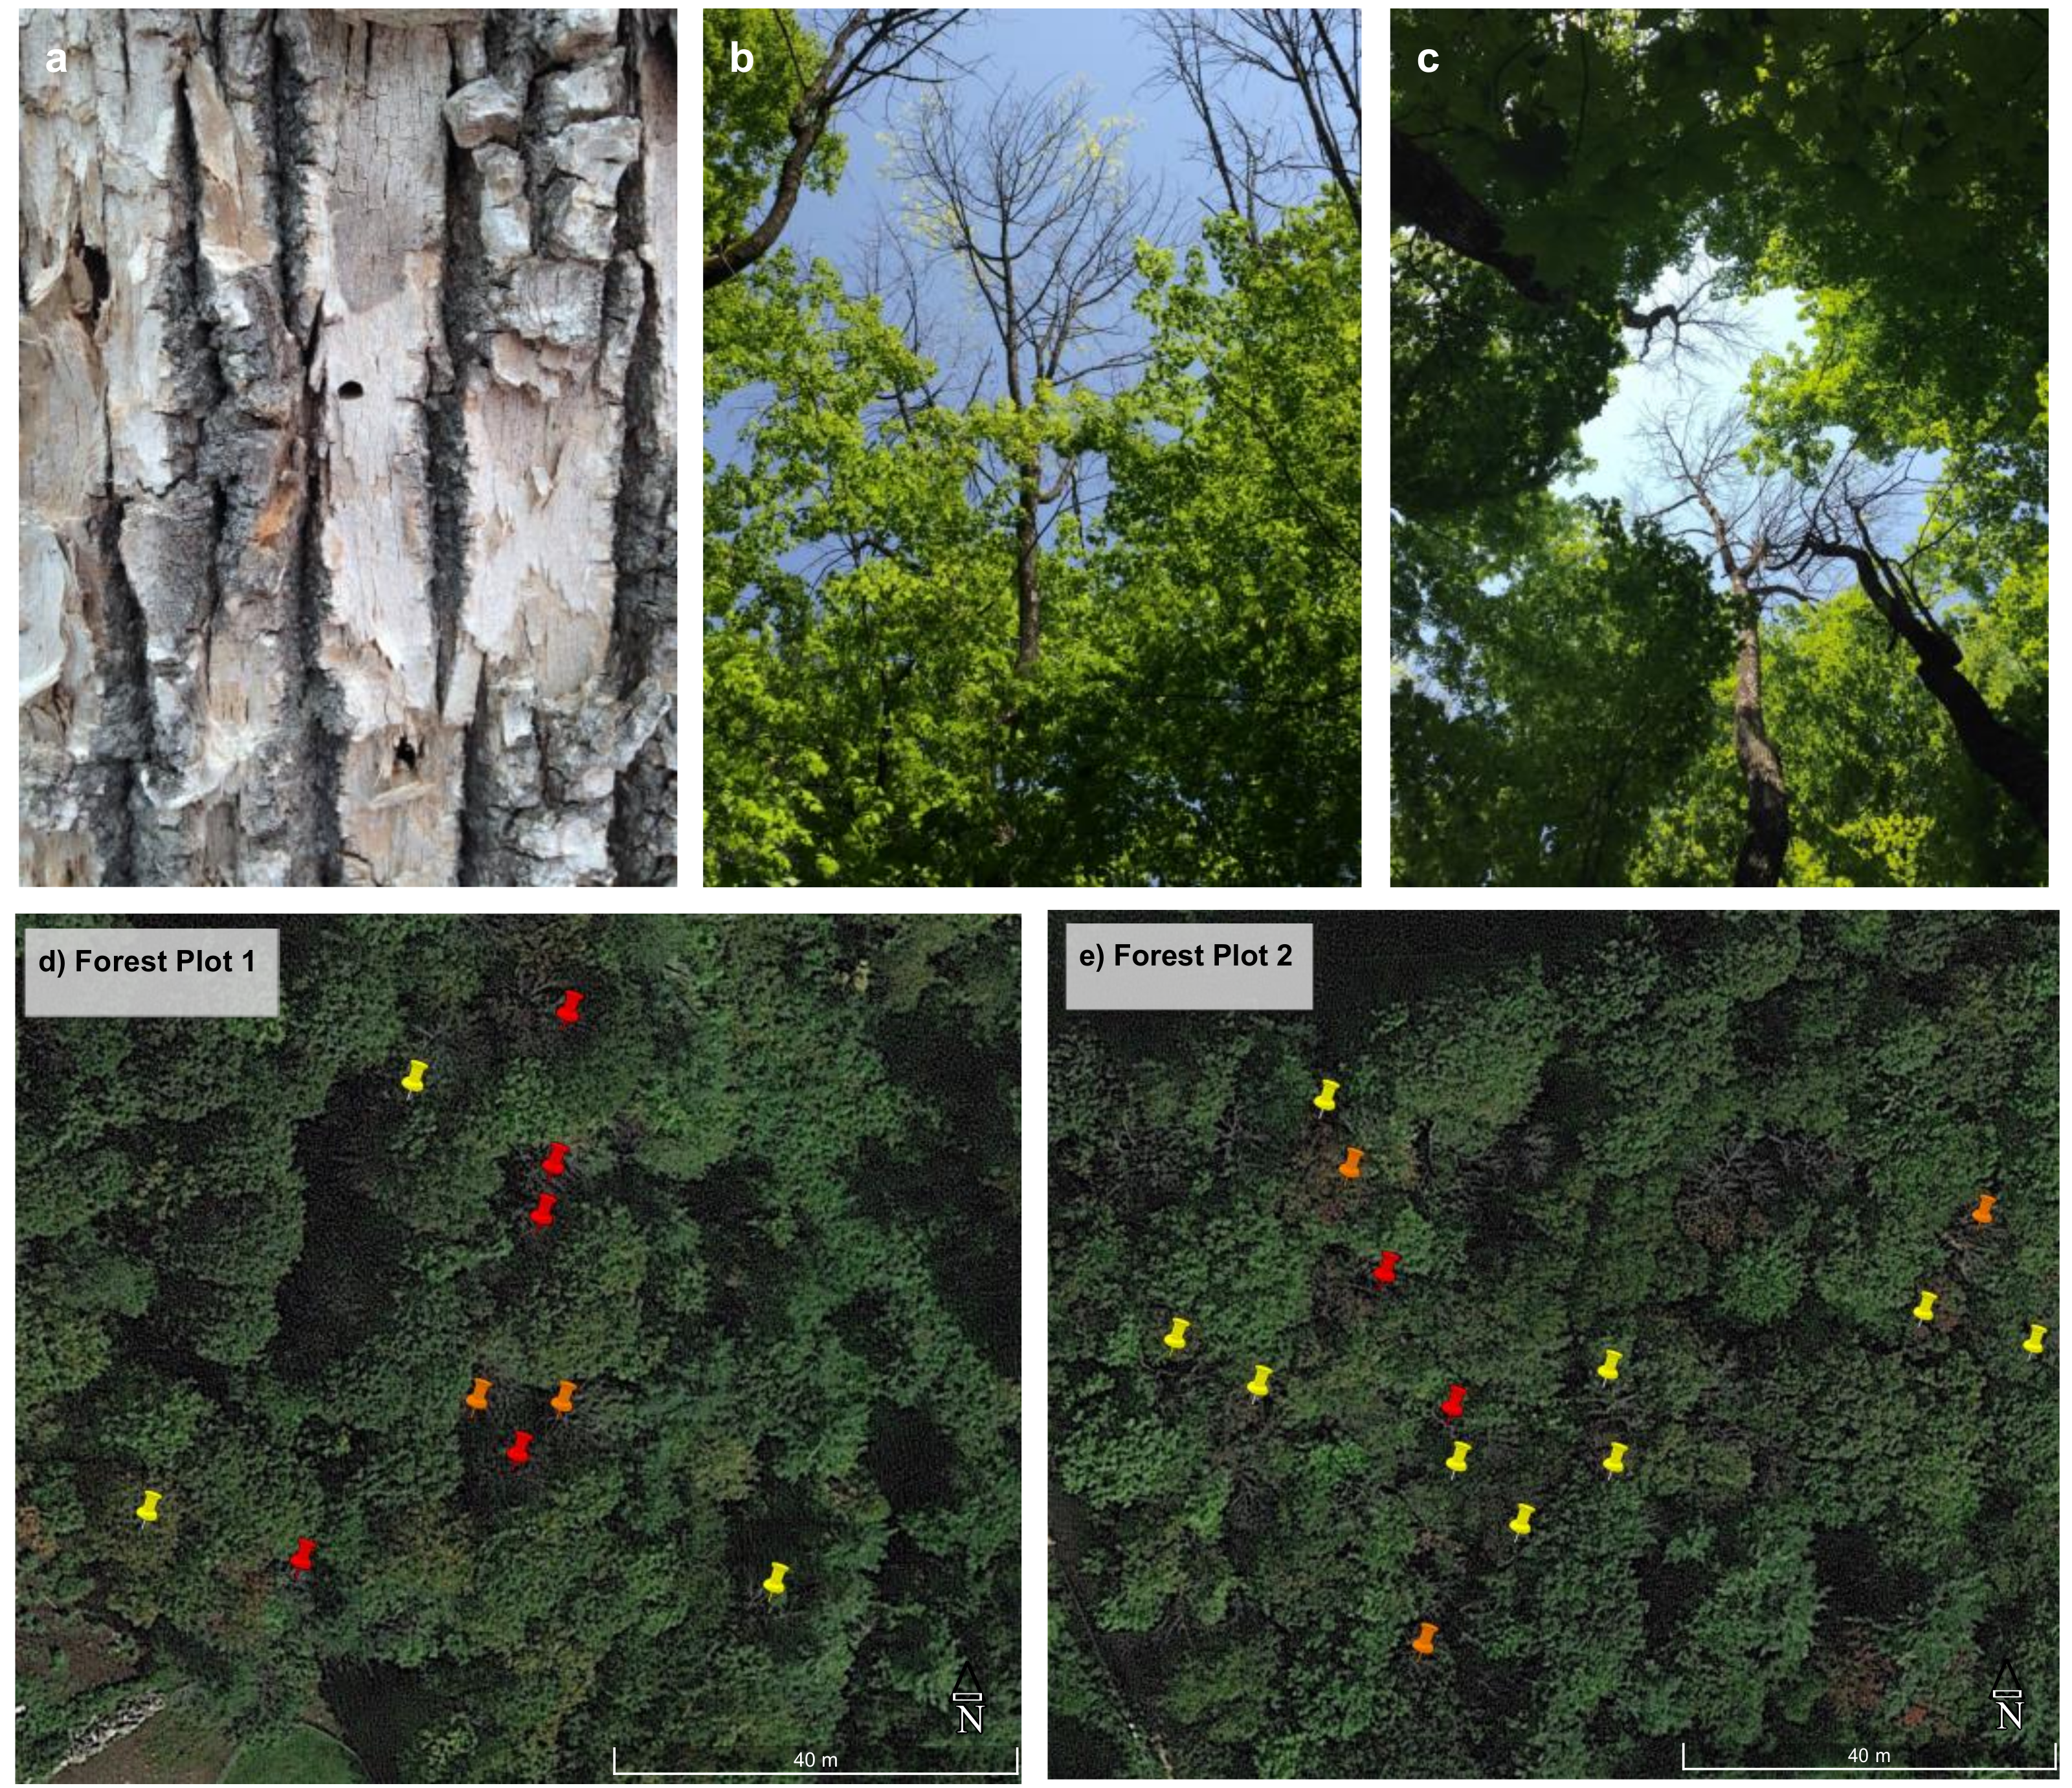
2.1. Study Site

Our study site was located in Canterbury, NH, USA, in a mixed forest comprised of approximately 30% Fraxinus americana L., and also Acer saccharum Marsh., Tsuga canadensis L., and Acer rubrum L. The 1981–2010 climatological mean annual temperature at the nearest long-term weather station was 7.96 ± 0.58 C (mean ± standard deviation) and the annual precipitation was 1020 ± 178 mm (Concord, NH weather station code GHCND:USW00014745, 21 km from the study site [40]). For climate variables during our study period, we used total monthly precipitation data and mean monthly temperature data from the same station as the 30-year climatology.

2.2. Study Design

At our study site, we classified F. americana trees into three categories based on visual canopy cover estimation: healthy, impacted, or dead. Trees were considered healthy if their canopy was fully leafed-out in midsummer, with no bare branches or visible signs of stress (i.e., epicormic branching). Trees were classified as impacted if their canopy showed evidence of thinning (Figure 2b) or epicormic branching. Trees designated as dead were examined for signs of EAB infestation (D-shaped exit holes; Figure 2a) and only trees killed by EAB were included in the study. On 28 April 2016, sixteen F. americana trees were selected across a range of classes impacted by EAB: three healthy, six impacted, and seven recently dead, and we measured tree diameter at 1.3 m from ground level (DBH, cm). Trees were selected for our study within two separate tracts of about 100 m2 area less than 1 km from each other, where F. americana were spaced about 5–20 m with other species typically occurring between F. americana individuals (Figure 2d,e). Eight additional F. americana trees, five healthy and three impacted, were added to the study on 8 August 2016 to achieve higher replication (n = 24 from this date onward), and we measured DBH for these additional replicates. On 16 June 2017, the impact classes of individual trees were re-evaluated.
On the same dates listed above when trees were selected (either 16 June or 8 August 2016), we installed 10.16 cm diameter polyvinyl chloride (PVC) soil flux collars that remained in place for the duration of the study, following standard soil flux measurement protocol [41]. Respiration collars were installed 1.5 m from the base of the tree in a randomly chosen direction, to a depth of approximately 7 cm to capture aggregate changes in both microbial and root respiration. We waited one month to measure CO2 and CH4 fluxes at the soil collars to allow for belowground acclimation to the installation disturbance. We measured the height of each collar at the four polar coordinates and took the mean of those four measurements as the collar height in cm. To validate soil flux models at different spots beneath the same trees, we installed a second collar at half the trees within the study (n = 12). The second collars were installed on four healthy, four impacted, and four dead trees, as evaluated in 2016.
We mapped the location of all study trees with a GPS unit (Garmin, Olathe, KS, USA). We plotted our study tree coordinates on a ∼2 m resolution WorldView satellite image collected on 11 September 2017 in Google Earth (Google Earth Pro, v. 7.3.0.3832, Mountain View, CA, USA) to visualize the mosaic composition of the forest at our study site (Figure 2). By visually locating the approximate canopy extent of trees that were either dead from the start of the study or died during the study, we used the area calculator in Google Earth on the 11 September 2017 satellite image to roughly estimate the canopy gap size created by individual ash mortality.

2.3. Chamber Measurements and Flux Calculations

Soil CO2 and CH4 fluxes were measured at each collar during twelve sampling events: once per month from June to November 2016 (six sampling dates) and May to October 2017 (six sampling dates). Measurements were collected across all collars on each sampling date between approximately 09:00–12:00. Previous studies have demonstrated that instantaneous soil carbon flux in the late-morning is a good approximation of the daily mean soil CO2 flux at a northeastern U.S. temperate forest site [42], thus avoiding potential biases in the effect of measurement time on soil flux [43]. During each chamber measurement, soil temperature was measured with a digital thermometer inserted 10 cm below the soil surface adjacent to the chamber. Integrated soil moisture was measured with a time domain reflectometer. We used a Decagon G3 Soil Moisture and Conductivity Sensor (Decagon Devices, Pullman, WA, USA, ±0.03 m3 m−3 accuracy) to measure soil moisture across the top 10 cm of soil on 2016 sampling dates and on 19 May 2017, and integrated soil moisture and conductivity across the top 12 cm of soil was measured with an H2 HydroSense II (Campbell Scientific, Logan, UT, USA, ±0.03 m3 m−3 accuracy) on the remaining five 2017 sampling dates.
During each soil CO2 and CH4 flux sampling event, we connected a portable greenhouse gas analyzer to the PVC respiration collar for a period of two minutes. On 2016 sampling dates, a Los Gatos Research (LGR) Ultraportable Greenhouse Gas Analyzer (Los Gatos Research, Los Gatos, CA, USA) cavity ring-down spectrometer was used to measure the CO2, CH4, and H2O concentration inside the PVC chamber at 0.2 Hz temporal resolution (0.3 ppm CO2 precision and 2 ppb CH4 precision). On 2017 sampling dates, a Picarro GasScouter G4301 Gas Concentration Analyzer (Picarro Inc., Santa Clara, CA, USA) cavity ring-down spectrometer was used to measure the CO2, CH4, and H2O concentration inside the PVC chamber at 1 Hz temporal resolution (0.4 ppm CO2 precision and 3 ppb CH4 precision). We used values of dry CO2 and CH4 concentration data (in ppm) that were corrected by the internal software for each greenhouse gas analyzer for CO2 and CH4 flux calculations.
We calculated soil CO2 and CH4 flux by fitting a linear regression model to the concentration data collected in the center 70 s of the two-minute measurement period to reduce potential errors associated with securing and removing the chamber top, which is a reasonable measurement interval for high-resolution soil flux chamber measurements [44]. We estimated the flux as the slope of a linear fit between concentration and time during each chamber measurement and converted units from ppm (provided by the analyzer) to the mass flux in μmol m−2 s−1 using the measured chamber height and surface area, and temperature and pressure at the time of measurement.

2.4. Soil Characteristics

After the last sampling event at the study site, we harvested the soil within each replicate collar to 7 cm depth to measure root biomass, soil texture, and soil pH. We sieved soils to 1 mm, separating roots from particulates, dried roots from each soil collar at 45 C for 72 h, and weighed dried roots within each replicate. We measured soil pH with an electrode in a 2:1 deionized water-to-soil suspension (Thermo Scientific, Waltham, MA, USA). We measured soil texture for a well-mixed 2 mL subsample of the remaining mineral soil fraction (<1 mm) within each soil collar. To measure soil texture, we dispersed each 2 mL subsample in 10 mL sodium hexametaphosphate and then placed each subsample on a shaking table for 24 h prior to measurement on a laser diffraction particle size analyzer (LS 13-320, Beckman Coulter, Brea, CA, USA). Output from the particle size analyzer was classified into volume fraction of clay, silt, and sand for each sample according to United States Department of Agriculture (USDA) particle size classes [45]. These soil variables—root biomass, pH, and fraction sand content—were used as covariates in the mixed models.

2.5. Statistical Methods

We nested all of our statistical analyses within each tree in the study (n = 24). For trees that had two replicate collars, we randomly selected one collar to be in the model fit dataset (training data) and the second replicate collar to be in a model validation dataset. To test our hypotheses that the level of EAB impact altered soil moisture and temperature (Figure 1), we created two mixed effects models with either soil moisture or temperature data as the response variable. For the soil moisture model, we fit two linear fixed effects for total monthly rainfall and the fraction of soil sand content and a fixed effect for EAB impact status (healthy, impacted, or dead). Additionally, we fit random effects for each replicate tree to reflect the non-independence of the repeated measurements and a second set of random effects for sampling month. For the temperature model, we fit a fixed effect for EAB impact status, and random effects for replicate tree and for month sampled.
To test our hypotheses that EAB presence influenced soil CO2 and CH4 flux, we constructed two additional sets of Bayesian linear mixed models with either soil CO2 or CH4 flux as the response variable. In both models, we fit separate random effects for measurement month and replicate (i.e., each tree) to reflect our repeated measures design. Our fixed effects for the CO2 flux model were: (1) soil temperature and (2) soil moisture at the time of flux measurement; (3) monthly total rainfall; (4) DBH of the nearest F. americana tree; (5) root biomass of a 7-cm-deep core collected within the chamber at the conclusion of the experiment; (6) fraction of sand content; and (7) soil pH, with each measured from the same core.
Our fixed effects for the CH4 uptake model were: (1) soil temperature and (2) soil moisture at the time of flux measurement; (3) monthly total rainfall; (4) fraction of soil sand content measured from the same core; and (5) soil pH. The CO2 flux and CH4 uptake models are each represented as Equation (1):
y i = M t , i + T j , i + β k X k + ε i
where yi is each CO2 flux or CH4 flux measurement and i = 380 chamber flux measurements, Mt is a random month effect fit across all measurements within t = 7 study months, Tj is a random tree replicate effect fit across all measurements within j = 24 study trees, βk is a set of linear regression coefficients for the Xk fixed effects variables, and εi is the residual variance. In our CO2 flux model, k = 7 and k = 5 in the CH4 uptake model, where Xk in each case represents the fixed effects described above. The random effects Mt and Tj were each modeled as normally distributed with means of zero and respective variances σM and σT, with uninformative priors on the variance (σM = σT = 106). We included a monthly random effect in addition to the fixed effects of soil temperature and moisture to account for potential seasonal changes in tree physiology (e.g., root carbon exudation, root elongation), which may have affected the soil carbon flux measurements.
We modeled CO2 flux as yi ∼ lognormal(μi, σe), where yi is each flux measurement, μi is the process mean fit as the sum of the modeled fixed and random effects, and σe is the measurement and process variance. Since all measured values of CH4 flux in this study were negative, we took the absolute value of CH4 flux (to conceptually represent the CH4 uptake flux) and modeled the absolute value of CH4 flux as yiN(μi, σe), where σe represents the measurement variance and i is each observation. Fitting the model with the absolute value of the CH4 flux allowed for more congruent comparison between changes in CO2 flux and CH4 uptake.
We fit the mixed effects models in a Bayesian statistical framework with the RStan package [46]. All models were fit with standard Bayesian Markov chain Monte Carlo (MCMC) sampling techniques, with 100,000 iterations and four MCMC chains per model. For all fitted parameters, effective sample size exceeded 80,000 and R_hat = 1, indicating MCMC chain convergence and reliable estimates of posterior probability density [47]. This analysis was conducted entirely in R [48]. The code and raw data to fully reproduce the analysis within this paper is available at [49] and additionally as the EAB_soilflux.zip file included as Supplementary Materials. The code for this analysis relied on several R packages to facilitate data cleaning, processing, and visualization [50,51,52,53,54,55].

3. Results

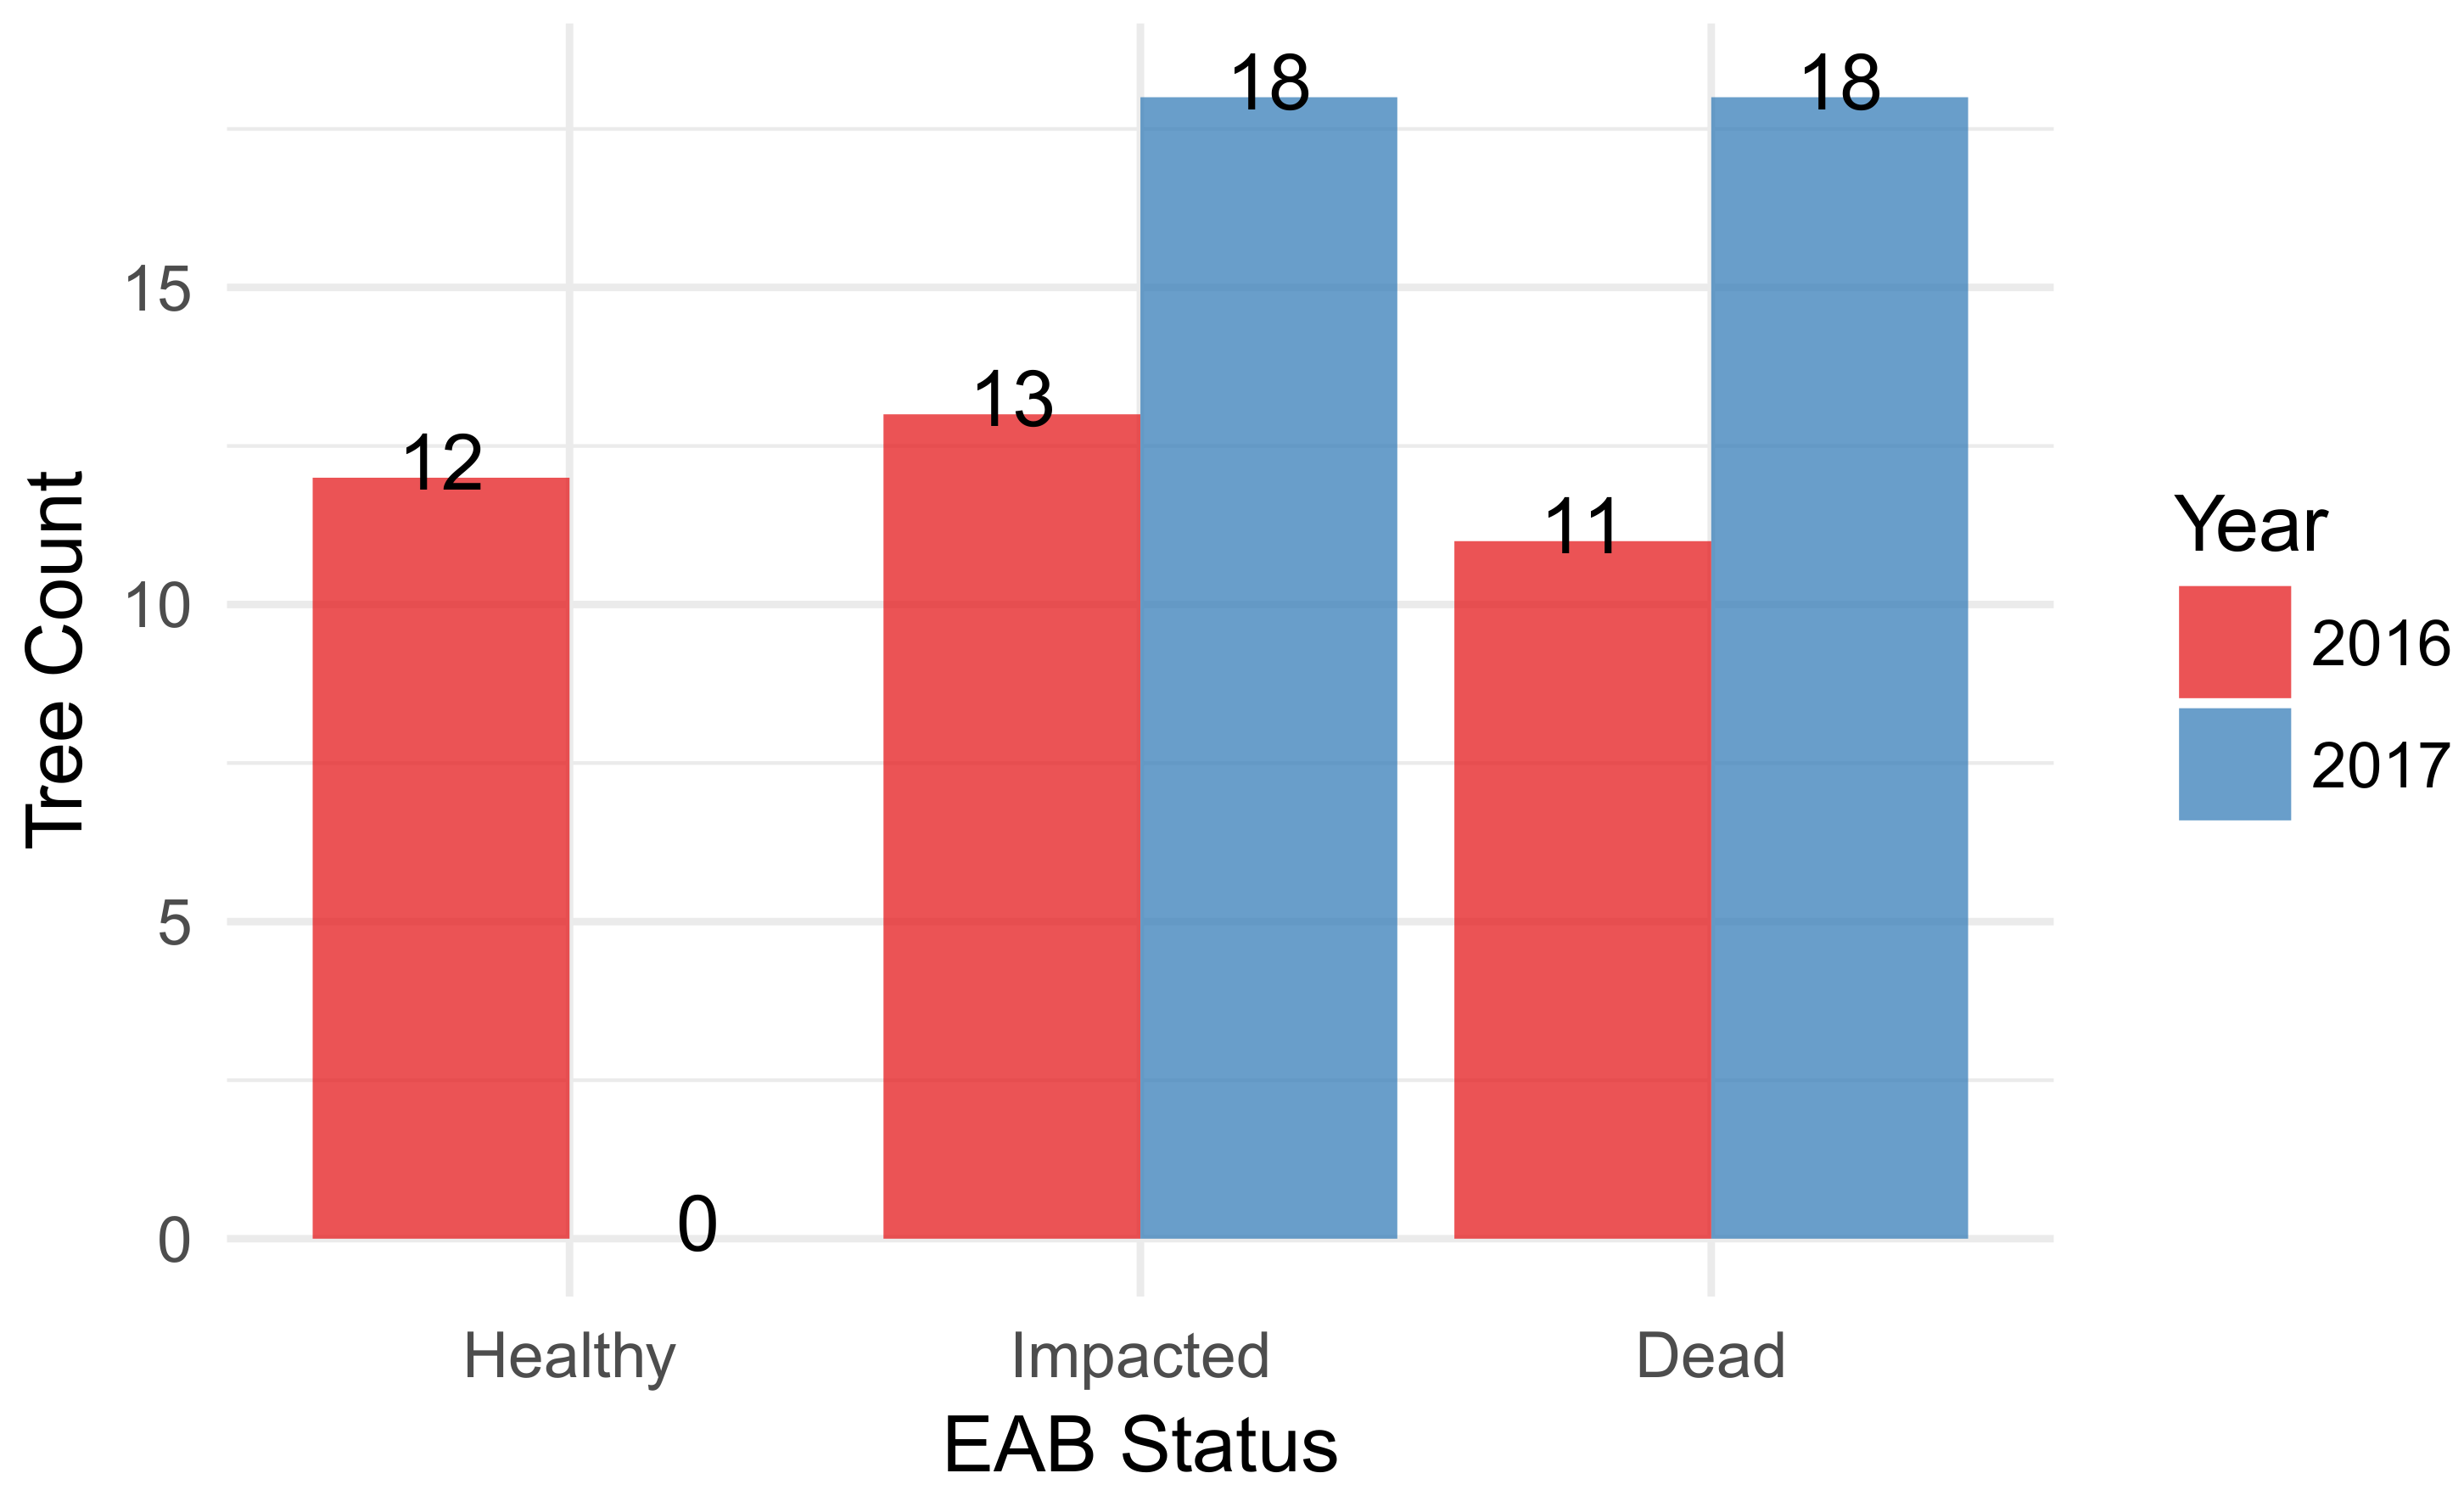
3.1. F. americana Decline over Time

F. americana quickly declined during the study period. From May 2016 through October 2017, there was rapid progression of stress and mortality within F. americana as determined by visual survey methods: all trees that were healthy in 2016 had been impacted by 2017, leaving no trees in the “healthy” category for 2017 at this site (Figure 3). The mean canopy gap size created by individual ash mortality was 28 m2 (full range of estimated trees 8.5–48 m2), which, if assuming that the gap is a circle, translated to a mean gap diameter of 2.9 m (full range 1.7–3.9 m). Despite widespread ash decline, the non-dominance of ash at this site meant that much of the forest remained intact by the end of the study (Figure 2d,e).

3.2. Soil Characteristics and Soil Microclimate Trends

Soil pH was between 4.05 and 5.43 at this site and sand content was high, ranging from 0.92 to 0.99 volumetric particle fraction (Table 1). Air temperature during the growing season was significantly higher than the upper quartile of the climatological monthly means for July, August, and September 2016 and September and October 2017 (Figure 4a). May 2017 was below the lower quartile for the climatological mean monthly temperature.
Strong differences existed in monthly precipitation between 2016 and 2017 in May and June, where precipitation in 2016 was about half that of 2017 in each of those two months (Figure 4b). Although monthly total precipitation had high variability in those months, instantaneous soil moisture measurements collected at the time of soil flux measurement were unrelated to total monthly precipitation (Figure S1), likely due to the high sand content of soils at this site leading to strong drainage capacity (Table 1). Given that monthly precipitation and soil moisture were not correlated, we included both variables as fixed effects within the mixed models, since conceptually they might represent different processes. For example, soil moisture inhibits diffusion locally and total monthly precipitation could enhance tree productivity and root carbon exudation on longer timescales, impacting soil flux through different mechanisms.

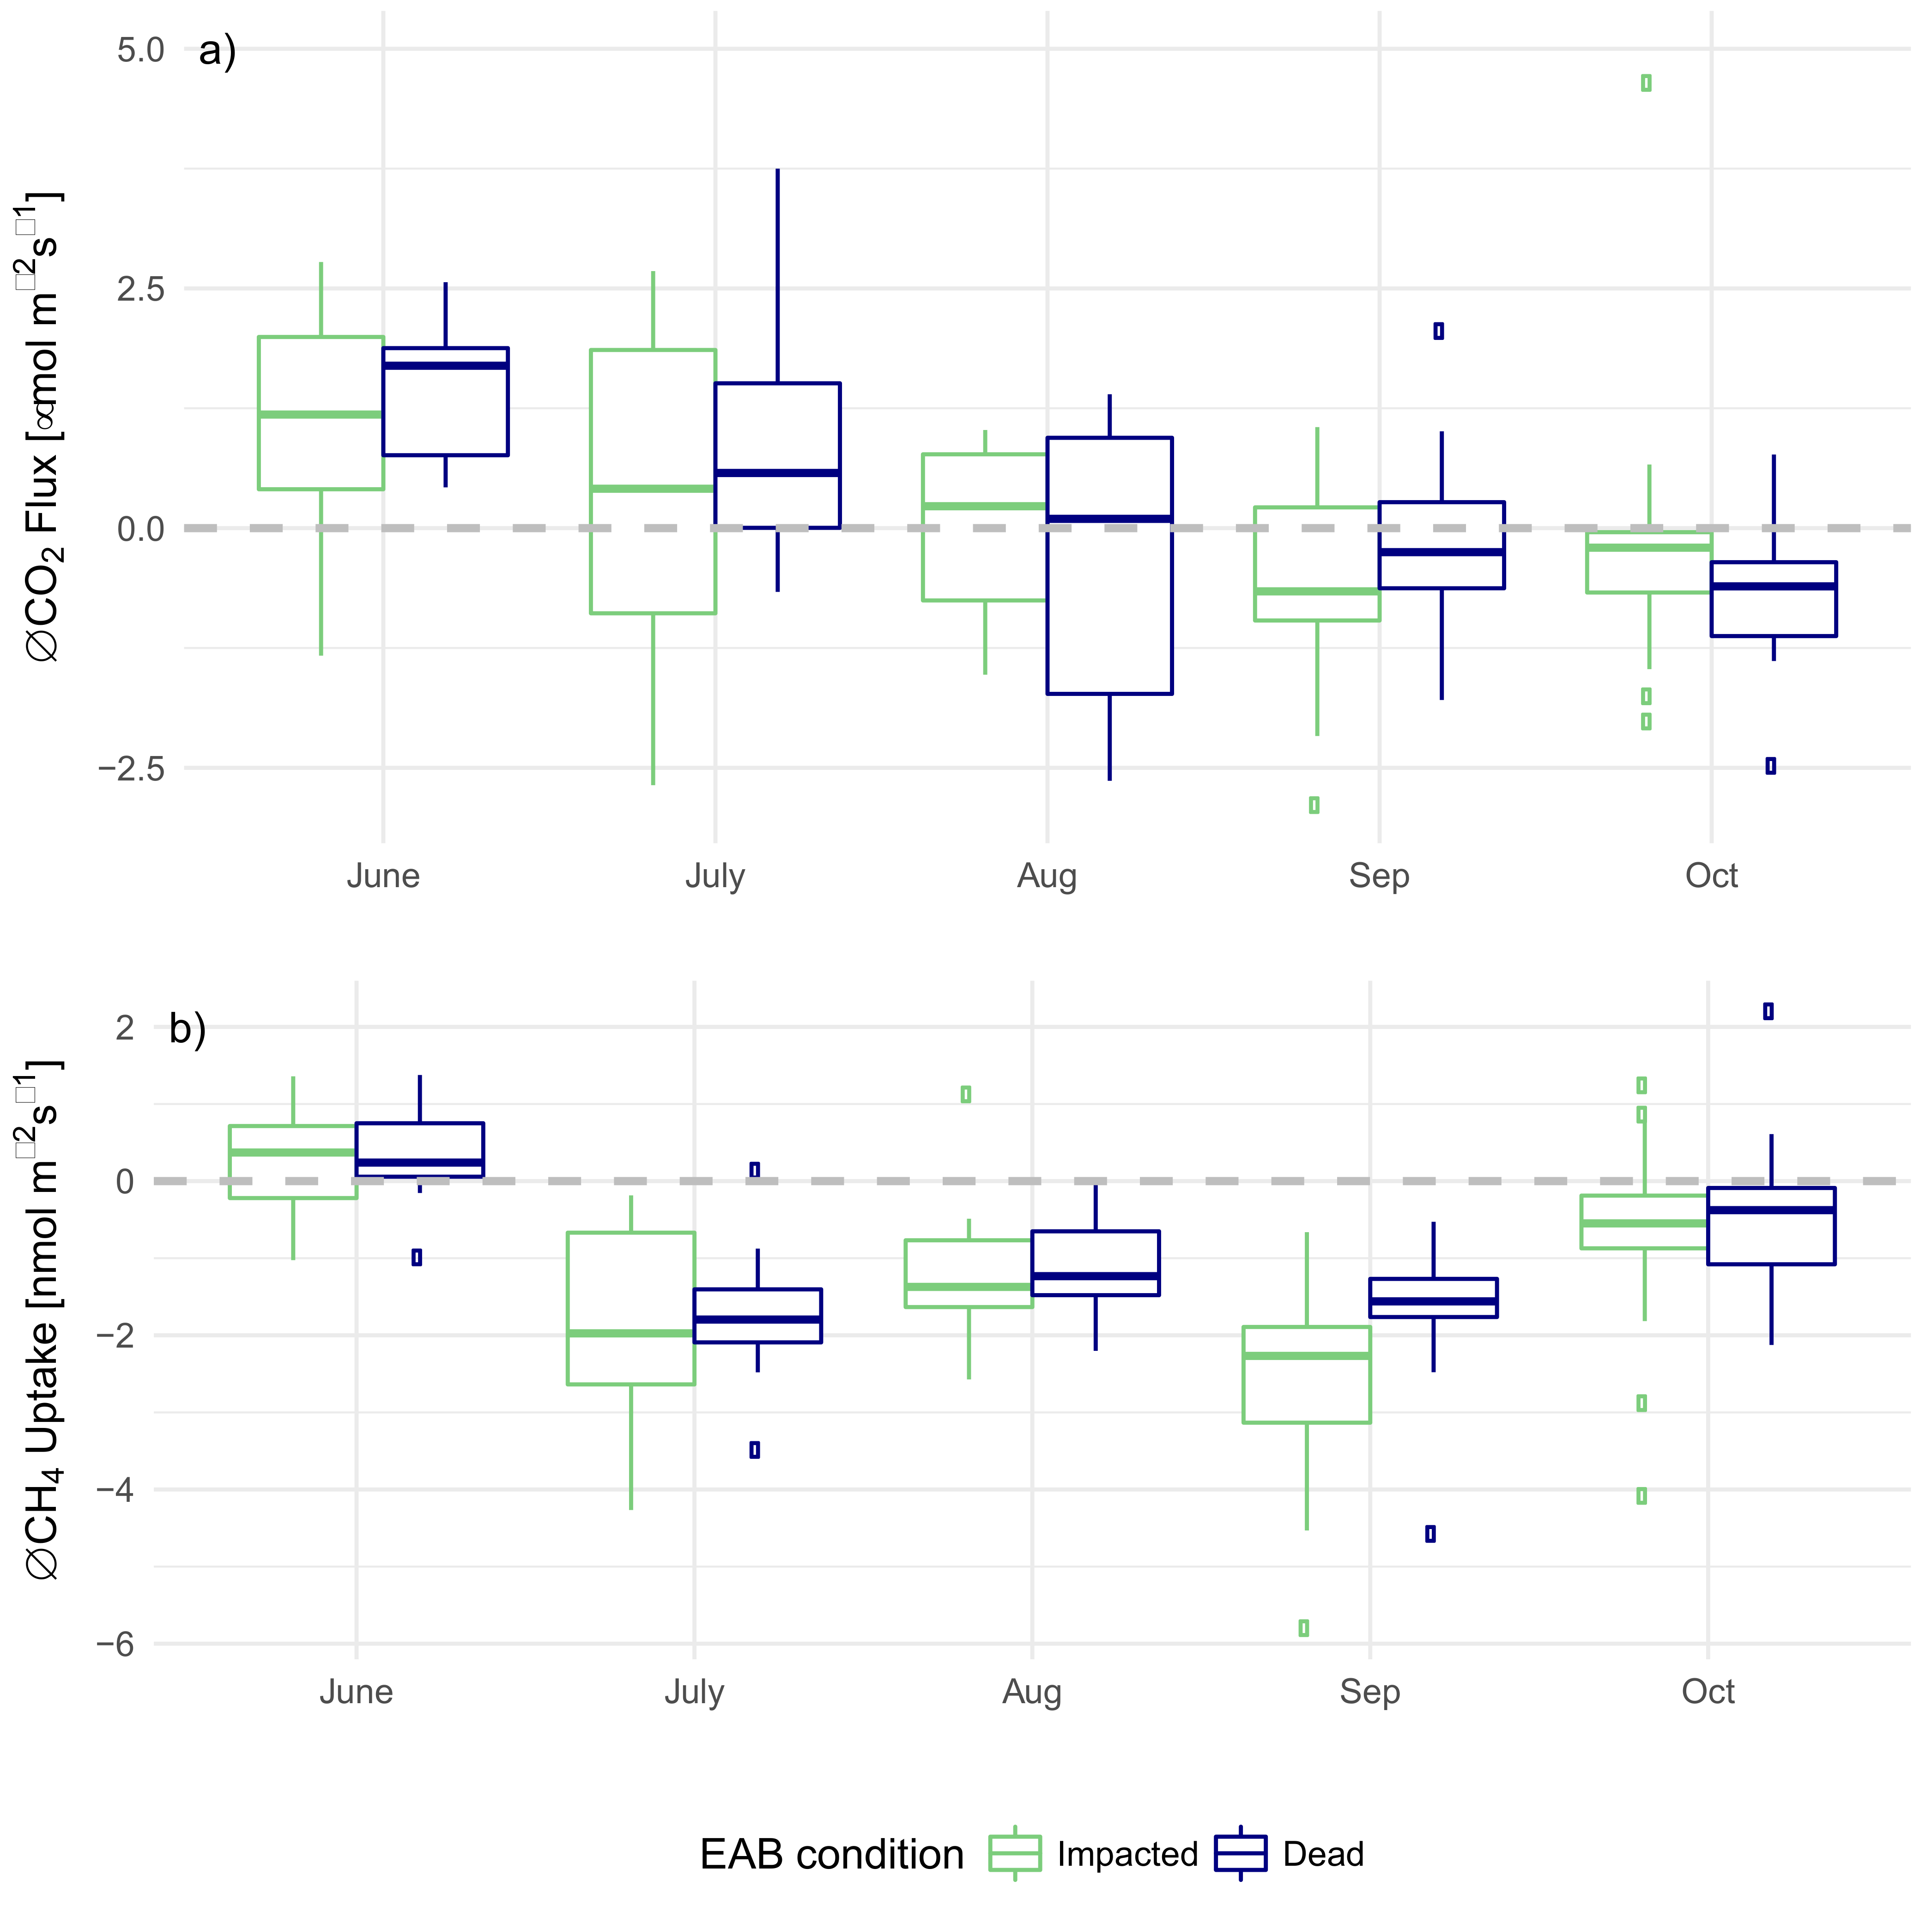
3.3. EAB Impact on Soil Microclimate and Gas Flux

We evaluated the mixed effects models fit to the repeated soil moisture and soil temperature measurements to determine whether soil microclimate was impacted by EAB infestation. In the model fit to measured soil moisture, the posterior probability density for the coefficient for total monthly rainfall was not significantly different from zero, but the coefficient for fraction soil sand content was negative (median = −1.69, 95% interval = −2.63–−0.79; Table S1). The random effects fit to EAB impact status (healthy, impacted, or dead) were not significantly different from zero (Table S1). For the model fit to the repeated soil temperature measurements, the random effects fit to EAB impact status were also not significantly different from each other (Table S1). For both the soil temperature and soil moisture models, the parameter estimates for the EAB status effects led us to conclude that EAB impact was not a reliable predictor of soil microclimate at this site.
The linear regression flux models for CO2 flux and CH4 uptake that were measured at individual collars had a mean standard error of 0.028 μmol m−2 s−1 for CO2 flux (0.026 μmol m−2 s−1 for the LGR analyzer in 2016 and 0.030 μmol m−2 s−1 for the Picarro analyzer in 2017) and 0.042 nmol m−2 s−1 for CH4 flux (0.035 nmol m−2 s−1 for the LGR analyzer in 2016 and 0.047 nmol m−2 s−1 for the Picarro analyzer in 2017). Since these errors represent less than one percent of the total measured flux magnitude, we did not explicitly incorporate the error from this flux calculation in subsequent analysis. In both 2016 and 2017, CO2 flux followed a seasonal pattern with the peak annual flux in August 2016 and July 2017 (Figure 5a). CH4 flux also had a strong seasonal pattern, with peak CH4 uptake lagging the peak in CO2 flux, in September 2016 and August 2017. Peak CH4 uptake during mid-summer was much higher in 2016 compared to 2017, and fluxes for 2016 and 2017 were significantly different in July, August, and September (Figure 5b; paired t-test, p < 0.05).
To evaluate potential changes in soil flux with F. americana decline, we used the three EAB impact categories (healthy, impacted, and dead) evaluated in 2016 and 2017 to assign two groups that described the trajectories of ash decline: trees that experienced EAB stress and mortality during the experiment (Impacted) and trees that were already dead at the start of the experiment (Dead). These two transitional categories allowed us to compare changes in soil CO2 flux and CH4 uptake as F. americana declined. Patterns in the CO2 flux and CH4 uptake difference between 2016 and 2017 organized by these two classes were not significantly different, and did not exhibit any discernible trends across the sampling dates (Figure 6). It is important to note that this visual summary of the mean patterns in CO2 flux and CH4 uptake by category does not incorporate the covariate effects that also varied between the two years, which are additionally important drivers of CO2 flux and CH4 uptake.

3.4. Modeled Predictors of CO2 Flux and CH4 Uptake

In the mixed effects model fit to CO2 flux data, the modeled regression coefficient for temperature was positive (Table 1). The regression coefficient for soil moisture was also positive, but the coefficient for monthly rainfall was negative. Fraction sand content had a large, but uncertain, positive effect on soil CO2 flux. The posterior distributions of the regression coefficients for DBH of the nearest tree, root biomass, and soil pH were all not significantly different from zero for the CO2 flux model.
In the mixed effects model fit to the CH4 uptake data, the regression coefficient for soil temperature was not significantly different from zero (Table 1). The coefficients for soil moisture and monthly rainfall were both negative (although only the soil moisture coefficient is significantly different from zero), in contrast to the CO2 flux model where the moisture coefficient was positive and the rainfall coefficient was negative. In the CH4 uptake model, the coefficient for the fraction sand content was positive but had large uncertainty bounds, as was the case for fraction sand regression coefficient in the CO2 flux model. The coefficient for soil pH was negative for the CH4 uptake model, in contrast to the CO2 flux model where the pH coefficient was not significantly different from zero (Table 1).
Random month effects fit for both the CO2 flux and CH4 uptake models broadly paralleled trends apparent within Figure 5, with the largest positive effects in August and September for both CO2 flux and CH4 uptake, but with more variability in the order of the remainder of the months (Table S2). Because the random month effects are fit together with soil temperature, moisture, and rainfall, these effects represent patterns that move beyond the relationship with these other fixed factors, and could yield insight into which types of phenological signals might be important for soil processes. Random tree replicate effects were significant, but did not follow patterns that were associated with EAB impact class (Figure S2). Distribution statistics for all estimated parameters in both the CO2 flux and CH4 uptake models are provided in Table S2. We used the soil flux measurements that were replicated at half the trees (n = 12) and found that modeled CO2 flux and CH4 uptake generally corresponded (Figure S3). However, there remained large variability in the correspondence between measured and modeled soil flux (Figure S3). We caution that this is not necessarily a reliable predictive model, likely due to large variability among soil flux collars, even from within the same tree.

4. Discussion

4.1. Impact of EAB on Microclimate

We hypothesized that EAB-induced tree mortality would influence soil microclimate and subsequently alter CO2 flux and CH4 uptake in soil beneath affected trees. In our system, tree mortality and stress by EAB did not change soil microclimate conditions in a systematic direction. In previous studies of forest pests, outbreaks are often associated with increases in soil moisture, as transpiration of infested trees declines [3,24,56]. However, the fact that soils at our study site had high sand content in combination with the decoupling of monthly precipitation and soil moisture (Figure S1) indicated that our site was well drained, so that changes to plant transpiration from EAB damage might not be strong enough to influence overall soil moisture. Similarly, while previous studies indicate that forest insect disturbance may increase soil temperature [27], this was not the case in our study. We suspect this is due to the small relative size of the canopy gaps created by dead and dying F. americana (see Figure 2c). Indeed, previous studies on the effects of canopy gaps on soil temperature and moisture have found mixed results, but generally see greater impact with larger gaps [57].

4.2. Impact of EAB on CO2 Flux

Our findings agreed with previous studies that soil temperature and moisture overwhelmingly control soil CO2 flux [58]. As we did not find a discernible effect of EAB infestation on these microclimate factors, we are therefore unsurprised that CO2 flux also does not appear to be influenced by EAB impact. Another possibility is that our sample size was not adequate to detect a possible effect of EAB on soil flux. In studies that did find an effect of biotic disturbances on soil CO2 flux [24], the impacted tree species was highly monodominant. In this study, the impacted species composed approximately one-third of the canopy. This difference is particularly important when considering the mechanisms suggested by our models: given that the variables that significantly influence soil CO2 flux included climate and microclimate variables, but did not include root biomass, we would not expect that a diffuse infestation would immediately influence CO2 flux if the infestation does not affect the soil microclimate. In our system, canopy gaps beneath affected trees were relatively small and reductions in transpiration by beetle-killed trees may have been balanced by increased water use of nearby trees. Thus, non-ash tree species unaffected by EAB may have buffered the effects of ash mortality on soil microclimate, and thus on soil CO2 flux.

4.3. Impact of EAB on CH4 Uptake

To our knowledge, this was the first study to assess the potential effects of tree mortality due to insect infestation on soil CH4 uptake. In our mixed effects model, CH4 uptake was strongly inhibited by soil moisture, monthly precipitation, and greatly enhanced by the fraction of sand content in the soil. This agrees with many previous studies that suggest that physical limits to atmosphere-gas diffusion might play a more important role than other soil carbon cycling components of CH4 uptake [35,36,37,59]. While our data did not indicate a relationship between EAB-induced mortality and changes in soil moisture, this may be due to the mixed composition of our study site, and potential effects might be stronger in stands dominated by Fraxinus spp., for example, in riparian areas dominated by Fraxinus nigra Marsh. and/or Fraxinus pennsylvanica Marsh. The lack of F. americana dominance likely also dampened a potential temperature response feedback for CH4 uptake at our site, and areas with more complete canopy mortality will likely experience much higher soil temperatures following EAB infestation.
Our findings suggested that the effect of insect disturbances on carbon dynamics in forests may depend on both edaphic and vegetative properties, and an understanding of these characteristics will complement future studies aiming to connect insect disturbances with ecosystem carbon storage. Sites where soils are poorly drained might experience a stronger effect of EAB infestation on soil carbon flux; for example, in stands of Fraxinus species that grow in riparian areas. Pre- and post-disturbance forest compositions are also likely to affect the magnitude of insect invasions on ecosystem carbon dynamics. In northern temperate forests, F. americana represents a small component of standing tree biomass, and the physiological response of co-dominant tree species in stands affected by EAB may reduce the overall effect of ash mortality on soil carbon fluxes. In less diverse systems where ash represents a greater fraction of forest biomass, the effects of EAB on the forest carbon balance are stronger [14,60]. However, the influence of EAB on forest carbon balance extends far beyond the period of active infestation. Our results support the idea that short-term impacts of insect disturbance on temperate forests are likely dwarfed by the effects of longer-term compositional changes in the tree community and transfer of F. americana snags into the soil pool, which are known to play a critical role in future carbon dynamics of disturbed forests [56,61]. If so, the impact of EAB on forest carbon dynamics will vary widely on a regional and local scale as different species replace ash in affected stands. A predictive framework for these compositional changes will be critical for understanding how EAB may alter forest carbon stocks into the future.
Our results may be relevant when considering management options for forests impacted by EAB. Early management strategies in the U.S. included attempts to use preemptive and salvage logging as a control measure in locations with confirmed EAB infestation [8,62]. While most of these initial attempts were abandoned as regional control strategies, salvage logging, both before and after EAB detection, remains a management strategy in some places [8,62]. Unlike other management techniques, such as insecticide or biological control, preemptive and salvage logging results in the immediate formation of canopy gaps at the site of the removed Fraxinus trees. Our results suggest that changes in microclimate, which is likely linked to the size and distribution of canopy gaps [57], are the critical factor in determining soil carbon flux responses to tree mortality at this scale. Therefore, this management strategy in particular may influence soil carbon fluxes if canopy gaps created by tree removal are large enough to change soil moisture or temperature.

5. Conclusions

As biotic disturbances become more common in temperate forests [63], there is a need to understand the consequences of these events for ecosystem carbon dynamics. Our results demonstrated that the short-term effects of EAB-induced ash mortality on soil carbon dynamics may be minimal in some ecosystems. In our study, EAB infestation did not lead to changes in soil microclimate conditions, possibly owing to coarse soil texture and sufficient drainage, and to the diffuse nature of the infested trees in this mixed forest. EAB-induced tree mortality created no change in CO2 efflux or CH4 uptake from soil beneath affected trees. In ecosystems with poorly drained soils or higher proportions of Fraxinus in the canopy, changes to soil moisture or temperature following widespread Fraxinus mortality may be sufficient to alter these fluxes. Our findings emphasized that soil properties may mediate the effect of tree-killing insects on ecosystem carbon fluxes and should be considered when assessing how invasive pests may alter forest carbon balance following disturbance.

Supplementary Materials

The following are available online at www.mdpi.com/1999-4907/9/1/37/s1, Figure S1: Soil Moisture and Monthly Precipitation, Figure S2: Posterior distributions of random tree effects; Figure S3: Model-data correspondence for replicate tree validation data; Table S1: model posterior distribution statistics for soil microclimate models, Table S2: model posterior distribution statistics for soil CO2 flux and CH4 uptake models.

Acknowledgments

This research was supported by NSF-1638406 and the Wellesley College Provost’s Office. Many thanks to Jim, Susan, and Holly Snyder of Tamarack Farm for access to this study site and for their support and encouragement to conduct this experiment. Emma Conrad-Rooney, Erica Huang, and Lara Jones of Wellesley College all provided laboratory assistance in processing soils from this study. We also appreciate assistance and advice from Dan Brabander, Alden Griffith, and Katrin Monecke in the measurement of soil moisture, soil texture, and soil pH.

Author Contributions

J.H.M., A.K.L., and F.V.J. conceived and designed the experiments; J.H.M., A.K.L., F.V.J., and S.J.R. performed the experiments; J.H.M., A.K.L., and F.V.J. analyzed the data; J.H.M., A.K.L., and F.V.J. wrote the paper.

Conflicts of Interest

The authors declare no conflict of interest.

References

  1. Lovett, G.M.; Weiss, M.; Liebhold, A.M.; Holmes, T.P.; Leung, B.; Lambert, K.F.; Orwig, D.A.; Campbell, F.T.; Rosenthal, J.; McCullough, D.G.; et al. Nonnative forest insects and pathogens in the United States: Impacts and policy options. Ecol. Appl. 2016, 26, 1437–1455. [Google Scholar] [CrossRef] [PubMed]
  2. Boyd, I.L.; Freer-Smith, P.H.; Gilligan, C.A.; Godfray, H.C.J. The consequence of tree pests and diseases for ecosystem services. Science 2013, 342. [Google Scholar] [CrossRef] [PubMed]
  3. Clark, K.L.; Skowronski, N.; Hom, J. Invasive insects impact forest carbon dynamics. Glob. Chang. Biol. 2010, 16, 88–101. [Google Scholar] [CrossRef]
  4. Hicke, J.A.; Allen, C.D.; Desai, A.R.; Dietze, M.C.; Hall, R.J.; Hogg, E.H.; Kashian, D.M.; Moore, D.; Raffa, K.F.; Sturrock, R.N.; et al. Effects of biotic disturbances on forest carbon cycling in the United States and Canada. Glob. Chang. Biol. 2012, 18, 7–34. [Google Scholar] [CrossRef]
  5. Peltzer, D.A.; Allen, R.B.; Lovett, G.M.; Whitehead, D.; Wardle, D.A. Effects of biological invasions on forest carbon sequestration. Glob. Chang. Biol. 2010, 16, 732–746. [Google Scholar] [CrossRef]
  6. Schultz, J.C.; Appel, H.M.; Ferrieri, A.P.; Arnold, T.M. Flexible resource allocation during plant defense responses. Front. Plant Sci. 2013, 4, 324. [Google Scholar] [CrossRef] [PubMed]
  7. Kozlowski, T. Tree physiology and forest pests. J. For. 1969, 67, 118–123. [Google Scholar]
  8. Herms, D.A.; Mc Cullough, D.G. Emerald ash borer invasion of North America: History, biology, ecology, impacts, and management. Annu. Rev. Entomol. 2014, 59, 13–30. [Google Scholar] [CrossRef] [PubMed]
  9. Knight, K.; Robert, P.; Rebbeck, J. How fast will trees die? A transition matrix model of ash decline in forest stands infested by emerald ash borer. In Proceedings of the Emerald Ash Borer Research and Development Meeting, Pittsburgh, PA, USA, 23–24 October 2008; pp. 28–29. [Google Scholar]
  10. McCullough, D.G.; Katovich, S.A. Pest Alert: Emerald Ash Borer; Canadian Food Inspection Agency: Ottawa, ON, USA, 2004; pp. 4–5. [Google Scholar]
  11. Klooster, W.S.; Herms, D.A.; Knight, K.S.; Herms, C.P.; McCullough, D.G.; Smith, A.; Gandhi, K.J.K.; Cardina, J. Ash (Fraxinus spp.) mortality, regeneration, and seed bank dynamics in mixed hardwood forests following invasion by emerald ash borer (Agrilus planipennis). Biol. Invasions 2014, 16, 859–873. [Google Scholar] [CrossRef]
  12. Flower, C.E.; Knight, K.S.; Rebbeck, J.; Gonzalez-Meler, M.A. The relationship between the emerald ash borer (Agrilus planipennis) and ash (Fraxinus spp.) tree decline: Using visual canopy condition assessments and leaf isotope measurements to assess pest damage. For. Ecol. Manag. 2013, 303, 143–147. [Google Scholar] [CrossRef]
  13. Vannatta, A.R.; Hauer, R.H.; Schuettpelz, N.M. Economic Analysis of Emerald Ash Borer (Coleoptera: Buprestidae) Management Options. J. Econ. Entomol. 2012, 105, 196–206. [Google Scholar] [CrossRef] [PubMed]
  14. Flower, C.E.; Knight, K.S.; Gonzalez-Meler, M.A. Impacts of the emerald ash borer (Agrilus planipennis Fairmaire) induced ash (Fraxinus spp.) mortality on forest carbon cycling and successional dynamics in the eastern United States. Biol. Invasions 2013, 15, 931–944. [Google Scholar] [CrossRef]
  15. Scharlemann, J.P.W.; Tanner, E.V.J.; Hiederer, R.; Kapos, V. Global soil carbon: Understanding and managing the largest terrestrial carbon pool. Carbon Manag. 2014, 5, 81–91. [Google Scholar] [CrossRef]
  16. Hamilton, E.W.; Frank, D.A.; Hinchey, P.M.; Murray, T.R. Defoliation induces root exudation and triggers positive rhizospheric feedbacks in a temperate grassland. Soil Biol. Biochem. 2008, 40, 2865–2873. [Google Scholar] [CrossRef]
  17. Guitian, R.; Bardgett, R.D. Plant and soil microbial responses to defoliation in temperate semi-natural grassland. Plant Soil 2000, 220, 271. [Google Scholar] [CrossRef]
  18. Craine, J.M.; Wedin, D.A.; Stuart Chapin, F. Predominance of ecophysiological controls on soil CO2 flux in a Minnesota grassland. Plant Soil 1999, 207, 77–86. [Google Scholar] [CrossRef]
  19. Uhlířová, E.; Šimek, M.; Šantrůčková, H. Microbial transformation of organic matter in soils of montane grasslands under different management. Appl. Soil Ecol. 2005, 28, 225–235. [Google Scholar] [CrossRef]
  20. Gavrichkova, O.; Moscatelli, M.C.; Kuzyakov, Y.; Grego, S.; Valentini, R. Influence of defoliation on CO2 efflux from soil and microbial activity in a Mediterranean grassland. Agric. Ecosyst. Environ. 2010, 136, 87–96. [Google Scholar] [CrossRef]
  21. Frost, C.J.; Hunter, M.D. Insect canopy herbivory and frass deposition affect soil nutrient dynamics and export in oak mesocosms. Ecology 2004, 85, 3335–3347. [Google Scholar] [CrossRef]
  22. Ruess, R.W.; Hendrick, R.L.; Bryant, J.P. Regulation of fine root dynamics by mammalian browsers in early successional Alaskan taiga forests. Ecology 1998, 79, 2706–2720. [Google Scholar] [CrossRef]
  23. Moore, D.J.P.; Trahan, N.A.; Wilkes, P.; Quaife, T.; Stephens, B.B.; Elder, K.; Desai, A.R.; Negron, J.; Monson, R.K. Persistent reduced ecosystem respiration after insect disturbance in high elevation forests. Ecol. Lett. 2013, 16, 731–737. [Google Scholar] [CrossRef] [PubMed]
  24. Nuckolls, A.E.; Wurzburger, N.; Ford, C.R.; Hendrick, R.L.; Vose, J.M.; Kloeppel, B.D. Hemlock Declines Rapidly with Hemlock Woolly Adelgid Infestation: Impacts on the Carbon Cycle of Southern Appalachian Forests. Ecosystems 2009, 12, 179–190. [Google Scholar] [CrossRef]
  25. Morehouse, K.; Johns, T.; Kaye, J.; Kaye, M. Carbon and nitrogen cycling immediately following bark beetle outbreaks in southwestern ponderosa pine forests. For. Ecol. Manag. 2008, 255, 2698–2708. [Google Scholar] [CrossRef]
  26. Hamilton, E.W.; Frank, D.A. Can plants stimulate soil microbes and their own nutrient supply? Evidence from a grazing tolerant grass. Ecology 2001, 82, 2397–2402. [Google Scholar] [CrossRef]
  27. Classen, A.T.; Hart, S.C.; Whitman, T.G.; Cobb, N.S.; Koch, G.W. Insect Infestations Linked to Shifts in Microclimate: Important Climate Change Implications. Soil Sci. Soc. Am. J. 2006, 69, 2049–2057. [Google Scholar] [CrossRef]
  28. Edburg, S.L.; Hicke, J.A.; Lawrence, D.M.; Thornton, P.E. Simulating coupled carbon and nitrogen dynamics following mountain pine beetle outbreaks in the western United States. J. Geophys. Res. 2011, 116, G04033. [Google Scholar] [CrossRef]
  29. Ehrenfeld, J.G. Ecosystem Consequences of Biological Invasions. Annu. Rev. Ecol. Evol. Syst. 2010, 41, 59–80. [Google Scholar] [CrossRef]
  30. Curry, C.L. Modeling the soil consumption of atmospheric methane at the global scale. Glob. Biogeochem. Cycles 2007, 21, GB4012. [Google Scholar] [CrossRef]
  31. Le Mer, J.; Roger, P. Production, oxidation, emission and consumption of methane by soils: A review. Eur. J. Soil Biol. 2001, 37, 25–50. [Google Scholar] [CrossRef]
  32. Dutaur, L.; Verchot, L.V. A global inventory of the soil CH4 sink. Glob. Biogeochem. Cycles 2007, 21, GB4013. [Google Scholar] [CrossRef]
  33. Serrano-Silva, N.; Sarria-Guzmán, Y.; Dendooven, L.; Luna-Guido, M. Methanogenesis and Methanotrophy in Soil: A Review. Pedosphere 2014, 24, 291–307. [Google Scholar] [CrossRef]
  34. Mancinelli, R.L. The regulation of methane oxidation in soil. Annu. Rev. Microbiol. 1995, 49, 581–605. [Google Scholar] [CrossRef] [PubMed]
  35. Adamsen, A.P.S.; King, G.M. Methane consumption in temperate and subarctic forest soils: Rates, vertical zonation, and responses to water and nitrogen. Appl. Environ. Microbiol. 1993, 59, 485–490. [Google Scholar] [PubMed]
  36. Striegl, R.G. Diffusional limits to the consumption of atmospheric methane by soils. Chemosphere 1993, 26, 715–720. [Google Scholar] [CrossRef]
  37. Castro, M.S.; Steudler, P.; Melillo, J.M. Factors controlling atmospheric methane consumption by temperate forest soils. Glob. Biogeochem. Cycles 1995, 9, 1–10. [Google Scholar] [CrossRef]
  38. Borken, W.; Davidson, E.A.; Savage, K.; Sundquist, E.T.; Steudler, P. Effect of summer throughfall exclusion, summer drought, and winter snow cover on methane fluxes in a temperate forest soil. Soil Biol. Biochem. 2006, 38, 1388–1395. [Google Scholar] [CrossRef]
  39. Billings, S.A.; Richter, D.D.; Yarie, J. Sensitivity of soil methane fluxes to reduced precipitation in boreal forest soils. Soil Biol. Biochem. 2000, 32, 1431–1441. [Google Scholar] [CrossRef]
  40. National Oceanic and Atmospheric Administration. National Centers for Environmental Information Climate Data Online. Available online: https://www.ncdc.noaa.gov/cdo-web/ (accessed on 14 December 2017).
  41. Davidson, E.A.; Savage, K.; Verchot, L.V.; Navarro, R. Minimizing artifacts and biases in chamber-based measurements of soil respiration. Agric. For. Meteorol. 2002, 113, 21–37. [Google Scholar] [CrossRef]
  42. Davidson, E.A.; Belk, E.; Boone, R.D. Soil water content and temperature as independent or confounded factors controlling soil respiration in a temperate mixed hardwood forest. Glob. Chang. Biol. 1998, 4, 217–227. [Google Scholar] [CrossRef]
  43. Cueva, A.; Bullock, S.H.; López-Reyes, E.; Vargas, R. Potential bias of daily soil CO2 efflux estimates due to sampling time. Sci. Rep. 2017, 7, 11925. [Google Scholar] [CrossRef] [PubMed]
  44. Pirk, N.; Mastepanov, M.; Parmentier, F.-J.W.; Lund, M.; Crill, P.; Christensen, T.R. Calculations of automatic chamber flux measurements of methane and carbon dioxide using short time series of concentrations. Biogeosciences 2016, 13, 903–912. [Google Scholar] [CrossRef]
  45. United States Department of Agriculture. Soil Mechanics Level 1, Module 3: USDA Textural Soil Classification; United States Department of Agriculture: Washington, DC, USA, 1987.
  46. Stan Development Team. RStan: The R Interface to Stan; Stan Development Team: New York, NY, USA, 2017. [Google Scholar]
  47. Brooks, S.P.; Gelman, A. Interface Foundation of America General Methods for Monitoring Convergence of Iterative Simulations General Methods for Monitoring Convergence of Iterative Simulations. J. Comput. Graph. Stat. 1998, 7, 434–455. [Google Scholar] [CrossRef]
  48. R Core Team. R: A Language and Environment for Statistical Computing; R Core Team: Vienna, Austria, 2017. [Google Scholar]
  49. EAB_soilflux GitHub Code Respository. Available online: https://github.com/jhmatthes/EAB_soilflux (accessed on 12 January 2018).
  50. Wickham, H. Tidyverse: Easily Install and Load “Tidyverse” Packages, version 1.2.1; R Core Team: Vienna, Austria, 2017. [Google Scholar]
  51. Wickham, H. Forcats: Tools for Working with Categorical Variables (Factors), version 0.2.0; R Core Team: Vienna, Austria, 2017. [Google Scholar]
  52. Wickham, H. Stringr: Simple, Consistent Wrappers for Common String Operations, version 1.2.0; R Core Team: Vienna, Austria, 2017. [Google Scholar]
  53. Grolemund, G.; Wickham, H. Dates and Times Made Easy with lubridate. J. Stat. Softw. 2011, 40, 1–25. [Google Scholar] [CrossRef]
  54. Wilke, C.O. ggridges: Ridgeline Plots in “ggplot2”, version 0.4.1; R Core Team: Vienna, Austria, 2017. [Google Scholar]
  55. Auguie, B. gridExtra: Miscellaneous Functions for “Grid” Graphics, version 2.3; R Core Team: Vienna, Austria, 2017. [Google Scholar]
  56. Reed, D.E.; Ewers, B.E.; Pendall, E. Impact of mountain pine beetle induced mortality on forest carbon and water fluxes. Environ. Res. Lett. 2014, 9. [Google Scholar] [CrossRef]
  57. Muscolo, A.; Bagnato, S.; Sidari, M.; Mercurio, R. A review of the roles of forest canopy gaps. J. For. Res. 2014, 25, 725–736. [Google Scholar] [CrossRef]
  58. Raich, J.W.; Tufekciogul, A. Vegetation and soil respiration: Correlations and controls. Biogeochemistry 2000, 48, 71–90. [Google Scholar] [CrossRef]
  59. Blankinship, J.C.; Brown, J.R.; Dijkstra, P.; Allwright, M.C.; Hungate, B.A. Response of Terrestrial CH4 Uptake to Interactive Changes in Precipitation and Temperature Along a Climatic Gradient. Ecosystems 2010, 13, 1157–1170. [Google Scholar] [CrossRef]
  60. Flower, C.E.; Gonzalez-Meler, M.A. Responses of temperate forest productivity to insect and pathogen disturbances. Annu. Rev. Plant Biol. 2015, 66, 547–569. [Google Scholar] [CrossRef] [PubMed]
  61. Crowley, K.F.; Lovett, G.M.; Arthur, M.A.; Weathers, K.C. Long-term effects of pest-induced tree species change on carbon and nitrogen cycling in northeastern U.S. forests: A modeling analysis. For. Ecol. Manag. 2016, 372, 269–290. [Google Scholar] [CrossRef]
  62. Van Driesche, R.G.; Reardon, R.C. Biology and Control of Emerald Ash Borer; USDA: Washington, DC, USA, 2015; p. 171. [Google Scholar]
  63. Sturrock, R.N.; Frankel, S.J.; Brown, A.V.; Hennon, P.E.; Kliejunas, J.T.; Lewis, K.J.; Worrall, J.J.; Woods, A.J. Climate change and forest diseases. Plant Pathol. 2011, 60, 133–149. [Google Scholar] [CrossRef]
Figure 1. Null hypothesis (H0) and two alternate hypotheses (H1 and H2) for the effect of tree stress induced by the emerald ash borer (EAB) on soil CO2 flux and CH4 uptake. H0 poses that there is no net change on soil flux, including autotrophic (Ra) and heterotrophic (Rh) respiration, since processes that differ beneath live and dead Fraxinus americana L. might balance each other. Other alternate hypotheses suggest that either live or dead F. americana might have higher soil flux due to biological and physical changes to the soil beneath impacted trees.
Forests 09 00037 g001
Figure 2. Evidence of emerald ash borer (EAB) impact and relative locations of study trees: (a) D-shaped exit hole in trunk from an emerging adult beetle; (b) thinning canopy of an impacted tree; (c) bare canopy and conspicuous light gap surrounding EAB-killed trees; (d) study trees from Plot 1; and (e) Plot 2 on a 11 September 2017 true-color satellite image, where red indicates trees that were dead from the start of the study, orange indicates trees that died during the study, and yellow indicates trees that were stressed by the end of the study.
Forests 09 00037 g002
Figure 3. Emerald Ash Borer (EAB) impact classes of F. americana in July 2016 and 2017 from visual surveys. EAB impacts, estimated by visual surveys well after leaf-out, rapidly progressed within this forest stand from 2016 to 2017, where no F. americana remained in the Healthy class in 2017.
Forests 09 00037 g003
Figure 4. Monthly Mean Temperature and Total Precipitation in 2016 and 2017: (a) Monthly mean temperature was significantly higher than the 75% quartile range of the 30-year climatology for July, August, September, and November in 2016, and for September and October in 2017. (b) Monthly total precipitation was much higher in 2017 than in 2016 for May, June, and October, and the values for 2017 in those months were also higher than the 75% quartile of the 30-year climatology for total precipitation (box plot).
Forests 09 00037 g004
Figure 5. Seasonal patterns in CO2 flux and CH4 uptake: (a) monthly soil CO2 flux and (b) monthly soil CH4 uptake aggregated across all replicates both followed a clear seasonal pattern, with the highest efflux in mid-summer. For CO2 flux, the measurements collected in 2016 and 2017 were significantly different only during June and July (paired t-test, p < 0.05) and the CH4 uptakes in 2016 and 2017 were significantly different during July, August, and September (paired t-test, p < 0.05).
Forests 09 00037 g005
Figure 6. Monthly CO2 flux and CH4 uptake differences in 2016 and 2017 organized by trees that were stressed by emerald ash borer (EAB) during the experiment (Impacted) or already dead at the start of the experiment (Dead): (a) monthly soil CO2 flux 2016–2017 differences and (b) monthly soil CH4 uptake 2016–2017 differences had no consistent trends. Whether a tree was impacted by EAB during the experiment or dead from the start of the experiment did not have a significant impact on soil CO2 flux or CH4 uptake differences between 2016 and 2017.
Forests 09 00037 g006
Table 1. Fixed regression parameters were estimated separately for CO2 flux and CH4 uptake Bayesian linear mixed models. Bolded regression parameters reflect posterior estimates with more than 90% of the posterior probability density different from zero, and italicized parameter estimates reflect posterior distributions where >50% of the probability density bridges zero. DBH: diameter at breast height (1.3 m from ground level).
ParameterVariable RangeCO2 Param MedianCO2 95% IntervalCH4 Param MedianCH4 95% Interval
Interceptn/a−7.65−15.64–0.534.2521.0–12.2
Soil Temperature 7–20 °C0.060.03–0.080.030.03–0.08
Soil Moisture0.009–0.530 m3 m−30.21−0.35–0.76−6.00−7.99–−3.91
Monthly Rainfall5.64–19.9 cm−0.02−0.03–0.000.010.06–0.03
Fraction Sand0.92–0.997.740.60–14.612.63−1.45–27.11
pH4.05–5.430.090.34–0.55−0.83−1.73–0.08
DBH24.7–66.5 cm0.010.01–0.01n/an/a
Root Biomass0.67–7.55 g0.060.14–0.03n/an/a

