Increased Vegetation Greenness Aggravates Water Conflicts during Lasting and Intensifying Drought in the Poyang Lake Watershed, China

 ,
,  ,
,
Abstract
:1. Introduction
2. Data and Methods
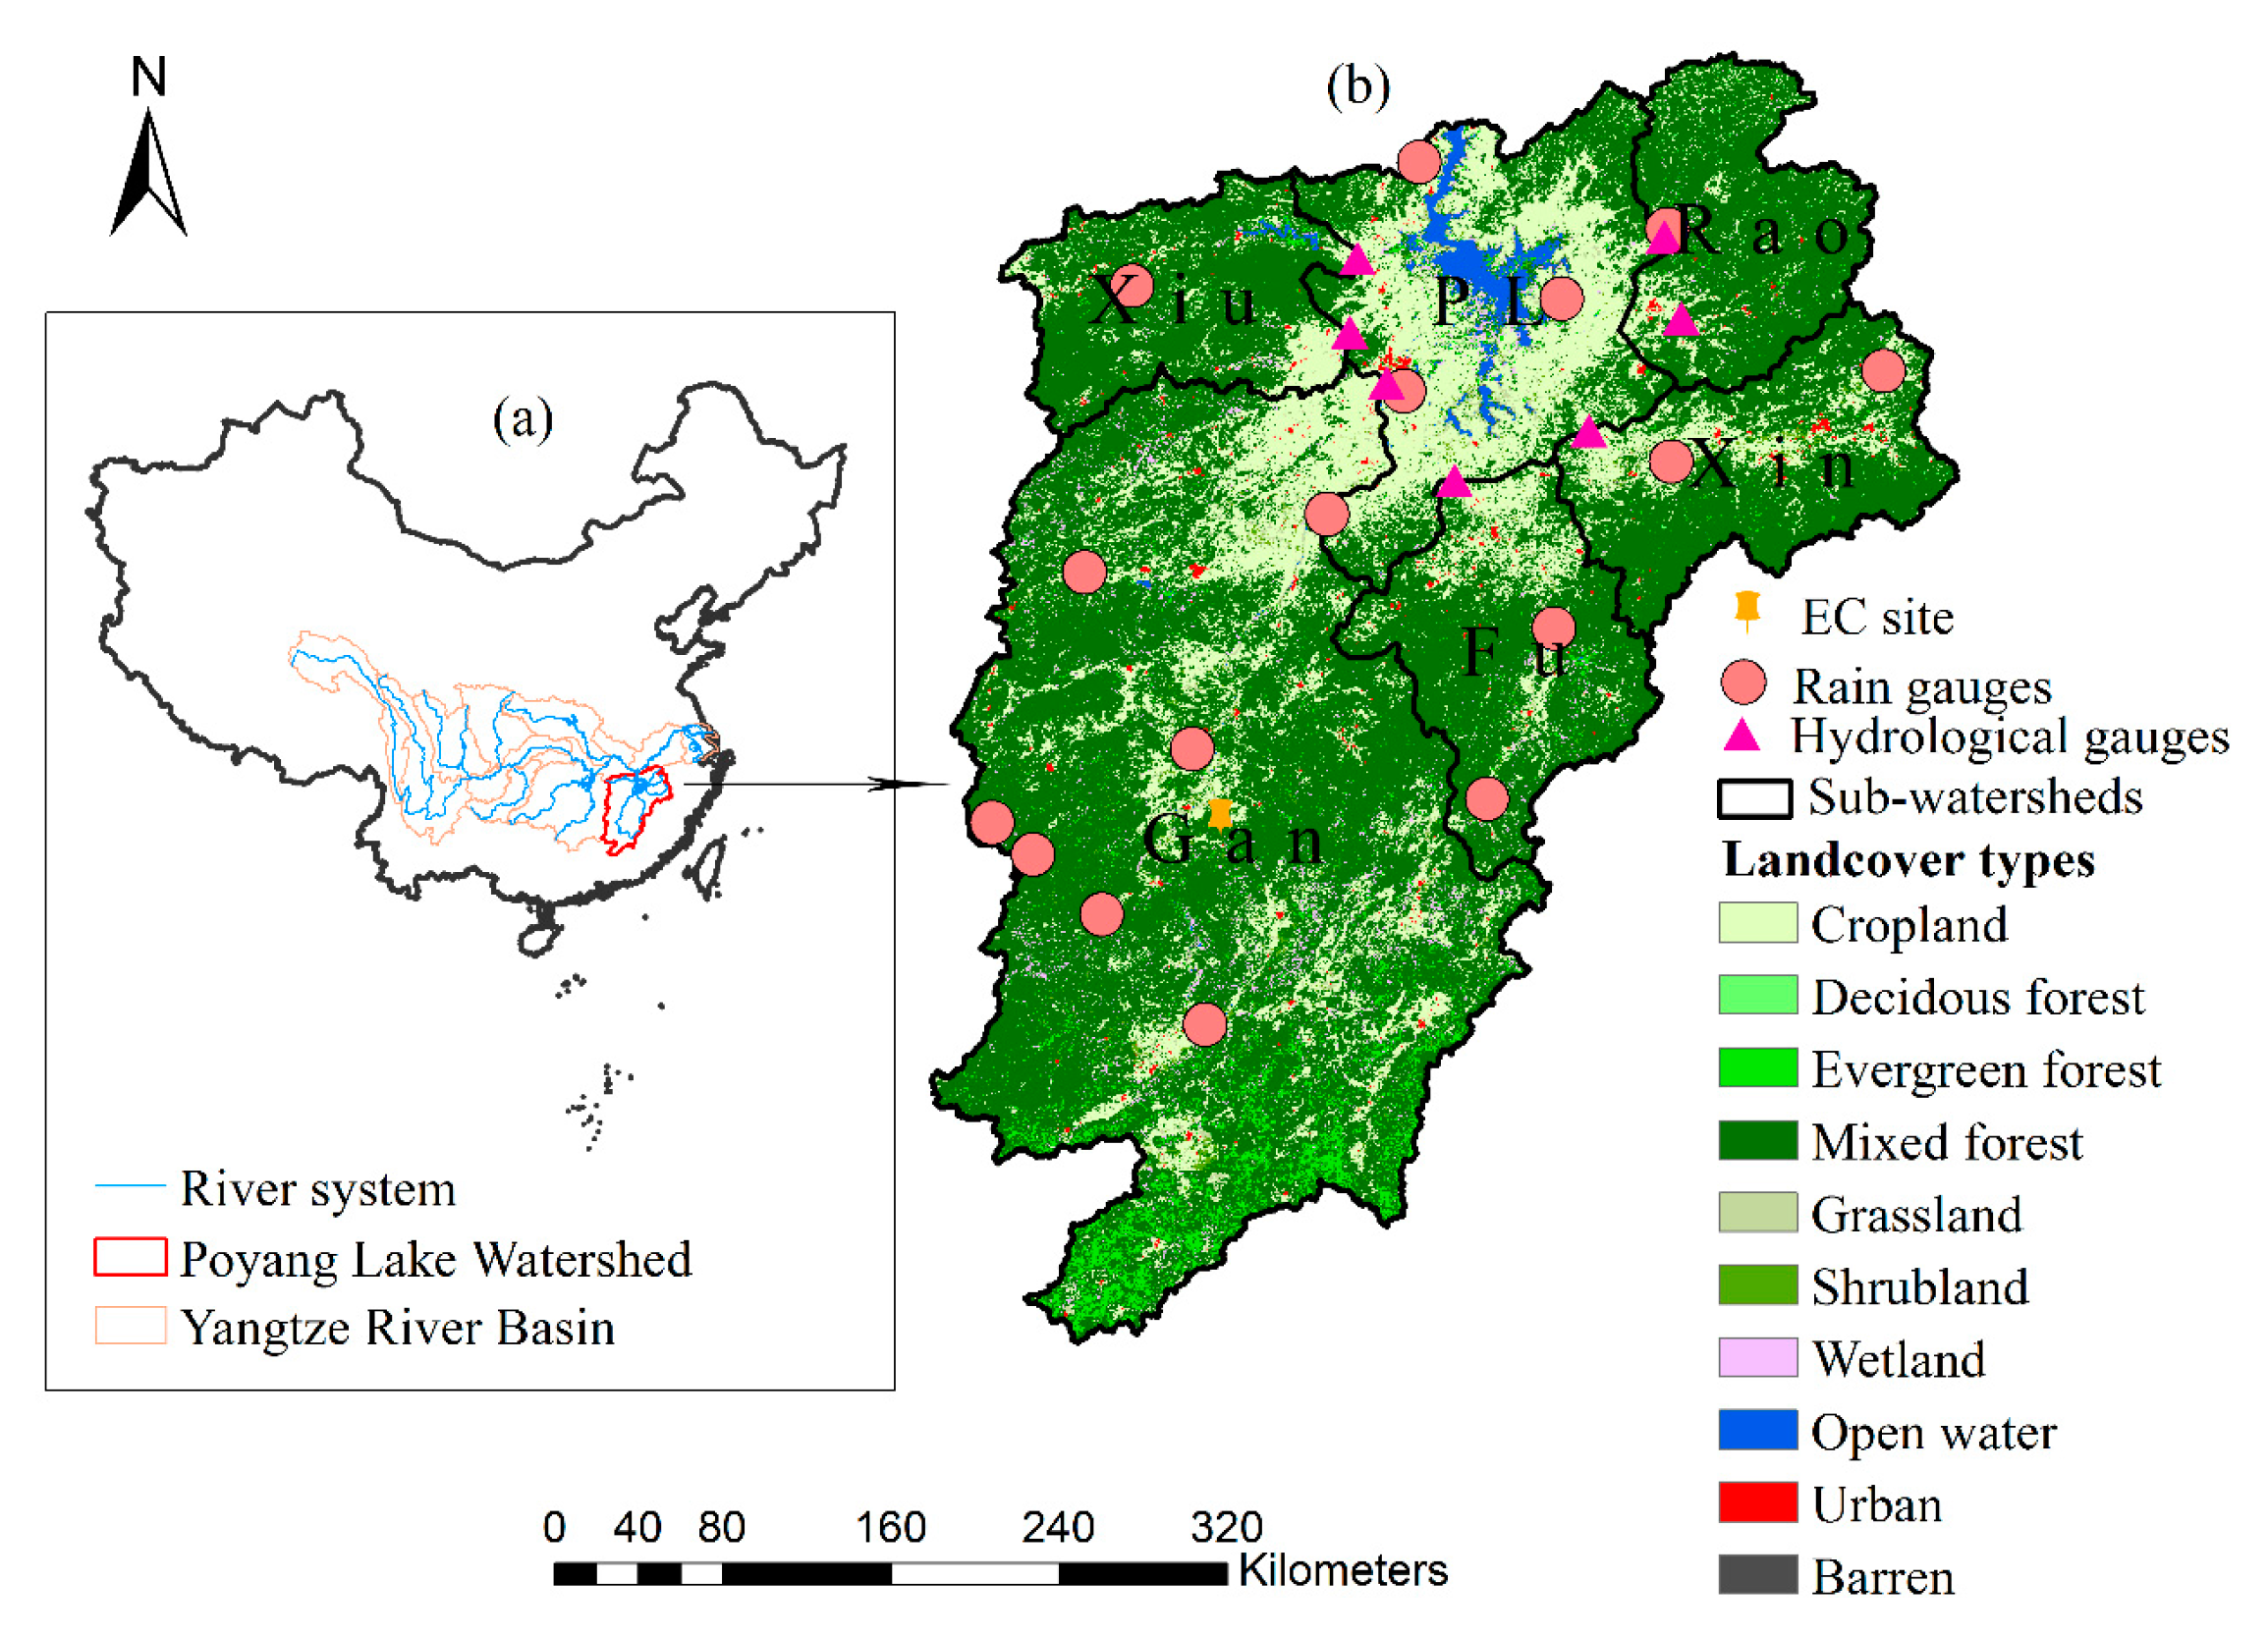
2.1. Study Area
2.2. Drought Assessment
2.3. Vegetation Greenness Changes Detection
2.4. WaSSI Model and Its Modification
2.4.1. WaSSI Model
2.4.2. Modifying the WaSSI Model
2.5. Driving and Validation Data
2.6. Scenarios Designed
3. Results
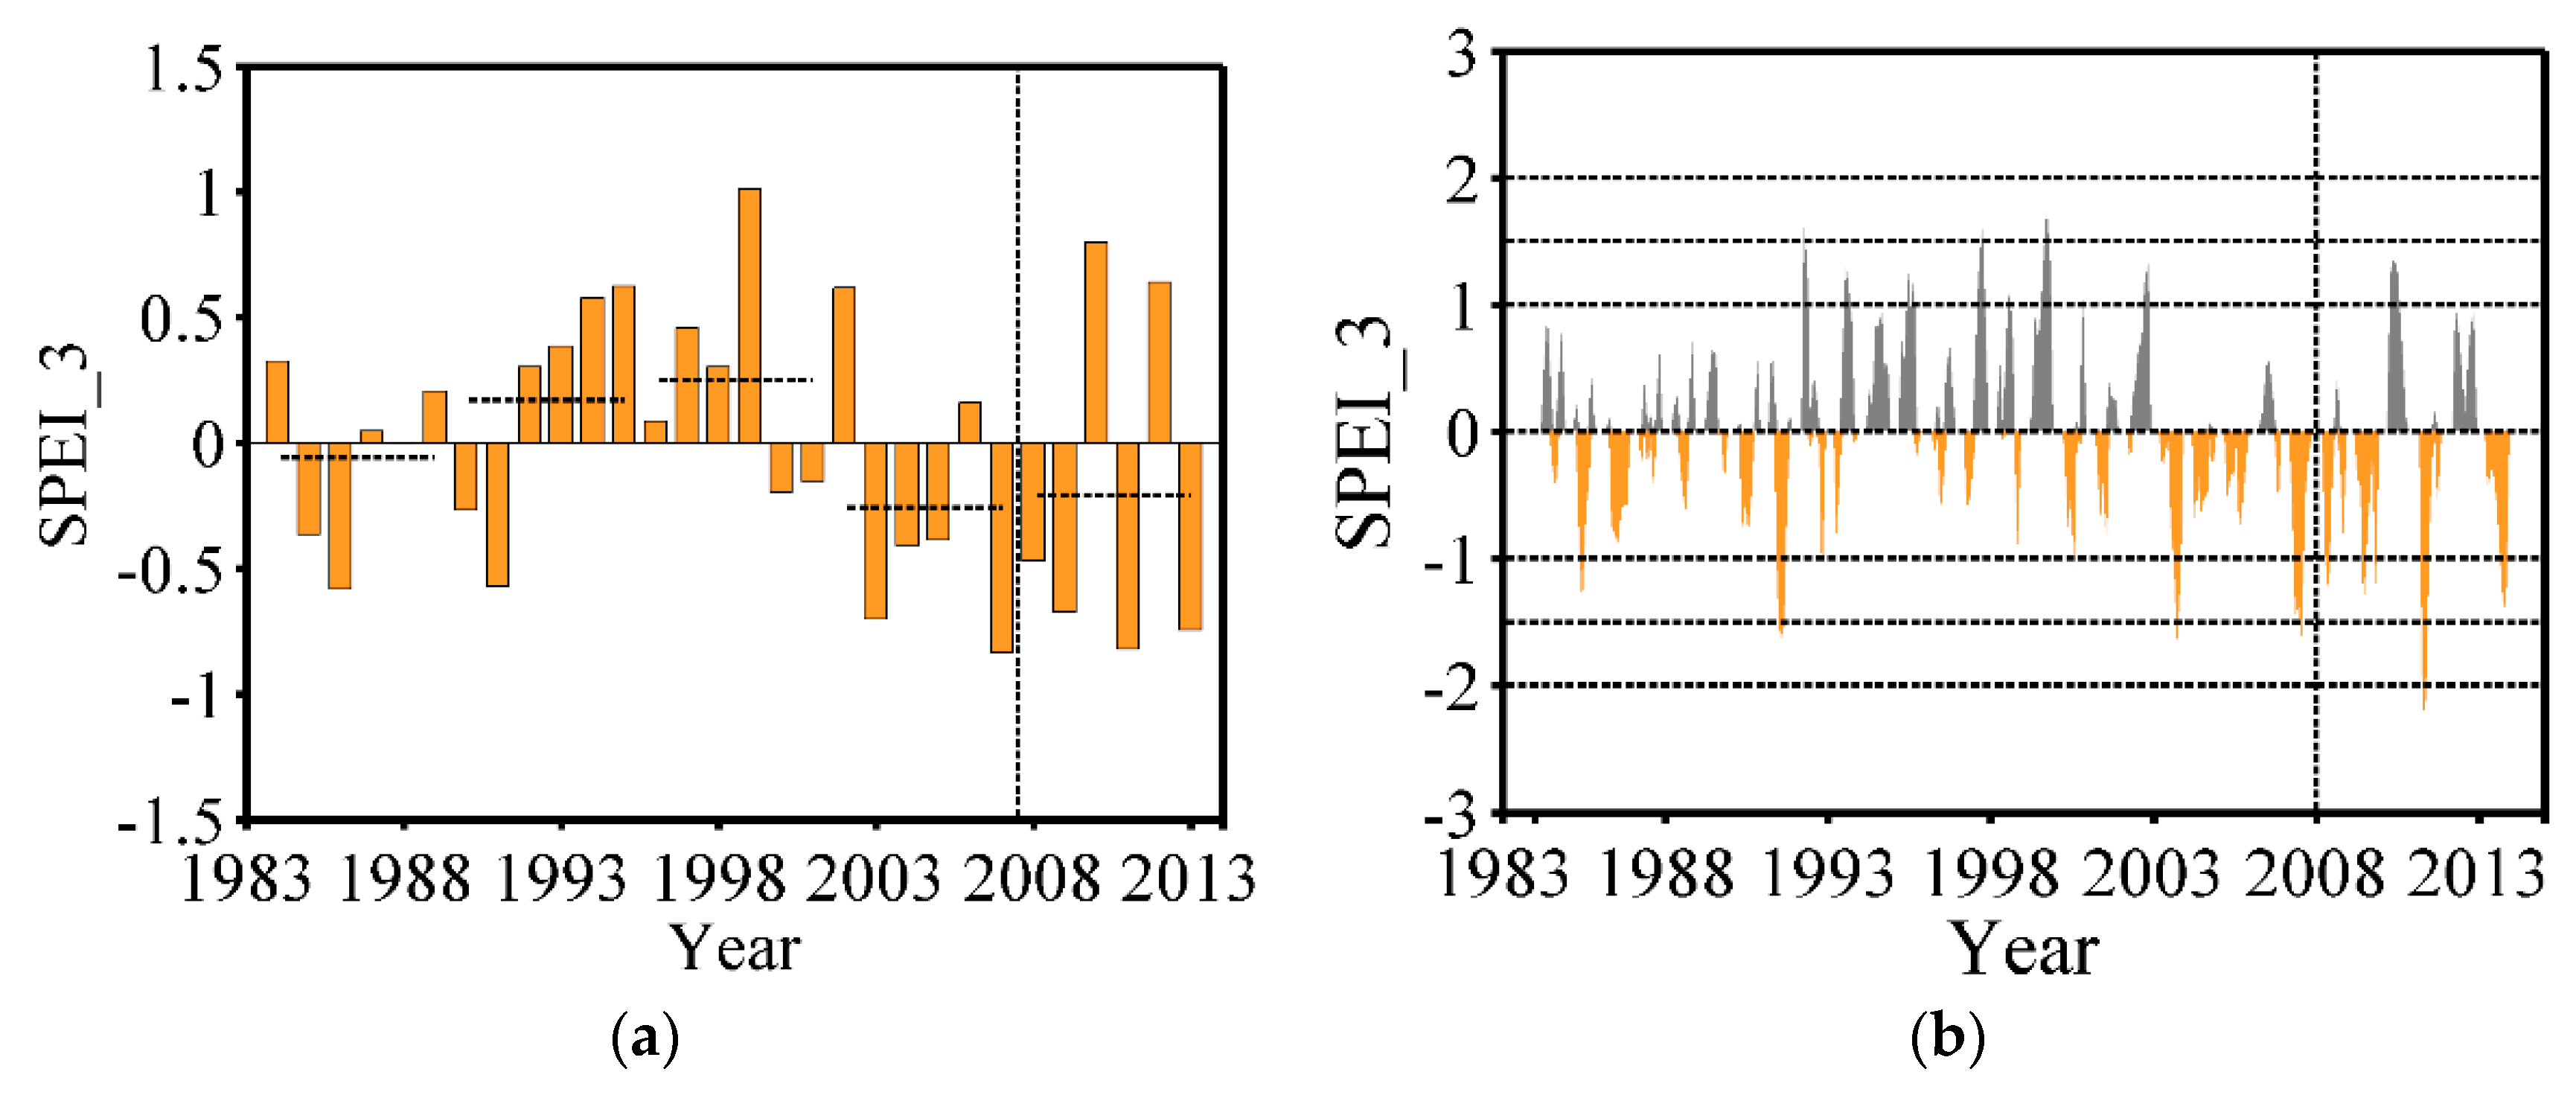
3.1. Identifying Droughts with Differing Intensity
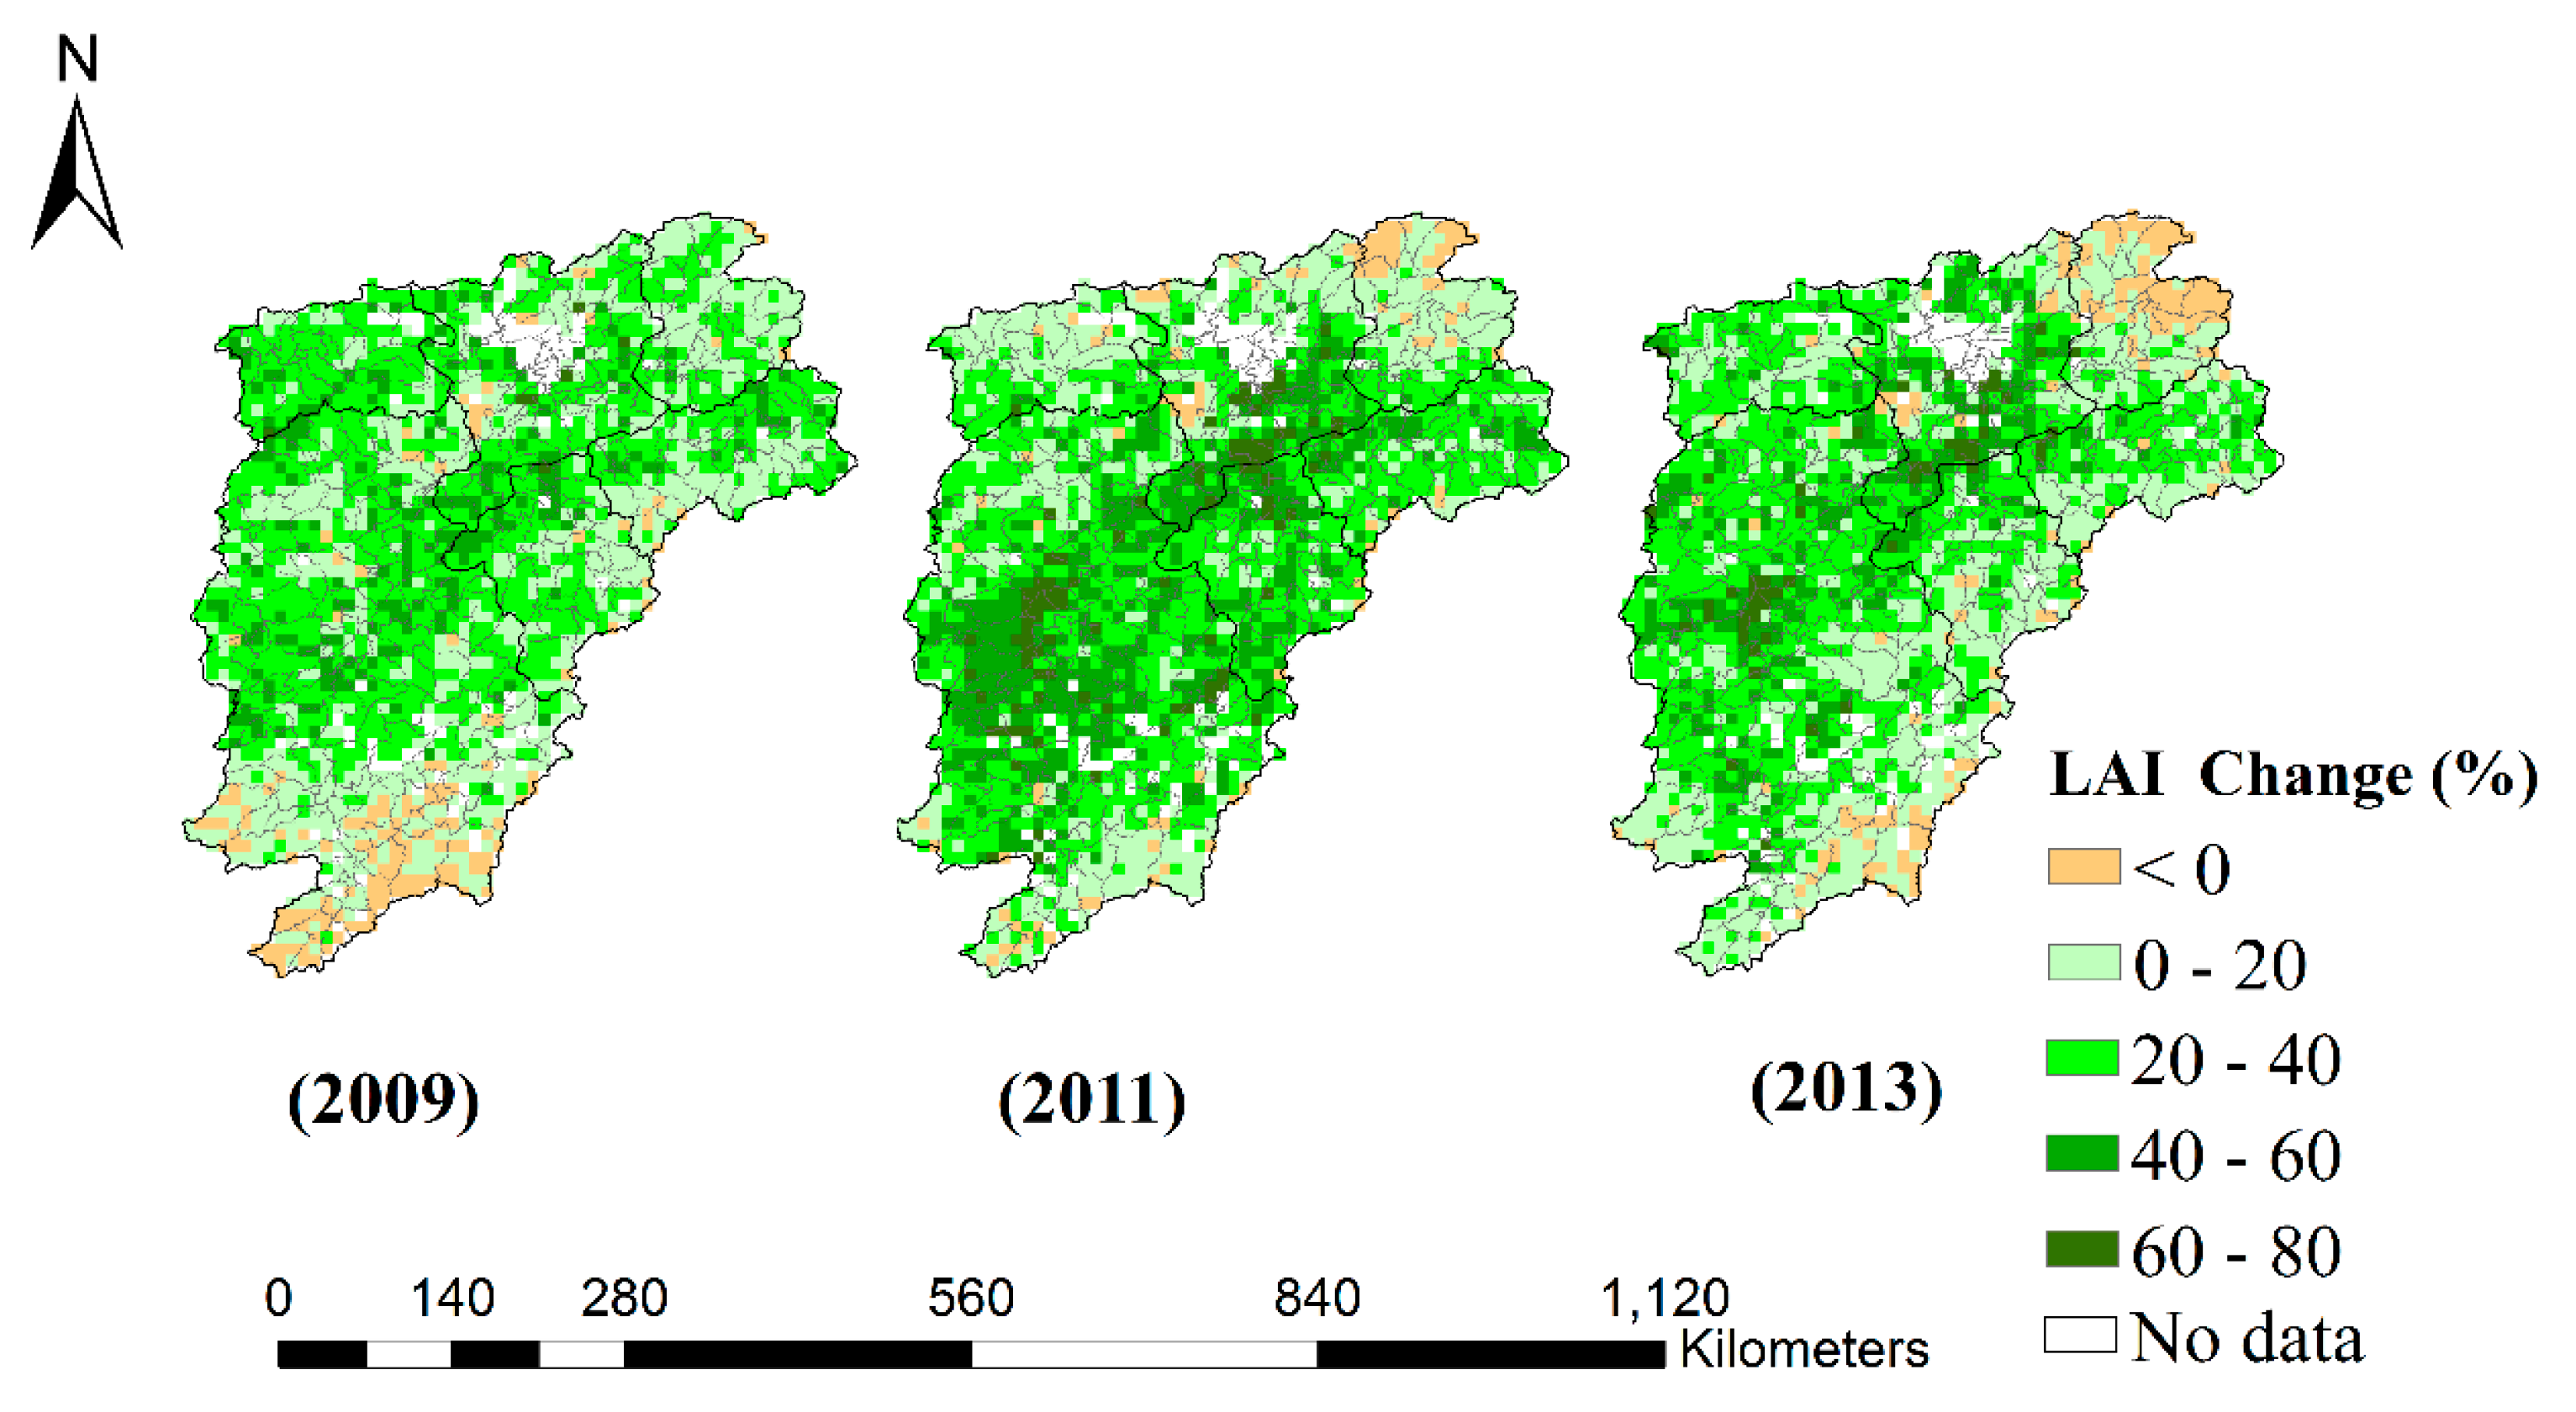
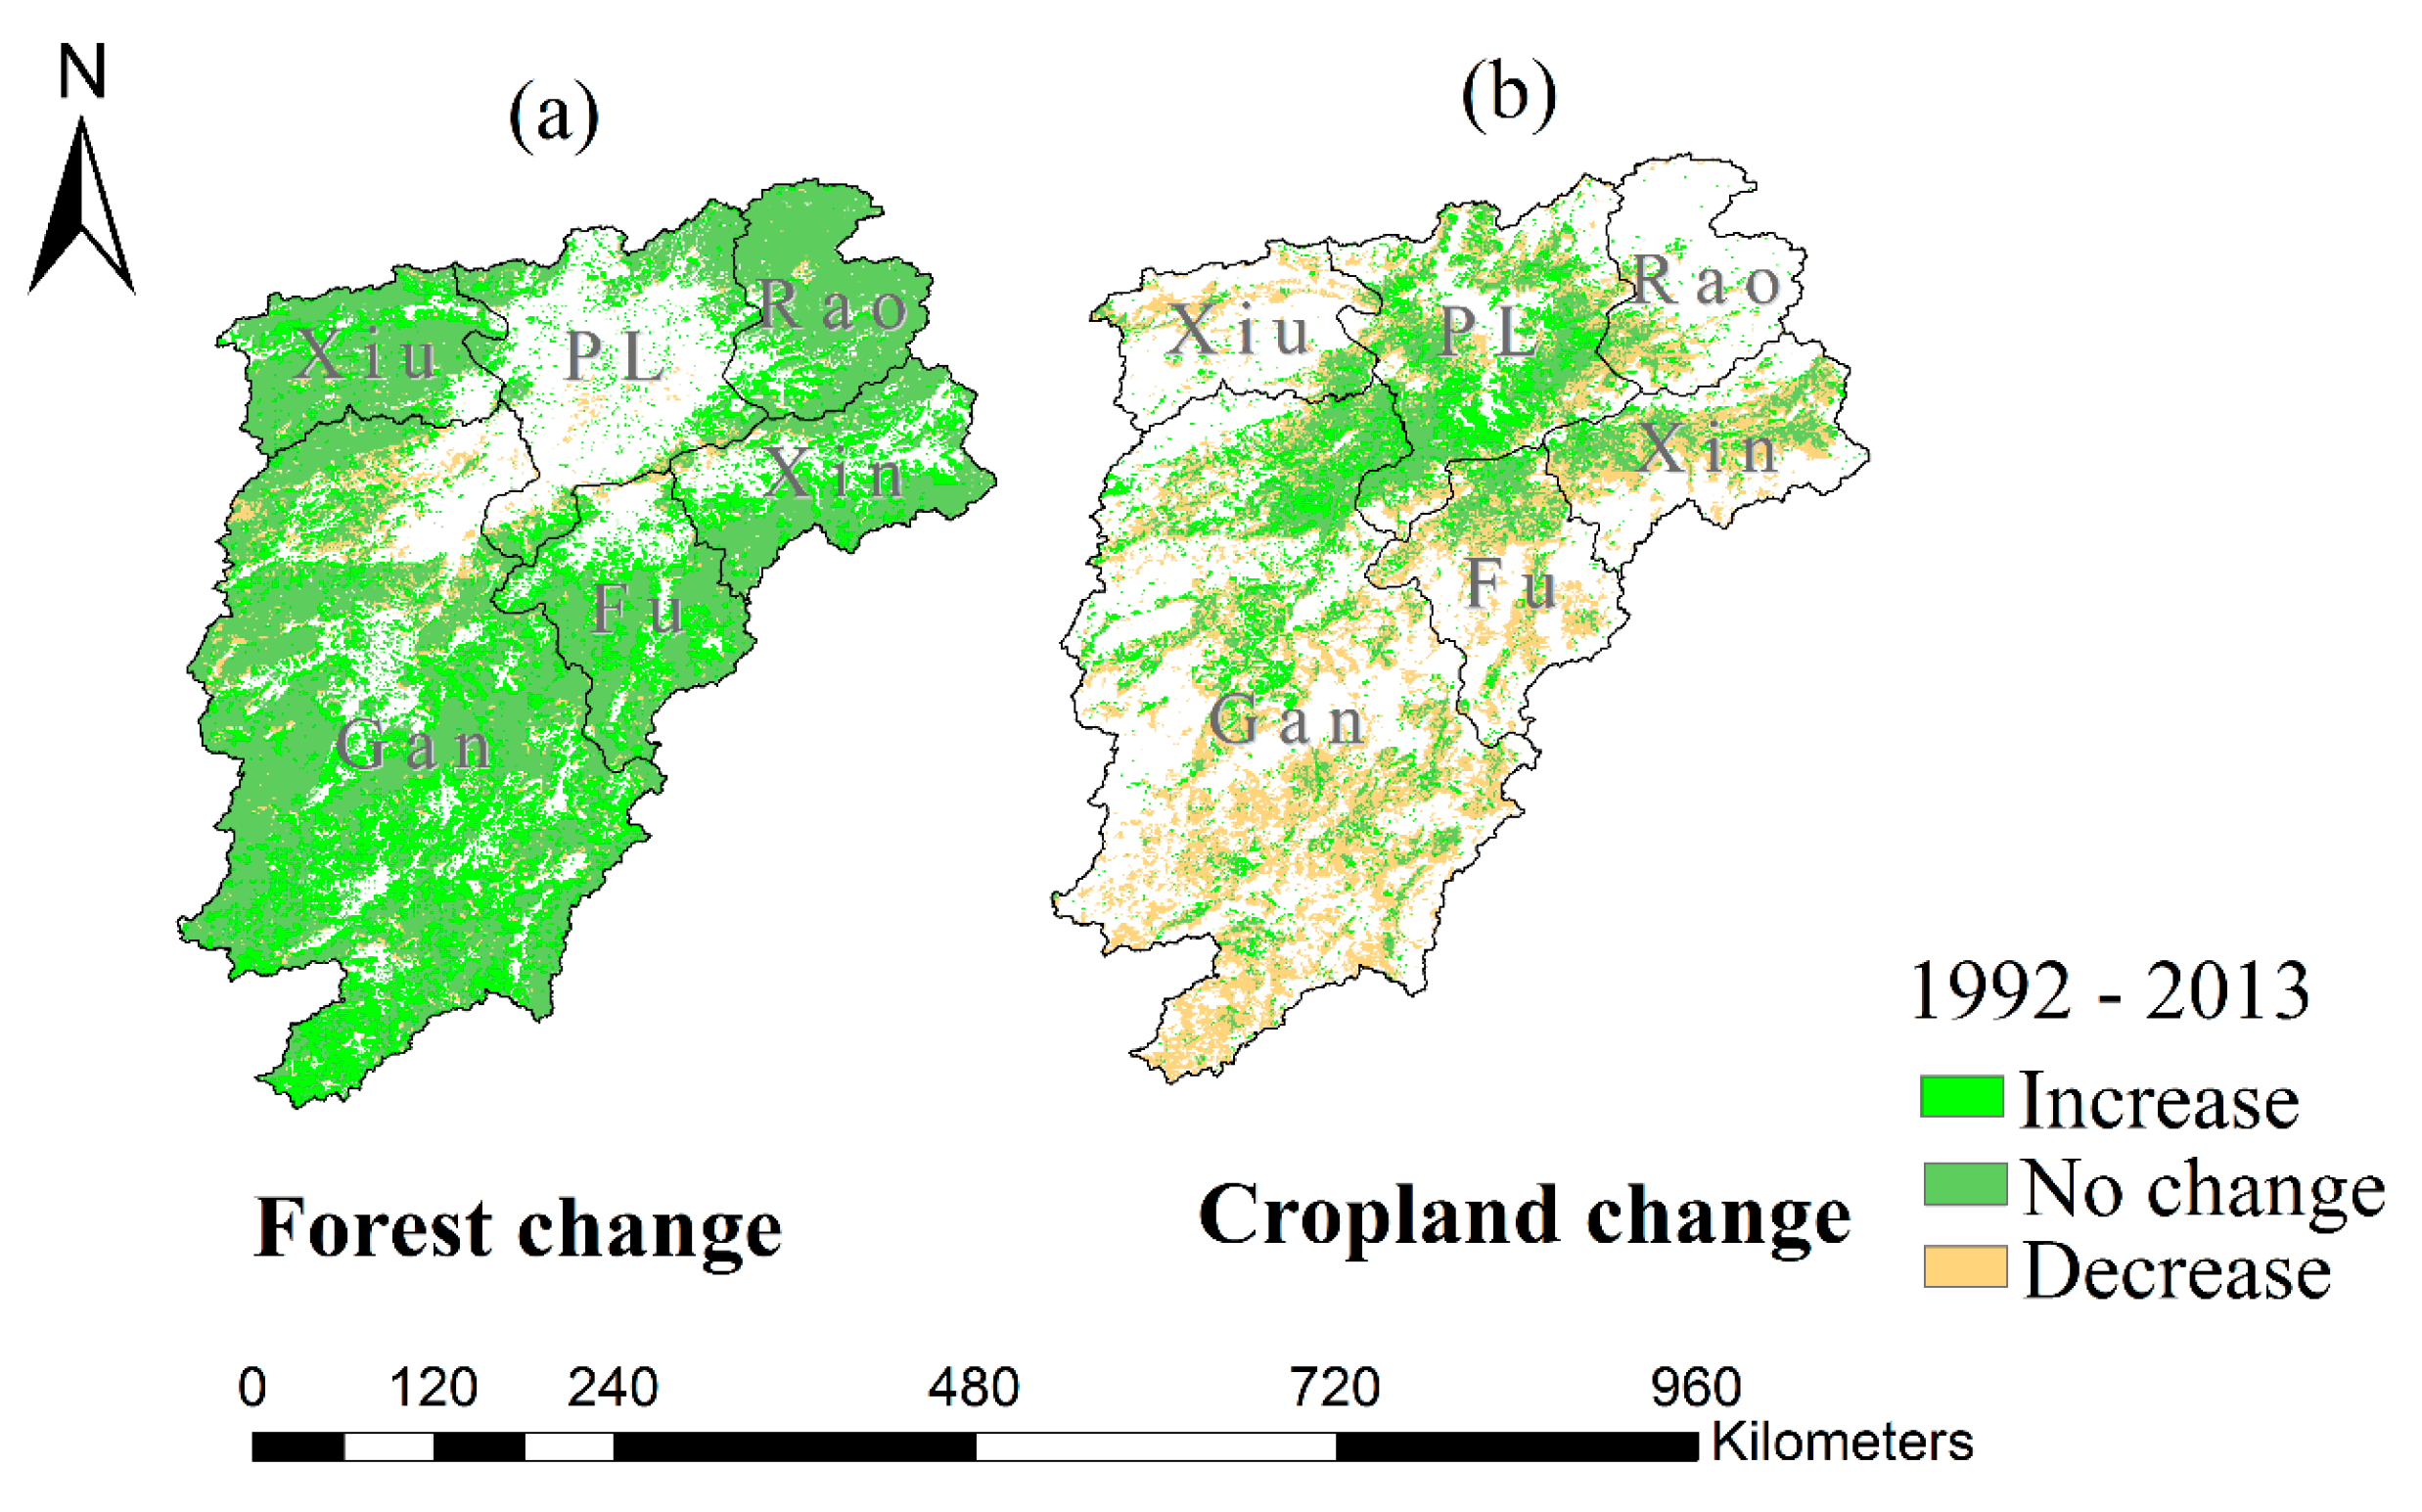
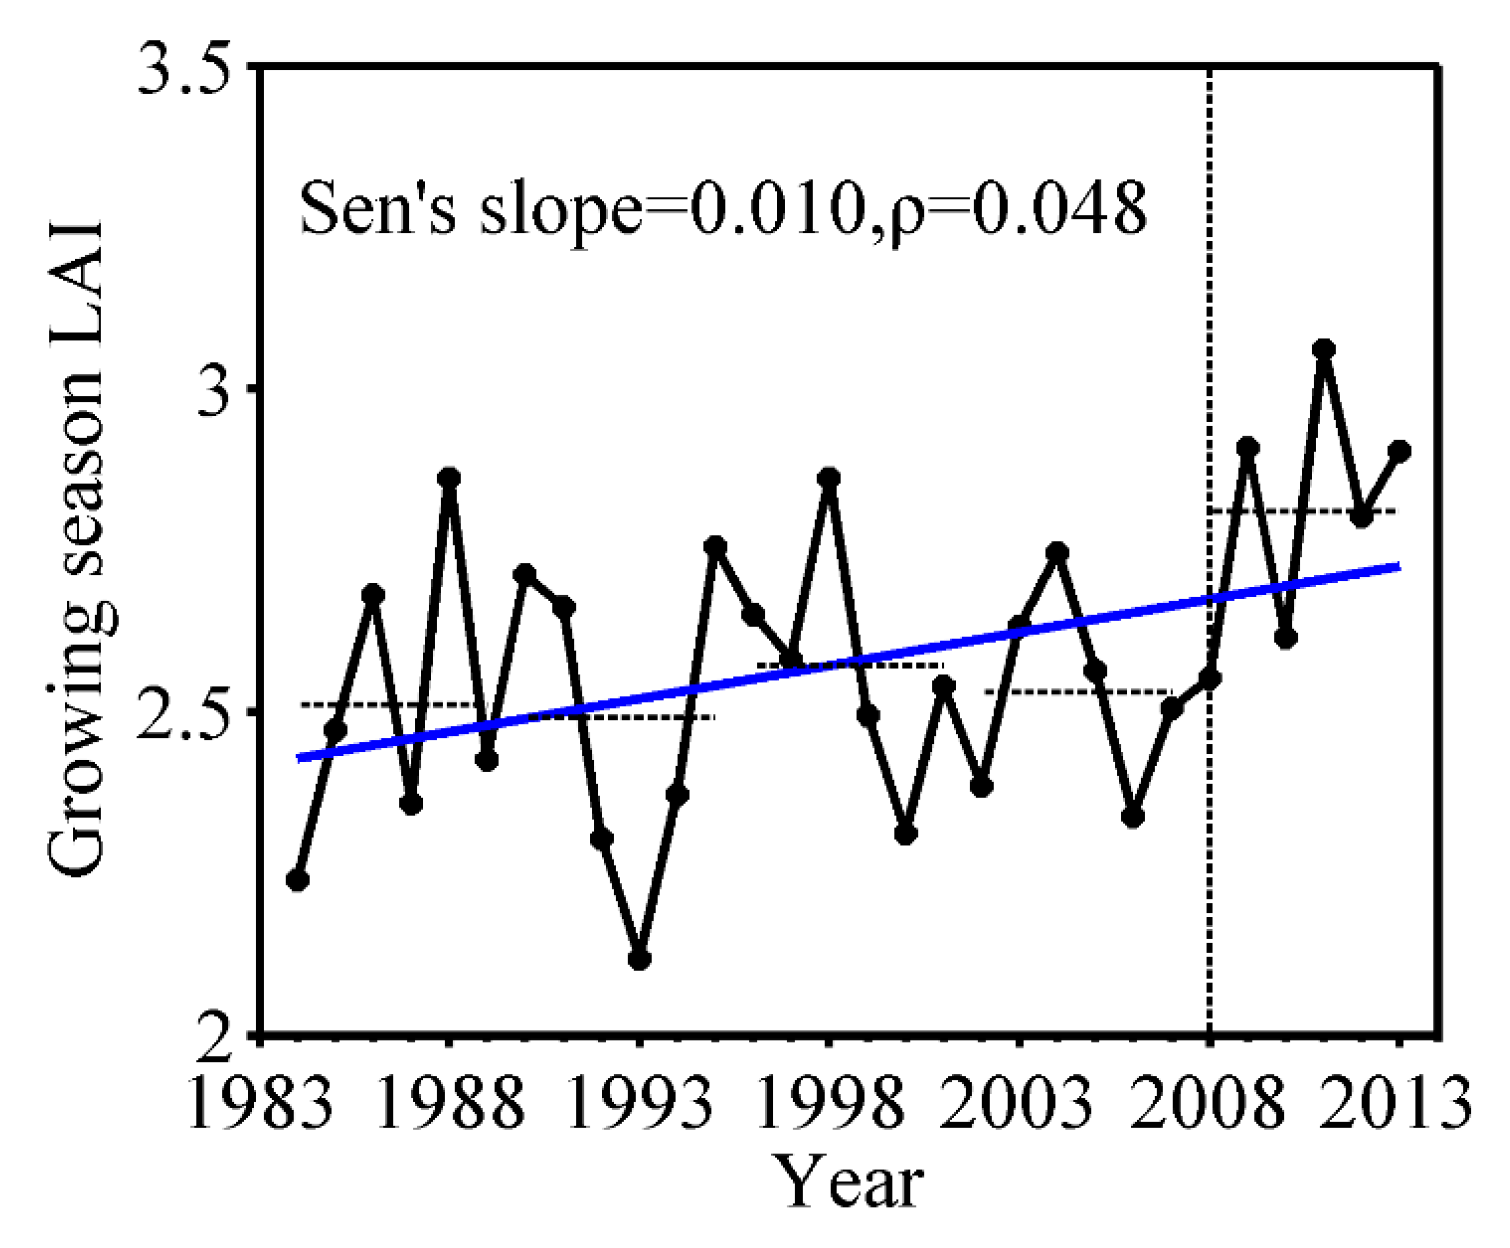
3.2. Variation of Vegetation Greenness
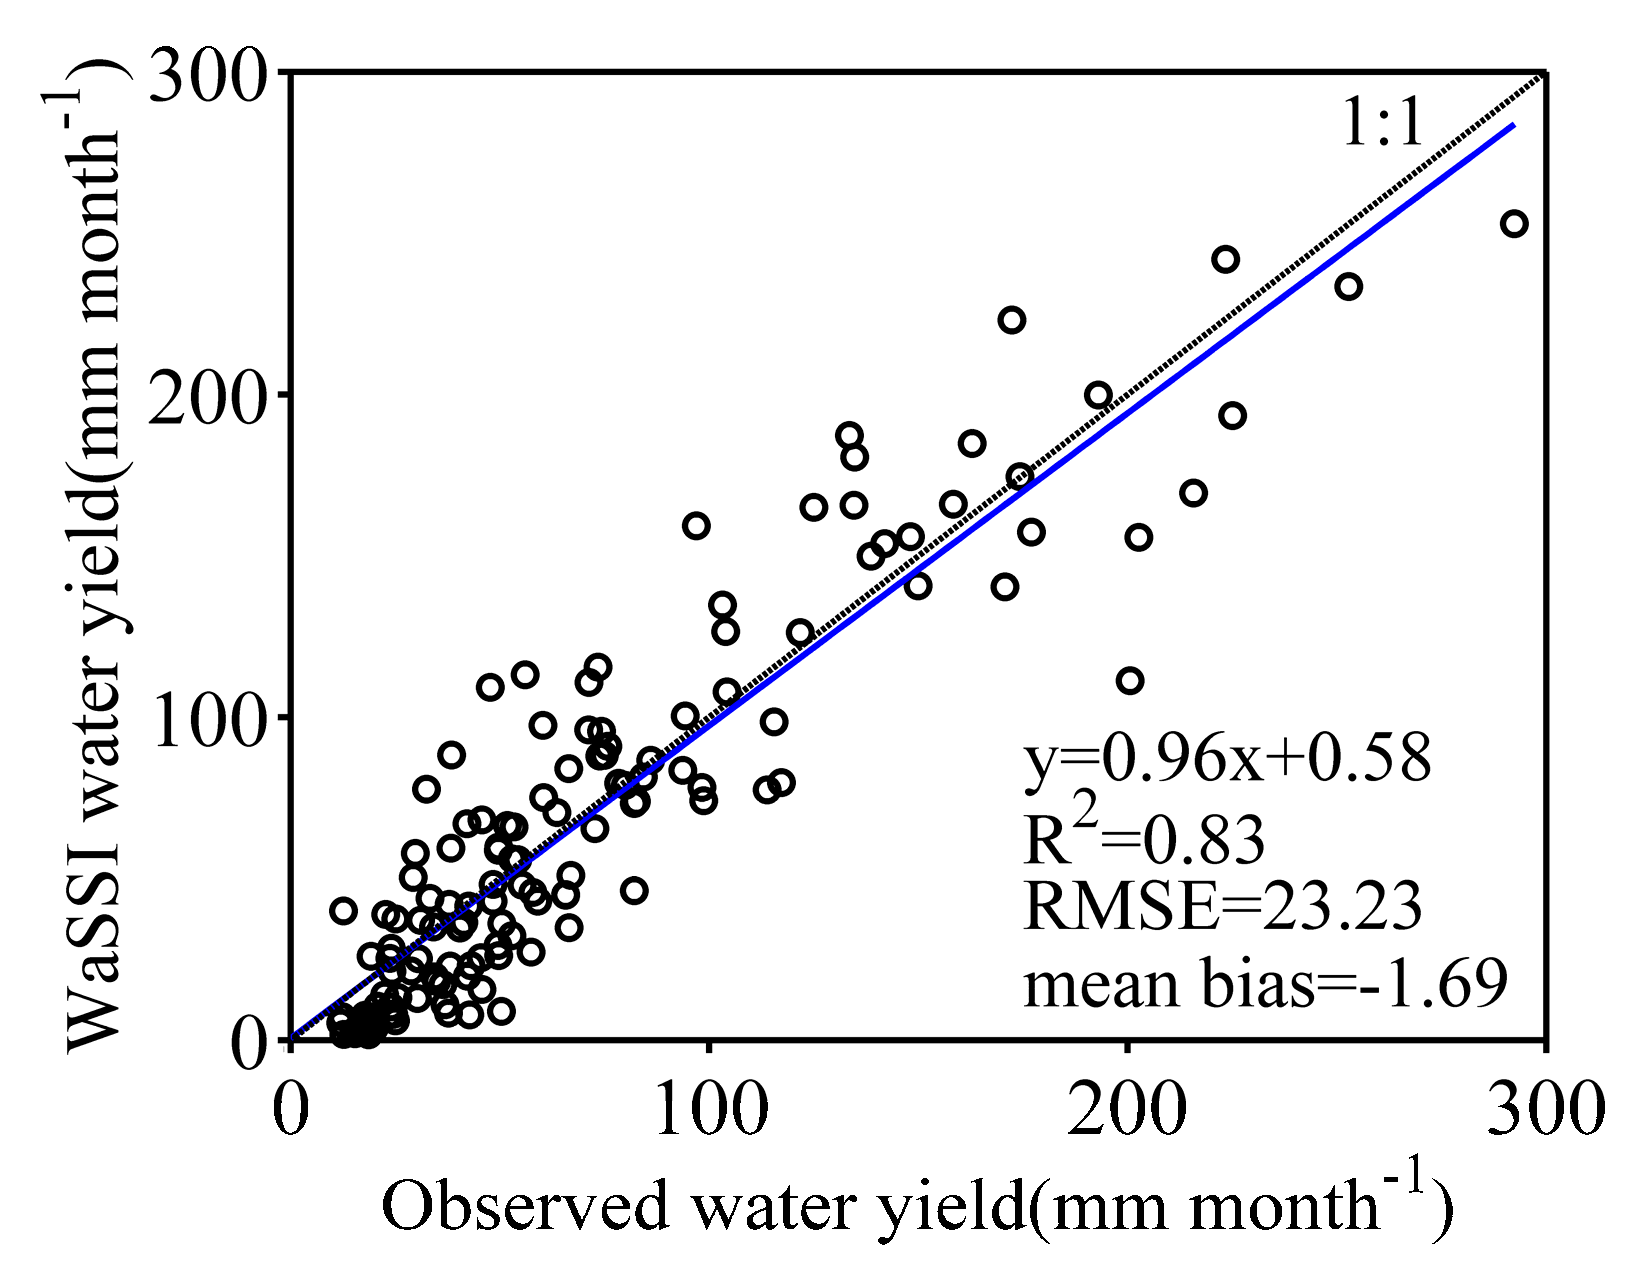
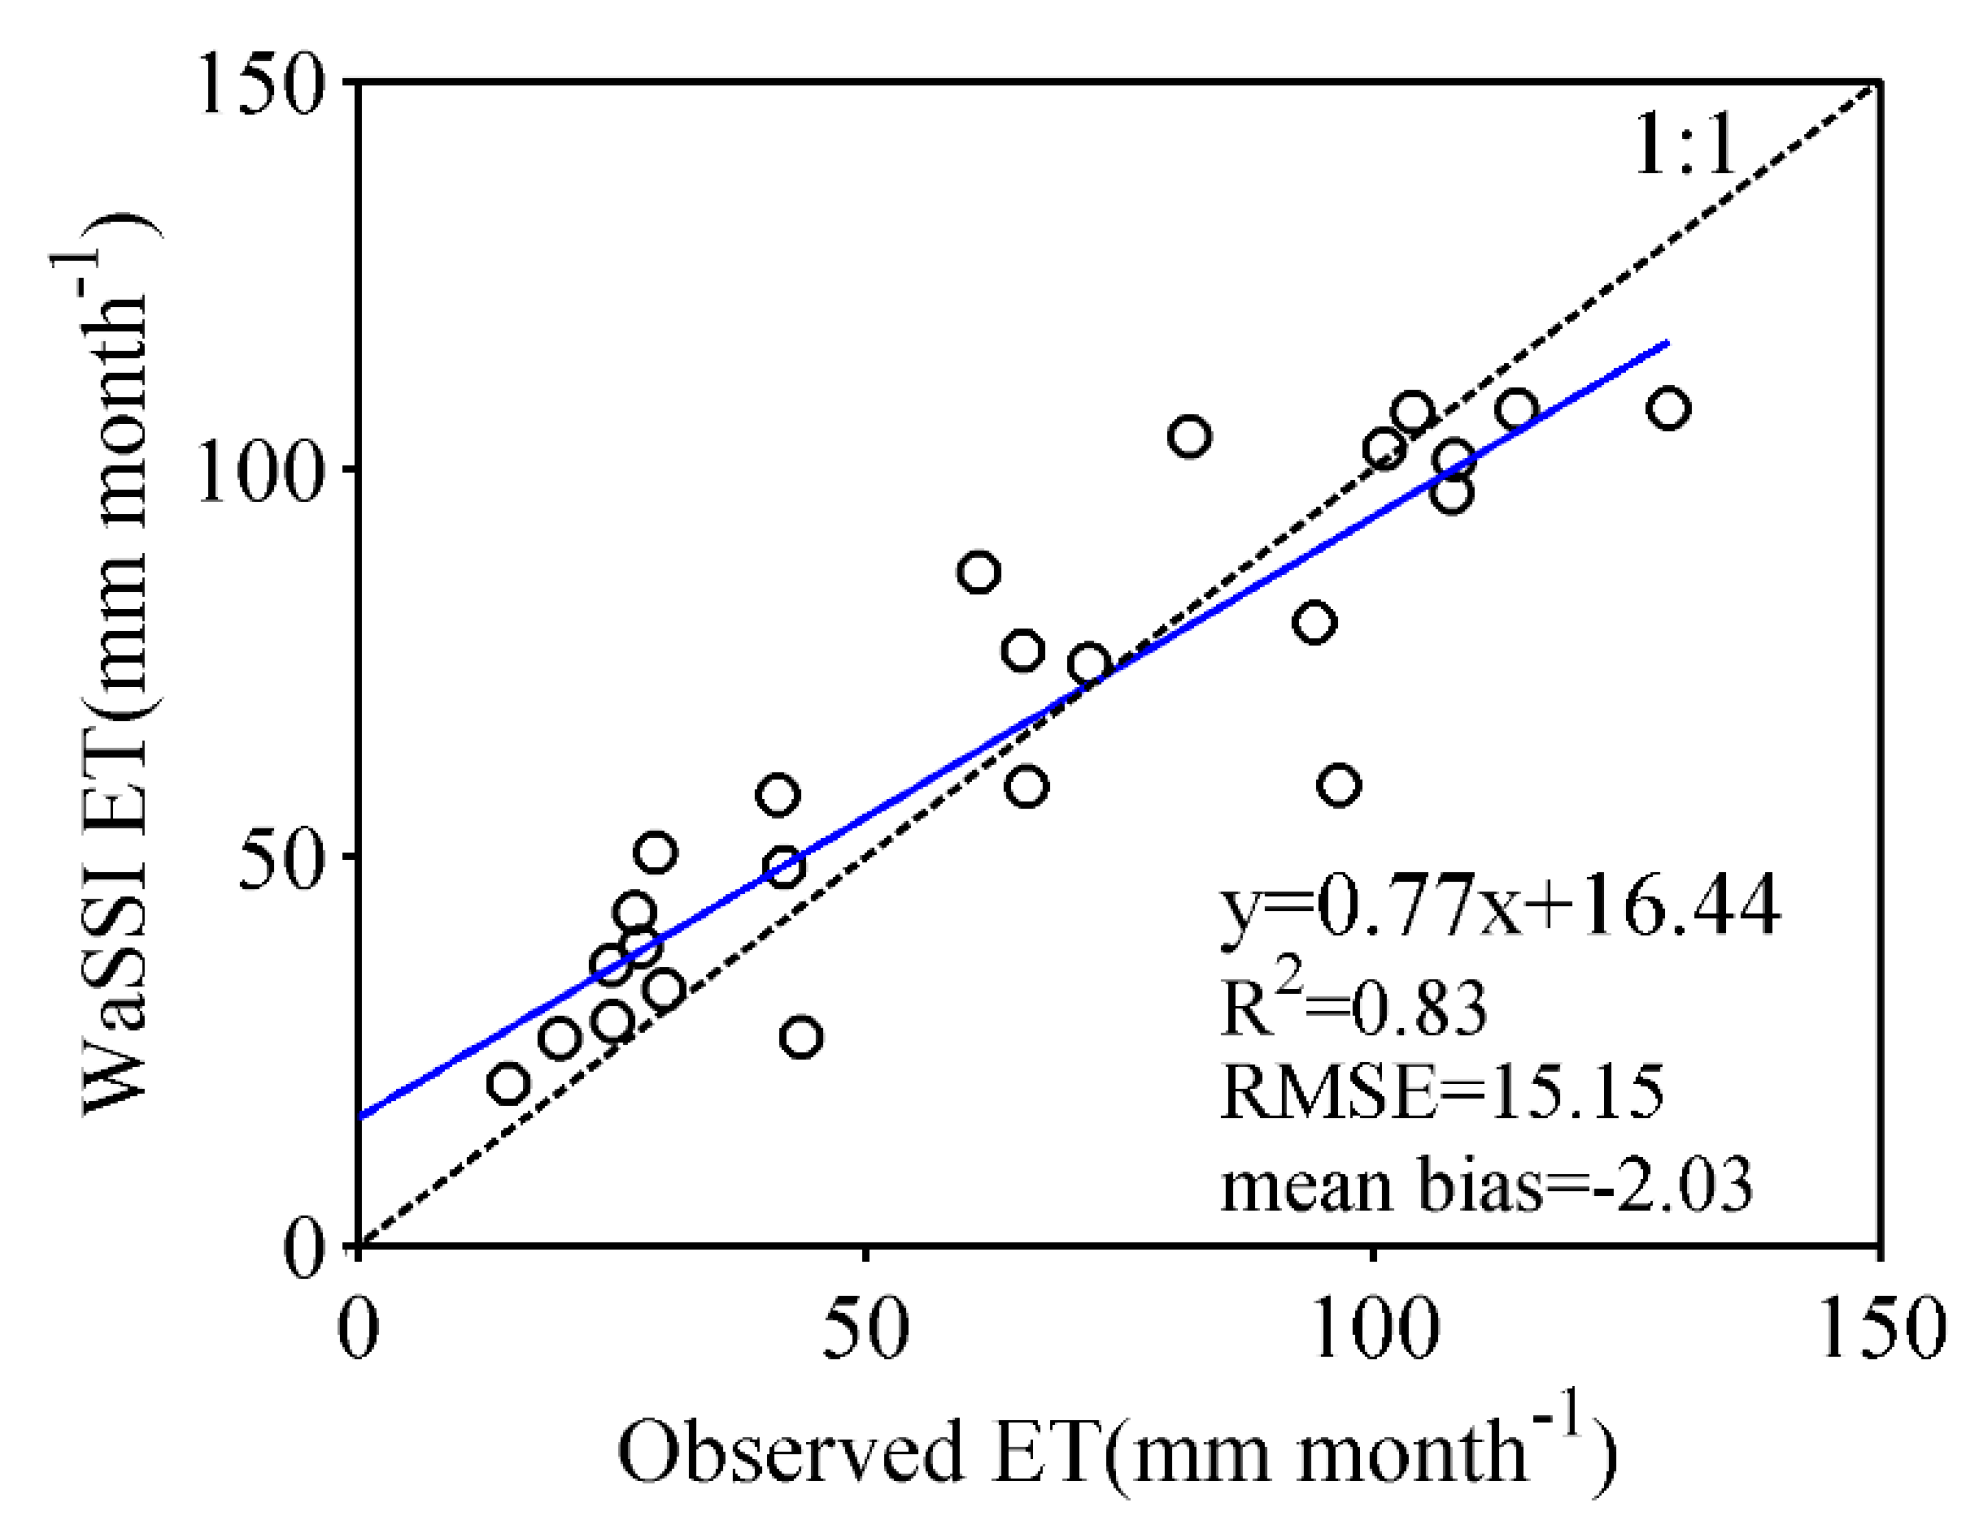
3.3. Validating the Modified WaSSI Model
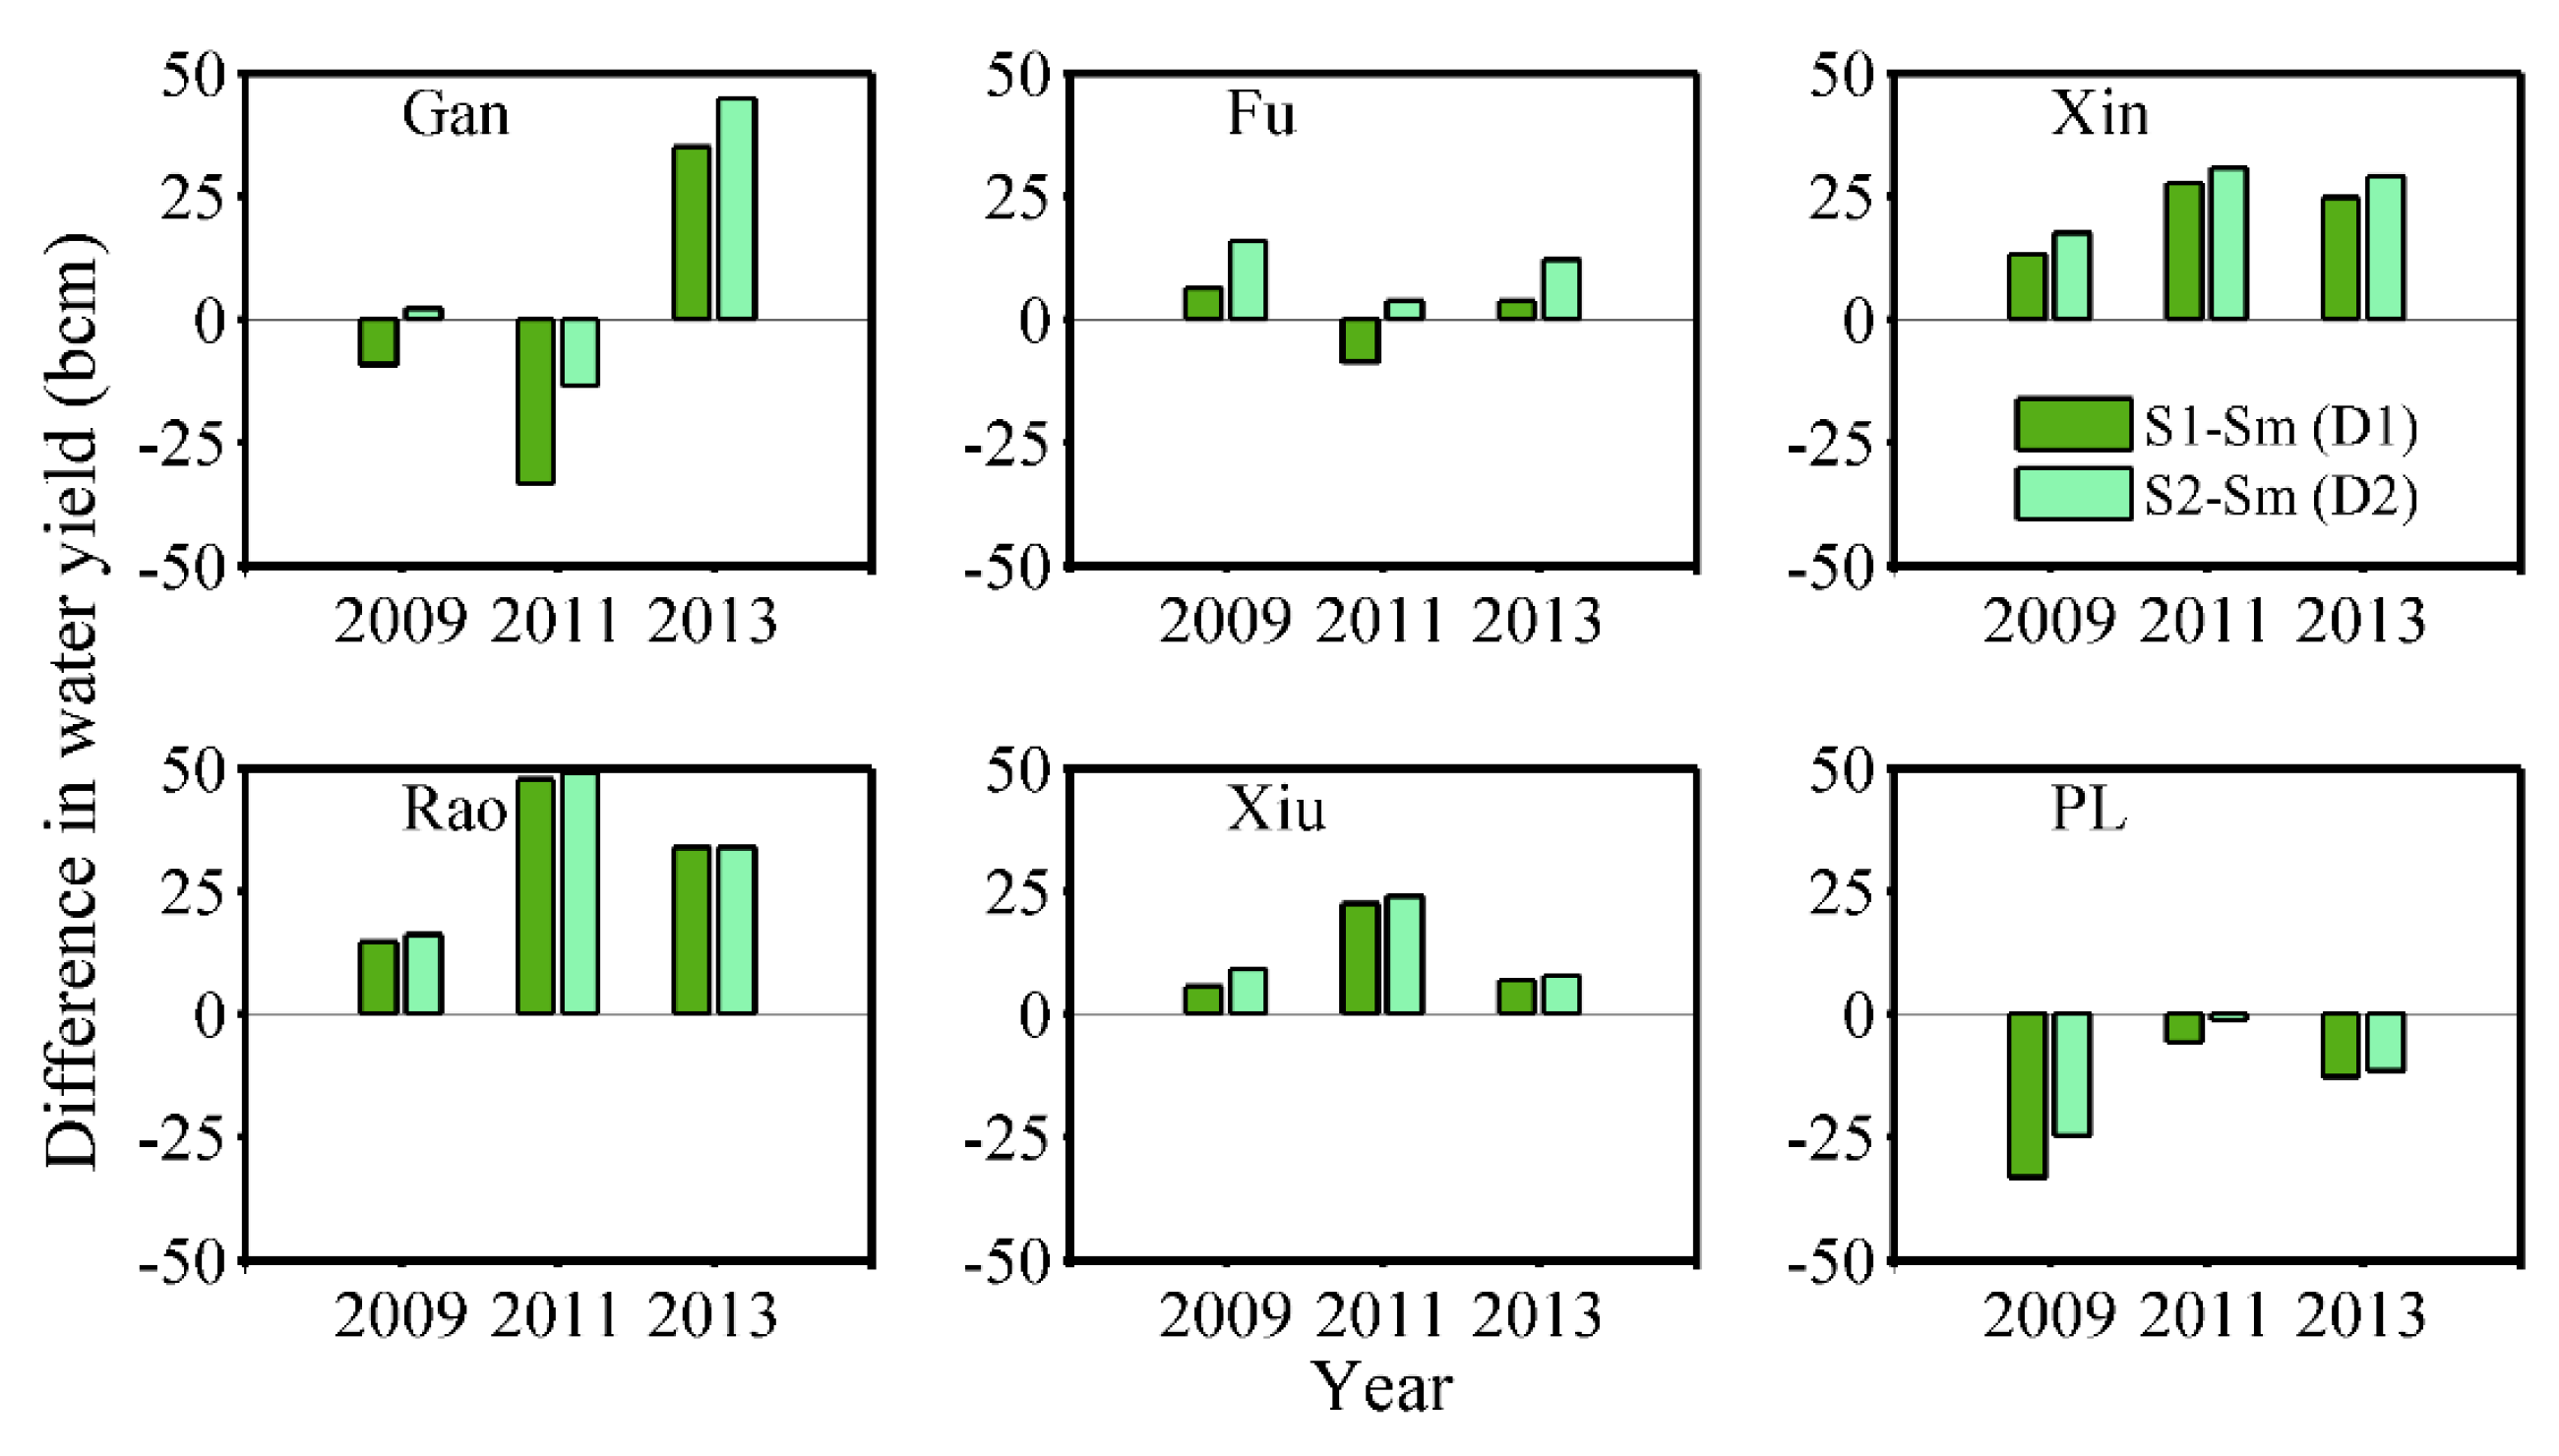
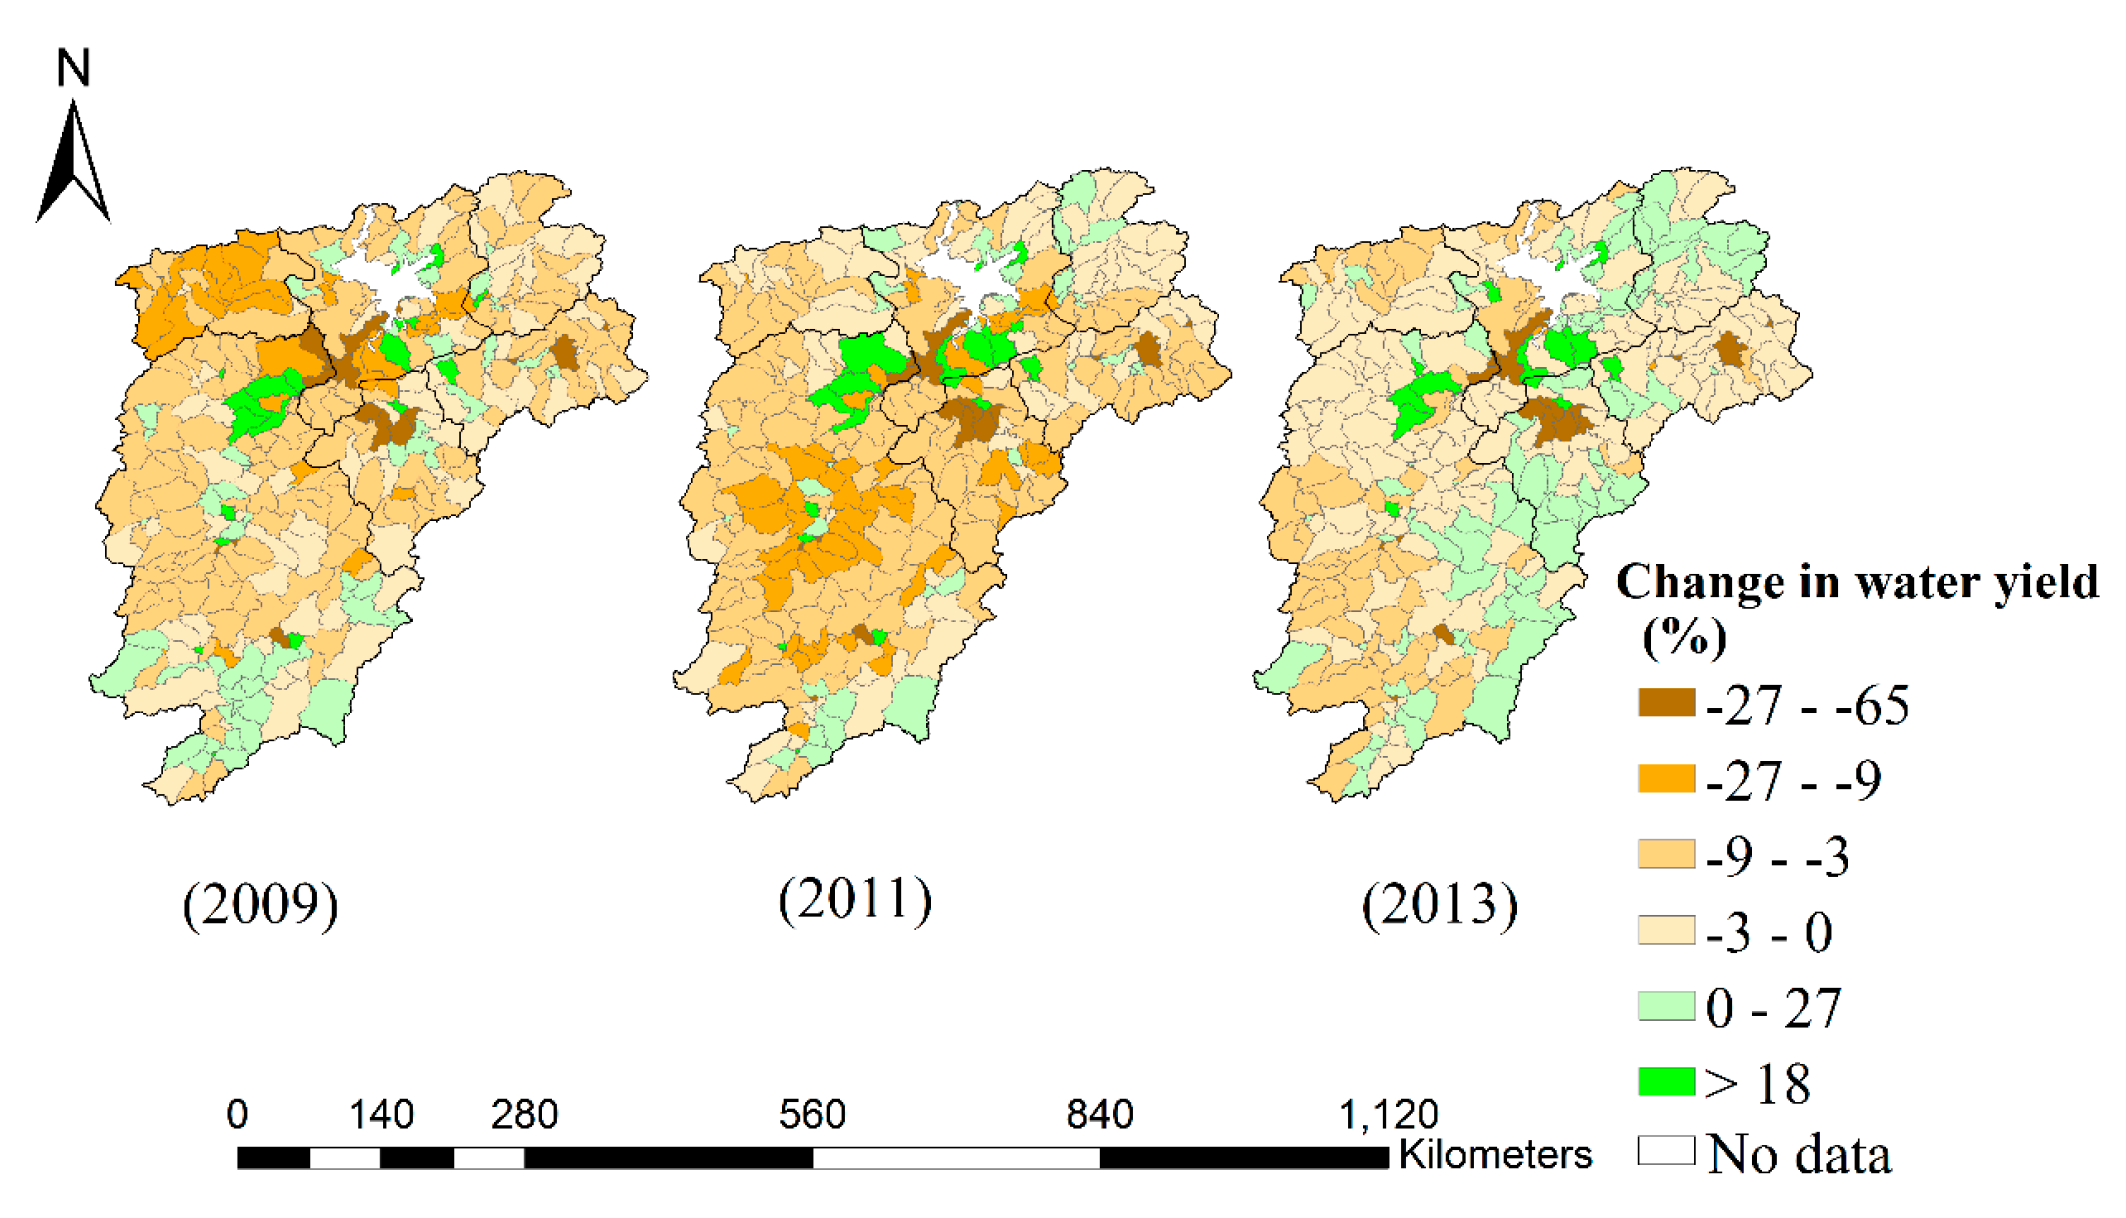
3.4. Effects of Vegetation Greenness Changes on Water Yield under Different Intensities of Drought at a Spatial Scale
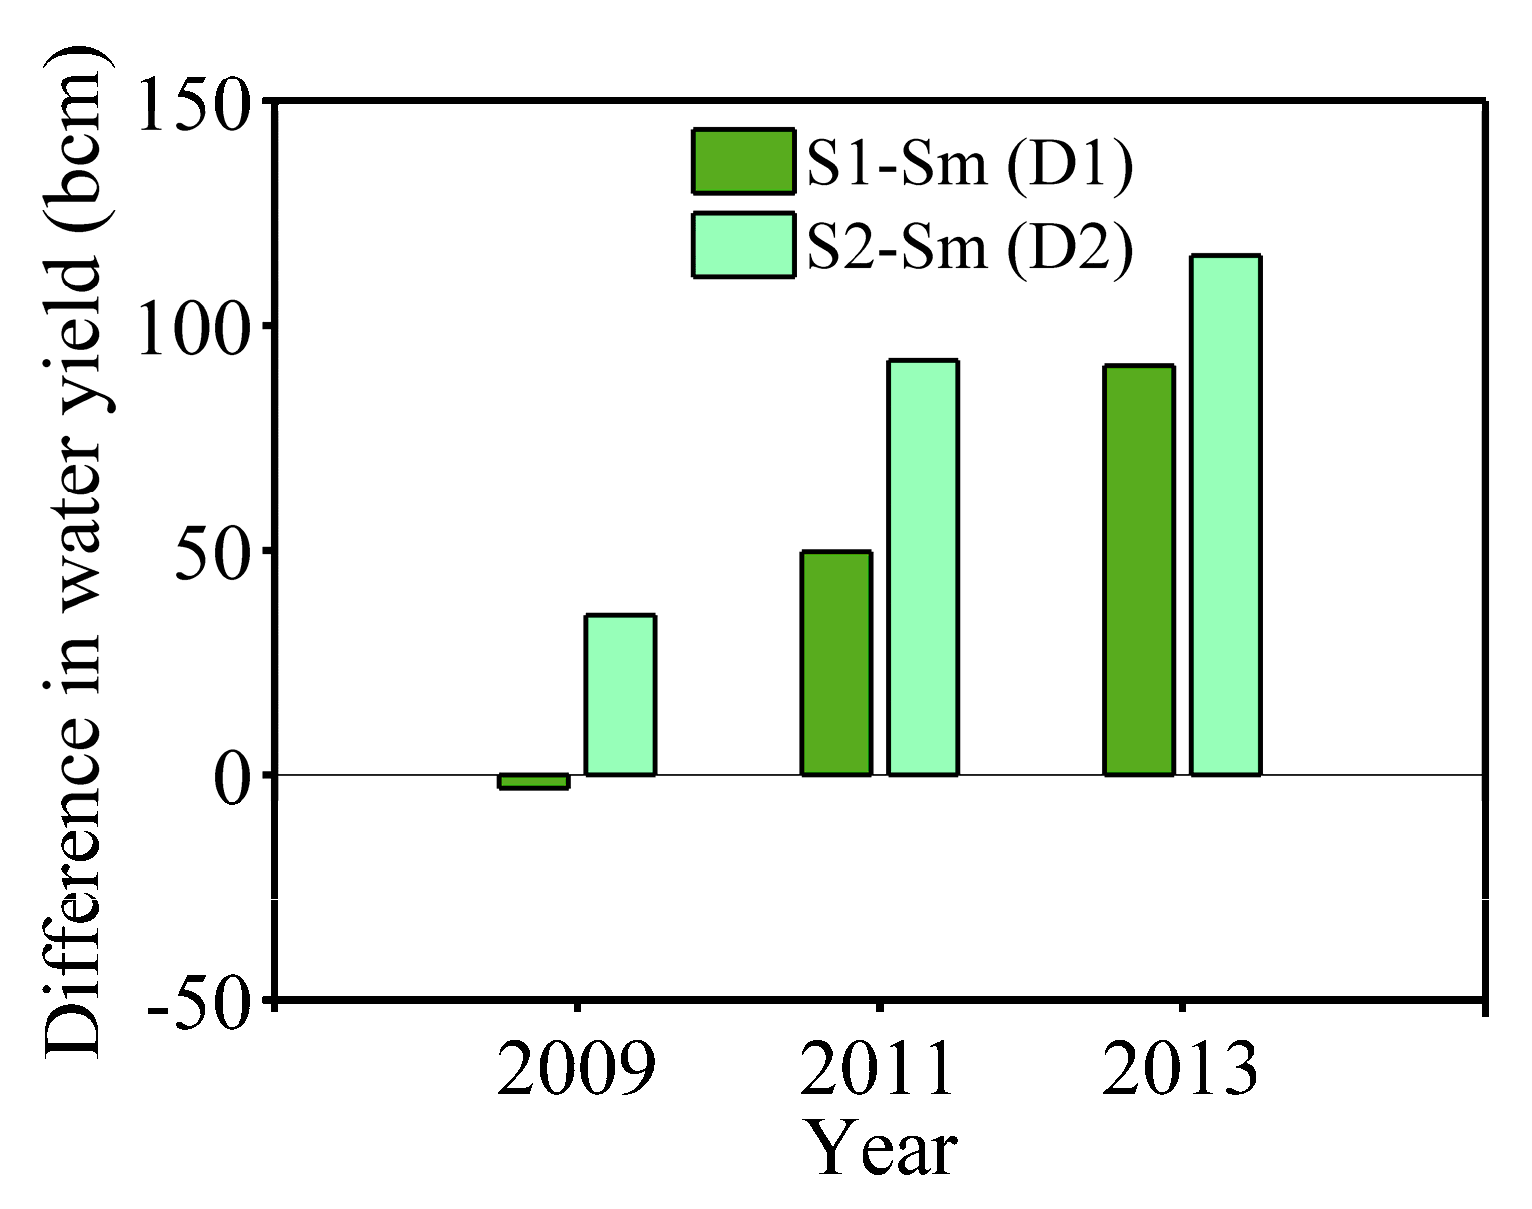
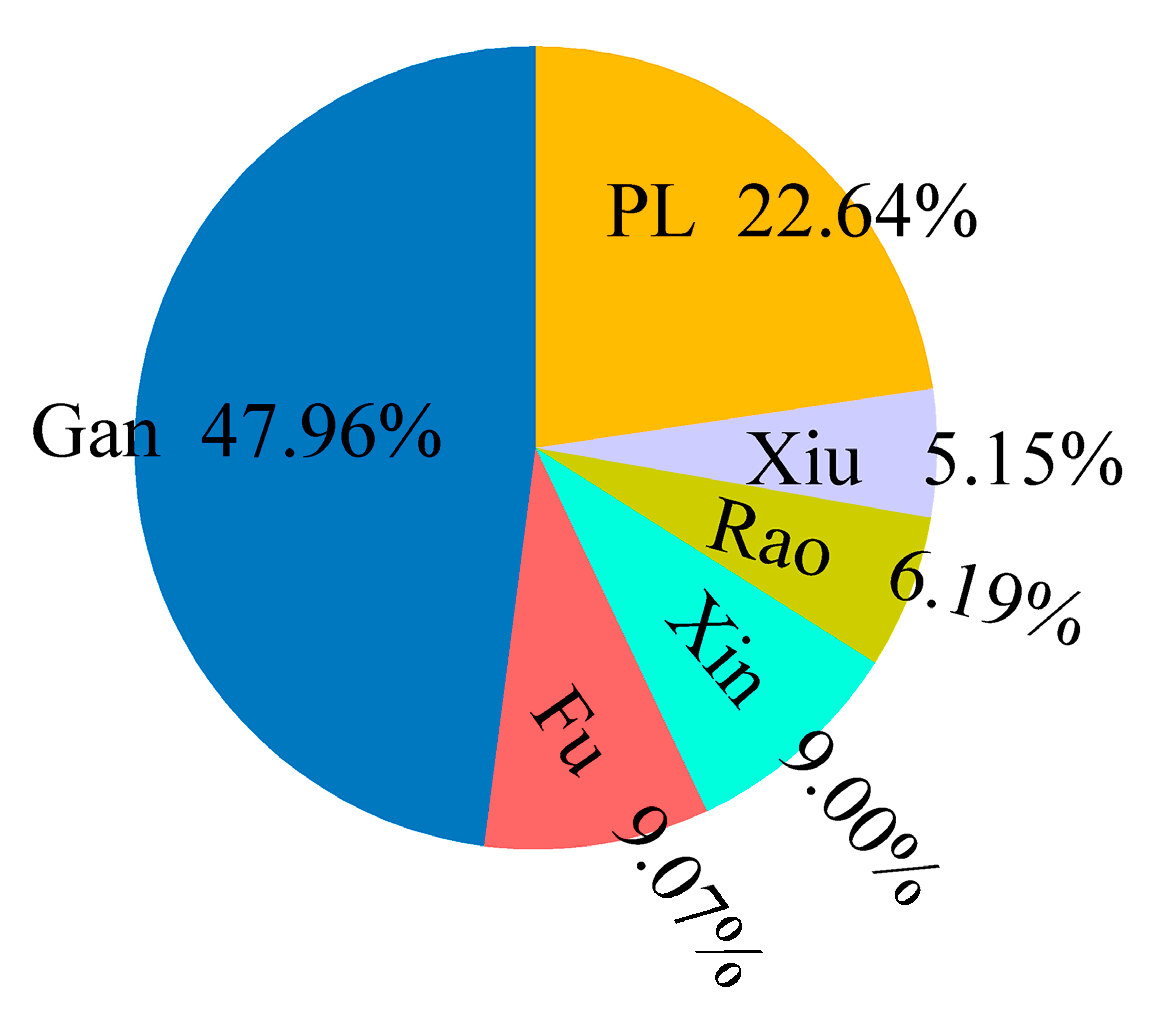
3.5. Effects of Greenness Change on Water Yield under Different Intensities of Drought at Watershed and Large Sub-Watershed Scales
3.6. Potential Water Demand Conflicts between Ecosystems and Humans
4. Discussion
5. Conclusions
Supplementary Materials
Acknowledgments
Author Contributions
Conflicts of Interest
References
- Liu, Y.; Xiao, J.; Ju, W.; Xu, K.; Zhou, Y.; Zhao, Y. Recent trends in vegetation greenness in China significantly altered annual evapotranspiration and water yield. Environ. Res. Lett. 2016, 11, 094010. [Google Scholar] [CrossRef]
- Piao, S.; Yin, G.; Tan, J.; Cheng, L.; Huang, M.; Li, Y.; Liu, R.; Mao, J.; Myneni, R.B.; Peng, S. Detection and attribution of vegetation greening trend in China over the last 30 years. Glob. Chang. Biol. 2015, 21, 1601–1609. [Google Scholar] [CrossRef] [PubMed]
- Zhu, Z.; Piao, S.; Myneni, R.B.; Huang, M.; Zeng, Z.; Canadell, J.G.; Ciais, P.; Sitch, S.; Friedlingstein, P.; Arneth, A. Greening of the earth and its drivers. Nat. Clim. Chang. 2016, 6, 791–795. [Google Scholar] [CrossRef]
- Feng, X.; Fu, B.; Piao, S.; Wang, S.; Ciais, P.; Zeng, Z.; Lü, Y.; Zeng, Y.; Li, Y.; Jiang, X. Revegetation in China’s loess plateau is approaching sustainable water resource limits. Nat. Clim. Chang. 2016, 6, 1019–1022. [Google Scholar] [CrossRef]
- Wang, L.; Yuan, X.; Xie, Z.; Wu, P.; Li, Y. Increasing flash droughts over China during the recent global warming hiatus. Sci. Rep. 2016, 6, 30571. [Google Scholar] [CrossRef] [PubMed]
- Yu, X.; Lamačová, A.; Duffy, C.; Krám, P.; Hruška, J.; White, T.; Bhatt, G. Modelling long-term water yield effects of forest management in a norway spruce forest. Hydrol. Sci. J. 2015, 60, 174–191. [Google Scholar] [CrossRef]
- Cademus, R.; Escobedo, F.; McLaughlin, D.; Abd-Elrahman, A. Analyzing trade-offs, synergies, and drivers among timber production, carbon sequestration, and water yield in pinus elliotii forests in southeastern USA. Forests 2014, 5, 1409–1431. [Google Scholar] [CrossRef]
- Li, J.; Liu, D.; Wang, T.; Li, Y.; Wang, S.; Yang, Y.; Wang, X.; Guo, H.; Peng, S.; Ding, J. Grassland restoration reduces water yield in the headstream region of Yangtze river. Sci. Rep. 2017, 7, 2162. [Google Scholar] [CrossRef] [PubMed]
- Xu, G.; Xu, X.; Tang, W.; Liu, W.; Shi, J.; Liu, M.; Wang, K. Fighting against water crisis in China—A glimpse of water regime shift at county level. Environ. Sci. Policy 2016, 61, 33–41. [Google Scholar] [CrossRef]
- Li, S.; Liang, W.; Fu, B.; Lü, Y.; Fu, S.; Wang, S.; Su, H. Vegetation changes in recent large-scale ecological restoration projects and subsequent impact on water resources in China’s loess plateau. Sci. Total Environ. 2016, 569, 1032–1039. [Google Scholar] [CrossRef] [PubMed]
- Jackson, R.B.; Jobbágy, E.G.; Avissar, R.; Roy, S.B.; Barrett, D.J.; Cook, C.W.; Farley, K.A.; Le Maitre, D.C.; McCarl, B.A.; Murray, B.C. Trading water for carbon with biological carbon sequestration. Science 2005, 310, 1944–1947. [Google Scholar] [CrossRef] [PubMed]
- Sun, G.; Zhou, G.; Zhang, Z.; Wei, X.; McNulty, S.G.; Vose, J.M. Potential water yield reduction due to forestation across China. J. Hydrol. 2006, 328, 548–558. [Google Scholar] [CrossRef]
- Feng, X.M.; Sun, G.; Fu, B.J.; Su, C.H.; Liu, Y.; Lamparski, H. Regional effects of vegetation restoration on water yield across the loess plateau, China. Hydrol. Earth Syst. Sci. 2012, 16, 2617–2628. [Google Scholar] [CrossRef] [Green Version]
- Rammig, A.; Mahecha, M.D. Ecology: Ecosystem responses to climate extremes. Nature 2015, 527, 315–316. [Google Scholar] [PubMed]
- Trenberth, K.E.; Dai, A.; Van Der Schrier, G.; Jones, P.D.; Barichivich, J.; Briffa, K.R.; Sheffield, J. Global warming and changes in drought. Nat. Clim. Chang. 2014, 4, 17–22. [Google Scholar] [CrossRef]
- Xu, K.; Yang, D.; Yang, H.; Li, Z.; Qin, Y.; Shen, Y. Spatio-temporal variation of drought in China during 1961–2012: A climatic perspective. J. Hydrol. 2015, 526, 253–264. [Google Scholar] [CrossRef]
- Zhang, Z.; Chen, X.; Xu, C.-Y.; Hong, Y.; Hardy, J.; Sun, Z. Examining the influence of river–lake interaction on the drought and water resources in the Poyang Lake basin. J. Hydrol. 2015, 522, 510–521. [Google Scholar] [CrossRef]
- Chen, H.; Wang, J.; Huang, J. Policy support, social capital, and farmers’ adaptation to drought in China. Glob. Environ. Chang. 2014, 24, 193–202. [Google Scholar] [CrossRef]
- Mei, X.; Dai, Z.; Du, J.; Chen, J. Linkage between Three Gorges dam impacts and the dramatic recessions in China’s largest freshwater lake, Poyang Lake. Sci. Rep. 2015, 5, 18197. [Google Scholar] [CrossRef] [PubMed]
- Zhang, Y.; You, Q.; Lin, H.; Chen, C. Analysis of dry/wet conditions in the Gan River basin, China, and their association with large-scale atmospheric circulation. Glob. Planet. Chang. 2015, 133, 309–317. [Google Scholar] [CrossRef]
- Chen, X.; Bao, S.; Li, H.; Cai, X.; Guo, P.; Wu, Z.; Fu, W.; Zhao, H. LUCC impact on sediment loads in subtropical rainy areas. Photogramm. Eng. Remote Sens. 2007, 73, 319–327. [Google Scholar] [CrossRef]
- Huang, L.; Shao, Q.; Liu, J. Forest restoration to achieve both ecological and economic progress, Poyang Lake basin, China. Ecol. Eng. 2012, 44, 53–60. [Google Scholar] [CrossRef]
- Liu, J.; Li, S.; Ouyang, Z.; Tam, C.; Chen, X. Ecological and socioeconomic effects of China’s policies for ecosystem services. Proc. Natl. Acad. Sci. USA 2008, 105, 9477–9482. [Google Scholar] [CrossRef] [PubMed]
- Zheng, H.; Wang, Y.; Chen, Y.; Zhao, T. Effects of large-scale afforestation project on the ecosystem water balance in humid areas: An example for southern China. Ecol. Eng. 2016, 89, 103–108. [Google Scholar] [CrossRef]
- Vicente-Serrano, S.M.; Beguería, S.; López-Moreno, J.I. A multiscalar drought index sensitive to global warming: The standardized precipitation evapotranspiration index. J. Clim. 2010, 23, 1696–1718. [Google Scholar] [CrossRef]
- Liu, Y.; Zhou, Y.; Ju, W.; Wang, S.; Wu, X.; He, M.; Zhu, G. Impacts of droughts on carbon sequestration by China’s terrestrial ecosystems from 2000 to 2011. BGeo 2014, 11, 2583–2599. [Google Scholar] [CrossRef]
- Sun, G.; Caldwell, P.; Noormets, A.; McNulty, S.G.; Cohen, E.; Moore Myers, J.; Domec, J.C.; Treasure, E.; Mu, Q.; Xiao, J. Upscaling key ecosystem functions across the conterminous united states by a water-centric ecosystem model. J. Geophys. Res. Biogeosci. 2011, 116. [Google Scholar] [CrossRef]
- Zhang, B.; He, C.; Burnham, M.; Zhang, L. Evaluating the coupling effects of climate aridity and vegetation restoration on soil erosion over the loess plateau in China. Sci. Total Environ. 2016, 539, 436–449. [Google Scholar] [CrossRef] [PubMed]
- Gao, Z.; He, J.; Dong, K.; Li, X. Trends in reference evapotranspiration and their causative factors in the west liao river basin, China. Agric. For. Meteorol. 2017, 232, 106–117. [Google Scholar] [CrossRef]
- Sun, G.; Zuo, C.; Liu, S.; Liu, M.; McNulty, S.G.; Vose, J.M. Watershed evapotranspiration increased due to changes in vegetation composition and structure under a subtropical climate1. J. Am. Water Resour. Assoc. 2008, 44, 1164–1175. [Google Scholar] [CrossRef]
- Sun, S.; Sun, G.; Caldwell, P.; McNulty, S.G.; Cohen, E.; Xiao, J.; Zhang, Y. Drought impacts on ecosystem functions of the us national forests and grasslands: Part i evaluation of a water and carbon balance model. For. Ecol. Manag. 2015, 353, 260–268. [Google Scholar] [CrossRef]
- Sun, G.; Alstad, K.; Chen, J.; Chen, S.; Ford, C.R.; Lin, G.; Liu, C.; Lu, N.; McNulty, S.G.; Miao, H. A general predictive model for estimating monthly ecosystem evapotranspiration. Ecohydrology 2011, 4, 245–255. [Google Scholar] [CrossRef]
- McCabe, G.J.; Hay, L.E.; Bock, A.; Markstrom, S.L.; Atkinson, R.D. Inter-annual and spatial variability of hamon potential evapotranspiration model coefficients. J. Hydrol. 2015, 521, 389–394. [Google Scholar] [CrossRef]
- Mu, Q.; Zhao, M.; Running, S.W. Brief Introduction to MODIS Evapotranspiration Data Set (MOD16). Available online: http://files.ntsg.umt.edu/data/NTSG_Products/MOD16/MOD16_global_evapotranspiration_description.pdf (accessed on 2 September 2017).
- Fang, Y.; Sun, G.; Caldwell, P.; McNulty, S.G.; Noormets, A.; Domec, J.C.; King, J.; Zhang, Z.; Zhang, X.; Lin, G. Monthly land cover-specific evapotranspiration models derived from global eddy flux measurements and remote sensing data. Ecohydrology 2015, 9, 248–266. [Google Scholar] [CrossRef]
- Jarvis, A.; Reuter, H.I.; Nelson, A.; Guevara, E. Hole-Filled SRTM for the Globe Version 4. 2008. Available online: http://srtm.csi.cgiar.org (accessed on 2 September 2017).
- Grusson, Y.; Sun, X.; Gascoin, S.; Sauvage, S.; Raghavan, S.; Anctil, F.; Sáchez-Pérez, J.-M. Assessing the capability of the swat model to simulate snow, snow melt and streamflow dynamics over an alpine watershed. J. Hydrol. 2015, 531, 574–588. [Google Scholar] [CrossRef]
- Liu, C.; Qi, S.; Tang, L. Spatiotemporal pattern of evapotranspiration in Poyang Lake basin under the joint influences of vegetation restoration and climate change. Geographys. Res. 2016, 35, 2373–2383. [Google Scholar]
- Zhu, Z.; Bi, J.; Pan, Y.; Ganguly, S.; Anav, A.; Xu, L.; Samanta, A.; Piao, S.; Nemani, R.R.; Myneni, R.B. Global data sets of vegetation leaf area index (LAI)3g and fraction of photosynthetically active radiation (FPAR)3g derived from global inventory modeling and mapping studies (GIMMS) normalized difference vegetation index (NDVI3g) for the period 1981 to 2011. Remote Sens. 2013, 5, 927–948. [Google Scholar]
- Hansen, M.; DeFries, R.; Townshend, J.; Carroll, M.; Dimiceli, C.; Sohlberg, R. Global percent tree cover at a spatial resolution of 500 meters: First results of the MODIS vegetation continuous fields algorithm. Earth Interact. 2003, 7, 1–15. [Google Scholar] [CrossRef]
- Loveland, T.; Brown, J.; Ohlen, D.; Reed, B.; Zhu, Z.; Yang, L.; Howard, S. Islscp ii igbp Discover and Sib Land Cover, 1992–1993; Oak Ridge National Laboratory Distributed Active Archive Center: Oak Ridge, TN, USA, 2009; Volume 10.
- Ran, Y.; Li, X.; Lu, L. Evaluation of four remote sensing based land cover products over China. Int. J. Remote Sens. 2010, 31, 391–401. [Google Scholar] [CrossRef]
- Hua, W.; Chen, H.; Zhou, L.; Xie, Z.; Qin, M.; Li, X.; Ma, H.; Huang, Q.; Sun, S. Observational quantification of climatic and human influences on vegetation greening in China. Remote Sens. 2017, 9, 425. [Google Scholar] [CrossRef]
- Shangguan, W.; Dai, Y.; Duan, Q.; Liu, B.; Yuan, H. A global soil data set for earth system modeling. J. Adv. Model. Earth Syst. 2014, 6, 249–263. [Google Scholar] [CrossRef]
- Mu, Q.; Zhao, M.; Running, S.W. Improvements to a MODIS global terrestrial evapotranspiration algorithm. Remote Sens. Environ. 2011, 115, 1781–1800. [Google Scholar] [CrossRef]
- Yu, G.R.; Zhu, X.J.; Fu, Y.L.; He, H.L.; Wang, Q.F.; Wen, X.F.; Li, X.R.; Zhang, L.M.; Zhang, L.; Su, W.; et al. Spatial patterns and climate drivers of carbon fluxes in terrestrial ecosystems of China. Glob. Chang. Biol. 2013, 19, 798–810. [Google Scholar] [CrossRef] [PubMed]
- Peng, S.; Chen, A.; Xu, L.; Cao, C.; Fang, J.; Myneni, R.B.; Pinzon, J.E.; Tucker, C.J.; Piao, S. Recent change of vegetation growth trend in China. Environ. Res. Lett. 2011, 6, 044027. [Google Scholar] [CrossRef]
- Zhan, L.; Chen, J.; Zhang, S.; Li, L.; Huang, D.; Wang, T. Isotopic signatures of precipitation, surface water, and groundwater interactions, Poyang Lake basin, China. Environ. Earth Sci. 2016, 75, 1307. [Google Scholar] [CrossRef]
- Yang, Y.; Guan, H.; Batelaan, O.; McVicar, T.R.; Long, D.; Piao, S.; Liang, W.; Liu, B.; Jin, Z.; Simmons, C.T. Contrasting responses of water use efficiency to drought across global terrestrial ecosystems. Sci. Rep. 2016, 6, 23284. [Google Scholar] [CrossRef] [PubMed]
- Doughty, C.E.; Metcalfe, D.; Girardin, C.; Amézquita, F.F.; Cabrera, D.G.; Huasco, W.H.; Silva-Espejo, J.; Araujo-Murakami, A.; da Costa, M.; Rocha, W. Drought impact on forest carbon dynamics and fluxes in amazonia. Nature 2015, 519, 78–82. [Google Scholar] [CrossRef] [PubMed] [Green Version]
- Sun, S.; Sun, G.; Caldwell, P.; McNulty, S.; Cohen, E.; Xiao, J.; Zhang, Y. Drought impacts on ecosystem functions of the us national forests and grasslands: Part ii assessment results and management implications. For. Ecol. Manag. 2015, 353, 269–279. [Google Scholar] [CrossRef]
- Martin-StPaul, N.; Delzon, S.; Cochard, H. Plant resistance to drought depends on timely stomatal closure. Ecol. Lett. 2017, 20, 1437–1447. [Google Scholar] [CrossRef] [PubMed]
- Ye, X.; Zhang, Q.; Liu, J.; Li, X.; Xu, C.-Y. Distinguishing the relative impacts of climate change and human activities on variation of streamflow in the Poyang Lake catchment, China. J. Hydrol. 2013, 494, 83–95. [Google Scholar] [CrossRef]
- Napier, J.D.; Mordecai, E.A.; Heckman, R.W. The role of drought-and disturbance-mediated competition in shaping community responses to varied environments. Oecologia 2016, 181, 621–632. [Google Scholar] [CrossRef] [PubMed]
- Wang, Y.; Long, S.P.; Zhu, X.-G. Elements required for an efficient nadp-malic enzyme type c4 photosynthesis. Plant Physiol. 2014, 164, 2231–2246. [Google Scholar] [CrossRef] [PubMed]
- Wang, J.; Wang, H.; Cao, Y.; Bai, Z.; Qin, Q. Effects of soil and topographic factors on vegetation restoration in opencast coal mine dumps located in a loess area. Sci. Rep. 2016, 6, 22058. [Google Scholar] [CrossRef] [PubMed]
- Notice on publishing ten measures for promoting forestry reforms and pushing ecological civilization construction in Jiangxi Province. Available online: http://www.jiangxi.gov.cn/zzc/ajg/sbgt/201607/t20160718_1277772.htm (accessed on 2 September 2017).
- Zhao, X.; Xu, P.; Zhou, T.; Li, Q.; Wu, D. Distribution and variation of forests in China from 2001 to 2011: A study based on remotely sensed data. Forests 2013, 4, 632–649. [Google Scholar] [CrossRef]
- Chen, Y.; Wang, K.; Lin, Y.; Shi, W.; Song, Y.; He, X. Balancing green and grain trade. Nat. Geosci. 2015, 8, 739–741. [Google Scholar] [CrossRef]


| Scenario | LAI | LUCC | T | P |
|---|---|---|---|---|
| S1 | ● | ● | ● | ● |
| S2 | ○ | ○ | ● | ● |
| Watershed | 2009 | 2011 | 2013 | |||
|---|---|---|---|---|---|---|
| LAI Change (%) | Difference in Water Yield (%) | LAI Change (%) | Difference in Water Yield (%) | LAI Change (%) | Difference in Water Yield (%) | |
| Gan | 19.3 | −2.0 | 32.0 | −4.9 | 24.9 | −1.3 |
| Fu | 22.7 | −7.9 | 34.2 | −10.9 | 20.0 | −5.0 |
| Xin | 21.0 | −4.3 | 27.9 | −3.6 | 20.4 | −2.8 |
| Rao | 16.5 | −0.7 | 9.5 | −1.5 | 3.0 | −0.2 |
| Xiu | 29.2 | −10.1 | 19.2 | −2.9 | 24.1 | −2.1 |
| Poyang Lake area | 25.9 | −8.5 | 29.8 | −4.4 | 31.1 | −2.0 |
| Entire watershed | 21.3 | −5.6 | 28.5 | −4.7 | 22.9 | −2.2 |
© 2018 by the authors. Licensee MDPI, Basel, Switzerland. This article is an open access article distributed under the terms and conditions of the Creative Commons Attribution (CC BY) license (http://creativecommons.org/licenses/by/4.0/).
Share and Cite
Tang, L.-L.; Cai, X.-B.; Gong, W.-S.; Lu, J.-Z.; Chen, X.-L.; Lei, Q.; Yu, G.-L. Increased Vegetation Greenness Aggravates Water Conflicts during Lasting and Intensifying Drought in the Poyang Lake Watershed, China. Forests 2018, 9, 24. https://doi.org/10.3390/f9010024
Tang L-L, Cai X-B, Gong W-S, Lu J-Z, Chen X-L, Lei Q, Yu G-L. Increased Vegetation Greenness Aggravates Water Conflicts during Lasting and Intensifying Drought in the Poyang Lake Watershed, China. Forests. 2018; 9(1):24. https://doi.org/10.3390/f9010024
Chicago/Turabian StyleTang, Lin-Ling, Xiao-Bin Cai, Wei-Shu Gong, Jian-Zhong Lu, Xiao-Ling Chen, Qian Lei, and Gong-Liang Yu. 2018. "Increased Vegetation Greenness Aggravates Water Conflicts during Lasting and Intensifying Drought in the Poyang Lake Watershed, China" Forests 9, no. 1: 24. https://doi.org/10.3390/f9010024
APA StyleTang, L.-L., Cai, X.-B., Gong, W.-S., Lu, J.-Z., Chen, X.-L., Lei, Q., & Yu, G.-L. (2018). Increased Vegetation Greenness Aggravates Water Conflicts during Lasting and Intensifying Drought in the Poyang Lake Watershed, China. Forests, 9(1), 24. https://doi.org/10.3390/f9010024