Article

Land Use Affects the Soil C Sequestration in Alpine Environment, NE Italy

1
Dipartimento di Agronomia, Animali, Alimenti, Risorse Naturali e Ambiente (DAFNAE), Università degli Studi di Padova, 35020 Legnaro (Padova), Italy
2
Dipartimento di Scienze Agrarie, Università degli Studi di Bologna, 40127 Bologna, Italy
3
Dipartimento di Gestione dei Sistemi Agrori e Forestali, Università Mediterranea di Reggio Calabria, 89060 Gallina (Reggio Calabria), Italy
*
Author to whom correspondence should be addressed.
Forests 2017, 8(6), 197; https://doi.org/10.3390/f8060197
Submission received: 14 March 2017 / Revised: 16 May 2017 / Accepted: 20 May 2017 / Published: 6 June 2017
(This article belongs to the Special Issue Soil Carbon Sequestration in Forests)

Abstract

:
Soil carbon sequestration is strongly affected by soil properties, climate, and anthropogenic activities. Assessing these drivers is key to understanding the effect of land use on soil organic matter stabilization. We evaluated land use and soil depth influencing patterns of soil organic matter stabilization in three types of soil profiles located under the same pedogenetic matrix and alpine conditions but with different vegetation cover. The stock in soil organic carbon in the mean 0–20 cm layer increased from prairie (31.9 t ha−1) to prairie in natural reforestation (42 t ha−1) to forest (120 t ha−1), corresponding to increments of 1.3-fold prairie, for prairie in natural reforestation, and of 3.8-fold prairie for forest. The forest showed the highest humic carbon (21.7 g kg−1), which was 2.8 times greater than the prairie in natural reforestation and 4 times higher than the prairie. 13C-NMR spectroscopic measurements suggested a different C pattern. The prairie in natural reforestation and the prairie were characterized by a higher content in O,N-alkyl C with respect to the forest. Alkyl C and aromatic C in the prairie in natural reforestation and prairie did not show relevant differences while they decreased with respect to the forest. Carboxyl and phenolic C groups were markedly higher in forest and prairie than prairie in natural reforestation. Alkyl C, carboxyl C, and phenolic C prevailed in the Ah horizons whereas aromatic C and O,N-alkyl C were dominant in the B horizons. Overall, the marked distribution of O,N-alkyl C and alkyl C in humic substances (HS) indicates a low degree of humification. Nevertheless, in forest, the relatively high presence of aromatic C designated HS endowed with a relatively high humification degree. Thus, our results might suggest that in the alpine environment of NE Italy differences in soil organic matter (SOM) stocks and characteristics are affected by land use and anthropic activities.

1. Introduction

Forests play an important role in the global carbon (C) cycle by capturing CO2 from the atmosphere, converting it into biomass, and emitting it back into the atmosphere or fixing it into stable soil organic matter pools [1]. The amount of soil C is the result of the balance between the rate of organic C input in leaf and root biomass and its mineralization. In boreal forests, and in particular in alpine environment, SOM is quantitatively important because it favours the thick superficial organic horizons called humus [2] with different ecological value. The extent in C pool in forests depends on soil properties, climate, and anthropogenic activities [3], while the stabilization of soil organic matter (SOM) is mediated by soil structure and their interactions [4], which protect organic matter from decomposition [5]. The influence of tree species on C pool has been widely studied [6,7,8,9,10,11], however, a comprehensive understanding of the magnitude of tree influence across site types has not yet been well elucidated.
C storage in soil ecosystems can also be affected by stand management practices and land use [12,13]. Brown and Lugo [14] showed that, following deforestation, sites lost up to 60%–70% of the initial C contained in mature forests. Carbon loss is due to the rapid decomposition of organic matter, with consequent C released as CO2 to the atmosphere, or by erosion processes in which C may be deposited somewhere else in the landscape, with only some lost as CO2. Land management plays an important role as source and/or sink of C [15]. Therefore, soil organic C (SOC) stock can be modified by land use because of different inputs of organic matter, different canopy structures, as well as different physical and chemical properties of soil. There is a considerable amount of evidence showing that forests converted to cultivated cropland decreased their organic layer, soil C content, and cation exchange capacities [16]. In a study by Li et al., [17] over 30 years, the SOC storage did not decrease significantly after a land use change from primary rain forest to fallow land, however, it did increase significantly (49.3%) due to conversions to natural secondary forest and rubber plantations.
SOM characteristics is also influenced by seasonal changes, management practices and/or land uses and litter composition [18,19,20]. Djukic et al. [21] reported that the content of O-alkyl C increased with cooler and moisture climates, while aromatic C increased under warmer conditions. As the chemical composition of SOM can have significant impacts on its turnover affecting in turn the magnitude and the temporal pattern, the ecosystem responses to environmental changes [19,20,21,22] has not been well clarified yet. Moreover, there are a number of questions about the SOM formed in alpine soils. Because the SOM decomposition is considered as one of the largest C fluxes in the global terrestrial, an evaluation of different land use/vegetation cover may be a valid approach to better understand the key mechanisms to preserve it.
In this study three representative soil profiles from the mountain environment of NE Alpes (Italy), developed under the same pedogenetic, and climate conditions and different vegetation cover were described and analysed. The SOC balance was estimated and its more recalcitrant fraction was analysed by using 13C NMR spectroscopy. Our assumption was that the soil characteristics of our sites were comparable in the past, and that the current differences are due to different land use/vegetation cover.

2. Material and Methods
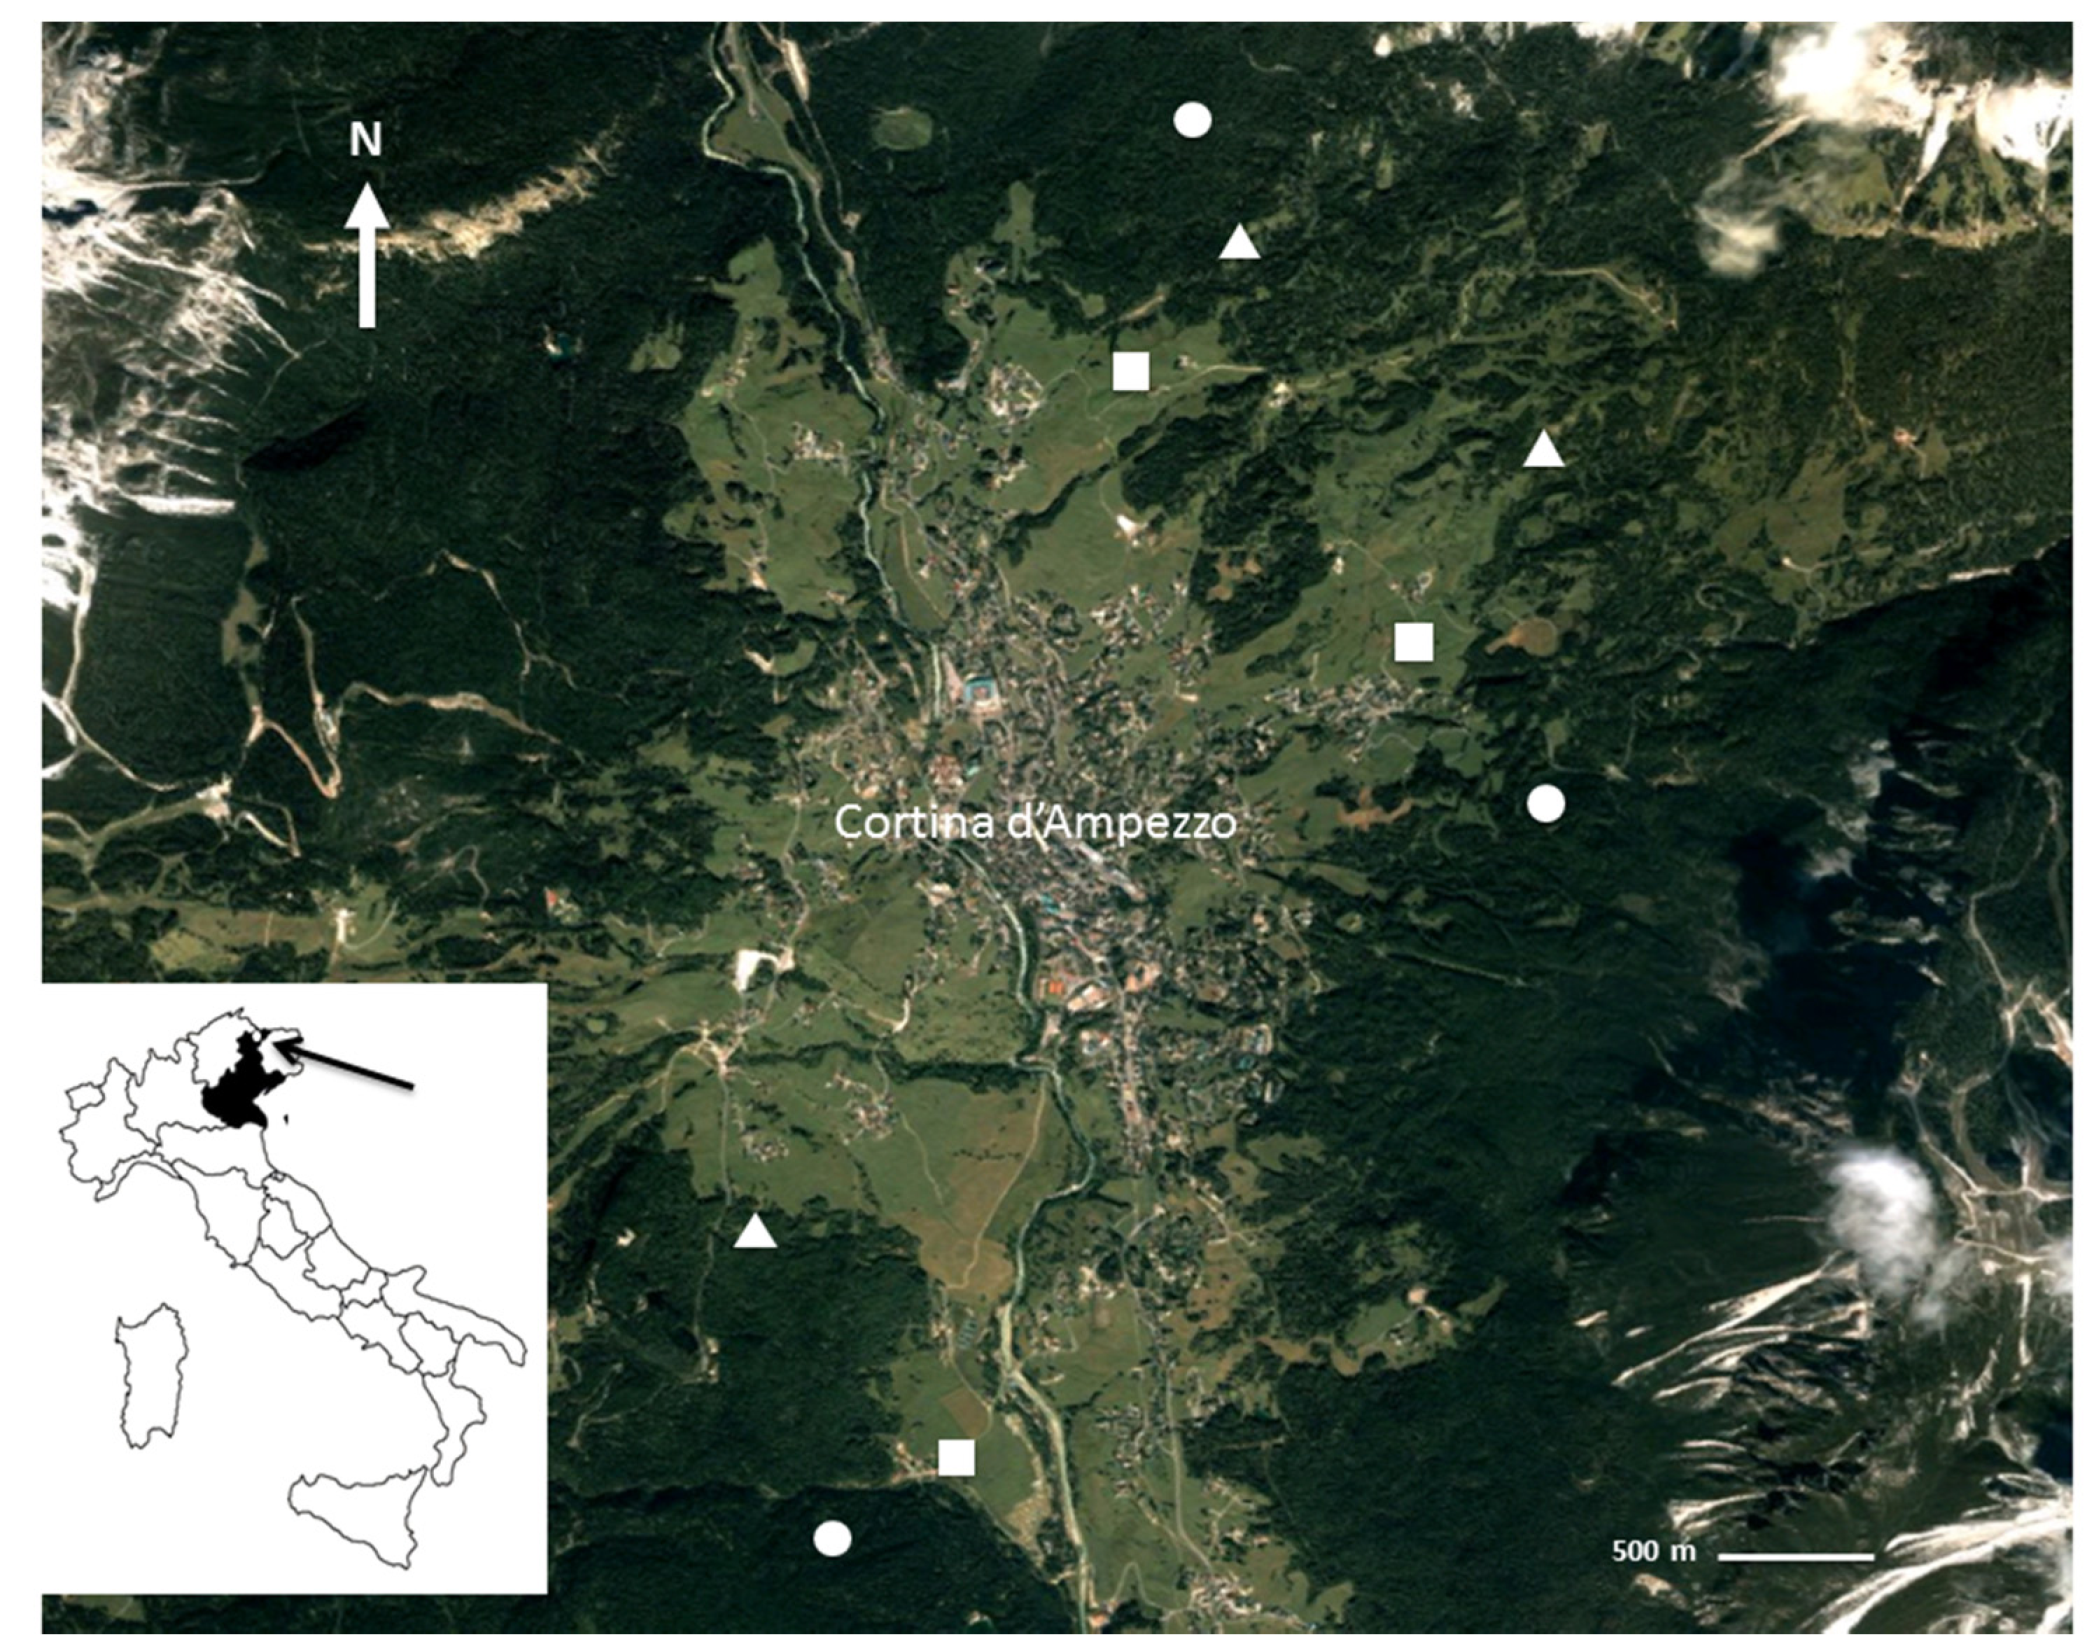
2.1. Study Site

The study was conducted on the Ampezzane Dolomites, which are located near Cortina d’Ampezzo in the province of Belluno (BL), on Northestern Alpes, Italy (Figure 1). The Ampezzane Dolomites include the massifs of Sorapiss, Croda da Lago, Nuvolau, and Cristallo, and show geomorphological features of past glacial conditions. The principal valley, the Cortina d'Ampezzo Valley, spans from 1224 m to 3244 m of altitude, and represents the site of this study (latitude 46°30′ N, longitude 12°08′′ E). The climate is continental with a mean annual temperature of 4–5 °C, and the mean annual precipitation is of about 1000 mm, with a maximum in July, and prolonged periods without rain and snow in summer and in winter. The morphology is gently undulating, due to the widespread geological formation, which is made up of limestone yellowish layers, fine sandstones, and marne. Because of the easy erodibility, mass movements and flows are frequent. These materials originate Haplic Luvisols [22] which are generally rich in clay and relatively deep. The arboreal vegetation is comprised of forests characterized by the presence of Picea excelsa Lam. Link, Abies alba Mill, Fagus sylvatica L., and Pinus cembra L. Spruce is the most common tree species because of man who has favoured it eliminating beech and Silver fir. The remarkable pioneer attitude of spruce led to the formation of secondary spruce forests or new generation of spruce forests over large areas of abandoned pastures. These forests are replaced by grasslands, where the slopes are milder, and Pinus mugo T., where the slope is greater.

2.2. Soil Sampling

In June, three 20 m × 20 m plots were set up based on three major land use types in this region: (i) prairie (P), (ii) reforestation by larch (R), and (iii) multi-layered forest (F) composed by spruce (Picea abies (L.) H. Karst), larch (Larix decidua Mill., and Scots pine (Pinus sylvetris L.); and three replicates per land use type were made (Figure 1). The plots were considered true replicates given that the distance between each other exceeded the spatial dependence of most soil chemical variables [23]. From the documentation present at the municipal offices of the town, we can state that the prairies have existed for several centuries, whereas the wooded area is at least of 200 years old.
Three sampling points in each plot were selected. We excavated the soil down to a depth where we found consolidated rock material. In order to estimate the stock of SOC with soil depth, intact soil cores were sampled at 20-cm intervals with 100-cm3 stainless steel cylinders to quantify bulk density. Disturbed soil samples were also used for physical and chemical analysis. Data sheets for the soil profiles were compiled following the guidelines for the description of soils published by [24]. Forest and reforestation area soils were classified [22] as Haplic Luvisol, and prairie soils were classified as Aric Anthrosol.

2.3. Laboratory Analysis

The samples were air-dried. The proportion of soil skeleton was determined by weight after sieving the bulk samples at 2 mm. Soil pH was measured potentiometrically using 1:2.5 soil/water extracts. Total carbonate content (C) was determined by the calcimeter method and gravimetric loss of CO2. Particle size analysis was performed according to the hydrometer method, using sodium hexametaphosphate as a dispersant [25]. Organic C was assayed by measuring dichromate oxidation [26] and total nitrogen (TN) according to the Kjeldahl method [27]. The bulk density was calculated by drying the soils at 105 °C and subsequently weighing the soil samples. Finally, the SOC stock (SOCs) for each sampling site was calculated using the following formula:
S O C s = i m S O C i   × B D i   × D i   × ( 1 S k i ) × 10
where SOCs was the stock of SOC, SOCi is the SOC concentration of the ith layer (g kg−1), BDi is the bulk density of the ith layer (g cm−3), Di is the thickness (m), and Ski is the skeletal (%) of this layer.
Humic substances were extracted with 0.1 N NaOH (1:10 w/v) by shaking the suspension for 16 h at room temperature in a N2 atmosphere. The mixture was centrifuged at 5000 rpm for 30 min, and the supernatants were dialyzed in Visking tubes (18,000 mol wt cut-off) against distilled water to pH 6.0. Subsequently, the solution was filtered through Whatman No. 42 filter paper, and then through a column of Amberlite IR 120 H+ form [28].
13C-NMR spectra were performed by dissolving ca. 300 mg of humic extract with 0.5 mL of 2 M NaOH + 1.5 mL D2O for one day at room temperature under N2. The suspension was then filtered through acid-washed glass wool, which was then washed with 1 mL of D2O, and the filtrates were then combined. The 13C-NMR spectra were recorded at 125.7 MHz on a Bruker AMX-500 spectrometer (Bruker, Karlsruhe, Germany), using inverse-gated decoupling experiments for quantitative intensity distribution. The chemical shift was expressed in ppm on a scale relative to external sodium 3-trimethylsilvylpropiniate at 0 ppm. According to Candler et al. [29], each NMR spectrum was divided into the following five regions: alkyl-C (0–48 ppm), O,N-alkyl C (48–105 ppm), aromatic-C (105–145 ppm), phenolic-C (145–165 ppm), and carboxyl-C (165–200 ppm). The areas of the chemical shift regions were determined from the integral curves and were expressed as a fraction of total area.

2.4. Isotopic Determination

Carbon-13 to carbon-12 ratios (δ13C) were determined by a method similar to a procedure reported by Craig [30]. The system consisted of a Carlo Erba NA 1500 elemental analyzer (Carlo Erba, Milano, Italy) interfaced with a SIRA II-VG mass spectrometer (Micromass, Manchester, UK) for stable isotope ratio determination. The weight of sample for each determination was ca. 1.5 mg. Results are expressed in parts per million ‰ calculated according to equation δ‰ = (Rsample/Rstandard − 1) × 1000, where Rsample and Rstandard are the isotopic ratios of the sample and reference, respectively. The international standard is CO2 obtained from Peedee belemnite limestone from South Carolina with a conventional value δ = 0. The Craig correction was applied to the raw parts per thousand values for the 17O contribution to m/z of 45 [30]. The experiments were carried out in triplicate. The precision of the isotopic analysis was better than ±0.01‰. The overall reproducibility of the experiments, including the combustion, was ±0.2‰.

2.5. Statistical Analyses

All examined variables were tested for normality and homoscedasticity by Shapiro–Wilk’s and Levene’s tests, respectively, and transformed when necessary to satisfy assumptions required by parametric statistics. Data were the means of three independent replicates, and the standard deviations did not exceed 5%. Correlations between variables were determined using Spearman’s coefficient. Two-way analysis of variance (ANOVA) was used to evaluate the soil physical-chemical variables under different land use types and depths. The Student–Newman–Keuls test was applied to compare the differences between group means [31]. Analyses were carried out in SPSS, version 22 (IBM SPSS, Chicago, IL, USA).

3. Results

3.1. Morphology

Morphological descriptions of the three representative profiles belonging to the three types of land uses are reported (Table 1). Observations revealed that the formation of horizons was mostly layer dependent. What appeared related to the nature of the parent layer is the thixotropy, a property that was developed in quasi all horizons showing a sub-angular blocky structure. Nonetheless, in forest soil, properties appeared to not be completely inherited from the parent material, and in the Ah horizon, a friable structure prevailed. However, from chemical and physical analysis, pH had a narrow range of variability from forest (8.1) to reforestation and prairie (ca. 7.7) (Supplementary Materials Table S1), BD was high in reforestation and forest (ca. 1.2 g cm−3) (Table S1) whereas, sand, silt, clay, and carbonates did not change with land use (Table S1). pH, BD, clay, and carbonates increased with depth (p ≤ 0.05) (Table S2).

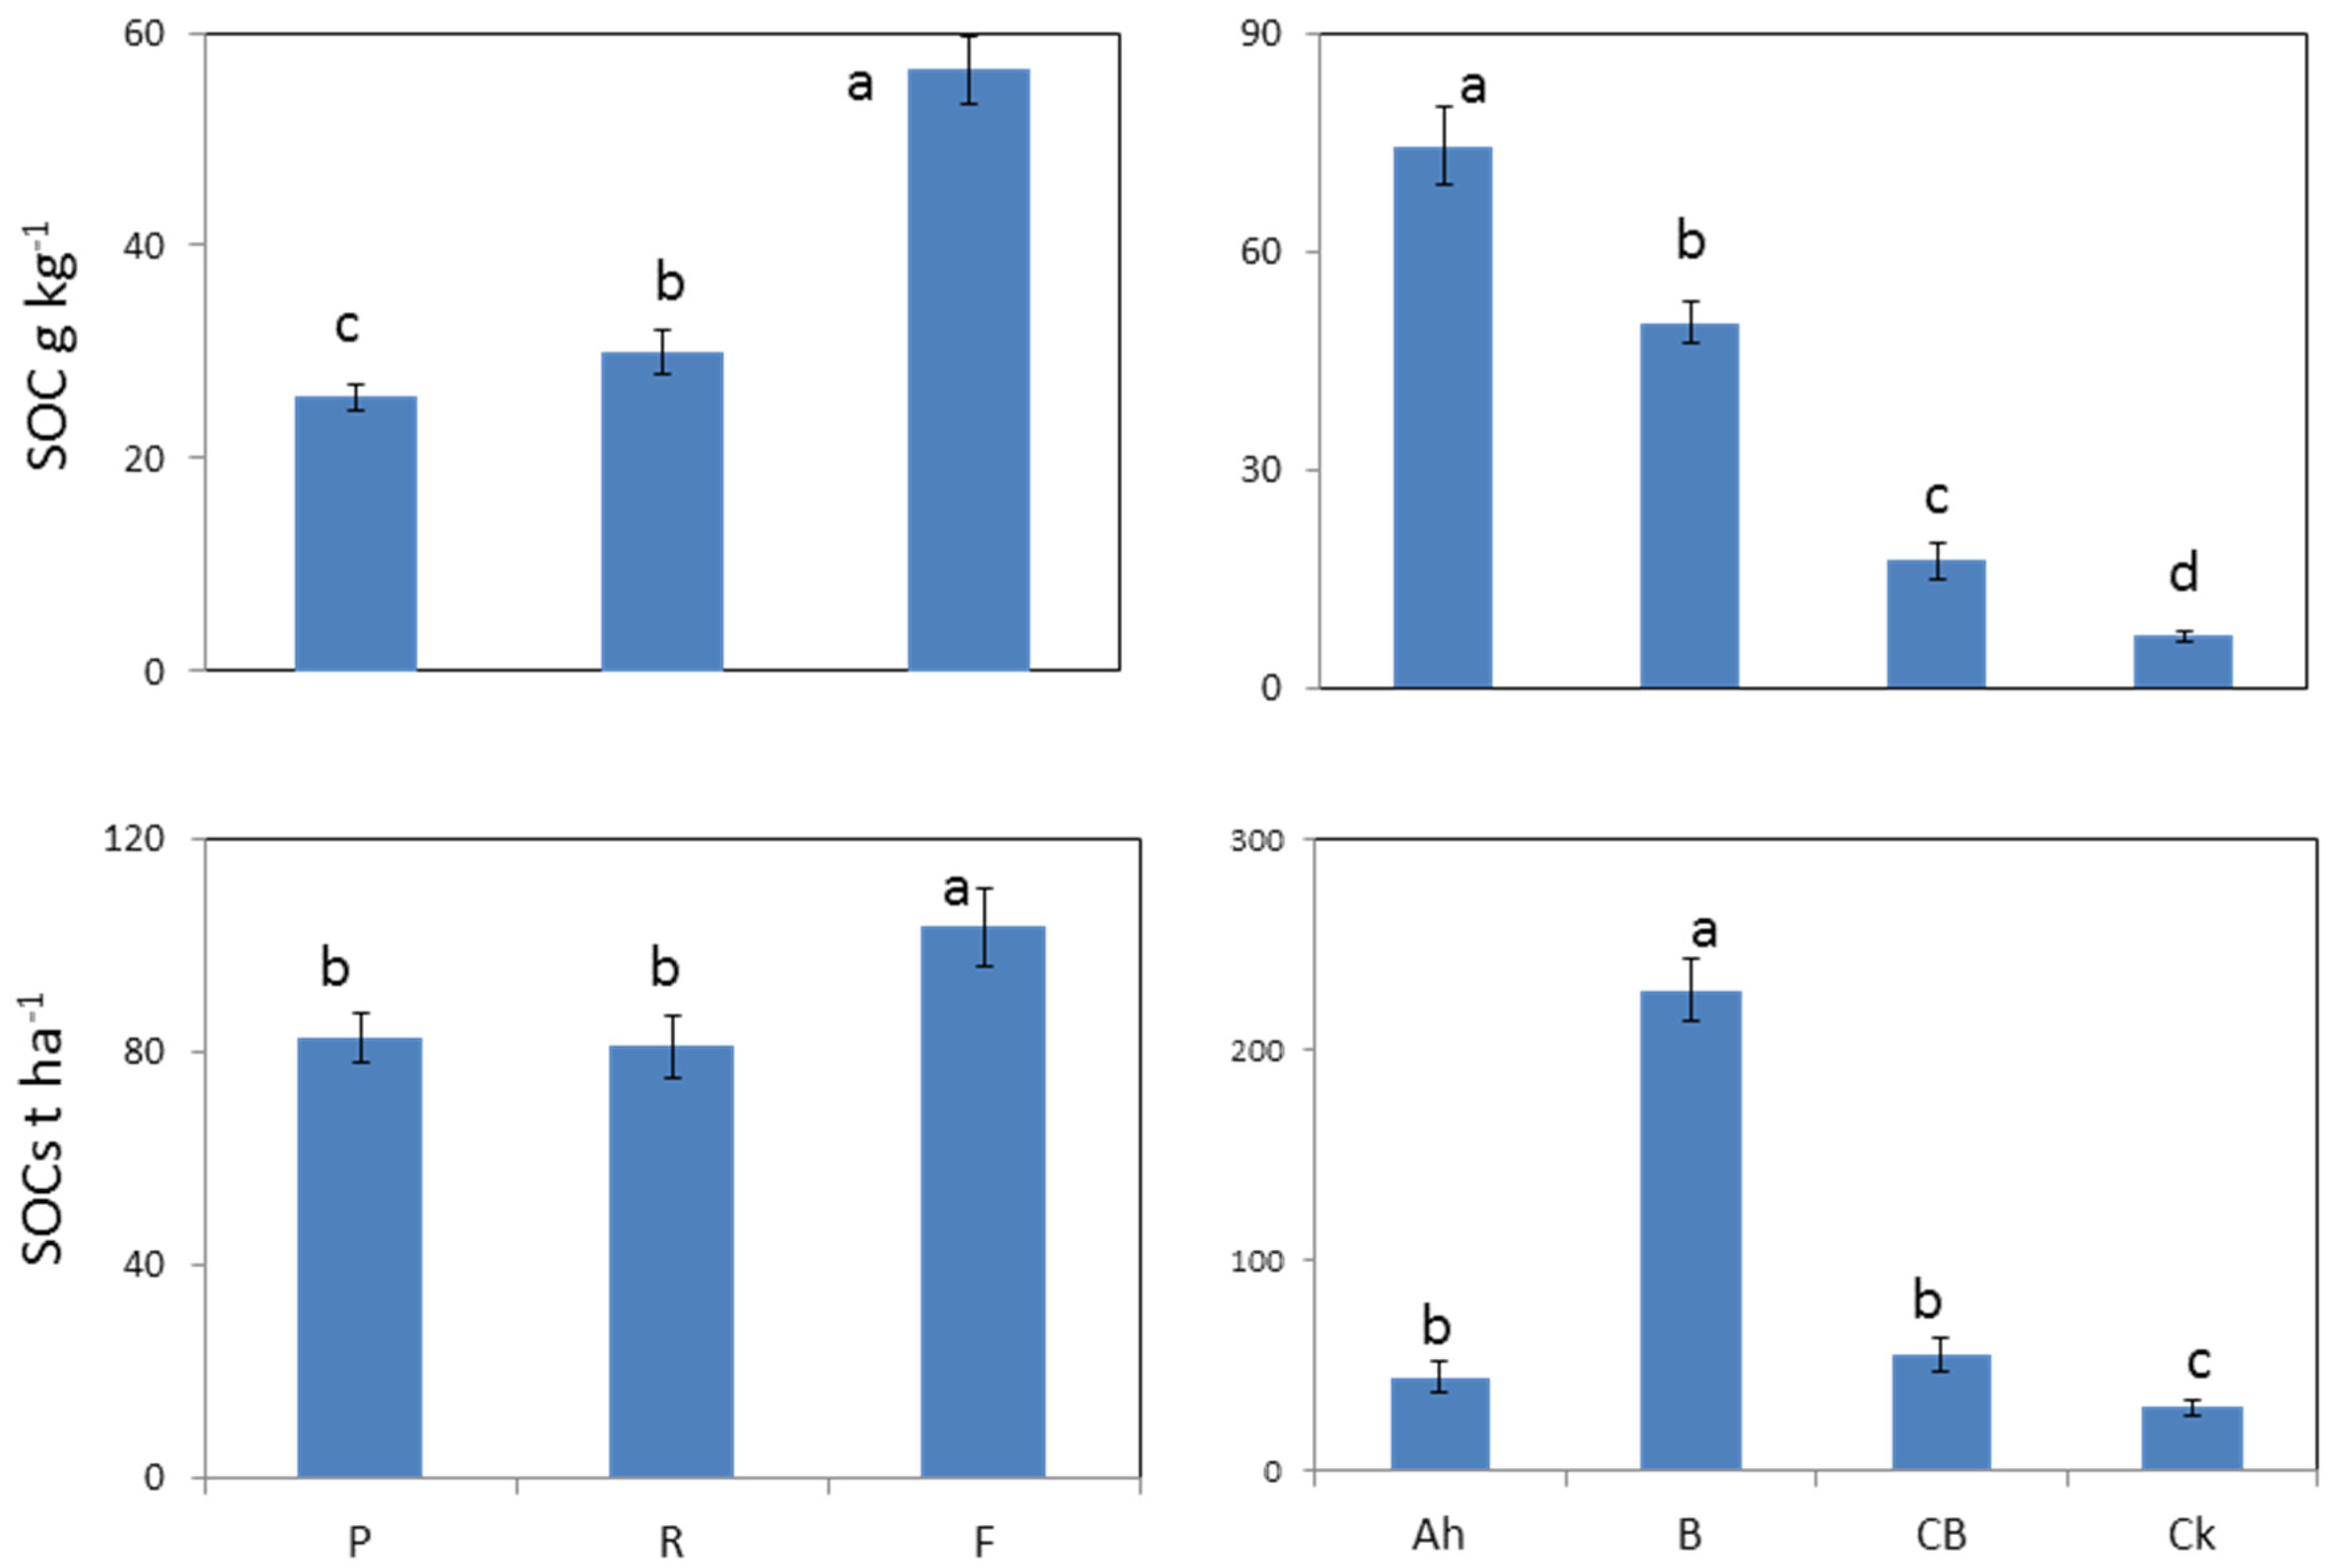
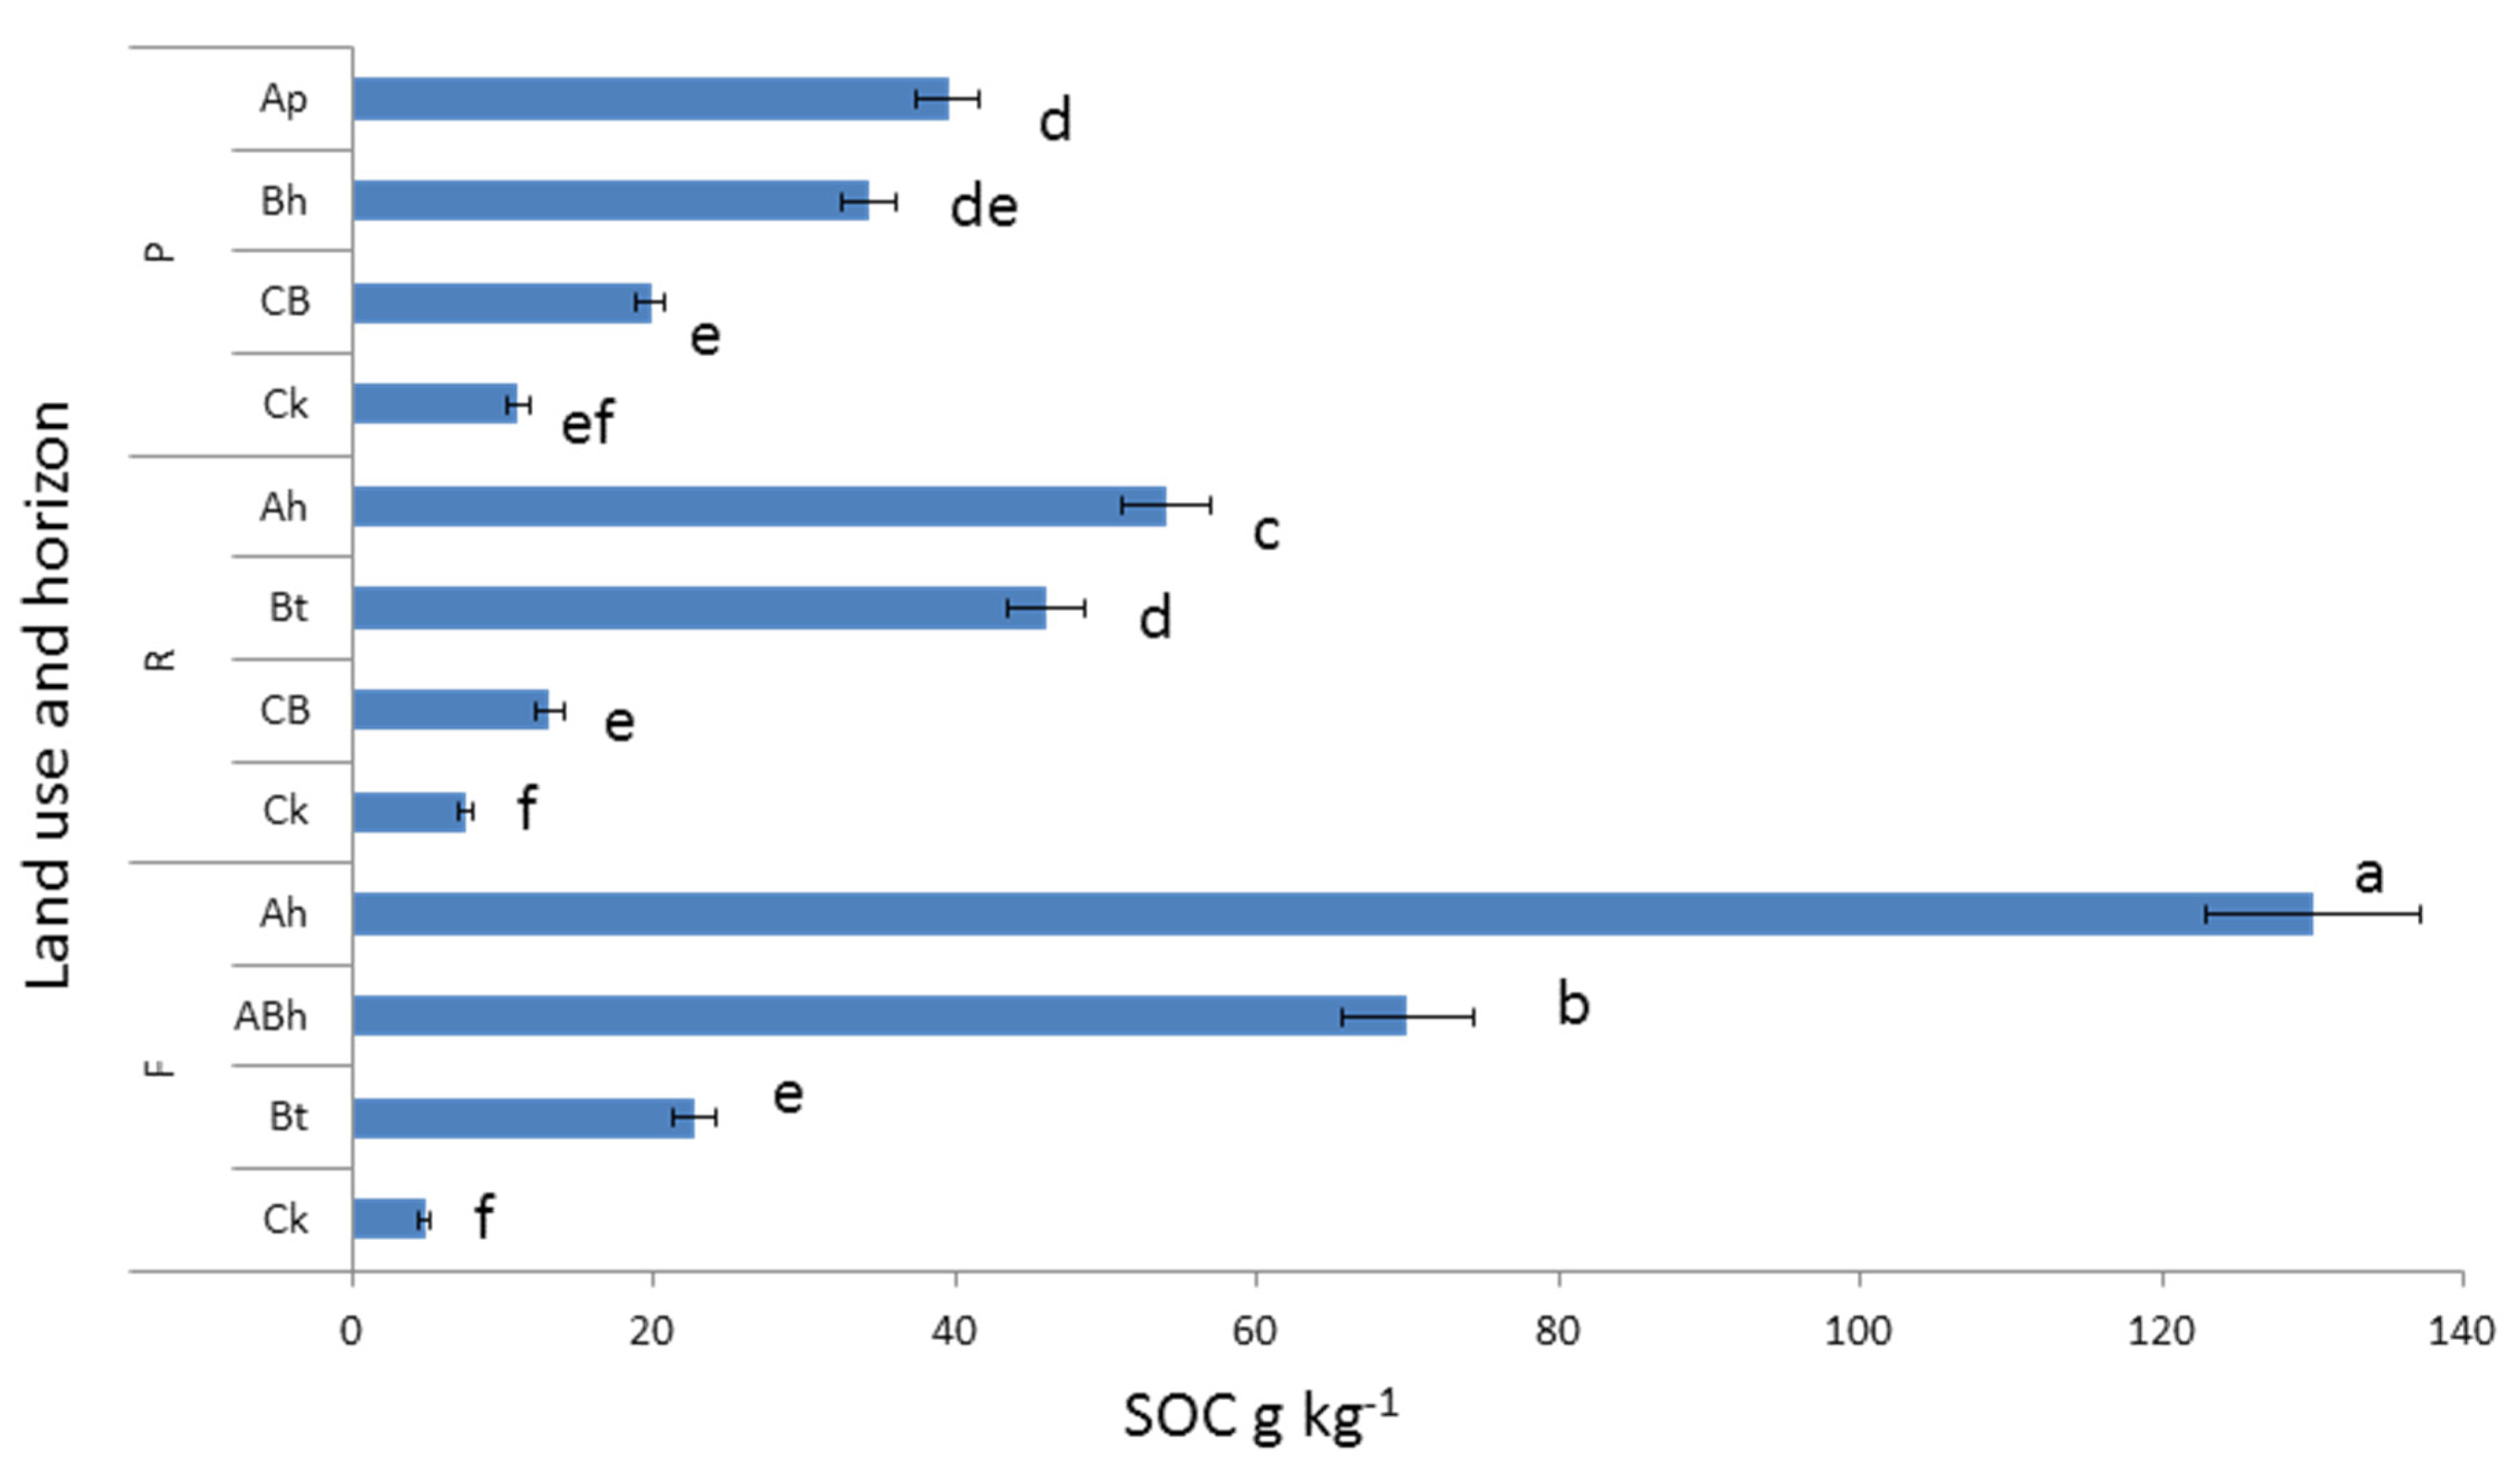
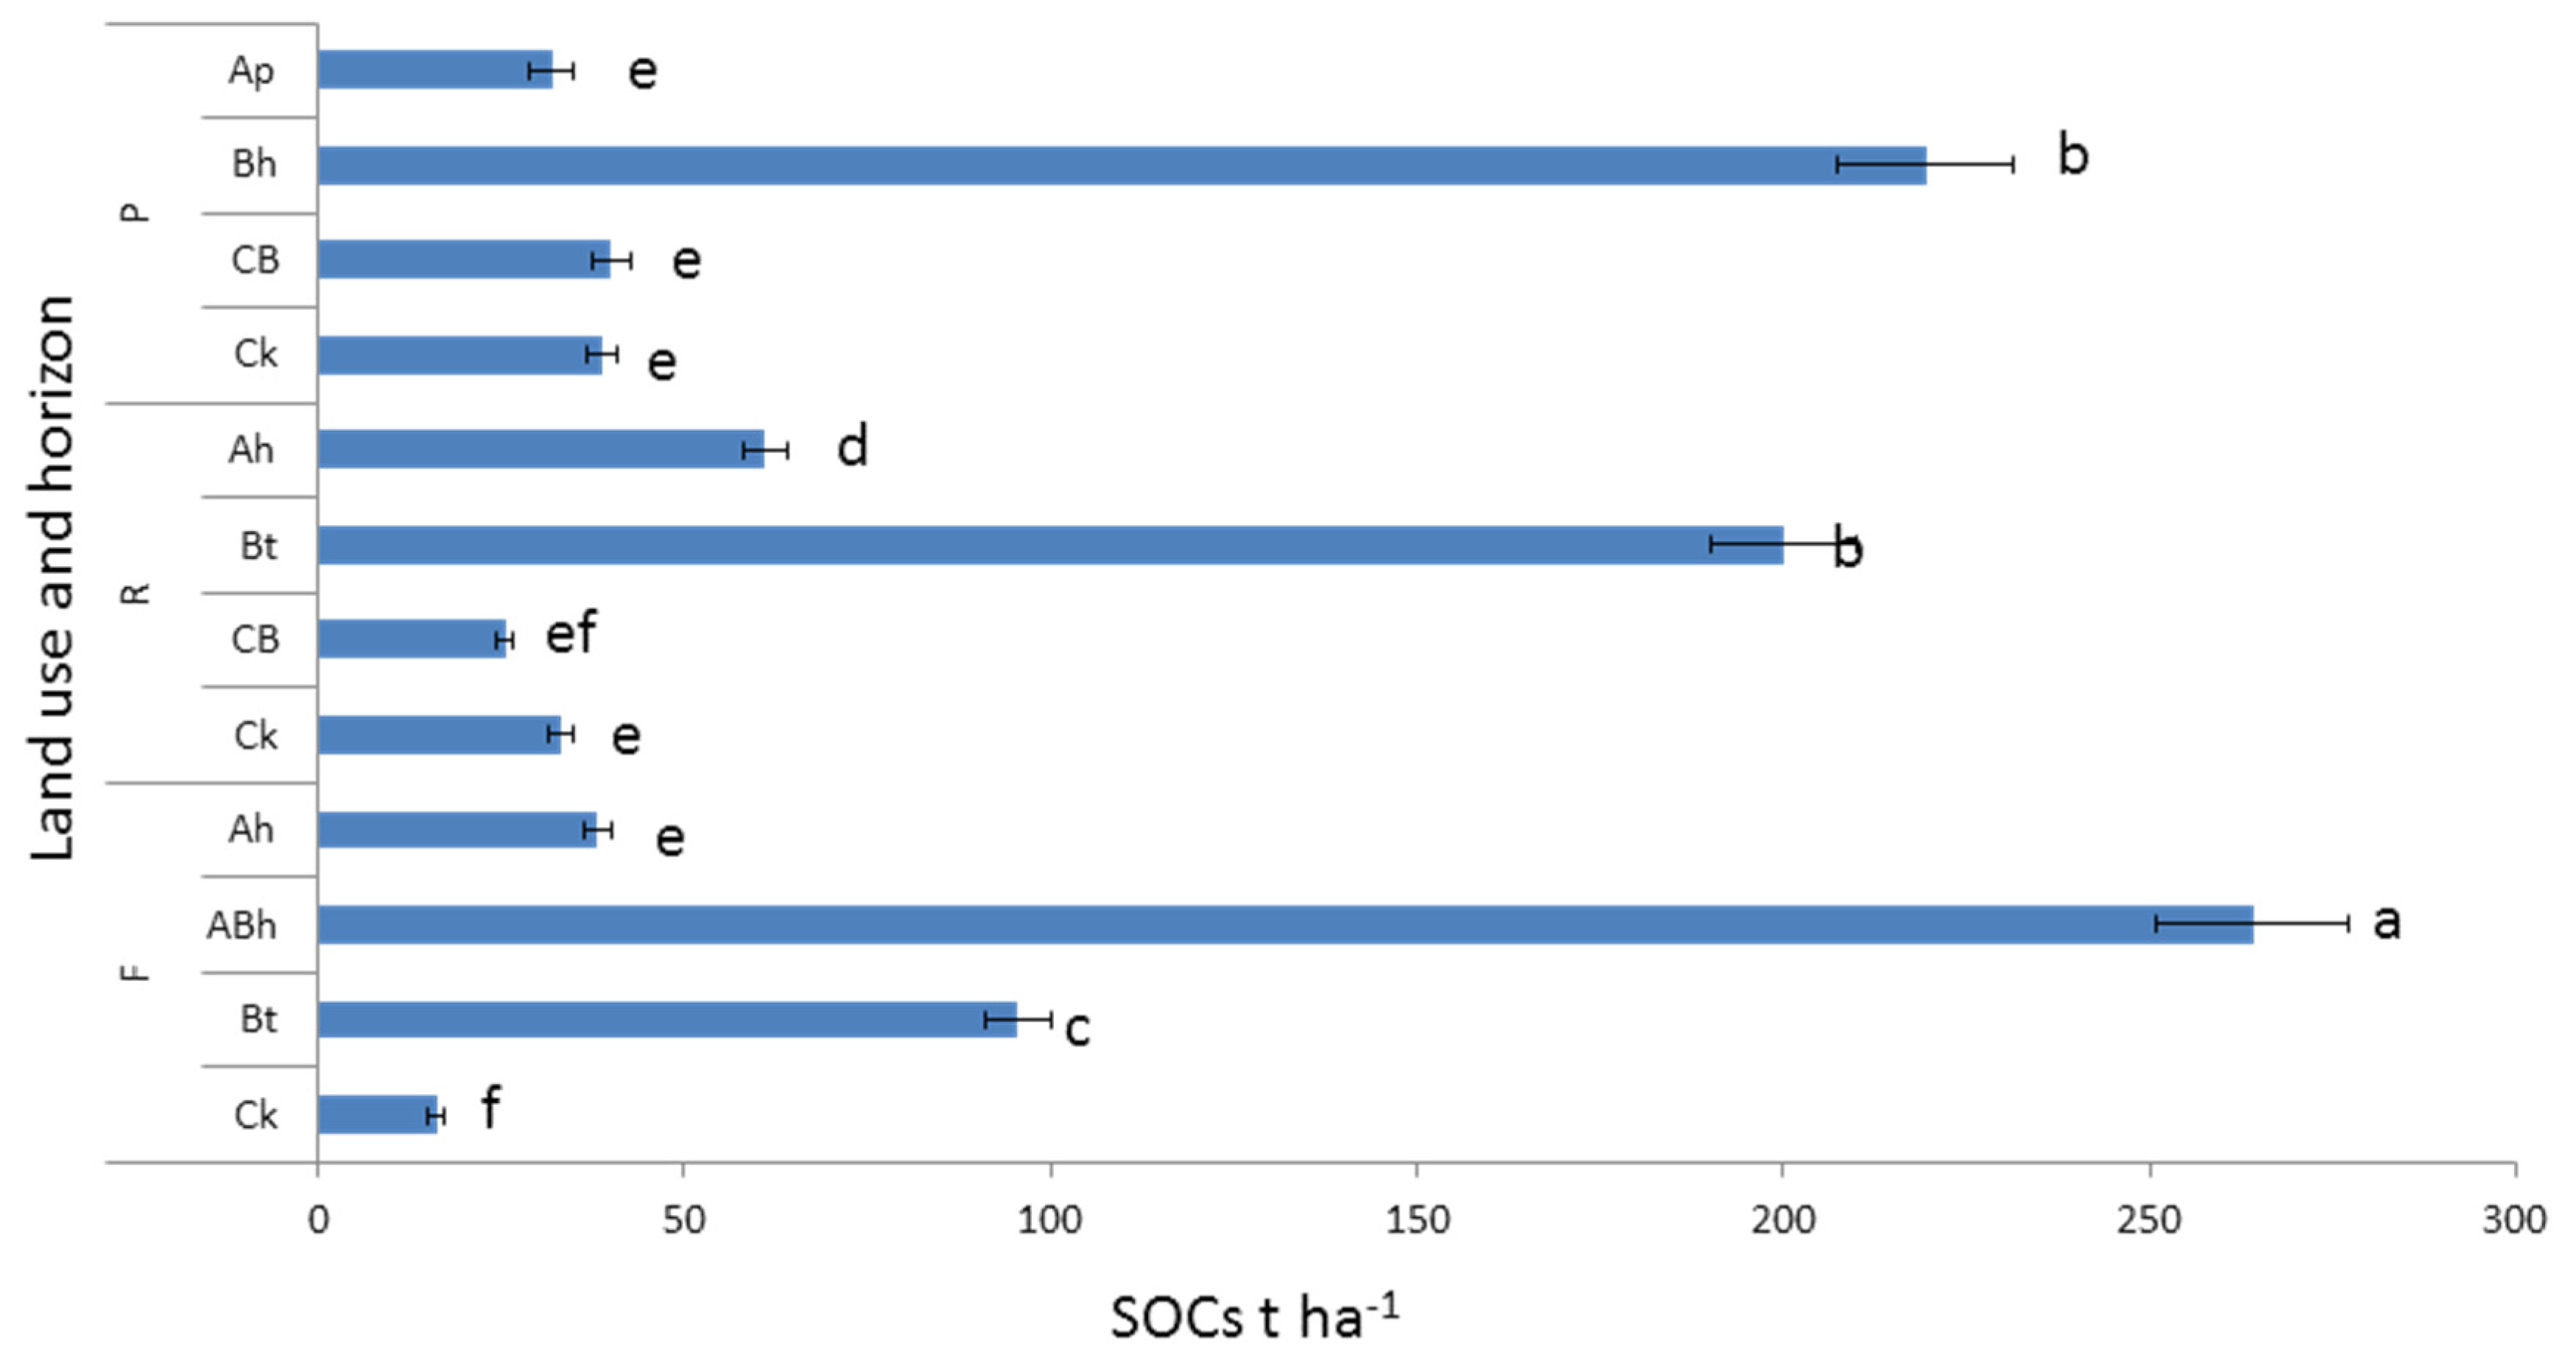
3.2. Soil Organic C and N Concentration and Stock under Different Land Uses and Depths

ANOVA results showed that SOC and TN were significantly affected by the land use (p = 0.001) and depth (p = 0.001). Forest had the highest concentrations in SOC (Figure 2), showing a mean value 2.2-fold higher than those in prairie (56.5 versus 25.7 g kg−1) (p = 0.05) (Table S1). No differences were found between prairie and reforestation. SOC decreased throughout the profiles (Figure 2) from the upper Ah to the lower Ck layers (74.6–7.1 g kg−1) (p = 0.05) (Table S1). Thus, forest Ah horizon had a SOC value 2.4-fold higher than reforestation and 3.3-fold higher than prairie (130, 54, 39.5 g kg−1, respectively) (land use × depth interaction significant at p = 0.001) (Figure 3). Similar to SOC, the concentration in TN in the Ah horizon of forest was 2-fold higher than prairie and reforestation (5.5, 2.1, 2.4 g kg−1, respectively) (land use × depth interaction significant at p = 0.001).
Concerning the stock in organic carbon (SOCs) (t ha−1) (Figure 2), forest soil had a higher mean value (103 t ha−1) than prairie and reforestation (ca. 80 t ha−1) (p = 0.05) (Table S1), whilst the B horizon was the more endowed (228 t ha−1) among layers (p = 0.05) (Table S2). Thus, the ABh horizon of forest had the maximum amount in SOCs, reaching a value of 264 t ha−1 (Figure 4). Calculating the mean upper 20 cm layer, SOCs increased from the prairie and reforestation to the forest, showing values of 31.9, 42 and 120 t ha−1, respectively. This corresponded to increments of 1.3-fold prairie for reforestation, and 3.8-fold prairie for forest.

3.3. Humic Substance Features under Different Land Uses and Depths

Forest had a higher C:N ratio (20.0) than prairie and reforestation (ca. 17.3) (p = 0.05) (Table S1), and a HC content of 21.7 g kg−1, which was greater than reforestation (2.8-fold) (p = 0.05), and prairie (4-fold) (p = 0.05) (Table S1). Both C:N ratio and humic C (HC) content decreased with depth, showing values from 21.8 and 31.1 g kg−1 in the surface layer to 11.5 and 0.8 g kg−1 at depth (p = 0.05) (Table S2).
13C-NMR spectra of humic substances revealed a different pattern in C with O,N-alkyl > alkyl > aromatic > carboxyl > phenolic. With respect to land use, reforestation and prairie had a higher content in O,N-alkyl C (49.43% and 46.80%, respectively) with respect to forest (39.38%) (p = 0.05) (Table 2). Comparing prairie with reforestation no differences were found in alkyl (22.85% and 23.76%) and aromatic C (16.91% and 16.23%), whilst both increased in forest (25.97% and 20.20%) (p = 0.05) (Table 2). Carboxyl and phenolic C were higher in forest (11.76% and 4.03%, respectively) and prairie (11.3% and 4.72%) than in reforestation (8.40% and 2.93%) (p = 0.05) (Table 2). Respect to depth, alkyl, carboxyl, and phenolic C prevailed in the Ah horizons, whereas aromatic and O,N-alkyl C were dominant in the B horizons (Table 2). The δ13C of HS was falling in a narrow range with lower values in prairie (−25.9‰) than in reforestation and forest (−24.9 and −25.1‰), whilst B horizons had higher δ13C values (−24.48‰) than Ah horizons (−26.12‰) (p = 0.05).
The correlations between soil physical and chemical parameters, SOC and TN were weakly correlated with pH (r = −0.39, p = 0.019 and r = −0.40, p = 0.015) and clay (r = −0.50, p = 0.002 and r = −0.52, p = 0.001), whilst SOC was highly and negatively correlated with TN (r = −0.98, p < 0.001), HC (r = −0.95, p < 0.001), and with BD (r = −0.75, p < 0.001).
Moreover, HC showed high correlation value with alkyl C (r = 0.82, p = 0.001), O,N-alkyl C (r = −0.83, p = 0.001), and carboxyl C (r = 0.76, p = 0.001). δ13C was strongly correlated with clay (r = 0.90, p = 0.001), SOC stock (r = 0.79, p = 0.001), HC:OC ratio (r = 0.75, p = 0.001), phenolic C (r = 0.88, p = 0.001), aromatic C (r = 0.71, p = 0.001), alkyl C (r = 0.71, p = 0.001), and carboxyl C (r = 0.67, p = 0.002).

4. Discussion

Our results showed land use is reflected on SOC concentration and stock, thus forest had high SOC concentrations and stocks with respect to reforestation and prairie. This confirms that in boreal ecosystems forests have higher litter input than prairies [32,33]. Nevertheless, the amount of organic C in soil is known to be affected also by soil properties such as bulk density, and high SOC promotes larger soil pores, which in turn decreases bulk density [34]. In fact, BD was inversely related with SOC, and it was significantly affected by land use. Indeed, forest had high SOC and relative low BD, whereas prairie had low SOC and high BD. A similar trend was reported comparing middle-aged forestland with shrubland [32]. However, while concentration in SOC was highest in the top soil layers, the stock in SOC had its maximum in the Bh, Bt, and ABh horizons. The increased SOCs in the B horizon may be due to the contribution of root litter and downward SOC transport by bioturbation and/or soil water percolating. SOC accumulation was also strictly related with soil pH as already found [35,36].
Behind the stock in SOC, in this study we found that land use affected the SOM evolution and production of more stable C forms, such as humus. Indeed, the relatively low C:N and production in humic carbon found in prairies indicated that SOM progressed towards humification, while the high C:N and HC of forests indicate that the SOM moved towards the humification-immobilization process. Intermediate position between prairie and forest was instead found in reforestation.
By studying the organic matter composition via 13C-NMR technique, peptide, carbohydrate, and alkyl C were found to be the main components of the HS in forest soils [36]. Indeed, the alkyl and aromatic C increased from the prairies to forests. Probably, the inputs of waxes from resinous litter could have increased the proportion of alkyl groups in forest soils. Indeed, the SOC under grass vegetation has been reported to be poorer in alkyl-C compared to the SOC under forest [19,37,38]. Overall, the marked distribution of O,N-alkyl C and alkyl C in HS suggest a low degree of humification that could be partly due to anthropic activity. Nonetheless, in forest, the relatively high presence of aromatic C indicated a higher humification degree than prairie and reforestation. 13C-NMR results also showed marked changes due to soil depth. In particular, the labile components such as alkyl and carboxylic C decreased with increasing depth, while the more persistent aromatic C components dominated. The observed pattern may be associated with progressing litter decomposition and increasing humification. These results agree with previous findings [21] that found along an alpine elevation gradient that labile organic compounds dominated the upper soil layers, whereas persistent materials accumulated in deep layers. Similar results were previously demonstrated for humic acids [39]. Moreover, high pH implies favourable conditions for organic matter decomposition leading to humification and accumulation of aromatic structures [21,22,23,24,25,26,27,28,29,30,31,32,33,34,35,36,37,38,39,40]. Indeed, in our study, the aromatic components of HS positively correlated with the soil pH, while the carboxyl C showed an opposite trend. δ13 C values can give important information about origin and decomposition patterns of the organic matter. Stable carbon isotopes are important markers of OM and are widely used in studies of ecology [41]. Our data proved that organic matter extracted from the three different land uses was produced by C3 vegetation, as expected for an alpine environment such as that of Cortina, which experienced a temperate or colder climate. Moreover, the slightly lower (more negative) and higher (less negative) δ13 C values in Ah and B horizons, respectively, depended on the different chemical composition of organic compounds. In fact, during decomposition processes some isotopic fractionation does occur, due to the preference accorded by microorganisms to 12C with respect to the heavier 13C [42]. A similar progressive increase of δ13C with depth has been reported for the bulk SOM by other authors [43,44], and thus it may be inferred that the stronger decomposition of the extractable SOM in the deep horizons reflects that of the bulk SOM. Land use might influence the stabilization of CO2 levels increasing C sink in soils [15].
It must be remembered that in forestry contexts as in this work, the concept of land use is closely linked to a different plant cover which consequently implies a different management. It is therefore difficult to determine whether the differences found in the studied soils are due to the different use of land or different coverage. Plant cover, stand age and site physical and topographic variables are known to affect soil carbon content and characteristics [6,9], but this study showed that the alpine forest carries a large amount of organic carbon and humic carbon, which is respected both at reforestation and prairie. Therefore, by virtue of a management point of view aimed at decreasing or counteracting the increase in the amount of CO2 in the atmosphere, result important to preserve and where possible increase the surface dedicated to such uses of soil. Forest, obviously, appears to be the much more efficient ecosystem than prairie and reforestation in term of carbon storage. In terms of management it should also be encouraged the formation of thick B horizons which are useful as site of humic carbon, the more stable and more fertile carbon in soil. However, it is still important to address the assumption we made that the prairie and forest types were comparable in the past, and that the current soil attribute differences were due to the presence of forest. However, because these locations are so long established (both forest and prairie have been in that condition for 200 years or longer), we really do not know the origin of those vegetation types. It is certainly possible that there were initial differences in soils or other conditions that favoured the establishment of forest on the plots that are now forest, partially explaining the difference in the detected soil characteristics.

5. Conclusions

In this study, we found in alpine environment of NE Italy that SOC concentration and stock changed consistently with land use type and soil depth. Each horizon of the forest soil had greater amounts of SOC with respect to prairie and natural reforestation. In particular, in the 20 cm surface layer of a soil forest, carbon stock was 4 times higher in comparison to prairie, demonstrating that change in land use or disturbance may be the cause of soil carbon loss. Spectroscopic analysis provided evidence of a marked distribution of O,N-alkyl C and alkyl C in HS, suggesting a low degree of humification that could be partly due to anthropic activity. Nevertheless, in forest, the relatively high presence of aromatic C indicated that HS endowed a high humification degree. In short, the results of this study provide evidence that land use change from prairie to secondary forest plantation improves the humification process, by promoting soil carbon storage in the form of refractory C, such as humus. Therefore, it is possible to suggest that the conversion of prairie to forestland may represent a good practice for C sequestration.

Supplementary Materials

The following are available online at www.mdpi.com/1999-4907/8/6/197/s1, Table S1: Mean values of physical and chemical soil properties under different land use types, Table S2: Mean values of physical and chemical soil properties per depth.

Acknowledgments

The authors would like to remember and thank Dino Dibona, pedologist, naturalist, and connoisseur of the mountain.

Author Contributions

S.N. supervised this study. D.P. and O.F. wrote the manuscript. O.F., G.C., and A.M. participated in the discussions surrounding this study.

Conflicts of Interest

The authors declare no conflict of interest.

References

  1. Fang, X.; Zhang, C.; Wang, Q.; Chen, X.; Ding, J.; Karamage, F. Isolating and Quantifying the Effects of Climate and CO2 Changes (1980–2014) on the Net Primary Productivity in Arid and Semiarid China. Forests 2017, 8, 60. [Google Scholar] [CrossRef]
  2. Zanella, A.; Jabiol, B.; Ponge, J.F.; Sartore, G.; De Waal, R.; Van Delft, B.; Cools, U.; Katzensteiner, K.; Hager, H.; Englisch, M. A European morpho-functional classification of humus forms. Geoderma 2011, 164, 138–145. [Google Scholar] [CrossRef]
  3. Grüneberg, E.; Ziche, D.; Wellbrock, N. Organic carbon stocks and sequestration rates of forest soils in Germany. Glob. Chang. Biol. 2014, 20, 2644–2662. [Google Scholar] [CrossRef] [PubMed]
  4. Six, J.; Conant, R.T.; Paul, E.A.; Paustian, K. Stabilization mechanisms of soil organic matter: Implications for C-saturation of soils. Plant Soil 2002, 241, 155–176. [Google Scholar] [CrossRef]
  5. Kaiser, K.; Guggenberger, G. Mineral surfaces and soil organic matter. Eur. J. Soil Sci. 2003, 54, 219–236. [Google Scholar] [CrossRef]
  6. Pizzeghello, D.; Nicolini, G.; Nardi, S. Hormone-like activities of humic substances in different forest ecosystems. New Phytol. 2002, 155, 393–402. [Google Scholar] [CrossRef]
  7. Augusto, L.; Ranger, J.; Binkley, D.; Rothe, A. Impact of several common tree species of European temperate forests on soil fertility. Ann. For. Sci. 2002, 59, 233–253. [Google Scholar] [CrossRef]
  8. Vesterdal, L.; Schmidt, I.K.; Callesen, I.; Nilsson, L.O.; Gundersen, P. Carbon and nitrogen in forest floor and mineral soil under six common European tree species. For. Ecol. Manag. 2008, 255, 35–48. [Google Scholar] [CrossRef]
  9. Carletti, P.; Vendramin, E.; Pizzeghello, D.; Concheri, G.; Zanella, A.; Nardi, S.; Squartini, A. Soil humic compounds and microbial communities in six spruce forests as function of parent material, slope aspect and stand age. Plant Soil 2009, 315, 47–65. [Google Scholar] [CrossRef]
  10. Vesterdal, L.; Clarke, N.; Sigurdsson, B.D.; Gundersen, P. Do tree species influence soil carbon stocks in temperate and boreal forests? For. Ecol. Manag. 2013, 309, 4–18. [Google Scholar] [CrossRef]
  11. Augusto, L.; De Schrijver, A.; Vesterdal, L.; Smolander, A.; Prescott, C.; Ranger, J. Influences of evergreen gymnosperm and deciduous angiosperm tree species on the functioning of temperate and boreal forests. Biol. Rev. 2015, 90, 444–466. [Google Scholar] [CrossRef] [PubMed]
  12. Muscolo, A.; Bagnato, S.; Sidari, M.; Mercurio, R. A review of the roles of forest canopy gaps. J. For. Res. 2014, 25, 725–736. [Google Scholar] [CrossRef]
  13. James, J.; Harrison, R. The Effect of Harvest on Forest Soil Carbon: A Meta-Analysis. Forests 2016, 7, 308. [Google Scholar] [CrossRef]
  14. Brown, S.; Lugo, A.E. Tropical secondary forests. J. Trop. Ecol. 1990, 6, 1–32. [Google Scholar] [CrossRef]
  15. Arnhold, S.; Otieno, D.; Onyango, J.; Koellner, T.; Huwe, B.; Tenhunen, J. Soil properties along a gradient from hillslopes to the savanna plains in the Lambwe Valley, Kenya. Soil Tillage Res. 2015, 154, 75–83. [Google Scholar] [CrossRef]
  16. Seyoum, B. Assessment of soil fertility status of Vertisols under selected three land uses in Girar Jarso District of North Shoa Zone, Oromia National Regional State, Ethiopia. Environ. Syst. Res. 2016, 5, 18. [Google Scholar] [CrossRef]
  17. Li, Y.; Xia, Y.; Lei, Y.; Deng, Y.; Chen, H.; Sha, L.; Cao, M.; Deng, X. Estimating changes in soil organic carbon storage due to land use changes using a modified calculation method. iForest 2015, 8, 45–52. [Google Scholar] [CrossRef]
  18. Bravo, F.; Lucà, M.; Mercurio, R.; Sidari, M.; Muscolo, A. Soil and forest productivity: A case study from Stone pine (Pinus pinea L.) stands in Calabria (southern Italy). iForest 2011, 4, 25–30. [Google Scholar] [CrossRef]
  19. Montecchio, D.; Francioso, O.; Carletti, P.; Pizzeghello, D.; Chersich, S.; Previtali, F.; Nardi, S. Thermal analysis (TG-DTA) and DRIFT spectroscopy applied to investigate the evolution of humic acids in forest soil at different vegetation stages. J. Ther. Anal. Calorim. 2006, 83, 393–399. [Google Scholar] [CrossRef]
  20. Muscolo, A.; Panuccio, M.R.; Mallamaci, C.; Sidari, M. Biological indicators to assess short-term soil quality changes in forest ecosystems. Ecol. Ind. 2014, 45, 416–423. [Google Scholar] [CrossRef]
  21. Djukic, I.; Zehetner, F.; Tatzber, M.; Gerzabek, M. Soil organic-matter stocks and characteristics along an Alpine elevation gradient. J. Plant Nutr. Soil Sci. 2010, 173, 30–38. [Google Scholar] [CrossRef]
  22. IUSS Working Group WRB. World Reference Base for Soil Resources 2014, Update 2015. International Soil Classification System for Naming Soils and Creating Legends for Soil Maps; World Soil Resources Reports No. 106; FAO: Rome, Italy, 2015. [Google Scholar]
  23. Marriott, C.A.; Hudson, G.; Hamilton, D.; Neilson, R.; Boag, B.; Handley, L.L.; Robinson, D. Spatial variability of soil total C and N and their stable isotopes in an upland Scottish grassland. Plant Soil 1997, 196, 151–162. [Google Scholar] [CrossRef]
  24. FAO. Guidelines for Soil Description, 4th ed.; FAO: Rome, Italy, 2006; p. 110. [Google Scholar]
  25. Gee, G.W.; Bauder, J.W. Particle-size analysis. In Methods of Soil Analysis, Part 1. Physical and Mineralogical Methods, 2nd ed.; Agronomy Monograph; American Society of Agronomy/Soil Science Society of America: Madison, WI, USA, 1986; Volume 9, pp. 383–411. [Google Scholar]
  26. Walkley, A.; Black, I.A. An examination of Degtjareff method for determining soil organic matter and a proposed modification of the chromic acid titration method. Soil Sci. 1934, 37, 29–38. [Google Scholar] [CrossRef]
  27. Kjeldahl, J. A new method for the determination of nitrogen in organic matter. Z. Anal. Chem. 1883, 22, 366–382. [Google Scholar] [CrossRef]
  28. Stevenson, F.J. Humus Chemistry: Genesis, Composition, Reactions; John Wiley and Sons: New York, NY, USA, 1994. [Google Scholar]
  29. Candler, R.; Luping, C.; Michaelson, G.J.; Malcolm, R.L. Characterization of fractionated soil organic matter from two Alaskan arctic soils by 13C NMR and titration analysis. In The Role of Humic Substances in the Ecosystems and in Environmental Protection; IHSS Polish Society of Humic Substances: Wroclaw, Poland, 1997; pp. 301–307. [Google Scholar]
  30. Craig, H. Isotope standards for carbon and oxygen and correction factors for mass spectrometric analysis of carbon dioxide. Geochim. Cosmochim. Acta 1957, 12, 133–149. [Google Scholar] [CrossRef]
  31. Sokal, R.R.; Rohlf, F.J. Biometry, 1st ed.; Freeman: San Francisco, CA, USA, 1969. [Google Scholar]
  32. Wang, T.; Kang, F.; Cheng, X.; Han, H.; Ji, W. Soil organic carbon and total nitrogen stocks under different land uses in a hilly ecological restoration area of North China. Soil Tillage Res. 2016, 163, 176–184. [Google Scholar] [CrossRef]
  33. Gelaw, A.M.; Singh, B.R.; Lal, R. Soil organic carbon and total nitrogen stocks under different land uses in a semi-arid watershed in Tigray, North Ethiopia. Agric. Ecosyst. Environ. 2014, 188, 256–263. [Google Scholar] [CrossRef]
  34. Lister, T.W.; Burger, J.A.; Patterson, S.C. Role of vegetation in mitigating soil quality impacted by forest harvesting. Soil Sci. Soc. Am. J. 2004, 68, 263–271. [Google Scholar] [CrossRef]
  35. Motavalli, P.P.; Palm, C.A.; Parton, W.J.; Elliott, E.T.; Frey, S.D. Soil pH and organic carbon dynamics in tropical forest soils: Evidence from laboratory and simulation studies. Soil Biol. Biochem. 1995, 27, 1589–1599. [Google Scholar] [CrossRef]
  36. Pizzeghello, D.; Berti, A.; Nardi, S.; Morari, F. Phosphorus-related properties in the profiles of three Italian soils after long-term mineral and manure applications. Agric. Ecosyst. Environ. 2014, 189, 216–228. [Google Scholar] [CrossRef]
  37. Beyer, L. The chemical composition of soil organic matter in classical humic compound fractions and in bulk samples—A review. J. Plant Nutr. Soil Sci. 1996, 159, 527–539. [Google Scholar] [CrossRef]
  38. Golchin, A.; Clarke, P.; Baldock, J.A.; Higashi, T.; Skjemstad, J.O.; Oades, J.M. The effects of vegetation and burning on the chemical composition of soil organic matter in a volcanic ash soil as shown by 13C NMR spectroscopy. I. Whole soil and humic acid fraction. Geoderma 1997, 76, 155–174. [Google Scholar] [CrossRef]
  39. Tatzber, M.; Stemmer, M.; Spiegel, H.; Katzlberger, C.; Haberhauer, G.; Mentler, A.; Gerzabek, M.H. FTIR-spectroscopic characterization of humic acids and humin fractions obtained by advanced NaOH, Na4P2O7, and Na2CO3 extraction procedures. J. Plant Nutr. Soil Sci. 2007, 170, 522–529. [Google Scholar] [CrossRef]
  40. Quideau, S.A.; Anderson, M.A.; Graham, R.C.; Chadwick, O.A.; Trumbore, S.E. Soil organic matter processes: Characterization by 13CNMR and 14C measurements. For. Ecol. Manag. 2000, 138, 19–27. [Google Scholar] [CrossRef]
  41. Guo, Q.; Zhu, G.; Chen, T.; Yang, J.; Yang, J.; Peters, M.; Wei, R.; Tian, L.; Han, X.; Hu, J. Spatial variation and environmental assessment of soil organic carbon isotopes for tracing sources in a typical contaminated site. J. Geochem. Explor. 2017, 175, 11–17. [Google Scholar] [CrossRef]
  42. Ågren, G.O.; Bosatta, E.; Balesdent, J. Isotope discrimination during decomposition of organic matter: A theoretical analysis. Soil Sci. Soc. Am. J. 1996, 60, 1121–1126. [Google Scholar] [CrossRef]
  43. Bol, R.; Harkness, D.D.; Huang, Y.; Howard, D.M. The influence of soil processes on carbon isotope distribution and turnover in the British uplands. Eur. J. Soil Sci. 1999, 50, 41–51. [Google Scholar] [CrossRef]
  44. Certini, G.; Agnelli, A.; Corti, G.; Capperucci, A. Composition and mean residence time of molecular weight fractions of organic matter extracted from two soils under different forest species. Biogeochemistry 2004, 71, 299–316. [Google Scholar] [CrossRef]
Figure 1. Map of Cortina d’Ampezzo Valley (Northestern Italy) indicating the study locations (circle, forest; triangle, reforestation; square, prairie).
Forests 08 00197 g001
Figure 2. Soil organic carbon concentration and stock per land use (forest, F; reforestation, R; prairie, P) and soil depth. Data followed by the same letter are not statistically different from each other (Student’s test, p = 0.05).
Forests 08 00197 g002
Figure 3. Soil organic carbon concentration according to the land use (forest, F; reforestation, R; prairie, P) per soil depth interaction. Data followed by the same letter are not statistically different from each other (Student’s test, p = 0.05).
Forests 08 00197 g003
Figure 4. Soil organic carbon stock according to the land use (forest, F; reforestation, R; prairie, P) per soil depth interaction. Data followed by the same letter are not statistically different from each other (Student’s test, p = 0.05).
Forests 08 00197 g004
Table 1. Morphological description of the three representative profiles belonging to the three land use types (prairie, P; reforestation, R; forest, F), Cortina d’Ampezzo Valley, Italy.
Land UseSoil HorizonDepth cmColour aStructure bRoots cSkeleton d %Limit eObservations
Soil under prairie (Aric Anthrosol, IUSS Working Group WRB, 2015)
PAp0–2010YR 2/2 (very dark brown)2,3 f, sbk3 vf, m5c, ino effervescent
Bh20–8010YR 3/3 (dark brown)m, sbk1 vf, f5c, uno effervescent
CB80–10310YR 4/2 (dark greyish brown)sbk1 vf25c, uweak effervescent
Ck103–>15010YR 4/1 (dark grey)ms-40ukEffervescent
Soil under reforestation (Haplic Luvisol, IUSS Working Group WRB, 2015)
RAh0–3210YR 2/2 (very dark brown)2,3 sbk3 vf, f5c, ino effervescent
Bt32–7110YR 3/3 (dark brown)m, sbk1 f3c, uno effervescent
CB71–9210YR 4/2 (dark greyish brown)sbk1 vf15c, uweak effervescent
Ck92–>15010YR 4/1 (dark grey)ms-40ukeffervescent
Soil under forest (Haplic Luvisol, IUSS Working Group WRB, 2015)
FAh0–1610YR 2/2 (very dark brown)2 fr3 vf, m2c, ino effervescent
ABh16–5110YR 3/3 (dark brown)2 m, sbk2 vf, f2c, lno effervescent
Bt57–8810YR 3/6 (dark greyish brown)m, sbk1 f5c, uweak effervescent
Ck88–>15010YR 4/1(dark grey)ms-50ukeffervescent
a Moist and crushed, according to the Munsell soil colour charts (1954 edition). b 1 = weak, 2 = moderate, 3 = strong; f = fine, m = medium, c = coarse; fr = friable; g = granular, sbk = sub-angular blocky, s = massive. c 1 = few, 2 = plentiful, 3 = abundant; mi = micro, vf = very fine, f = fine, m = medium. d By mass. e c = clear; i = irregular; u = undulating; uk = unknown.
Table 2. Distribution of C determined 13C-NMR and δ13C in the three land use types, Cortina d’Ampezzo Valley, Italy.
Land Use Chemical Shift of C (ppm) %δ13C ‰
HorCarboxylPhenolicAromaticO,N-AlkylAlkyl
PAh11.63 b *5.43 a13.73 d45.80 b25.80 c−26.80 d
B11.13 b4.01 b20.10 b47.80 b19.90 e−24.96 b
11.3 A4.72 A16.91 B46.80 A22.85 B−25.88 B
RAh10.91 b4.00 b13.93 d43.73 bc27.50 b−25.90 c
B5.90 d1.86 c18.53 bc55.13 a20.03 e−23.93 a
8.40 B2.93 C16.23 B49.43 A23.76 B−24.91 A
FAh16.16 a4.23 b15.53 c36.86 d28.93 a−25.66 c
B7.36 c3.83 b24.86 a41.90 c23.00 d−24.56 b
11.76 A4.03 B20.20 A39.38 B25.97 A−25.11 A
Ah12.90 a4.55 a14.40 b42.13 b27.41 a−26.12 b
B8.13 b3.23 b21.16 a48.27 a20.98 b−24.48 a
* In the same column differences among land use (capital letters), depth (italicized letters), and land use × depth interaction (lowercase) were at p = 0.05 by Student-Newman-Keuls test.

