Article

An Ecologically Based System for Sustainable Agroforestry in Sub-Tropical and Tropical Forests

1
Co-Innovation Center for Sustainable Forestry in Southern China, Nanjing Forestry University, Longpan Road 159#, Xuanwu District, Nanjing 210037, China
2
Earth and Environmental Science, University of British Columbia (Okanagan), 3333 University Way, Kelowna, BC V1V 1V7, Canada
3
Department of Forest Resources Management, Faculty of Forestry, University of British Columbia, 2045-2424 Main Mall, Vancouver, BC V6T 1Z4, Canada
4
Forestry College, Nanjing Forestry University, Longpan Road 159#, Xuanwu District, Nanjing 210037, China
5
Faculty of Environment and Natural Resources, University of Freiburg, Tennenbacher Straße 4#, 79106 Freiburg, Germany
6
College of Information Science and Technology, Nanjing Forestry University, Longpan Road 159#, Xuanwu District, Nanjing 210037, China
*
Author to whom correspondence should be addressed.
Forests 2017, 8(4), 102; https://doi.org/10.3390/f8040102
Submission received: 7 December 2016 / Revised: 20 March 2017 / Accepted: 21 March 2017 / Published: 29 March 2017
(This article belongs to the Special Issue Management Strategies for Forest Ecosystem Services)

Abstract

:
Forests in tropical and sub-tropical countries face severe pressures due to a combination of poverty and environment degradation. To be effective, measures to protect these forests must therefore consider both economic and ecological dimensions synergistically. The purpose of this paper was to synthesize our long-term work (1994–2015) on a Ginkgo (Ginkgo biloba L.) agroforestry system and demonstrate its potential for achieving both goals, and discuss its wider application in tropical and sub-tropical countries. The performance of various ecological, economic, and social indicators was compared among five Ginkgo agroforestry systems. Two additional indicators, Harmony Degree (HD) and Development Degree (DD), were also used to show the integrated performance of these indicators. Ginkgo-Wheat-Peanut (G+W+P) and Ginkgo-Rapeseed-Peanut (G+R+P) are the best systems when compared to pure and mixed Ginkgo plantations, or pure agricultural crops. Results demonstrate that it is possible to achieve both economic development and environmental protection through implementation of sustainable agroforestry systems in sub-tropical regions.

1. Introduction

Forests play an important role in the terrestrial carbon budget [1] and provide essential ecosystem services. However, forest cover continues to decline at an alarming rate, both in quantity and quality [2]. According to the Food and Agriculture Organization of the United Nations (FAO, 2010), the world’s forests are disappearing at an average of 25 ha·min−1 [3]. Currently, forests represent a net carbon source mainly because of large-scale deforestation in the tropics [4]. Forest quality, the goods and services they provide, is also declining, largely as a result of mismanagement and, potentially, climate change impacts [5]. These problems indicate that current forest management practices are unsustainable and that alternative concepts and systems must be developed.
Root causes of forest decline include governance failure, insecure forest tenure, poverty in developing countries, and a lack of sustainable forest management regulations and practices [6]. Among these factors, the most important may be poverty. In developing countries, where most tropical and sub-tropical forests are located, people are often very poor and protection of the environment is secondary to meeting basic survival needs. This suggests that no forest management system will be successful unless ecological and economic factors are considered synergistically.
Agroforestry is a land use management system in which trees, shrubs, and crops are cultivated on the same piece of land to generate environmental, economic, and social benefits [6,7]. It has been practiced in many countries for millennia. Studies have demonstrated that agroforestry systems can significantly increase land productivity [8,9], enhance economic benefits [10], improve soil nutrients [11,12] and biodiversity [13,14], and increase employment [15,16]. These multiple benefits are realized due to positive interactions among the various species combinations and efficient resource utilization. Most studies, however, have focused on only one or a few aspects of a given agroforestry system, and little has been done to take an integrated and quantitative approach to examine a broader range of ecological, economic, and social benefits.
Ginkgo (Ginkgo biloba L.) is native to China and is an important species in Chinese agroforestry. It is planted throughout the country, but especially in the central forested plains region. In Pizhou county, Jiangsu Province, for example, the total area of Ginkgo plantation in 2016 was about 30,000 hm2. Ginkgo normally produces its first fruit at 8~10 years old, and is established at a wide spacing to achieve maximum yield. This feature provides an opportunity to intermix Ginkgo with agricultural crops. With careful management, it is possible to realize both short-term benefits from agricultural products while deriving longer-term benefits from the Ginkgo itself. Many kinds of agroforestry practices have long been applied to the Ginkgo plantations in China. This rich history and abundant research provide a good opportunity to conduct an integrated and quantitative assessment of different approaches as a guide to improved management.
Ginkgo forests are valuable economically because almost every biomass component can be processed into a high-value commodity. Traditionally, Chinese people have grown Ginkgo for medicine, fruits, and visual quality [17,18]. It can be grown in pure or mixed stands with various tree or crop species. There have been numerous long-term studies on different Ginkgo agroforestry systems [8,11,19,20,21]. For example, Cao (2007) evaluated combinations of Ginkgo, Wheat (Triticum aestivum L. 'Feng Shou No. 2'), Rapeseed (Brassica napus L.), and Soybean (Glycine mas L.) at different planting densities, and developed a conceptual model of the tradeoffs between Ginkgo and food crop values [19]. Cheng (2010) evaluated the ecological impacts on micro-climate, photosynthesis, soil fertility, nutrition, and biological productivity among seven Ginkgo agroforestry systems [8], while Tian (2012) analyzed the physiological and ecological impacts of Ginkgo-Tea agroforestry [21].
The main purpose of this study was to compare various Ginkgo agroforestry systems in terms of the integrated performance of ecological, economic, and social indicators, and demonstrate their potential in achieving poverty alleviation and environmental protection. We also discuss their wider application to other tropical and sub-tropical forest regions. First, published data from previous studies over the period 1994 to 2015 are compiled. We then apply an integrated assessment system developed by Sun (2011) [22] to compare the various agroforestry systems. Finally, the potential benefits of applying the most successful of the Ginkgo agroforestry systems to the entire Jiangsu Province, China, are forecasted. Supplemental data from other studies were included to enhance the rigor of the assessment.

2. Materials and Methods

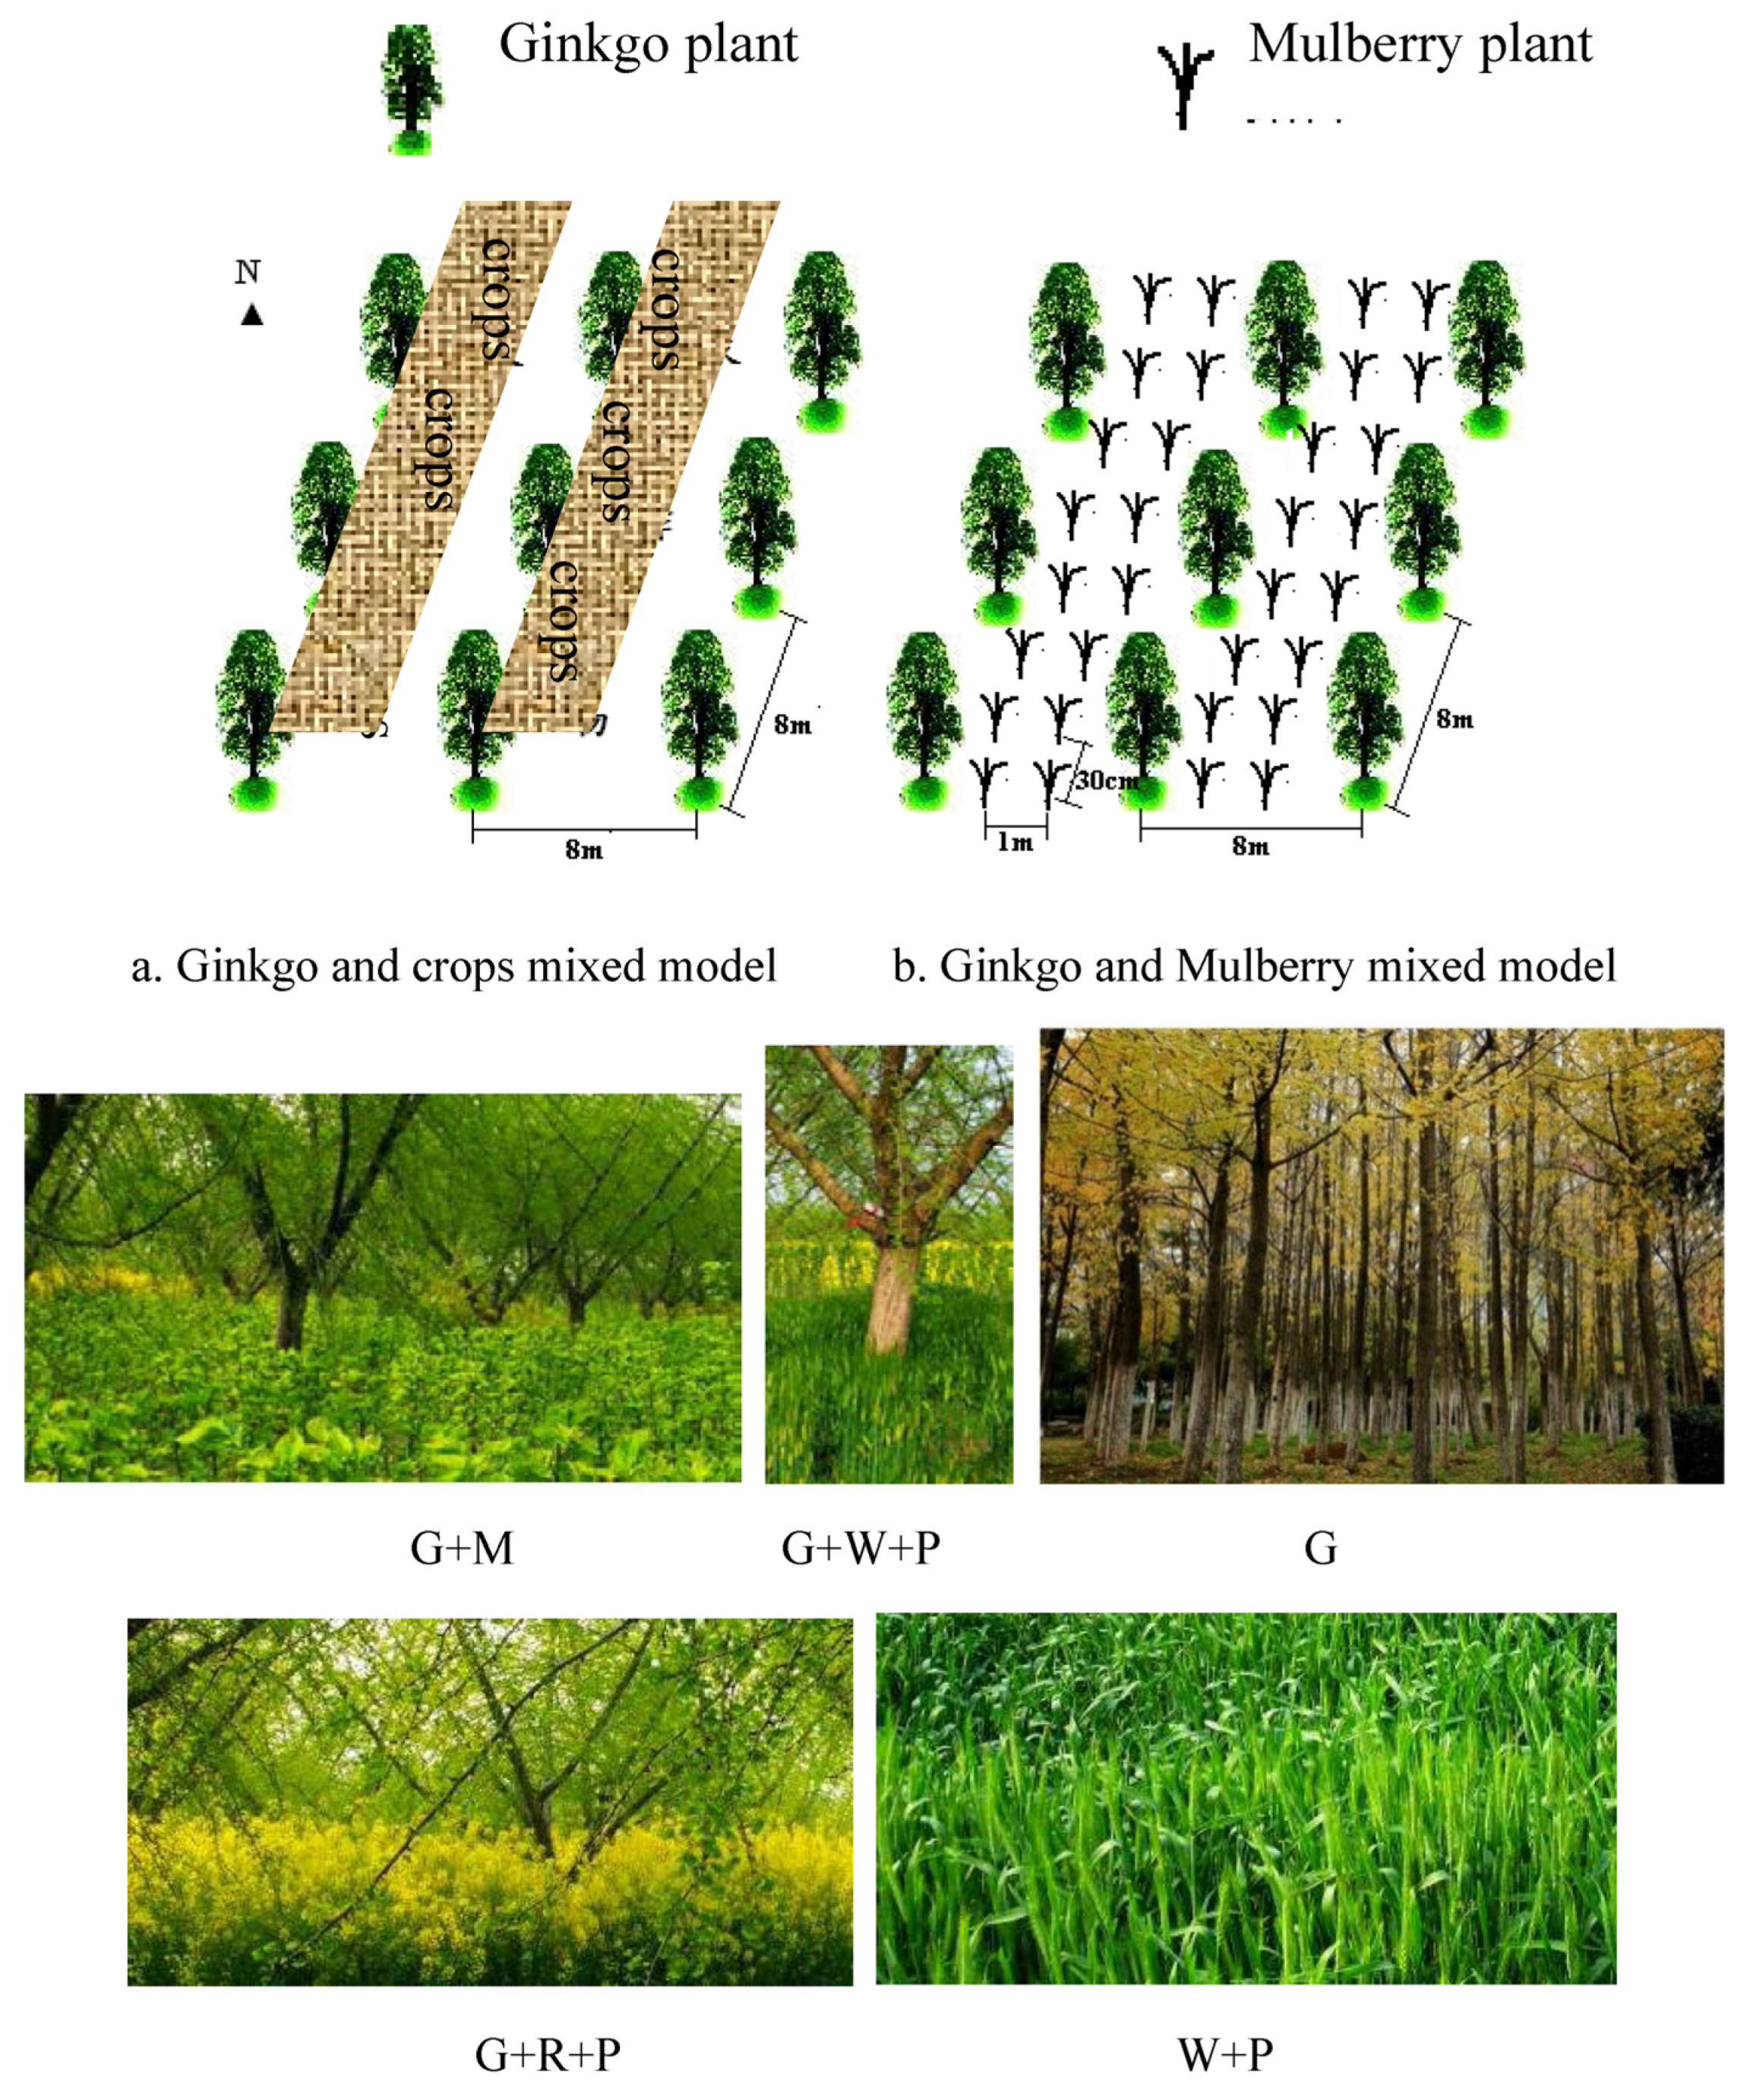
2.1. Study Area and Experimental Design

A long-term Ginkgo experimental site is located in the Taixing experimental garden, Taixing city, China (32°06′ N, 120°04′ E). The site has a continental monsoon climate with mean annual temperature of 14.9 °C, and a mean of 27.6 °C in summer and 2.0 °C in winter. The average annual rainfall is 1031.8 mm and the frost-free period is 229 days. Three traditional agroforestry systems, Ginkgo-Wheat-Peanut (G+W+P), Ginkgo-Rapeseed-Peanut (G+R+P), and Ginkgo-Mulberry (Morus alba L.) (G+M) were subject to analysis. In addition, pure Ginkgo (G) and traditional agriculture with Wheat-Peanut (W+P) rotations were included in the comparisons (Figure 1) (Cao, 2012) [14]. In the G+R+P and G+W+P systems, Ginkgo is the overstory species, with Rapeseed, Wheat, and Peanut sowed and harvested alternately, depending on the particular system. An additional benefit of peanut is its ability to fix nitrogen and thus help maintain soil productivity. The G+M model is a perennial multi-story agroforestry system with a high efficiency and high yield.
The study employed a completely randomized design of the five treatments, with three to five replicates per treatment (for a total of 20 treatment × replicate combinations). Each combination occupied a 0.5 ha site, and in 1994, each site was randomly assigned on a 10 ha grid laid out on an area of relatively uniform topography. Sites were converted from traditional farm land (comprised of the W+P combination) to Ginkgo agroforestry; in one area, the W+P rotation was retained. The Ginkgo trees were planted at a spacing of 8 m × 8 m. By 2008, the Ginkgo had diameter at breast height of 18.5–31.2 cm, a height of 5.7–7.6 m, and a 6.0–7.8 m crown width.
Mulberries were sown in 1994, at a 0.3 m × 1 m spacing. Leaves were harvested each June and aboveground growth pruned back in November. Wheat and rapeseed were sown in late October or early November at 90–100 kg·ha−1 (wheat) and 4–6 kg·ha−1 (rapeseed), respectively, and harvested in late April or early May of the following year. The land was then immediately tilled and seeded to peanuts (120–130 kg·ha−1). The peanuts were harvested in September and the cycle repeated. All systems had the same fertilization and tillage schedule. Fertilizer was applied at 375 kg·ha−1 NPK fertilizer (10:7:8) twice per year (May and November).
Data from the five experimental systems were collected every five years, starting in 2004 (2004, 2009, and 2014).

2.2. Data and Selection of Indicators

This paper used the Ginkgo Planting Expert System (GPES) [23] and a questionnaire method [22] to select suitable indicators for assessing and comparing different Ginkgo agroforestry systems. This is described, as follows.
To select potentially relevant and representative indicators, we used several criteria. First, the indicators should have a high frequency of occurrence in the scientific and resource management communities. Second, they must be related to the management goals of agroforestry systems. Third, the selected indicators should inform at least one of the three components of sustainability, environmental, economic, or social. Fourth, each indicator should be easy to measure, interpret, and record. The selection of experts is a crucial element in deciding which indicators are important for analysis because different individuals would likely have widely varying interests and priorities. Two expert teams were therefore utilized, one comprised of academic researchers and the other of management staff and practitioners from the local region. All team members were vetted to ensure they: (1) were well informed in terms of the agroforestry systems; (2) had a good understanding of sustainable agroforestry management; and (3) were knowledgeable about Ginkgo ecology for the region in which the management plots are situated. Please refer to Appendix B for more details regarding the GPES and the questionnaire form.
A list of indicators was derived using the Analytical Hierarchy Process (AHP) and Delphi method [24], which focuses on a questionnaire and its relationship to indicator selection. Indicators were required to have the following characteristics: Flexibility—applicable to all types of forests in the agroforestry practices; Feasibility—based on readily available data/or easily measurable by available techniques; Applicability—practical and not require excessive administrative workloads, and be cost-effective; and Adaptability—adaptable to prevailing social, economic, political, and environmental conditions. The questionnaire analysis included an assessment of reliability using Cronbach’s alpha internal consistency, data selection, and clustering method [22]. Table 1 shows the final list of selected indicators.

2.2.1. Ecological Indicators

Average annual air temperature reflects the ability of the forest to regulate temperature extremes. In general, more dense forest stands with larger leaf area index and multiple layers have a greater ability to buffer air temperature changes. Annual soil erosion is commonly used to indicate soil stability [11]. Agroforestry systems have the potential to significantly enhance soil quality and long-term soil productivity [25]. Fertility changes reflect the interaction of the chemical, physical, and biology components in the soil. Soil quality index [26] was chosen to indicate the general positive environmental effects of agroforestry systems. Litter decomposition rates are indirect indicators of forest productivity, while total plant productivity directly reflects the integrated effect of all site conditions [8].

2.2.2. Economic Indicators

Total income (10,000 yuan·hm−2·a−1) is the total value of both forest and agriculture products. It is calculated from yield and associated unit prices. Net income (10,000 yuan·hm−2·a−1) is the annual total income after deducting annual expenditures. The latter includes capital spending and labor costs. Capital spending costs are for pesticides, fertilizers, and seed for understory plants. Labor costs were calculated using the number of working days and an average daily salary (40 yuan·day−1).
The payback period of investment (Ic = 0.1) is calculated as follows:
t = 0 p t ( C O C I ) t ( 1 + I c ) t = 0
where, P t is the dynamic investment payback time; CO is cash outflow and CI cash inflow, in year t; and P t is the benchmark yield; the yield is set at 10%.
Net present value is one of the most important indicators for the dynamic evaluation of investment projects, and is the algebraic sum of present value that comes from net flow each year, discounted to the start of investment according to a benchmark yield or discount rate. The calculation formula is:
N P V = t = 0 n ( C O C I ) t ( 1 + I c ) t
where n is given period. In 1980, the land transfer period in Taixing was set at 50 years [27]. So far for the Ginkgo plantation, planted in 1993, the total calculation period in this study is 37 years. The remaining terms are the same as in the payback period of investment calculation.
The internal rate of return (IRR) is the discount rate when net present cash flow each year equals ‘0’ during the given period, showing future profit. The calculation formula is:
t = 0 n ( C O C I ) t ( 1 + I R R ) t = 0

2.2.3. Social Indicators

Land equivalent ratio (LER) reflects land utilization, and refers to the relative weight of demand for land value within the mixed mode and monoculture. LER is:
L E R = i = 1 n P n M n
where P is the production of the nth crop under the mixed mode, while M is the production of the nth crop under monoculture.
Opportunity of employment (see Table 1) is the amount of money available to employ a labor force. The rate of agricultural products (Table 1) is the percentage of commercialized agricultural products in relation to total production. It is an important indicator for the transformation of materials from subsistence production to an actual saleable commodity. Value of goods is defined as the value of total production minus consumptive use. Diversity is the number of different products that can be generated.

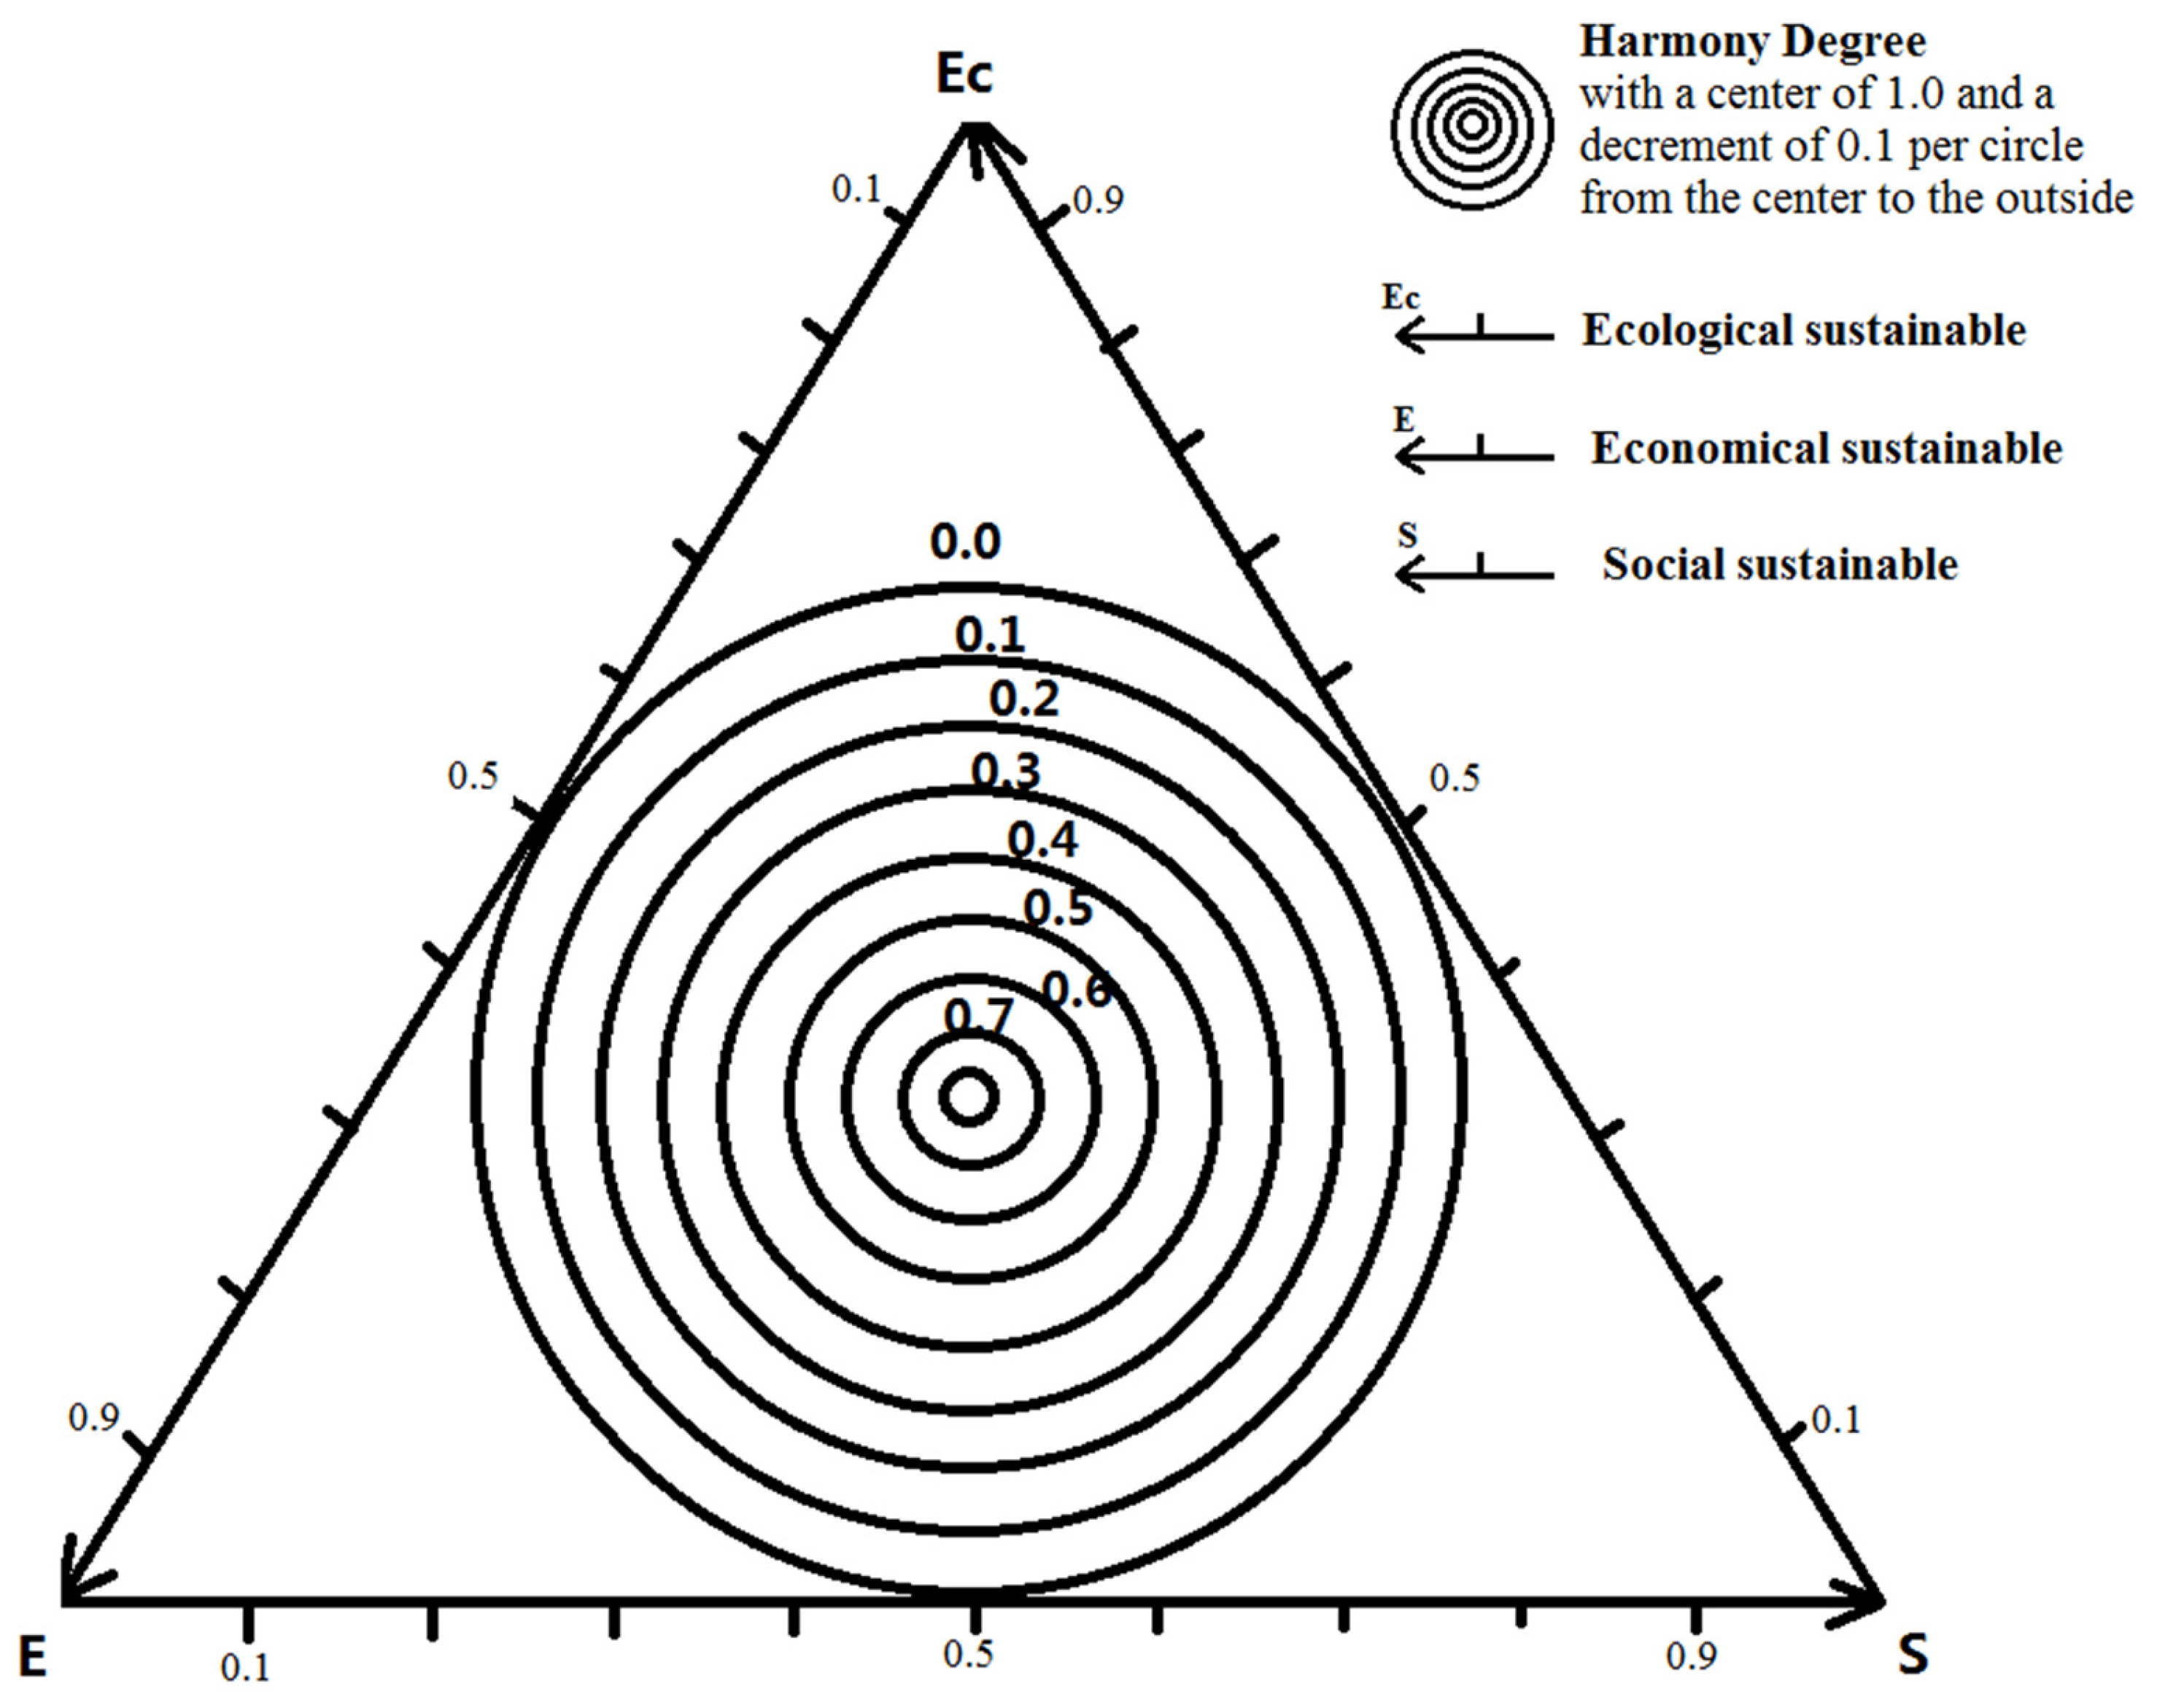
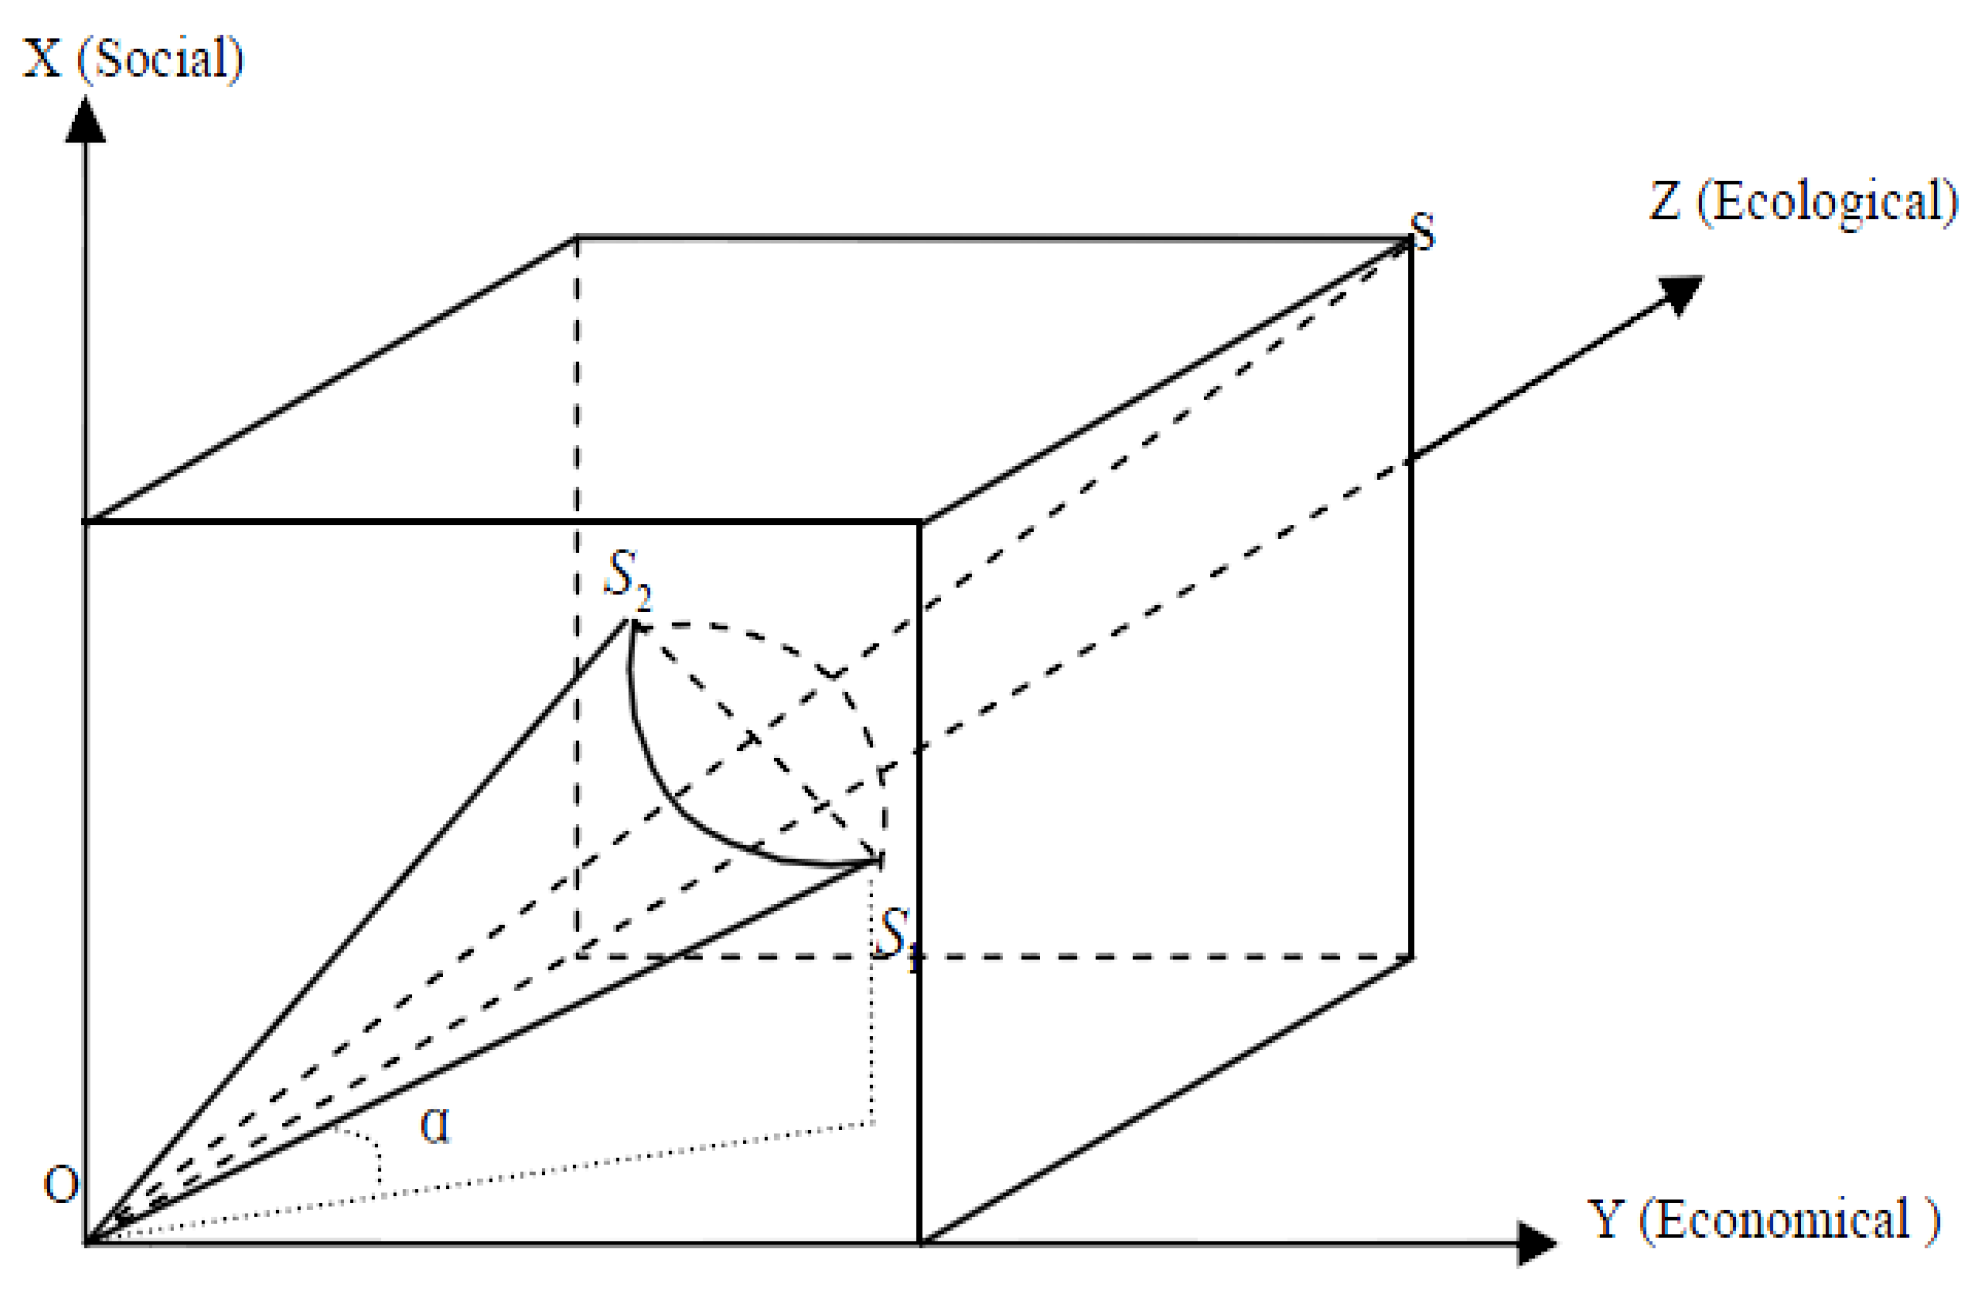
2.3. Integrated Indicators Models and Analysis

The integration (synergy) of ecological, economic, and social aspects of sustainable management can occur at the decision-making level [28] or via mechanistic modeling [29]. Haken (1971) [30] described the theory of synergy as a complex system made up of small, simple units connected to each other, and exhibiting self-organization. Phase-change within a system depends on external control parameters (environment, energy-fluxes), while the structure and the change sequence the system exhibits both depend on the synergy of the interior parameters [31]. We used two indicators, Harmony Degree (HD) and Development Degree (DD), as measures of integration among the three subsystems (ecological, economic, and social) and a means by which to assess sustainability (see Sun, 2011 [22], for further details). HD refers to the concordance and balance of each parameter in different subsystems and in each hierarchy, and is thus a measure of the synergy of a system. A synergetic evaluation of the three subsystems was conducted as follows:
Social sustainability: X = i = 1 n f ( x i ) α i , f ( x j ) is a measure of social indicators, where α i is the weight for the ith indicator, i = 1 n α i = 1 .
Economical sustainability: Y = j = 1 m f ( y j ) β j , f ( y j ) is a measure of economical indicators, where β j is the weight for the jth indicator, j = 1 m β j = 1
Ecological sustainability:
Z = t = 1 k f ( z t ) γ t
f ( z t ) is a measure of ecological indicators, where γ t is the weight for the tth indicator, k = 1 k γ t = 1
The three subsystems are given equal weights in all subsequent analyses. This reflects the fact that each is equally important for the agroforestry systems as it relates to the operational objectives for the case farm. A geometric representation of the HD as an equilateral triangle is shown in Figure 2, and the index of harmony in Table 2. Values for each subsystem are plotted on the corresponding locations along the edge of the triangle. The centroid from the resulting triangle is then found and it constitutes the HD value (see [22]).
HD represents the degree of harmony within each subsystem and how they interact to influence the system as a whole. It is, however, a static measure and does not provide insight into the degree of system development. A system with high harmony, for example, could have low development.
The degree of development (DD) is represented in a three-dimensional Cartesian coordinate system, where X, Y, Z represents the standardized values for the three subsystems at a given point in development (Figure 3). The ideal point in the space lies along the diagonal line, OS, though in most cases, the line will be oriented elsewhere in the space (OS1, or OS2, for example; Figure 3).
According to statistical data, the assessment result for subsystems should not be less than 0.2 in many cases, so a starting point is given as X = Y = Z = 0.2, then DD = 3 5 = 0.346. This point is a split point. If other points are lower than it (which means that all the subsystems are in the lowest level), then it is not necessary to consider the harmony degree among them. The index for development degree is described in Table 3.
D D = X 2 + Y 2 + Z 2

3. Results

For illustrative purposes, the 2009 results are presented in the majority of the main text. In order to clarify the background datasets of the whole research, the full data set (2004, 2009, and 2015) is provided in Appendix A and the elaboration of the experts team and questionnaire form are in Appendix B.

3.1. Ecological Indictors

The overall performance of the mixed Ginkgo systems was higher than pure Ginkgo (G) or the cropping system (W+P; Table 4). The cropping system had the lowest values for air temperature, and the highest soil erosion indicator and litter decomposition rate; its total productivity was ranked in the middle of the five systems. The G+M system had the lowest productivity and soil fertility values, and was second highest in the soil erosion indicator. Among three mixed systems, the G+W+P achieved the best overall performance (weighted total), followed by G+R+P, and then G+M.

3.2. Economic Indicators

The mixed Ginkgo-crop systems, G+R+P and G+W+P, had higher total income, net income, and NPV values compared with the other systems (Table 5). The G system had the lowest performance of all economic indicators. Although the copping system (W+P) had the best performance on the payback period of investment, its economic revenues were lower than those of the mixed Ginkgo systems. G+W+P performed better than G+R+P (though not always by much), while the latter outperformed G+M.

3.3. Social Indicators

With the social indicators, the mixed systems had better performance on four indicators (LER, opportunities of employment, value of goods, and variety of products) than those from the pure forestry (G) and cropping (W+P) systems (Table 6). The G and G+M systems had the highest ranking for agricultural products. The G+W+P and G+R+P were better overall than the G+M system.

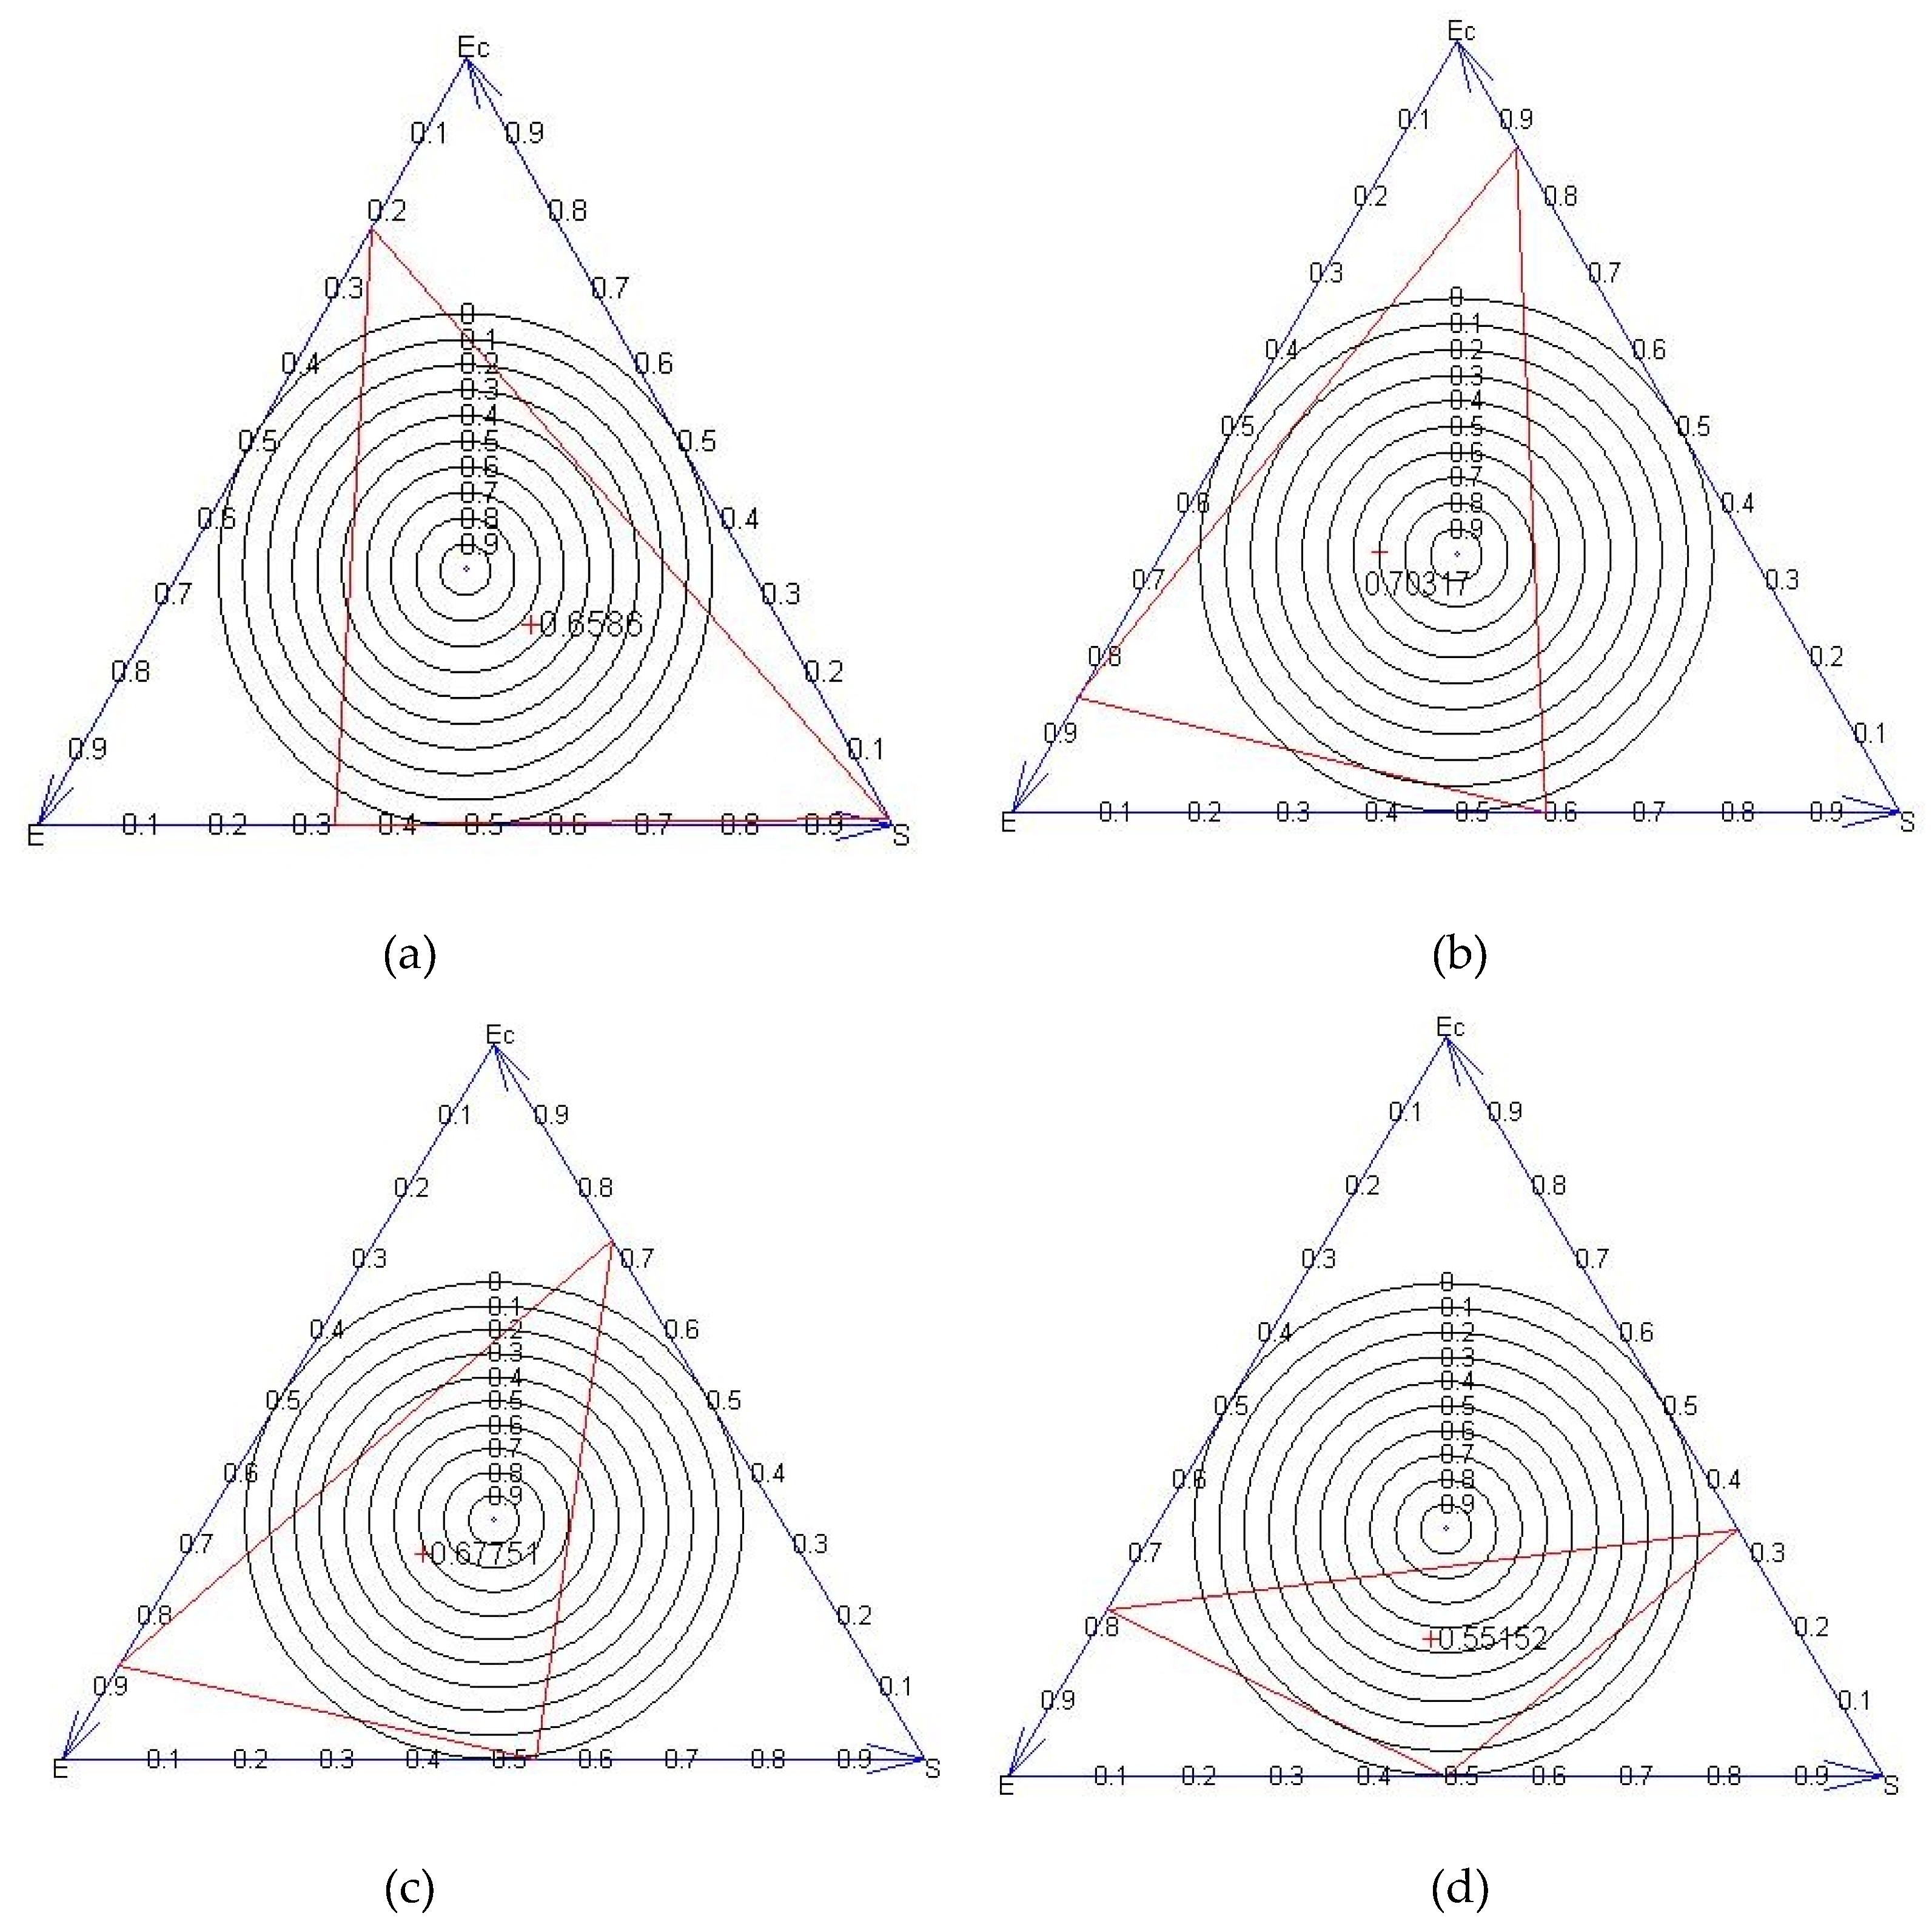
3.4. Integrated Indicators

The G+W+P system had the highest HD values, followed closely by the G+R+P system (Figure 4). The monoculture systems (G and W+P) had the lowest DD values (0.41 and 0.80, respectively). G+W+P had the highest DD value (1.35), followed by G+R+P (1.26) and G+M (0.98).

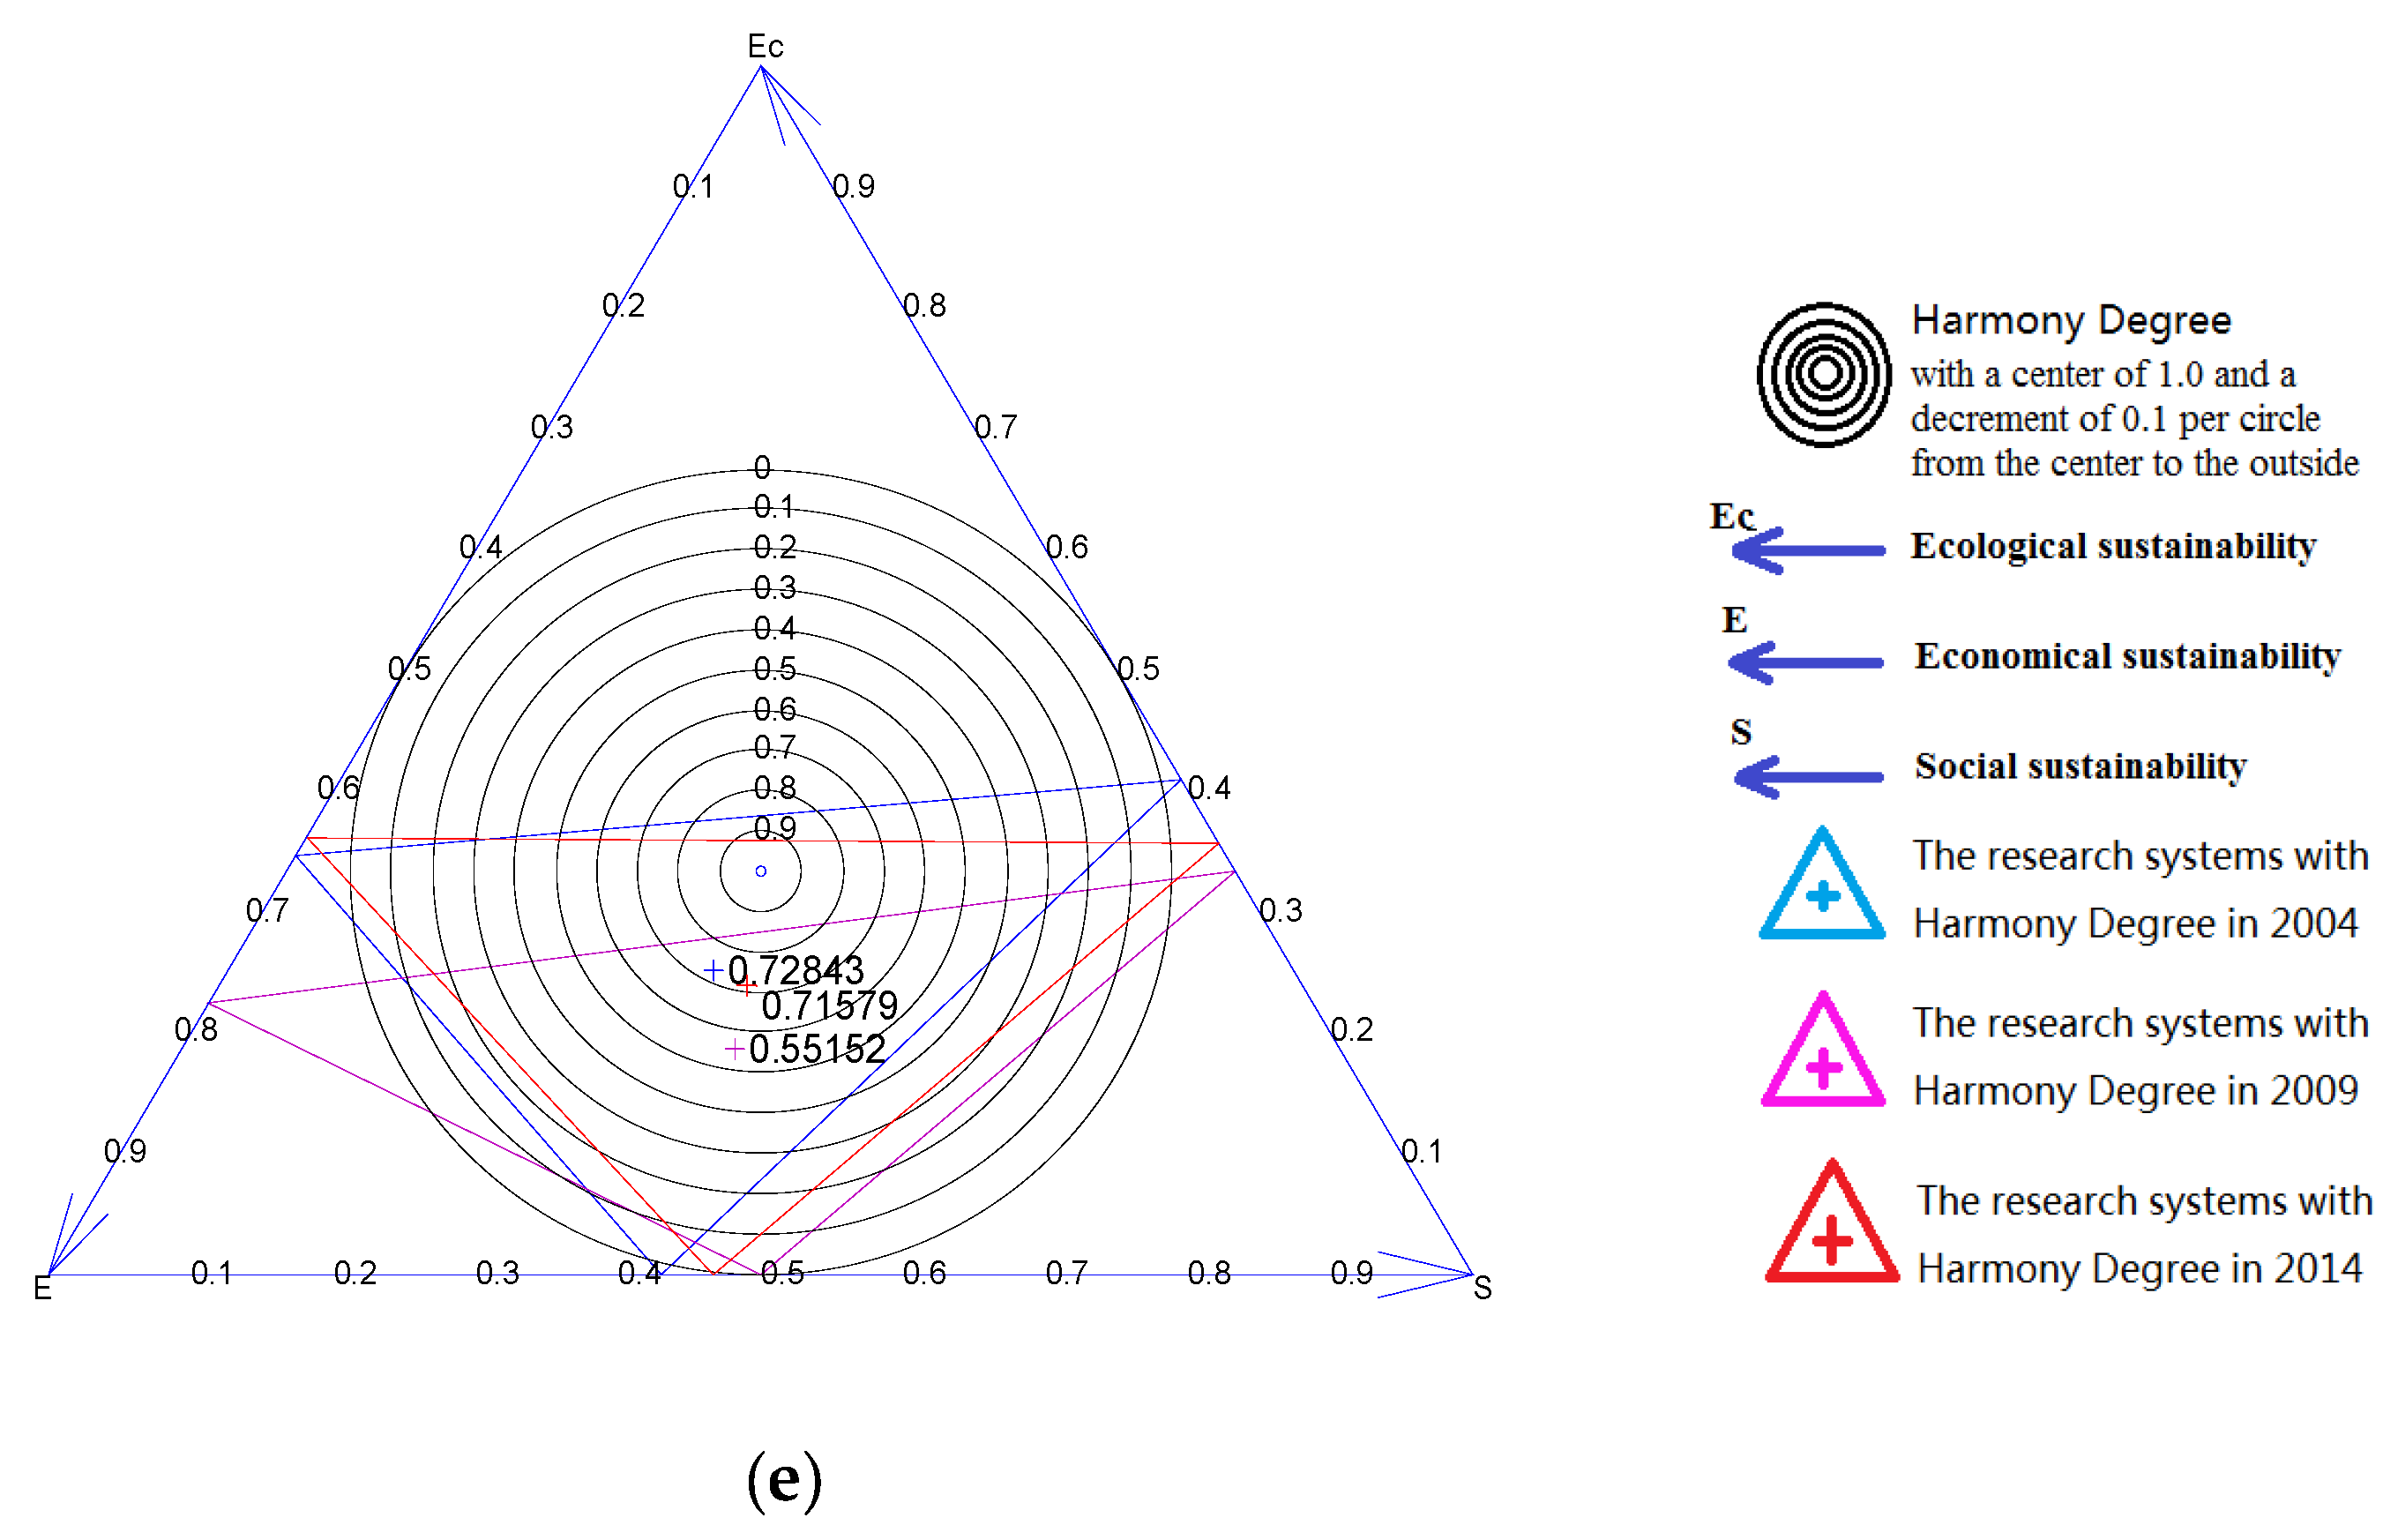
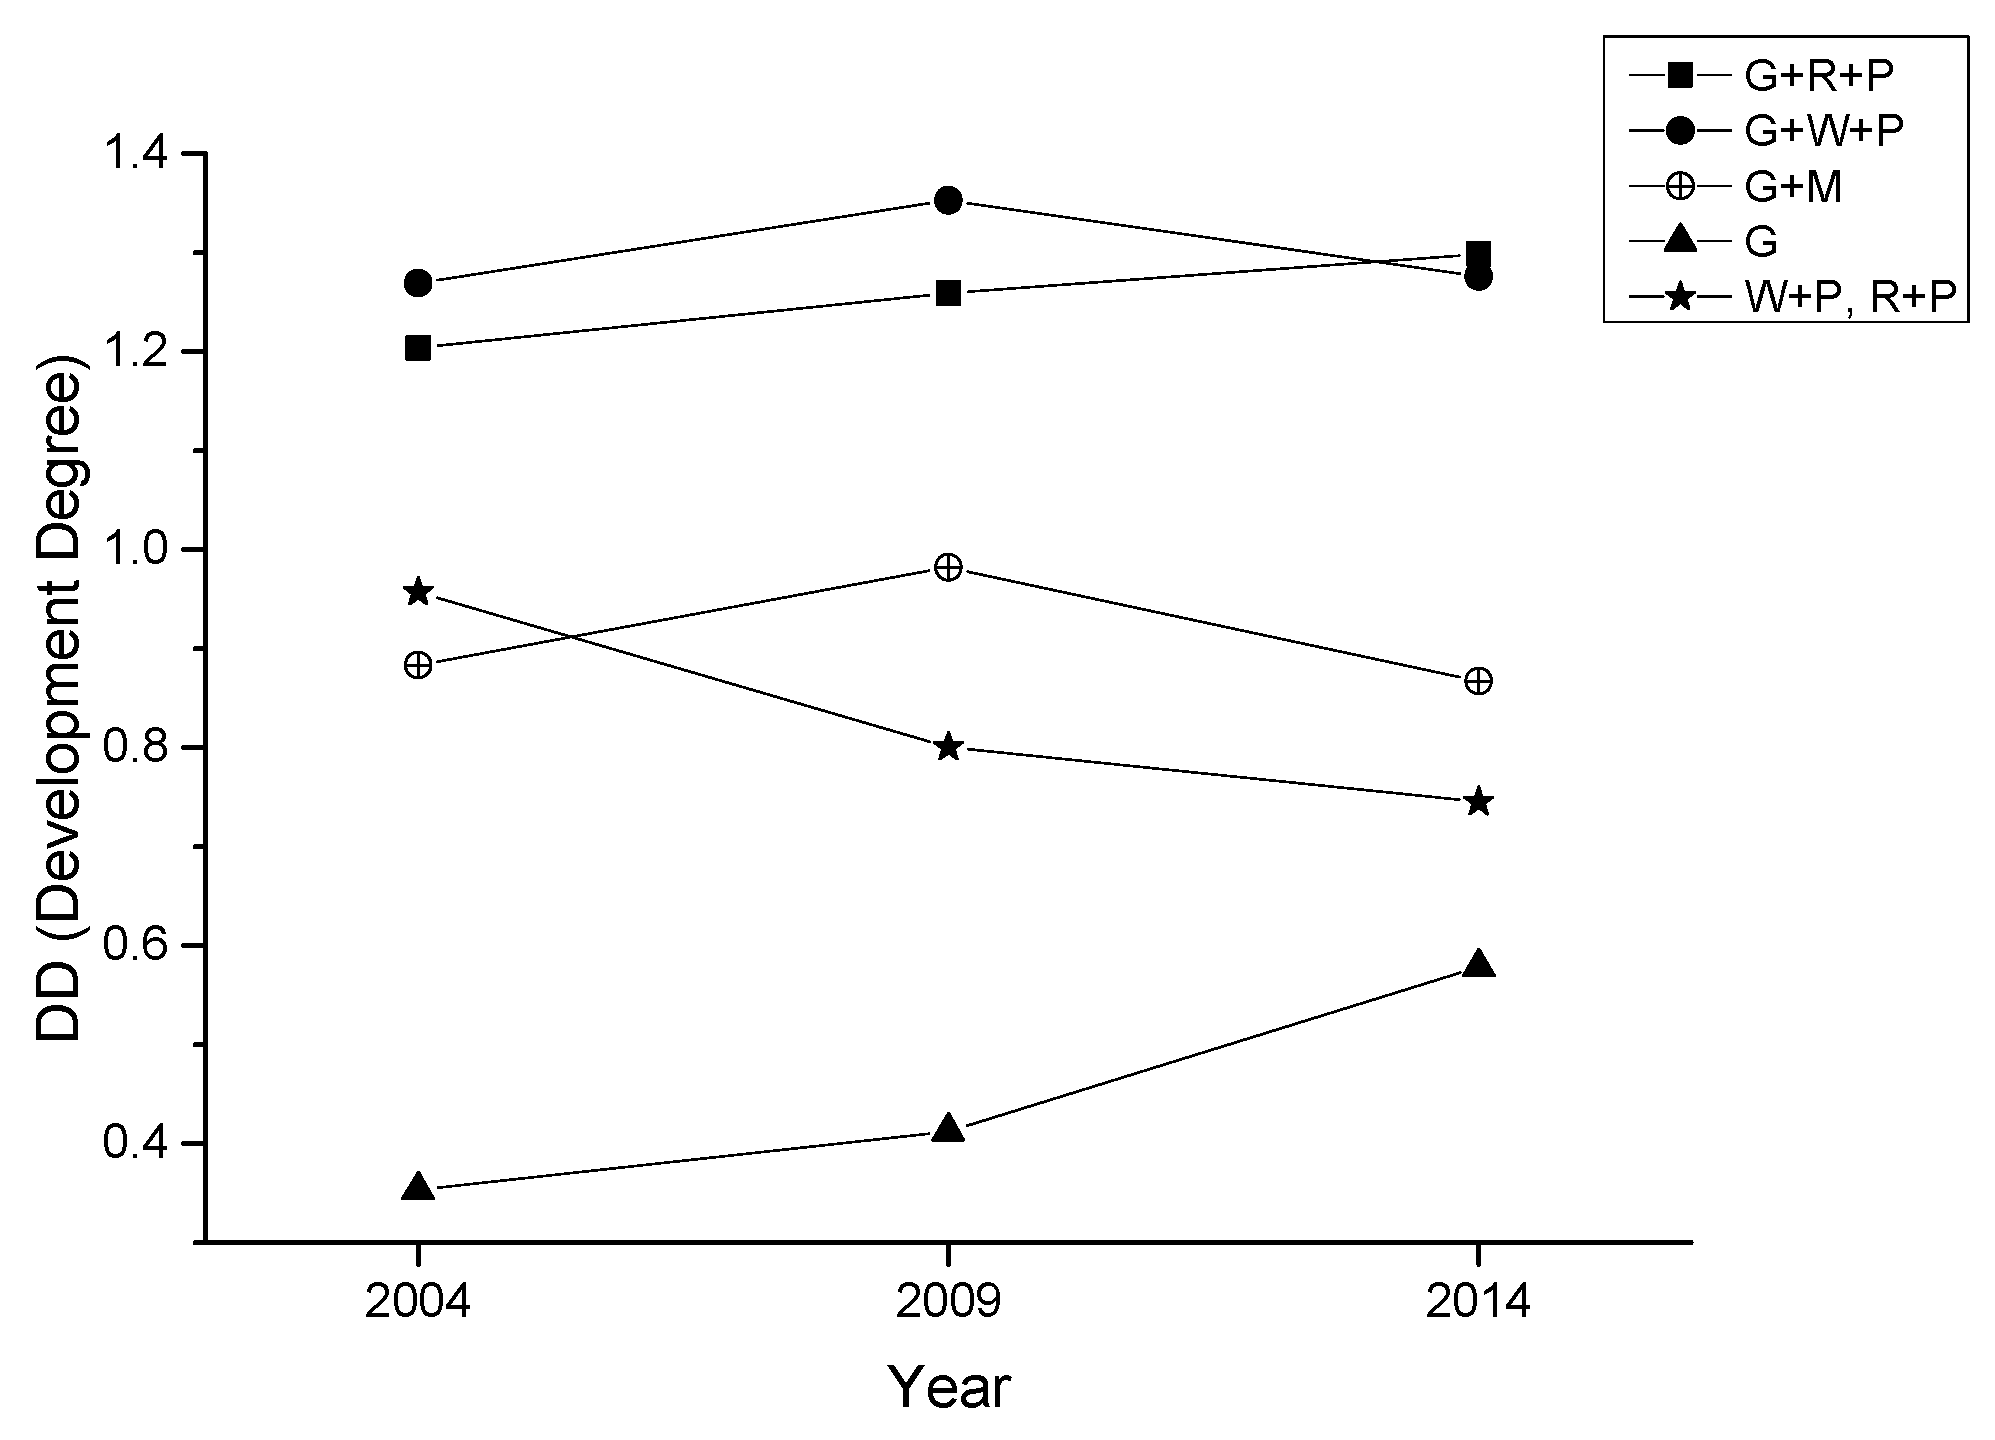
3.5. Indicator Change Over Time

Table 7 shows the changes in HD for the five systems over three periods, 2004, 2009, and 2014, while Figure 5 shows the corresponding changes in DD. The mixed systems (G+R+P and G+W+P) had the highest HD and DD values. In contrast, the G system received the lowest DD and had declining HD values over the three periods. The cropping system (W+P) had suitable HD values, but its DD values were lower than those from the mixed systems, G+R+P and G+W+P, along with a declining trend over time. The G+M system had lower and variable HD and DD values, as compared to those from the two other mixed agroforestry systems.

4. Discussion

4.1. Comparisons of Indicators in the Ginkgo Agroforestry Systems

Results indicate that the mixed Ginkgo agroforestry systems, G+R+P and G+W+P, generated the highest overall benefit. Intermixing trees and understory vegetation adds to structural diversity, increased leaf area and, consequently, enhanced total production and associated economic-social benefits. In addition, soil erosion control, buffering of microclimate changes, and nutrient cycling are all better in the agroforestry systems, as compared to the monoculture systems. There is evidence that total soil carbon and soil organic carbon can also be augmented in Ginkgo agroforestry systems [9,12,14]. Furthermore, the mixed systems appear to better integrate ecological, economic, and social elements, as reflected in their high harmony and degree of development (HD and DD, respectively). Agroforestry systems are also generally recognized as having increased biodiversity [6,13,14].
The monoculture systems (G and W+P) had the lowest overall performance, though they received relatively high values in a few indicators. The ecological problems associated with monoculture forestry systems are well documented, and include low biodiversity, long-term yield decline, disease susceptibility, insect outbreaks, and reduced soil function [32,33,34,35,36]. Agricultural cropping systems normally have the quickest economic return, but other economic values as well as social values, are relatively low. Hence, they often require government subsidies to remain viable. This may be one reason why China has implemented a program to return some agriculture lands to forests [37].
The mixed G+M system had the lowest soil erosion, but its economic and social benefits require a relatively longer time to be realized. Its HD and DD values were therefore relatively low. Consequently, this system may have limited appeal in developing countries.

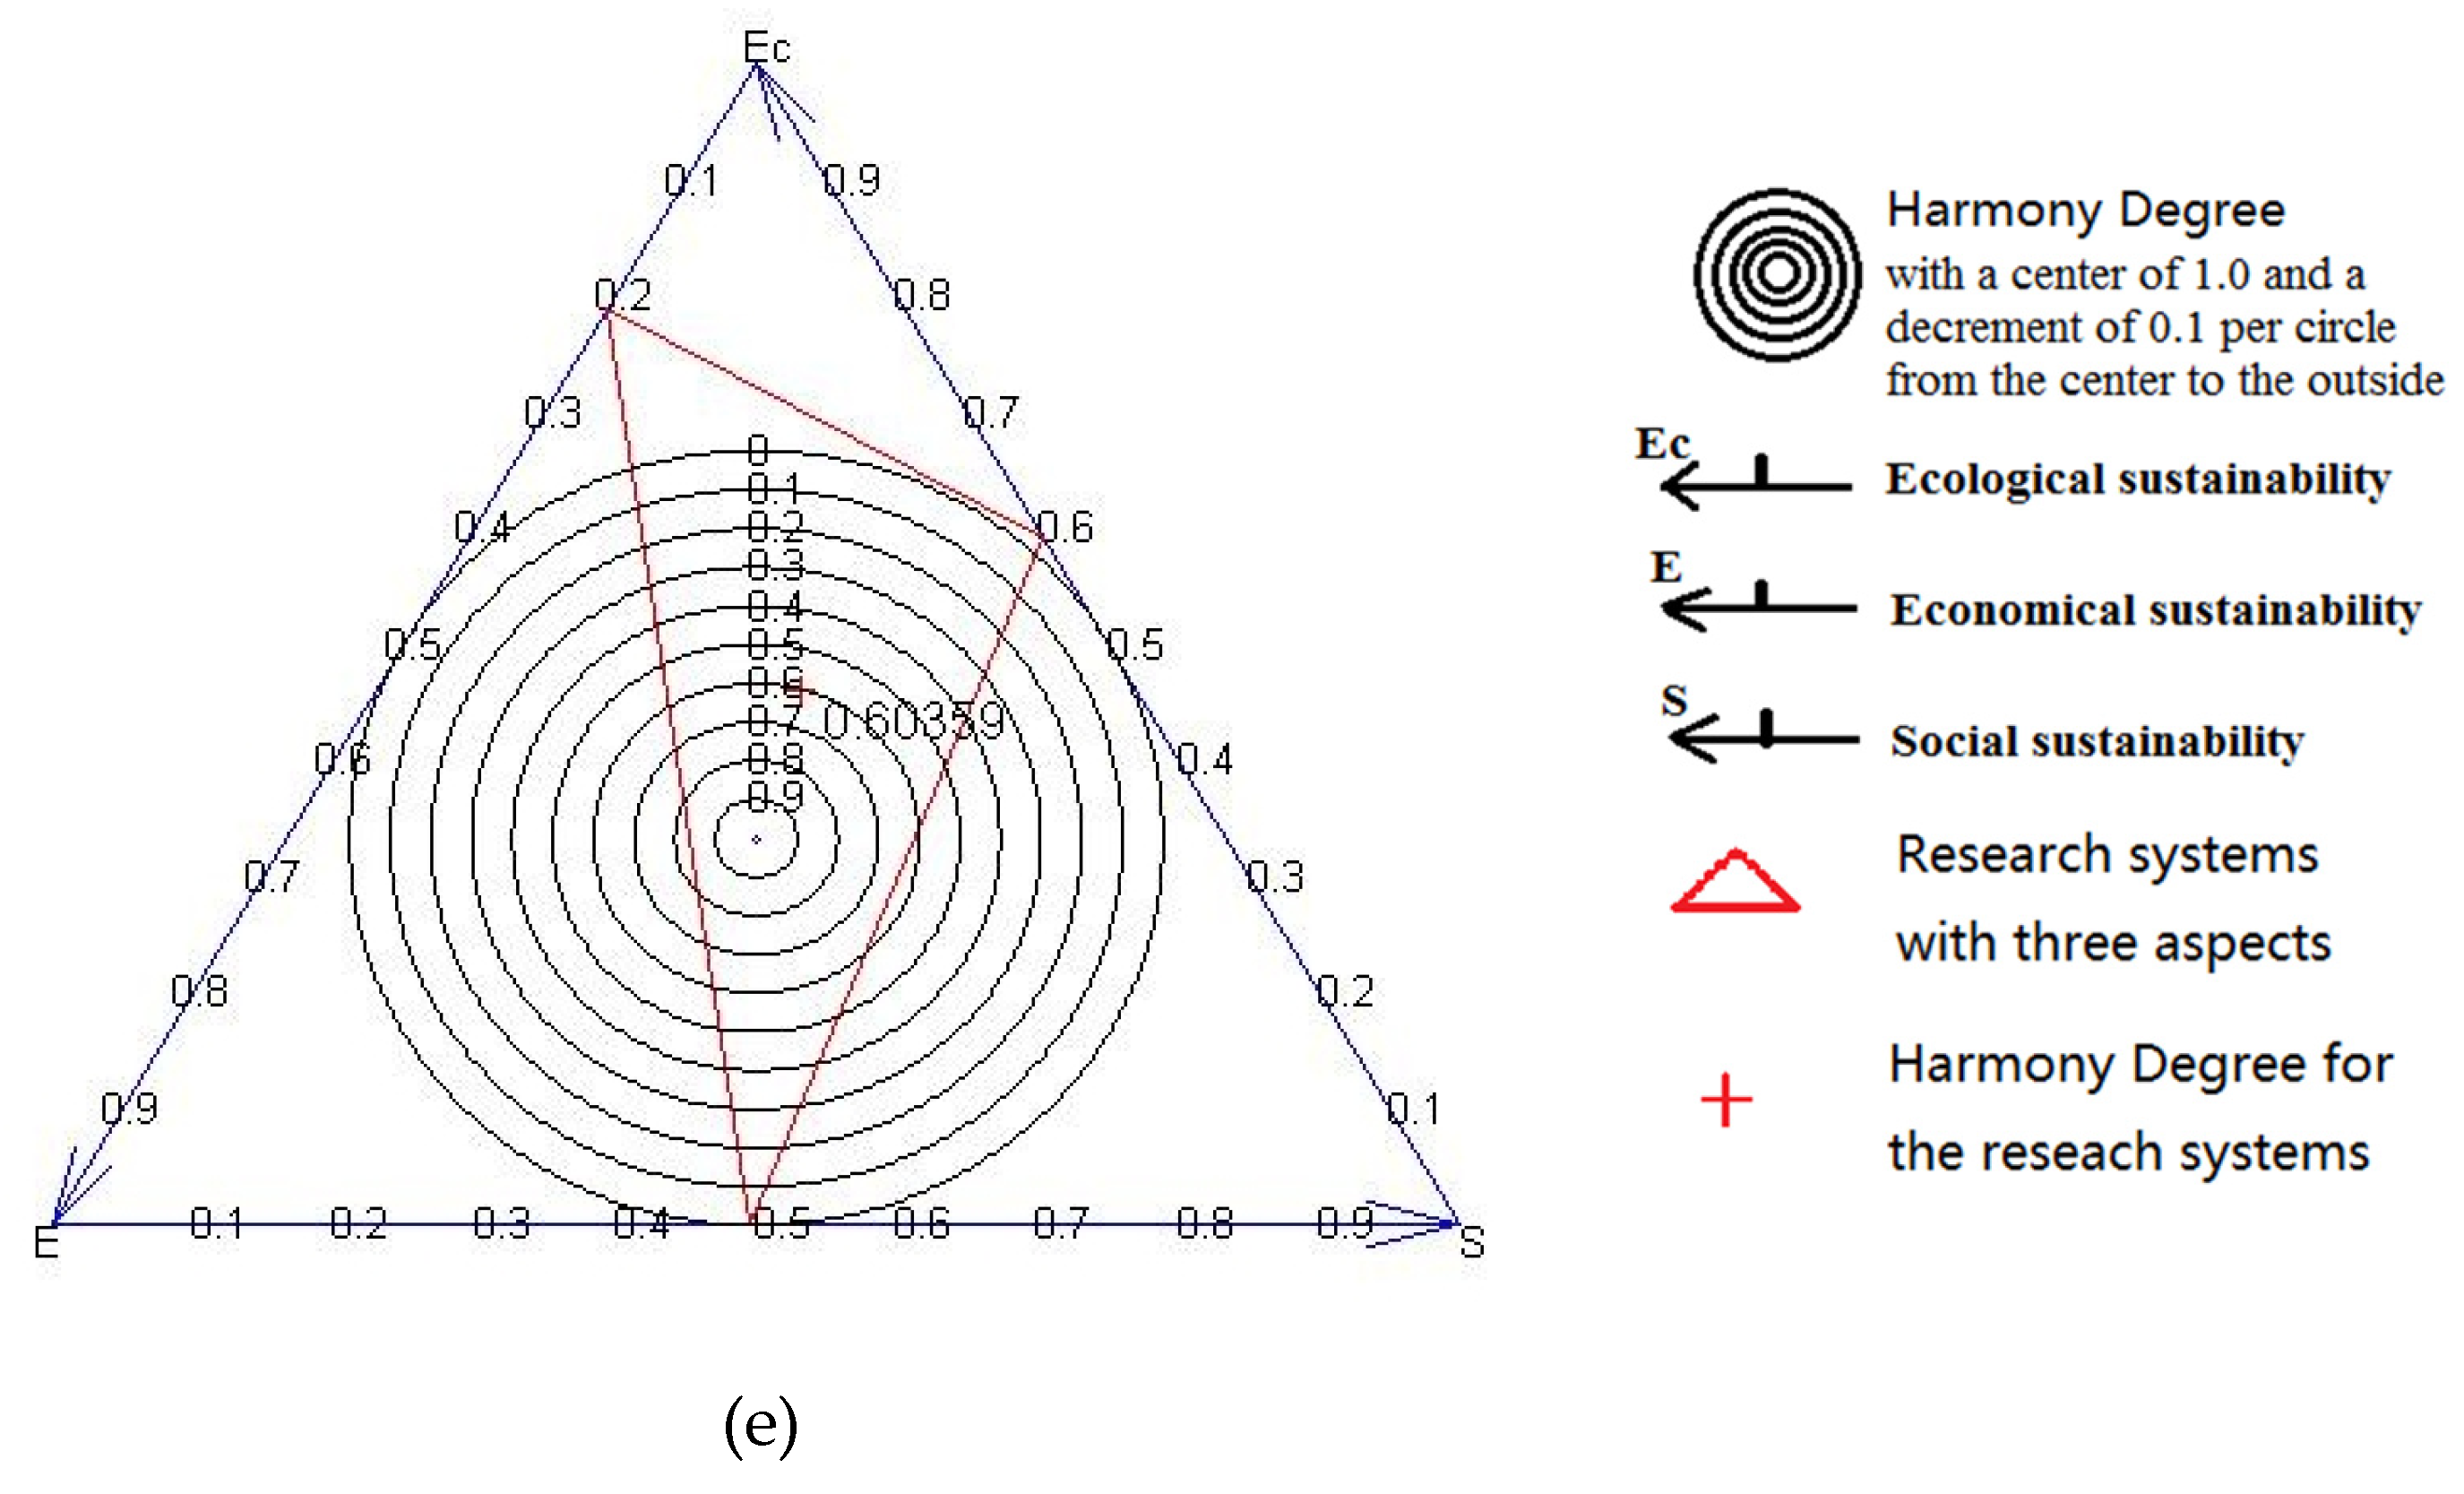
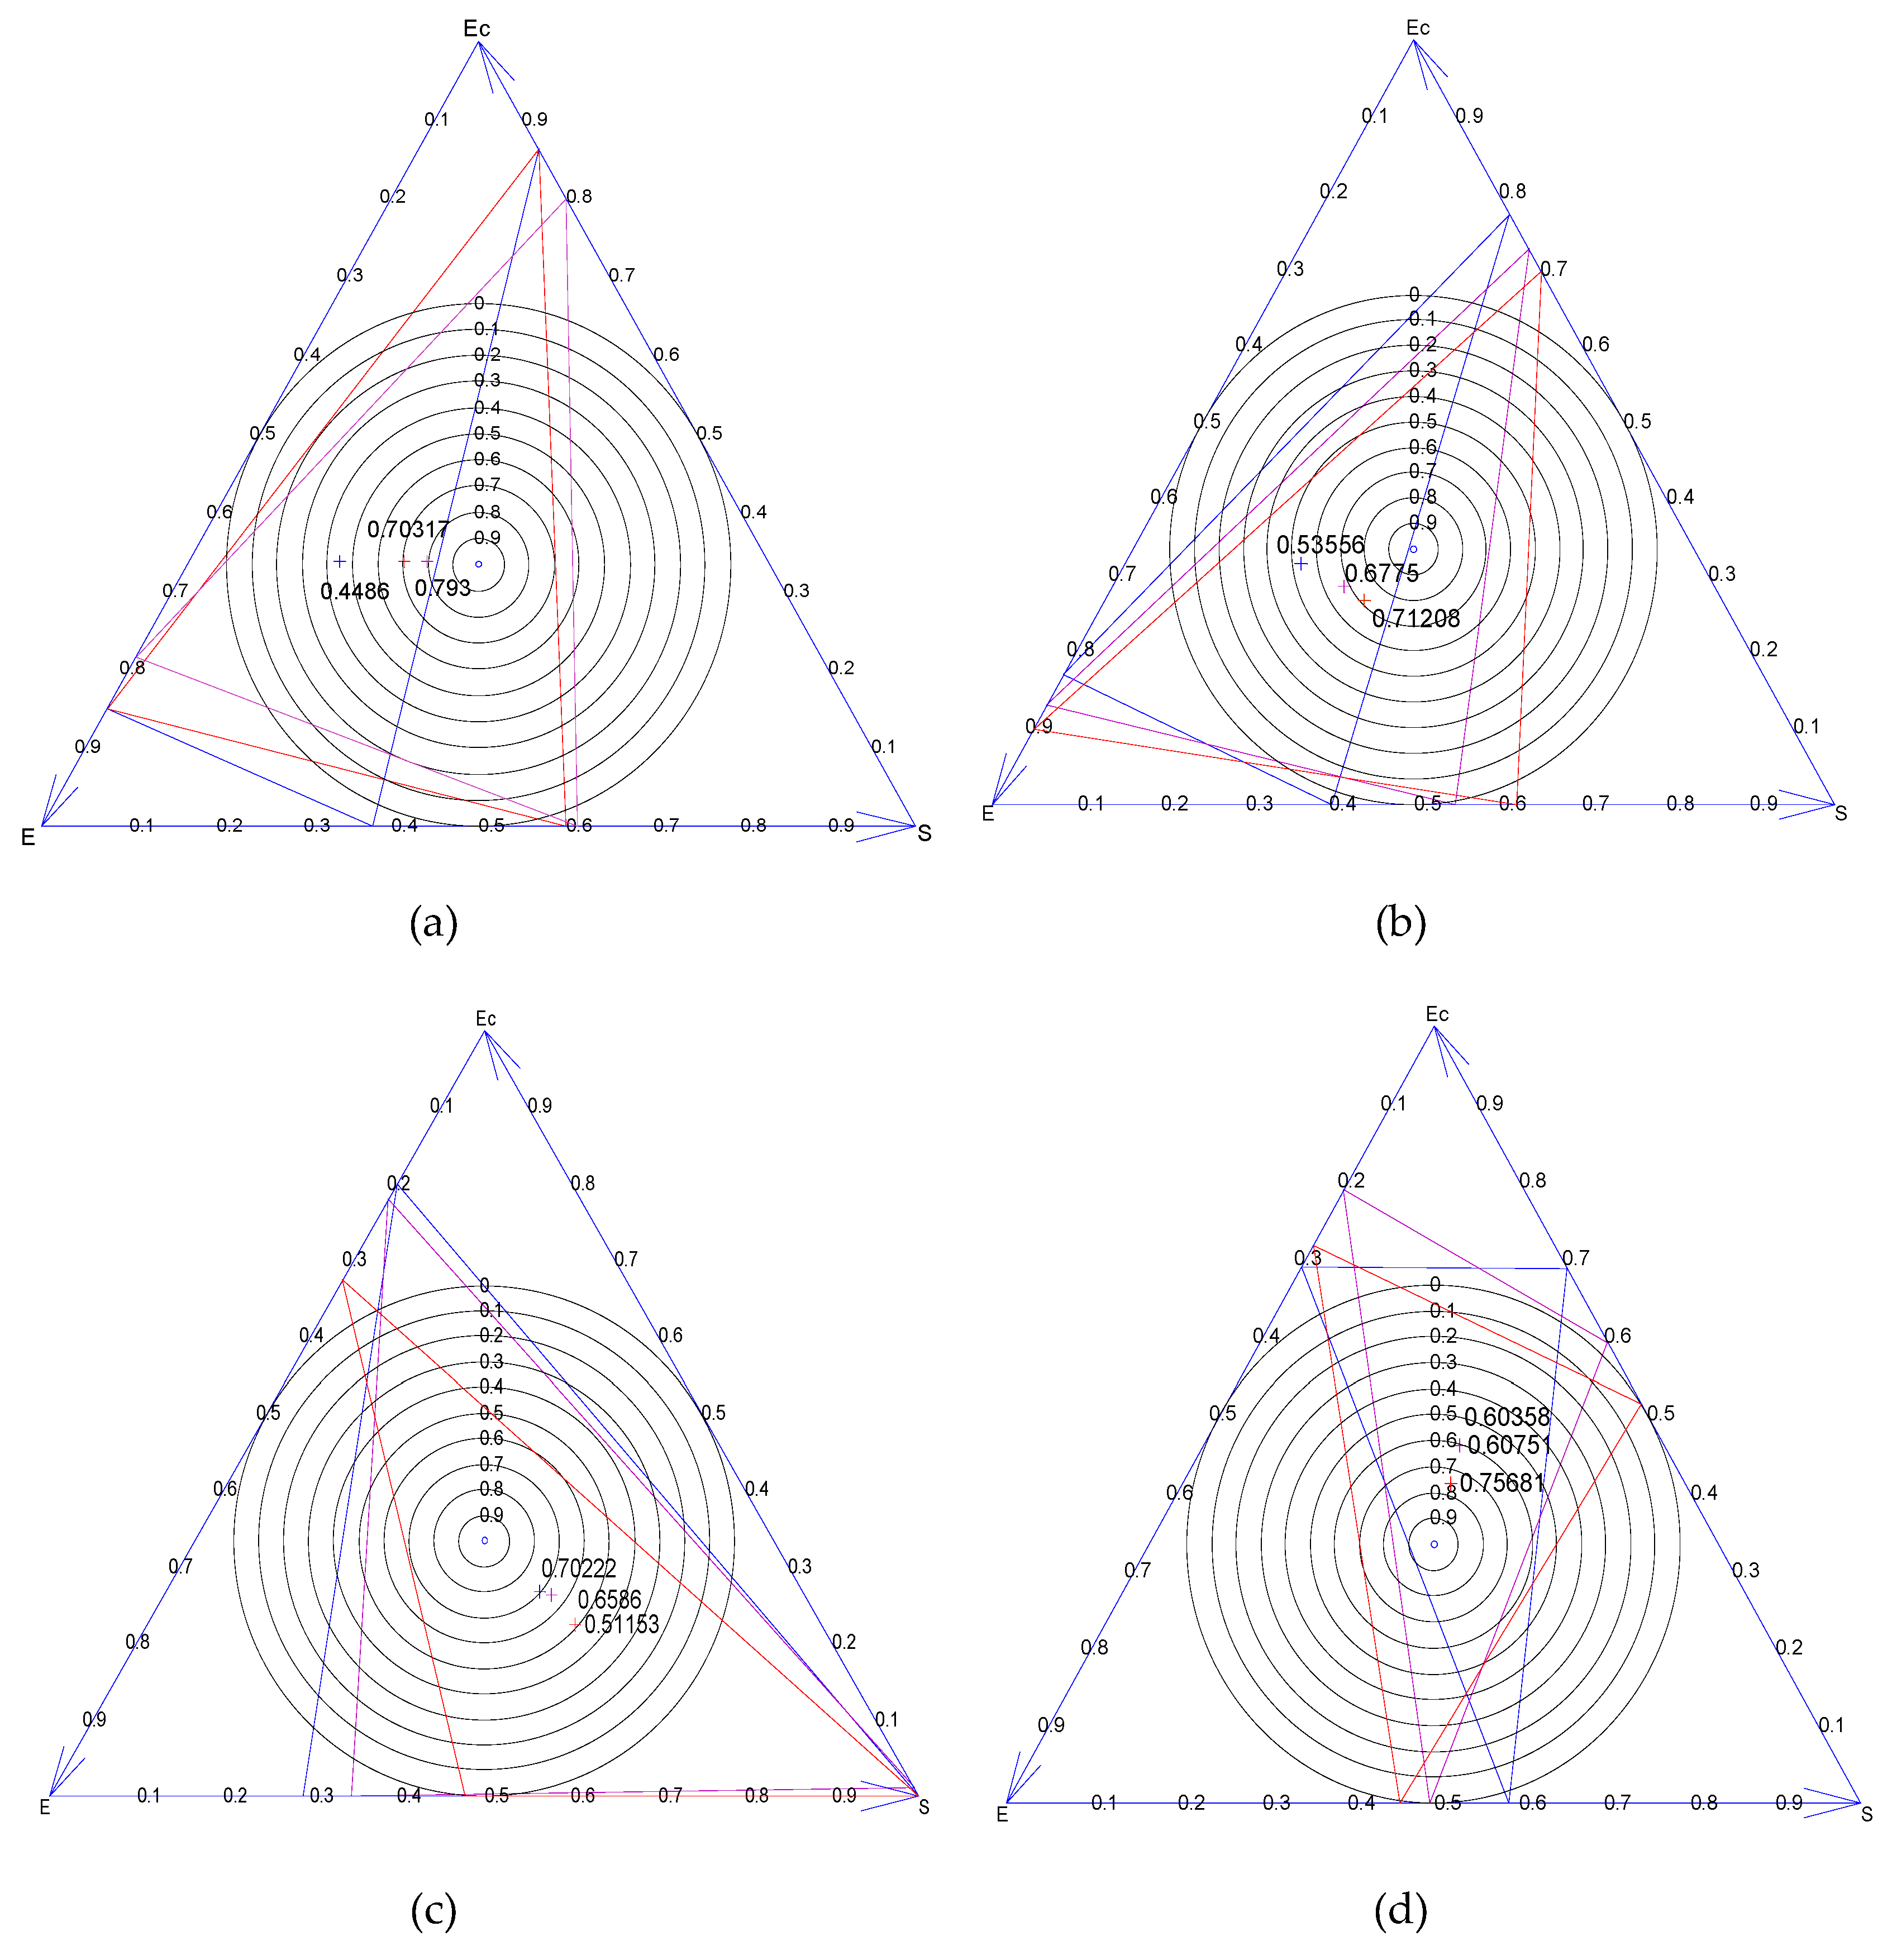
4.2. Application of HD and DD for Integrated Assessment

China has a national policy to promote economic development while protecting the ecological environment [38]. To help achieve this goal, efforts have been oriented towards a means of transitioning from traditional methods of resource consumption to a sustainable development model [38,39]. In that regard, the Harmony Degree (HD) reflects the balance between the three systems, such that HD for the agroforestry systems, G+R+P and G+W+P, increased progressively, while that for the pure forest system declined. The cropping systems showed fluctuations in HD and a decline in DD. Thus, these two integrated indicators provide a useful and important means of assessing whether a given management system is sustainable.
Yuan [22] applied the same type of analysis to a pure plantation forest farm in South China [22], though only for a single stand age. Here, we have the benefit of multiple measurements from different systems and at different ages. This is important because, as Figure 6 indicates, HD can vary by age and planting system. In the agroforestry systems, G+W+P and G+R+P (Figure 6a,b, respectively), HD moved progressively towards the center of the concentric circles, indicating increasing order over time (see Table 2). In pure Ginkgo (Figure 6c), however, HD moved in the opposite direction, indicating a trend towards increasing disorder.
The cropping system tended to have a higher economic but lower ecological score (cf. Table 4 and Table 5). It had a relatively higher HD but the DD for this system tended to decline over time (Figure 6d). Trends in HD for the G+M system fluctuated among the three ages (Figure 6e). The HD and DD indicators are useful in assessing whether a given management system can be considered sustainable but are particularly informative when calculated in a temporal sequence. In that respect, converting monoculture practices (either pure Ginkgo or cropping) into agroforestry improves economic returns while balancing ecological considerations.

4.3. The Importance of Utilizing Ginkgo Agroforestry System

What are the potential benefits of converting all monoculture Ginkgo forests in Jiangsu province to the best Ginkgo agroforestry system (G+W+P)? According to provincial forestry inventory data [28], there are currently 61,482 ha of Ginkgo monoculture forests in Jiangsu province [40]. Converting all of these forests to G+W+P would increase the annual net income by 23,200 Yuan·ha−1, for an annual net income increase of 1426.4 million Yuan. Benefits would vary widely across the province, however, depending on the ratio of monoculture to mixed plantations. For example, the ratio is 214:1 in the vicinity of Suzhou city and 34:1 near Nanjing city. Around Taizhou city (where our study was located), the ratio is 23:1. If monoculture forests were converted to the G+M system, annual revenue per hectare could increase by 38%, but could be doubled under the G+W+P system. In addition, complete conversion to G+W+P would enhance ecological benefits; for example, a reduction in soil erosion from 46.1 to 9.74 t·m−2·a−1.
If suitable agroforestry systems can be identified and implemented, it is possible to enhance economic and social benefits, while protecting environmental values. Besides Ginkgo, other systems could be evaluated with the approach used here. It is encouraging that in many developing countries and regions, there is typically a broad range of potential combinations of tree species and agricultural crops available for testing. Our study also demonstrates the utility of applying various and integrated indicators to assess and compare performance among different systems. Selecting which indicators to include in the analysis is challenging, however, and should be considered as an incremental process informed by accumulated research and knowledge. Our indicators were derived using the Analytical Hierarchy Process (AHP) and Delphi method [24], which largely reflected what was best known at the time the work was undertaken. Other representative indicators (e.g., floral and faunal biodiversity) should be considered if/when relevant data are available.

5. Conclusions

A series of ecological, economic, and social indicators, along with two integrative indicators, Harmony Degree (HD) and Development Degree (DD), were used to evaluate three Ginkgo-based agroforestry systems, Ginkgo alone, and an agricultural cropping system. We conclude that, (i) the Ginkgo agroforestry systems performed better overall than either of the monoculture systems, (ii) the benefits of agroforestry are robust across a range of indicators and showed further improvement over time, and (iii) agroforestry systems can be developed that balance environmental protection with economic and social objectives.

Acknowledgments

The authors acknowledge the financial support of the Priority Academic Programmer Development of Jiangsu Higher Education Institutions (PAPD) in Nanjing Forestry University, and the specialized research fund for doctoral programs in China (20133204130001), a general financial grant from the China Postdoctoral Science Foundation (2016M601822). The authors are grateful to all the research members in the Ginkgo research team for their long-term data collection.

Author Contributions

Fuliang Cao designed the experiments and led the research team; Yuan Sun conducted the assessment and analysis; Chen Lei provided support on the experiments and data processing; Xiaohua Wei provided input on manuscript layout and writing; Clive Welham assisted in concept development and writing; Dieter R. Pelz offered valuable ideas and suggestions for developing the research concepts; Qing Yang and Liu Huiqian assisted with data analysis.

Conflicts of Interest

The authors declare no conflict of interest. The founding sponsors had no role in the design of the study; in the collection, analyses, or interpretation of data; in the writing of the manuscript; nor in the decision to publish the results.

Appendix A

Table A1. Ecological indicator values from three mixed Ginkgo systems, pure Ginkgo (G), and a cropping system (W+P), in 2004.
2004G+R+PG+W+PG+MGW+P
The annual average temperature (°C)21.5221.6220.907521.3821.8175
Normalized value0.4930.4850.5480.5060.467
Annual soil erosion (t·hm−2·a−1)36.3235.5115.7438.6542.14
Normalized value0.2200.25110.1320
Soil fertility quality index (FI)0.3950.4070.560.320.474
Total plant productivity (kg·hm−2·a−1)2410523974106941786209367
Normalized value0.1080.1070.04301
Litter decomposition rate58.6755.7443.2552.8662.59
Normalized value0.7970.64600.4971
Weighted total0.400.380.4380.2980.59
Table A2. Economic indicator values from three mixed Ginkgo systems, pure Ginkgo (G), and a cropping system (W+P), in 2004.
2004G+R+PG+W+PG+MGW+P
Income (Thousand Yuan·hm−2·a−1)4.885.723.572.583.47
Normalized value0.73210.31600.283
Net income (Thousand Yuan·hm−2·a−1)2.042.211.720.391.07
Normalized value0.90710.729700.3717
The payback period of investment (Ic = 0.1)4.354.1917.672>370
Normalized value0.8820.8870.52201
NPV (Ic = 0.1)12.8314.013.69−3.2510.36
Normalized value0.93110.40200.788
IRR0.440.470.140.064>1
Normalized value0.4060.4290.07601
Weighted total0.730.860.320.010.59
Table A3. Social indicator values from three mixed Ginkgo systems, pure Ginkgo (G), and a cropping system (W+P), in 2004.
2004G+R+PG+W+PG+MGW+P
LER1.081.11.0311
Normalized value11.250.37500
Opportunities of employment (10 thousand Yuan·a−1)0.280.280.220.10.2
Normalized value110.66700.556
The rate of agricultural products0.790.72110.7542
Normalized value0.250110.1221
Value of goods commodity value (10 thousand Yuan)2.042.2091.7170.3931.067
Normalized value0.90710.72900.371
Variety of products33212
Normalized value110.500.5
Weighted total0.830.850.650.20.31
Table A4. Ecological indicator values from three mixed Ginkgo systems, pure Ginkgo (G), and a cropping system (W+P), in 2014.
2014G+R+PG+W+PG+MGW+P
The annual average temperature (°C)21.7121.6721.7922.3623.48
Normalized value0.5480.5530.5410.4840.374
Annual soil erosion t·hm−2·a−1)9.749.682.4510.8846.1
Normalized value0.8330.834310.8070
Soil fertility quality index (FI)0.6150.570.6090.5410.43
Total plant productivity (kg·hm−2·a−1)3300635612167841264724041
Normalized value0.88710.18000.496
Litter decomposition rate45.6942.8740.5452.8662.59
Normalized value0.2340.10700.5591
Weighted total0.620.610.470.480.46
Table A5. Economic indicator values from three mixed Ginkgo systems, pure Ginkgo (G), and a cropping system (W+P), in 2014.
2014G+R+PG+W+PG+MGW+P
Income (Thousand Yuan·hm−2·a−1)5.4315.7214.4433.068853.346
Normalized value0.89110.518100.105
Net income (Thousand Yuan·hm−2·a−1)4.0985.0963.74162.871.813
Normalized value0.3740.6780.2650−0.322
The payback period of investment (Ic = 0.1)4.3464.1917.672>370
Normalized value0.8830.8870.52201
NPV (Ic = 0.1)12.82614.0093.69−3.24710.358
Normalized value0.93110.40200.788
IRR0.4440.4650.1350.064>1
Normalized value0.4060.4280.075901
Weighted total0.700.800.3600.51
Table A6. Social indicator values from three mixed Ginkgo systems, pure Ginkgo (G), and a cropping system (W+P), 2014.
2014G+R+PG+W+PG+MGW+P
LER1.641.471.2911
Normalized value10.730.4500
Opportunities of employment (10 thousand Yuan·a−1)0.210.210.140.10.2
Normalized value110.3600.91
The rate of agricultural products0.910.8110.7542
Normalized value0.630.19110
Value of goods commodity value (10 thousand Yuan)3.7304.0773.7413.0691.368
Normalized value0.871.000.880.630
Variety of products33212
Normalized value110.500.5
Weighted total0.900.780.640.330.28

Appendix B

The Ginkgo Planting Expert System (GPES) [23] was developed with Dreamweaver CS4, SQL Server 2008, MATLAB 2014, Prolog, and Flex 3. The operating system was Windows Server 2003, and the development platform, ASP.NET 2.0. Each expert could log into the system and fill out the questionnaire form. To satisfy language requirements, the system is developed in Mandarin (more detail it can be found in reference [23]). There are five questions for each preselected indicator, as shown in Table A7. Each expert answers the questions by checking an appropriate box in the form. All of the data are used as the basis for Analytical Hierarchy Process (AHP) and Delphi method. Detailed explanations can be found in the references [22,24].
Table A7. A sampled questionnaire for selecting indicators.
No. Question for Preselected IndicatorsAnswer to be Chosen
Closely and unambiguously related to the assessment goal? Directly/obviously/intuitively/logically linked to criterion or to sustainability.1 = poor 2 = fair 3 = satisfactory 4 = good 5 = very good
Easy to detect, record, and interpret? Easy to get the information, straightforward?1 = poor 2 = fair 3 = satisfactory 4 = good 5 = very good
Provides a summary or integrative measure? Summarizes/integrates a lot of information, is it information efficient?1 = poor 2 = fair 3 = satisfactory 4 = good 5 = very good
Have a clear definition? 0 = yes 1 = no
Important and, therefore, selected as ‘priority’ 0 = not accepted 1 = accepted for further evaluation

References

  1. Pan, Y.; Birdsey, R.A.; Fang, J.; Houghton, R.; Kauppi, P.E.; Kurz, W.A.; Phillips, O.L.; Shvidenko, A.; Lewis, S.L.; Canadell, J.G.; et al. A large and persistent carbon sink in the world’s forests. Science 2011, 333, 988–993. [Google Scholar] [CrossRef] [PubMed]
  2. FAO. State of the Word’s Forests 2011. Rome. Available online: www.fao.org/docrep/013/i2000e/i2000e00.htm (accessed on 5 March 2016).
  3. FAO. Global Forest Resources Assessment 2010—Main Report. FAO Forestry Paper No. 163. Rome, 2010. Available online: www.fao.org/docrep/013/i757e/i1757e00.htm (accessed on 10 April 2015).
  4. Costanza, R. Ecosystem services: Multiple classification systems are needed. Biol. Conserv. 2008, 141, 350–352. [Google Scholar] [CrossRef]
  5. Fortier, J.; Truax, B.; Gagnon, D.; Lambert, F. Potential for Hybrid Poplar Riparian Buffers to Provide Ecosystem Services in Three Watersheds with Contrasting Agricultural Land Use. Forests 2016, 7, 37. [Google Scholar] [CrossRef]
  6. Perry, J.; Lojka, B.; Quinones Ruiz, L.G.; Van Damme, P.; Houška, J.; Fernandez Cusimamani, E. How natural Forest Conversion Affects Insect Biodiversity in the Peruvian Amazon: Can Agroforestry Help? Forests 2016, 7, 82. [Google Scholar] [CrossRef]
  7. Pang, A.Q.; Nuberg, I. Economic evaluation of the agroforestry complex system in China. J. Nat. Resour. 1997, 12, 176–182. [Google Scholar]
  8. Cheng, P. Biological Productivity and Ecological Effects for Ginkgo Agroforestry Systems. Ph.D. Thesis, Nanjing Forestry University, Nanjing, China, 2010. (In Chinese). [Google Scholar]
  9. Wan, F.X.; Chen, P. Soil enzyme activities under agroforestry systems in Northern Jiangsu province. For. Sci. Pract. 2004, 6, 21–26. [Google Scholar] [CrossRef]
  10. Li, W. Agro-ecological farming systems in China. Unesco. 2001. Available online: http://unesdoc.unesco.org/Ulis/cgi-bin/ulis.pl?catno=122998&set=0054141B73_3_128&gp=0&lin=1&ll=1 (accessed on 5 March 2016).
  11. Chen, L. The Effects of Carbon Stocks and Soil Carbon Cycle in Ginkgo Agroforestry Systems. Ph.D. Thesis, Nanjing Forestry University, Nanjing, China, 2013. (In Chinese). [Google Scholar]
  12. Wang, G.; Welham, C.; Feng, C. Enhanced soil carbon storage under agroforestry and afforestation in subtropical China. Forests 2015, 6, 2307–2323. [Google Scholar]
  13. George, T.S.; Gregory, P.J.; Wood, M. Phosphatase activity and organic acids in rhizosphere of potential agroforestry species and maize. Soil Biol. Biochem. 2002, 34, 1487–1494. [Google Scholar] [CrossRef]
  14. Cao, F.; Kimmins, J.P.; Wang, J.R. Competitive interactions in Ginkgo and crop species mixed agroforestry systems in Jiangsu, China. Agrofor. Syst. 2012, 84, 401–415. [Google Scholar] [CrossRef]
  15. Koundouri, P.; Ker Rault, P.; Pergamalis, V.; Skianis, V.; Souliotis, I. Development of an integrated methodology for the sustainable environmental and socio-economic management of river ecosystems. Sci. Total Environ. 2016, 540, 90–100. [Google Scholar] [PubMed]
  16. Daily, G. Nature’s Services: Societal Dependence on Natural Ecosystems; Island Press: Washington, DC, USA, 1997. [Google Scholar]
  17. Van Beek, T.A.; Montoro, P. Chemical analysis and quality control of Ginkgo biloba leaves, extracts, and phytopharmaceuticals. J. Chromatogr. A 2009, 1216, 2002–2032. [Google Scholar] [CrossRef] [PubMed]
  18. Hoffen, L.P.; Ina, S. Orchards for edible cities: Cadmium and lead content in nuts, berries, pome and stone fruits harvested within the inner city neighborhoods in Berlin, Germany. Ecotoxicol. Environ. Saf. 2014, 101, 233–239. [Google Scholar] [CrossRef] [PubMed]
  19. Cao, F. Ecolgoical Basis for Ginkgo Agroforestry Systems, 2007, China Forestry Publishing House. Ph.D. Thesis, The University of British Columbia, Vancouver, Canada, 2004. [Google Scholar]
  20. Xu, J. Evaluation of growth benefits in different comprehensive management patterns of ginkgo and citrus. Nonwood For. Res. 2006, 24, 32–34. (In Chinese) [Google Scholar]
  21. Tian, Y. Physiological and Ecological Effects of Ginkgo-Tea Agroforestry Systems. Ph.D. Thesis, Nanjing Forestry University, Nanjing, China, 2012. (In Chinese). [Google Scholar]
  22. Sun, Y. Development of an Assessment System for Sustainable Forest Management in South China, 2011, Logos Verlag Berlin. Ph.D. Thesis, Freiburg University, Freiburg, Germany, 2011. [Google Scholar]
  23. Gu, W. Design and Development of Ginkgo Planting Expert System. Master’s Thesis, Nanjing Forestry University, Nanjing, China, 2010. (In Chinese). [Google Scholar]
  24. Hwang, C.L.; Lin, M.J. Group Decision Making under Multiple Criteria: Methods and Applications; Springer: Berlin, Germany, 1987. [Google Scholar]
  25. Schwab, N.; Schickhoff, U.; Fischer, E. Transition to agroforestry significantly improves soil quality: A case study in the central mid-hills of Nepal. Agric. Ecosyst. Environ. 2015, 205, 57–69. [Google Scholar] [CrossRef]
  26. Wang, G.; Cao, F. Integrated evaluation of soil fertility in Ginkgo (Ginkgo biloba L.) agroforestry systems in Jiangsu, China. Agrofor. Syst. 2011, 83, 89–100. [Google Scholar] [CrossRef]
  27. Forest situation of Jiangsu Province in 2015. Available online: http://www.jsforestry.gov.cn/art/2016/4/19/art_11_87612.html (accessed on 5 March 2016).
  28. Prabhu, R.; Carol, J.P.; Dudley, G. CIFOR, C&I Toolbox, Guidelines for Developing, Testing and Selecting Criteria and Indicators for Sustainable Forest Management. 1999. Available online: http://www.cifor.org/acm/pub/toolbox.html (accessed on 15 June 2010).
  29. Zagonari, F. Using ecosystem services in decision-making to support sustainable development: Critiques, model development, a case study, and perspectives. Sci. Total Environ. 2016, 548–549, 25–32. [Google Scholar] [CrossRef] [PubMed]
  30. Haken, H.; Graham, R. Synergetik-Die Lehre vom Zusammenwirken. Umschau 1971, 6, 191. [Google Scholar]
  31. Logsdon Rebecca, A.; Indrajeet, C. A quantitative approach to evaluating ecosystem services. Ecol. Model. 2013, 257, 57–65. [Google Scholar] [CrossRef]
  32. Shrestha, P.; Seiler, J.R.; Strahm, B.D.; Sucre, E.B.; Leggett, Z.H. Soil CO2 Efflux and Root Productivity in a Switchgrass and Loblolly Pine Intercropping System. Forests 2016, 7, 221. [Google Scholar]
  33. Bayrak, M.M.; Marafa, L.M. Ten Years of REDD+: A Critical Review of the Impact of REDD+ on Forest-Dependent Communities. Sustainability 2016, 8, 620. [Google Scholar] [CrossRef]
  34. Forrester, D.I.; Pretzsch, H. Tamm Review: On the strength of evidence when comparing ecosystem functions of mixtures with monocultures. For. Ecol. Manag. 2015, 356, 41–53. [Google Scholar] [CrossRef]
  35. Wilsey Chad, B.; Temple, S.A. The Effects of Cropping Systems on Avian Communities in Cacao and Banana Agro-Forestry Systems of Talamanca, Costa Rica. Biotropica 2011, 43, 68–76. [Google Scholar] [CrossRef]
  36. Zheng, J.; Wei, X.; Liu, Y. Review of regional carbon counting methods for the Chinese major ecological engineering programs. J. For. Res. 2016, 27, 1–12. [Google Scholar] [CrossRef]
  37. Bennett, M.T. China’s sloping land conversion program: Institutional innovation or business as usual. Ecol. Econ. 2008, 65, 699–711. [Google Scholar] [CrossRef]
  38. Ma, H.; Ding, Y. A phylogenetic analysis of ecological, economical and social coordinated development of a region. J. Shanghai Norm. Univ. (Philos. Soc. Sci. Ed.) 2016, 45, 49–57. (In Chinese) [Google Scholar]
  39. Su, J.; Hu, Z.; Tang, L. The geographic distribution characters and dynamic evolution for the coordination degree of energy-economic-environmental (3E) in China. Econ. Geogr. 2013, 33, 19–30. (In Chinese) [Google Scholar]
  40. Li, S.; Jiang, T. Analysis on situation and characteristic of forest resources in Jiangsu Province. J. Jiangsu For. Sci. Technol. 2011, 3817705, 34–37. (In Chinese) [Google Scholar]
Figure 1. Planting structure for the experiment site, with (a) Gingko and crops mixed system, (b) Ginkgo and Mulberry mixed system. Pictures shows the five Ginkgo experimental systems: Ginkgo-Mulberry (G+M); Ginkgo-Wheat-Peanut (G+W+P); Ginkgo-Rapeseed-Peanut (G+R+P); Ginkgo (G); and Wheat-Peanut (W+P).
Forests 08 00102 g001
Figure 2. Equilateral triangle of the three sustainability subsystems, ecological (Ec), economic (E), and social (S). Concentric circles represent the different combinations of the subsystems, which gives rise to variation in the Harmony Degree (HD) index. The HD index varies from 0 to 1.
Forests 08 00102 g002
Figure 3. Development Degree (DD) as reflected in a Cartesian coordinate system. DD is the length of the line from the origin to the point of intersection in the X, Y, Z space (see text for more details).
Forests 08 00102 g003
Figure 4. Equilateral triangles depicting the three sustainability subsystems, ecological (Ec), economic (E), and social (S), for Ginkgo (a), Gingko, wheat, and peanut (b), Ginkgo, rapeseed, and peanut (c), Ginkgo and mulberry (d), and agricultural crops (e). The red triangle subscribes the values for each subsystem, and the red cross is its corresponding centroid, the latter of which defines the harmony degree) (see text).
Forests 08 00102 g004aForests 08 00102 g004b
Figure 5. Development degree in three mixed Ginkgo systems, pure Ginkgo (G), and a cropping system (W+P), over three time periods.
Forests 08 00102 g005
Figure 6. Equilateral triangles depicting the three sustainability subsystems, ecological (Ec), economic (E), and social (S), for Gingko, wheat, and peanut (a), Ginkgo, rapeseed, and peanut (b), Ginkgo only (c), agricultural crops (d), and Ginkgo and mulberry (e). The internal triangles subscribe the values for each subsystem, and associated crosses are corresponding centroids, the latter of which define the harmony degree (HD). HD values are shown for 2004 (blue cross), 2009 (pink cross), and 2014 (red cross).
Forests 08 00102 g006aForests 08 00102 g006b
Table 1. Selected indicators for assessing and comparing different Ginkgo agroforestry systems.
Ecological Economic Social
Annual average temperatureIncome (Thousand Yuan·hm−2·a−1)Land equivalent ratio (LER)
Annual soil erosion (t·hm−2·a−1)Net income (Thousand Yuan·hm−2·a−1)Opportunities of employment (10 thousand Yuan·a−1)
Soil fertility quality index (FI)Payback period of investment (Ic = 0.1) *Rate of agricultural products
Litter decomposition rate Net present value (NPV) (Ic = 0.1)Value of goods (10 thousand Yuan)
Total plant productivity (kg·hm−2·a−1)Internal rate of return (IRR)Diversity of products
* Ic is benchmark yield.
Table 2. Index and degree of Harmony (HD).
DegreeNo ControlSignificant DisorderModerate DisorderMild DisorderBasic HarmonyModerate HarmonyHigh HarmonyExcellent Harmony
Index≤0.290.3~0.390.4~0.490.5~0.590.6~0.690.7~0.790.8~0.9>0.9
Table 3. Index and degree of development (DD).
DegreeNo DevelopmentModerate DevelopmentDevelopmentStrong DevelopmentExtreme Development
Index0~ 3 5 3 5 ~ 2 5 3 2 5 3 ~ 3 5 3 3 5 3 ~ 4 5 3 4 5 3 ~ 3
Table 4. Ecological indicators in three mixed Ginkgo systems, pure Ginkgo (G), and a cropping system (W+P), in 2009.
2009G+R+PG+W+PG+MGW+P
The annual average temperature (°C)20.54 ± 0.1120.51 ± 0.220.37 ± 0.1720.71 ± 0.2421.96 ± 0.23
Normalized value0.530.530.540.510.39
Annual soil erosion (t·hm−2·a−1)16.32 ± 1.5419.51 ± 2.752.49 ± 0.3328.25 ± 2.1247.52 ± 5.76
Normalized value0.690.6210.430
Soil fertility quality index (FI)0.510.440.680.290.45
Total plant productivity (kg·hm−2·a−1)27510 ± 318.6532,539.7 ± 455.9912,427.9 ± 208.674815.7 ± 90.222,444.5 ± 159.02
Normalized value0.8210.2700.64
Litter decomposition rate46.56 ± 5.8950.74 ± 6.8142.58 ± 3.3252.86 ± 5.8462.59 ± 4.33
Normalized value0.200.4100.511
Weighted total0.550.600.500.350.50
Note: Values are mean ± standard deviation (n = 3).
Table 5. Economic indicators in three mixed Ginkgo systems, pure Ginkgo (G), and a cropping system (W+P), in 2009.
2009G+R+PG+W+PG+MGW+P
Income (Thousand Yuan·hm−2·a−1)4.88 ± 0.355.72 ± 0.703.57 ± 0.452.58 ± 0.613.13 ± 0.19
Normalized value0.7310.3200.18
Net income (Thousand Yuan·hm−2·a−1)3.70 ± 0.224.49 ± 0.122.89 ± 0.302.17 ± 0.272.05 ± 0.19
Normalized value0.6810.350.050
The payback period of investment (Ic = 0.1)4.35 ± 0.154.19 ± 0.2017.67 ± 0.25>370 ± 0
Normalized value0.880.890.5201
NPV (Ic = 0.1)12.83 ± 0.8914.01 ± 0.743.69 ± 0.12-3.25 ± 0.3510.36 ± 1.77
Normalized value0.9310.4000.79
IRR0.44 ± 0.030.47 ± 0.010.14 ± 0.050.06 ± 0.01>1
Normalized value0.410.430.0801
Weighted total0.730.860.320.010.59
Note: Values are mean ± standard deviation (n = 3).
Table 6. Social indicators in three mixed Ginkgo systems, pure Ginkgo (G), and a cropping system (W+P), in 2009.
2009G+R+PG+W+PG+MGW+P
LER1.78 ± 0.121.81 ± 0.081.73 ± 0.051 ± 01 ± 0
Normalized value0.9610.9000
Opportunities of employment (10 thousand Yuan·a−1)0.28 ± 0.010.28 ± 0.030.22 ± 0.010.1 ± 0.040.2 ± 0.03
Normalized value110.6700.56
The rate of agricultural products0.85 ± 00.8 ± 01 ± 01 ± 00.75 ± 0
Normalized value0.390.19110
Value of goods (10 thousand Yuan)4.84 ± 0.315 ± 0.724.43 ± 0.442.85 ± 0.562.62 ± 0.16
Normalized value11.070.820.100
Variety of products3 ± 03 ± 02 ± 01 ± 02 ± 0
Normalized value110.500.5
Weighted total0.870.850.780.220.21
Note: Values are mean ± Standard Deviation (SD) (n = 3).
Table 7. Harmony degree (HD) in three mixed Ginkgo systems, pure Ginkgo (G), and a cropping system (W+P), over three time periods.
HDG+R+PG+W+PG+MGW+P
20040.536 ± 0.1560.449 ± 0.1170.728 ± 0.070.702 ± 0.0960.61 ± 0.113
20090.678 ± 0.0660.703 ± 0.1250.552 ± 0.0830.658 ± 0.0490.604 ± 0.065
20140.712 ± 0.1260.793 ± 0.0740.719 ± 0.1360.512 ± 0.0610.76 ± 0.110
Note: Values are mean ± standard deviation (n = 3).

