Article

Hydrology of a Water‐Limited Forest under Climate Change Scenarios: The Case of the Caatinga Biome, Brazil

Center for Nuclear Energy in Agriculture, University of São Paulo, Piracicaba, SP 13416‐000, Brazil
*
Author to whom correspondence should be addressed.
Forests 2017, 8(3), 62; https://doi.org/10.3390/f8030062
Submission received: 5 December 2016 / Accepted: 19 February 2017 / Published: 27 February 2017

Abstract

:
Given the strong interactions between climate and vegetation, climate change effects on natural and agricultural ecosystems are common objects of research. Reduced water availability is predicted to take place across large regions of the globe, including Northeastern Brazil. The Caatinga, a complex tropical water-limited ecosystem and the only exclusively Brazilian biome, prevails as the main natural forest of this region. The aim of this study was to examine the soil-water balance for this biome under a climate-warming scenario and with reduced rainfall. Climate change projections were assessed from regional circulation models earlier applied to the Brazilian territory. A statistical climate data generator was used to compose a synthetic weather dataset, which was later integrated into a hydrological model. Compared to simulations with current climate for the same site, under the scenario with climate change, transpiration was enhanced by 36%, and soil-water evaporation and interception were reduced by 16% and 34%, respectively. The greatest change in soil-water components was observed for deep drainage, accounting only for 2% of the annual rainfall. Soil-plant-atmosphere fluxes seem to be controlled by the top layer (0.0–0.2 m), which provides 80% of the total transpiration, suggesting that the Caatinga forest may become completely soil-water pulse dominated under scenarios of reduced water availability.

1. Introduction

Climate and vegetation interact at temporal and spatial scales, and climate is considered as the main factor determining vegetation distribution [1]. On the other hand, vegetation plays a role in climate as well, mainly at the regional scale, and replacement of a vegetation type by another will affect evapotranspiration and other climate factors simultaneously. This process may result directly in land-atmosphere feedbacks, suggesting that a land-cover change may modify precipitation cycle dynamics, and thus, play an important role in the water balance of a land surface [2,3].
When predicted climate change scenarios include rainfall reduction and air temperature increases, soil water content is expected to decrease, thus affecting evapotranspiration rates. Effects of land cover changes or vegetation dynamics are often associated with modification in the soil moisture regime [4]. If frequency, duration and severity of droughts increase, as is the case for predicted climatic change scenarios for some regions [5,6], this could alter the composition, structure and biogeography of forests in many global regions [7].
Drylands cover about 40% of the land surface of the earth. They are characterized by low precipitation and a high incidence of drought. Vegetation and atmosphere feedbacks are especially critical in drylands, mainly due to the tight coupling that exists between water, energy and biogeochemical budgets [8]. Therefore, to improve our understanding of forest-climate interactions in arid and semi-arid zones, an ecosystem approach might be necessary to assess forest water-use and hydrological limitations in a warmer and drier climate [9].
The Northeastern part of Brazil contains a large semiarid region, representing 12% of the total Brazilian territory. The Caatinga biome prevails as the main natural forest of this region, a complex tropical and water-limited ecosystem with a wide variety of both herbaceous and arborescent vegetation, characterized by its ability to cope with low soil water content ranges [10,11]. Recently predicted climate changes, assessed by indices from global and regional climate models, including consecutive dry days and soil moisture anomalies, have projected an increase in air temperature and the duration and intensity of drought in some large regions of the world. For the semiarid region of Northeastern Brazil, rainfall reductions of up to 40% and air temperature increase up to 4.0 °C are predicted by the year 2100 [5,6,12].
The Caatinga biome is important to the Brazilian semi-arid region as a whole for its rich and diverse biota [13]. Beyond the role of being a shelter for several endemic species, the Caatinga biome provides essential services to society such as timber, foraging and watershed protection. Regarding the latter, as the population from the Northeastern part of Brazil is highly dependent on surface water reservoirs, the biome is a key component of water security. Northeastern Brazil faces recurrent long-lasting droughts that strongly affect regional livelihoods due to limited water resources for drinking, agriculture and cattle ranches [12]. This threatening reality would be worsened in case of disturbances in the natural protection of the watersheds offered by the Caatinga forest [14]. Nonetheless, some specific issues remain uncertain regarding climate change and its effects on the Caatinga forest water cycle, such as the fact that the desertification processes may be enhanced as the vegetation faces higher atmospheric demand in a drier soil [15]. With the objective to study the effects on the hydrology of the Caatinga biome triggered by a climate change characterized by an increase in air temperature and a reduction of rainfall, we performed a hydrological simulation study focusing on the soil-water balance components of a representative Caatinga site under future climate scenarios.

2. Materials and Methods
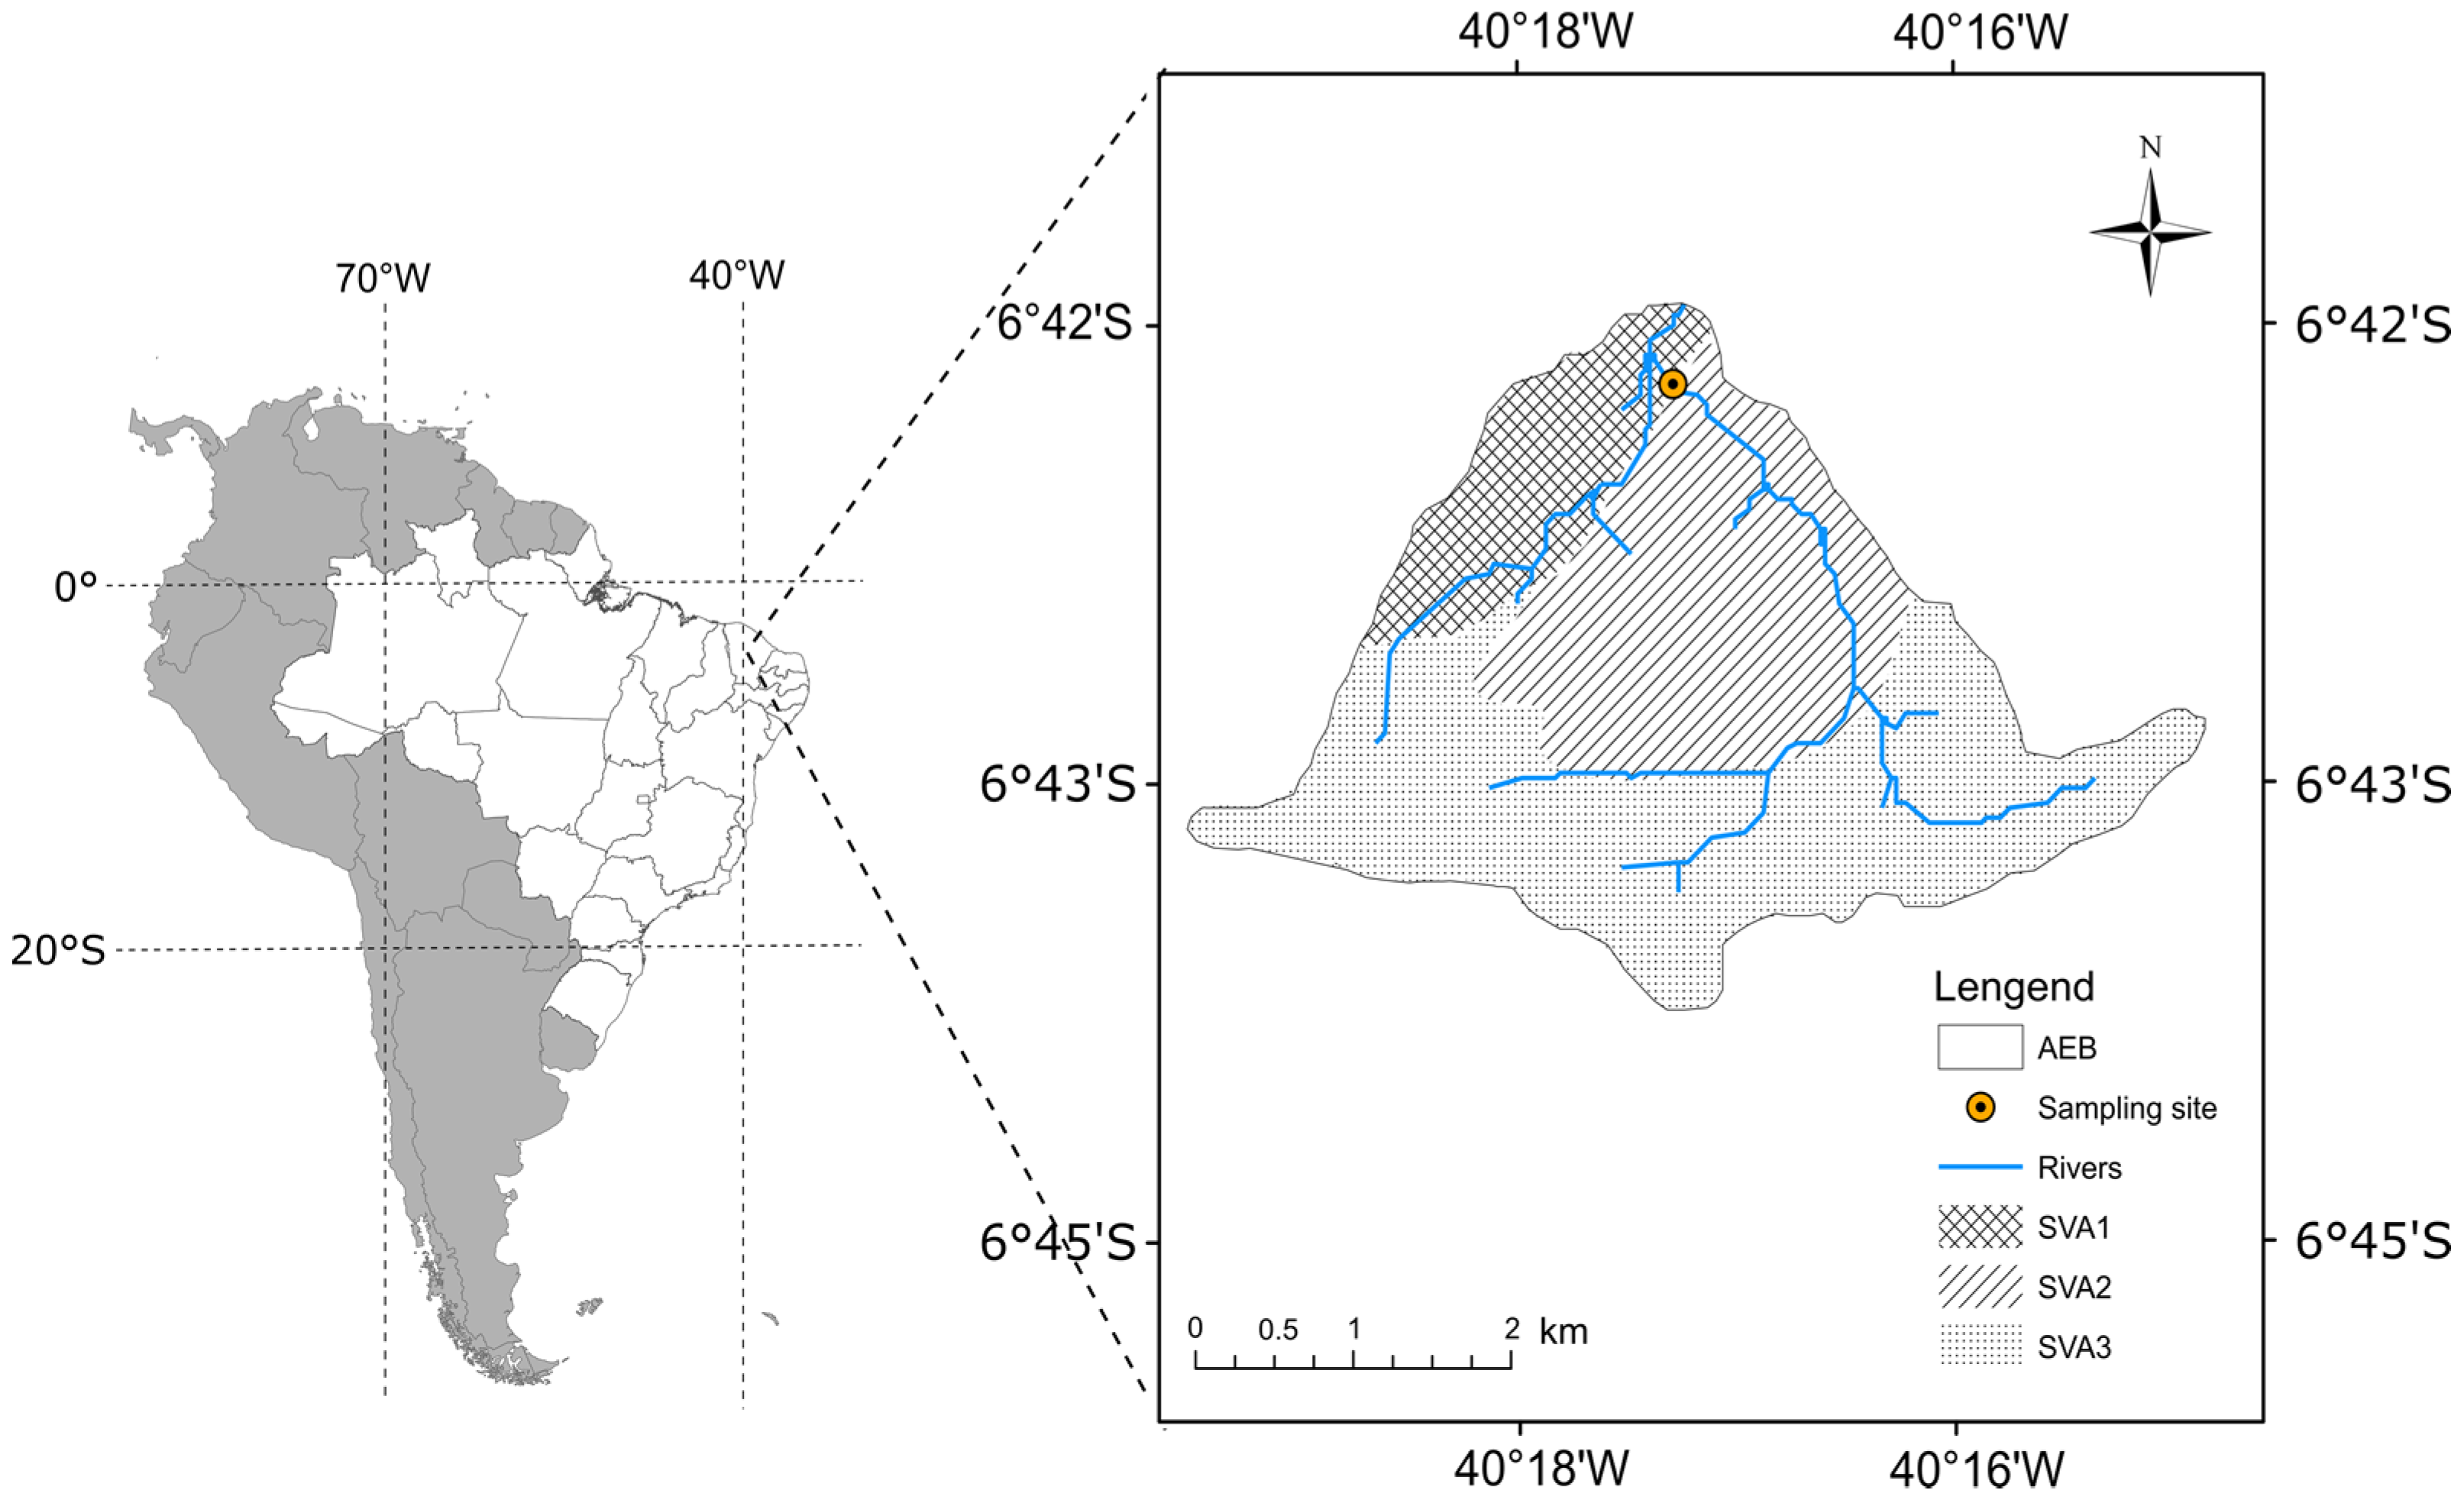
2.1. Study Area

The study was conducted with respect to the Aiuaba Experimental Basin (AEB), a 12 km2 “integrally preserved” Caatinga watershed (6°42′S, 40°17′W). The AEB is completely located inside the ecological station of Aiuaba, state of Ceará, Brazil, which is under jurisdiction of the Brazilian Federal Environmental Institute (IBAMA). Following the Köppen classification system, the climate is of the BSh type (semi-arid, low latitude and altitude) with an average annual class-A pan evaporation of 2500 mm. Average annual rainfall is 518 mm, concentrated in the rainy season between January and May. The monthly average temperatures range from 24 °C to 28 °C. The watershed is covered by dense native vegetation characterized by tree heights typically between 5 and 12 m. More detailed information can be found in [10,16,17].
The forest of the studied site developed in a Lixisol with effective root depth ranging from 0.6 m to 0.8 m. Dominant tree species are Caesalpinia pyramidalis Tul., Piptadenia obliqua and Mimosa tenuiflora (Willd.) Poir. [11]. The water table is located several meters below the river bed, restraining its connection to the root zone, and rainfall is the main source of water for plant transpiration. Consequently, the Caatinga forest developed shallow roots to enhance root water uptake from upper soil layers [10,11]. Leaf shedding is the main characteristic and survival strategy to cope with up to nine months of the rainless season. Figure 1 displays the Aiuaba Experimental Basin together with its three soil and vegetation associations (SVA) [10,18,19] and the sampling site for soil hydraulic properties and root length distribution [10].

2.2. Climatic Data Generator

Statistical weather generator software uses existing weather records (baseline data) to produce long series of synthetic daily climatic data. The statistical properties of the generated series are expected to be similar to those of the baseline data. The Climatic data generator (ClimGen) was used [20]. ClimGen does not use any fixed coefficients optimized from specific weather database; therefore, it can be applied to any location as long as enough information exists to parameterize its code, i.e., 25 years of daily rainfall, 10 years of temperature data, two years of solar radiation data, wind speed and relative humidity, without missing values. For our simulations, weather data were reproduced stochastically for the period from 2016 to 2040 for the Aiuaba Experimental Basin, with baseline data from the period 1990–2015. The synthetically generated daily weather data consist of rainfall, daily maximum and minimum temperature, solar radiation, air humidity, and wind speed.
The meteorological baseline data used in the parameterization of ClimGen software were provided by the Ceará State Foundation of Meteorology and Water Resources (FUNCEME), comprising daily records from the AEB dataset as well as from a neighboring weather station. According to earlier soil-water balance simulations [10], the hydrological components (rainfall, interception loss, actual transpiration, actual evaporation and deep drainage) do not differ statistically among the three SVAs. Nevertheless, SVA1 was chosen for the simulation of climate change scenarios, as its soil does not contain a shallow stony layer as occurs in SVA2 and SVA3, and it may therefore provide a more representative picture of the Caatinga hydrology adjustment under climate change scenarios.

2.3. Climate Change Scenario

The impact of climate change on rainfall and temperature for different Brazilian regions and periods assessed by [5] was based on the Eta regional model by the Brazilian Center for Weather Forecasting and Climate Studies (CPTEC), driven by four members of an ensemble of the Met Office Hadley Centre Global Coupled climate model (HadCM3). The model ensemble was run according to the Special Report on Emissions Scenarios (SRES-A1B). For mesoscale processes, climate change projections derived from Regional Climate Models may be considered more representative than projections derived from Global Climate Models (GCMs), mainly due to the better resolution which allows improvements in the representation of topography, land use and land-sea distribution [5].
A climate change projection was selected from the regional simulations performed over Brazil [5]. For our purpose, we selected the predicted changes corresponding to an atmospheric CO2 concentration of 418 ppm by the period 2011–2040, projected for the São Francisco River Basin. The São Francisco River Basin is predominantly located in Northeastern Brazil with its middle and lower parts covered mainly by the Caatinga forest and therefore, representative of the analyzed site. Under this scenario and during this period, rainfall is predicted to decline by 15%, and air temperature is predicted to increase by 1.5 °C.
Based on predictions of rainfall and air temperature for the year 2040 provided by [5], baseline values for both variables were supposed to alter linearly with time from 2011 to 2040 and used in the ClimGen climate generator model to stochastically generate weather scenarios. As the simulation of the synthetic climatic data started in the year 2016, the projected changes of rainfall and air temperature for the first five years (2011–2015) were considered for the period 2016–2040. As the stochastic weather generator relies on random numbers, one hundred stochastic realizations were performed in order to obtain more representative scenarios. The 100 generated weather datasets were integrated into the hydrological model SWAP (Soil-Water-Atmosphere-Plant), resulting in 100 water balance simulations for the period.

2.4 Modeling

Hydrological modeling was performed with the 1-D SWAP (Soil-Water-Atmosphere-Plant) model [21] using daily weather data and generating a daily parameter output. The model simulates water flow and plant growth in a soil-plant-atmosphere environment. To calculate the water balance terms, the model employs the Richards equation with a root water extraction sink term:
θ t =   z   ( K ( h ) ( h z + 1 ) ) S ( h )
In this equation, t is time (day), z is the vertical coordinate (cm, positive upwards), K(h) is the hydraulic conductivity (cm·day−1) and S(h) represents the water uptake by plant roots (day−1). Equation (1) is solved numerically describing the θ-h-K relation by the Mualem–van Genuchten equations [22,23]. To estimate the sink term S(h), the adopted reduction function includes an implicit compensation mechanism such that uptake restrictions in drier layers are compensated by increased uptake from wetter parts of the rooted soil profile [24,25].
The SWAP model was developed to simulate hydrology and plant growth, and [10] successfully implemented a parameterization procedure for the Caatinga biome. A special quality of the SWAP model refers to its ability to predict the main factors that determine evaporation and soil-water uptake by roots, thus being robust in simulating the hydrology in ecosystems with multilayered soil profiles, taking into account soil hydraulic properties and root distribution.
Simulations performed here with the SWAP model were based on the validated parameterization of vegetation (leaf area index, crop factor, root length density and interception losses) and soil hydraulic properties carried out by [10] for the Aiuaba Experimental Basin, Table 1. Regarding interception losses, see the Gash model [26] and its parameterization for the studied site in [27].
Regarding the crop factor (Kc), Equation (2) based on modeling of plant growth was earlier developed [10]:
K c =   1     α v   ( α s     α v ) e k L A I 1   0.23
where αv is the vegetation albedo; αs is the surface soil albedo; k is the light extinction coefficient and LAI is the leaf area index. Values of αv and αs were assumed constant over time and estimated using satellite images, Table 1. For the light extinction coefficient (k) that depends on the type of light, the position and the leaf characteristics, we adopted the value of 0.75, which is representative of an average situation [28].
For a seasonal forest like Caatinga, LAI values are not constant over time. For the Caatinga biome, there is a strong correlation between LAI estimated from satellite images and the mean soil water pressure head in the 15-day period before the satellite imaging [10]. However, for future scenarios, no soil water content dataset is available, and forecasting the Caatinga leaf area index would be cumbersome.
We opted to establish a correlation between LAI measurements obtained from satellite images and the rainfall in a period of p days before the satellite imaging. Daily rainfall (R) was weighed by a factor η defined according to a sine function, giving rainfall amounts in the middle of the period (at d = p/2) the highest weight and at the beginning and end (at d = 0 and d = p) zero weight:
η =   d = 0 p R ( 1 + sin ( 2 π d p     π 2 ) ) d = 0 p ( 1 + sin ( 2 π d p     π 2 ) )
The highest correlation between LAI and η was found for p = 31 days and resulted in Equation (4) with a coefficient of determination of 0.95:
L A I = 0.4188 η 0.4252
The LAI estimated by Equation (4) has the same order of magnitude as the estimates obtained in [10] using soil pressure head.
SWAP simulated, on a daily basis, the following water balance components: actual transpiration (T), actual soil evaporation (E), interception losses (IL) and deep drainage (D). The sum of actual transpiration, evaporation and interception losses will be referred to as TEI.

3. Results

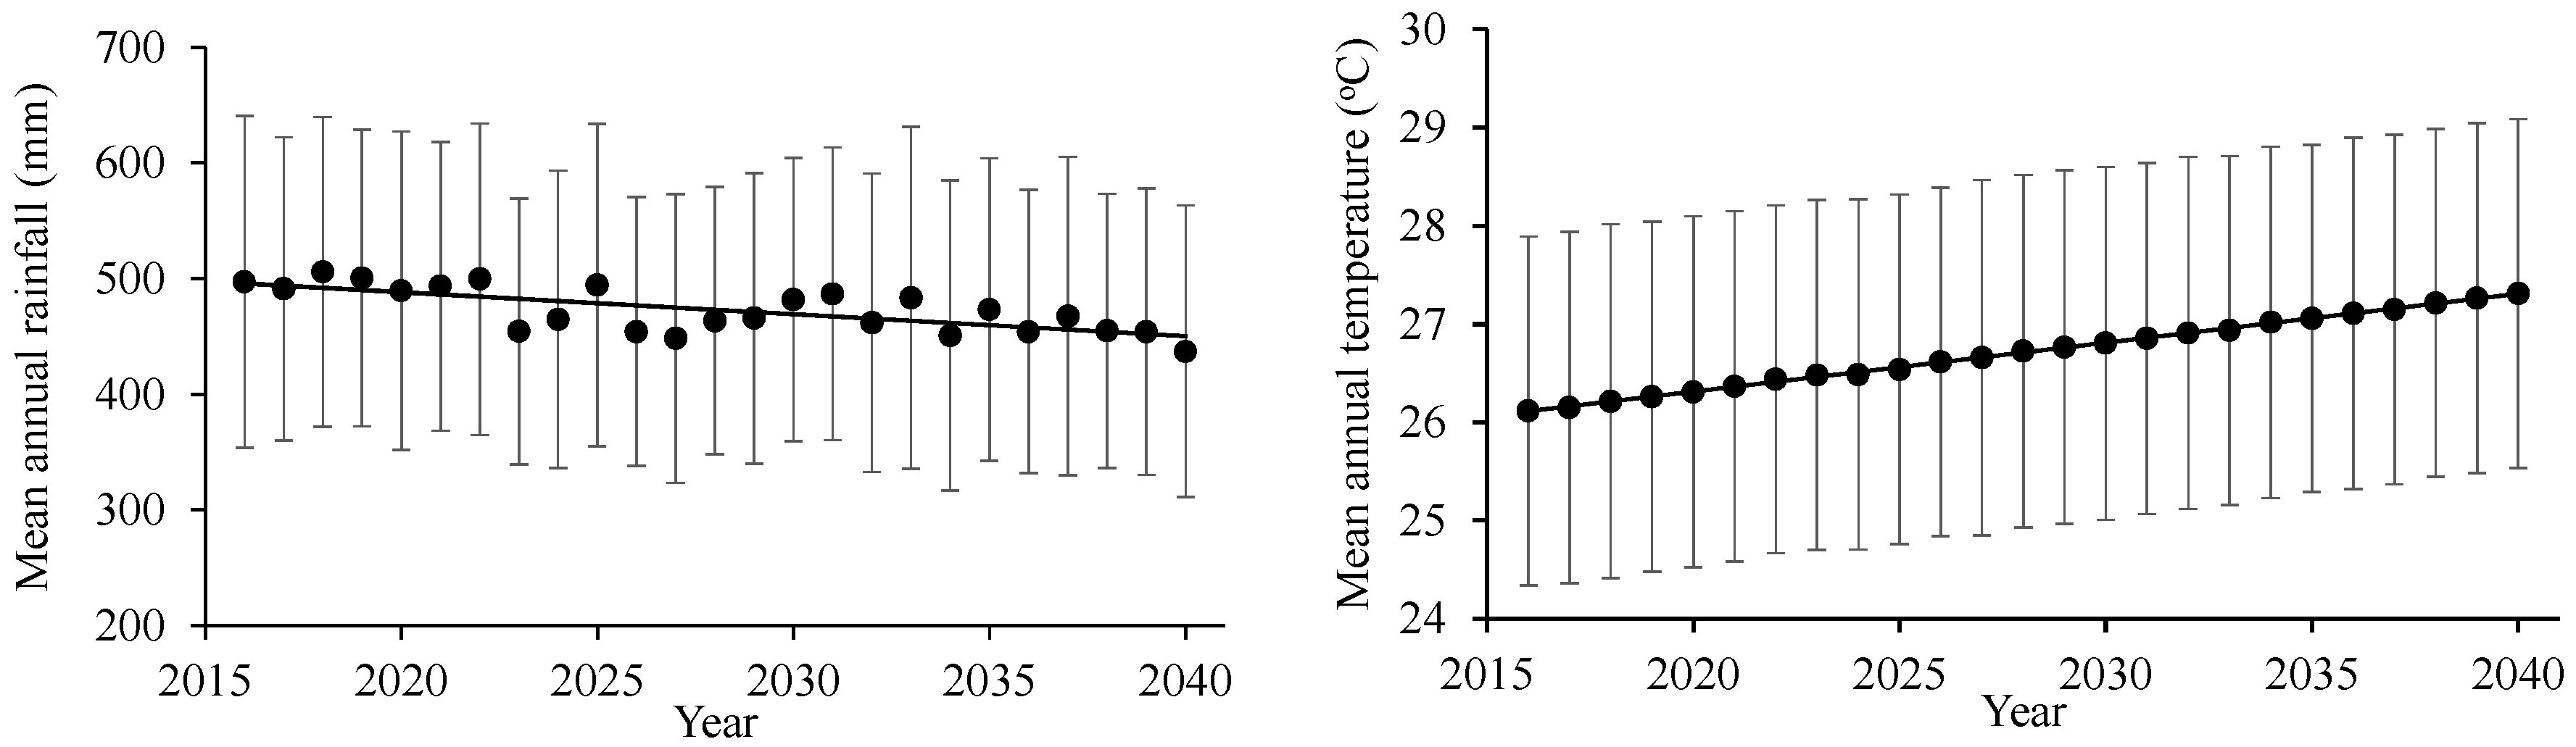
3.1. Generated Climatic Data

The 100 stochastic daily rainfall series simulated by ClimGen for each year for the period 2016–2040 resulted in total annual rainfall ranging from 133–1142 mm with an annual average of 473 mm and an average standard deviation of 129 mm (Figure 2). This figure shows the simulated trend of rainfall reduction as well. For the baseline climate period (1990–2015), annual rainfall ranged from 221–1266 mm with an average of 518 mm.
Regarding air temperature, the annual average of the 100 stochastic realizations for the simulated period ranged from 19–34 °C with an average of 26.7 °C and a standard deviation of 1.8 °C (Figure 2). The baseline climate dataset had a mean annual temperature of 25.8 °C (±1.7 °C) with minimum and maximum values ranging from 18–31 °C.

3.2. Hydrological Simulations

Simulated actual transpiration, actual evaporation and interception losses showed normality according to the Kolmogorov–Smirnov test (p > 0.05); 95% levels of confidence were calculated and are shown in Figure 3 together with the mean annual values.
Based on the 95% levels of confidence, T, E and IL for the year 2040 are predicted to be in the range between 212–241 mm, 139–149 mm and 48–53 mm, respectively. Therefore, in order to obtain a positive year-based water budget, annual rainfall should be higher than 241 + 149 + 53 = 443 mm. The amount of precipitation that returns to the atmosphere as actual evapotranspiration, TEI, (through T, E and IL) for the whole simulated period at the studied site was, on average, 98% (±8.3%), which is 23% higher than the values simulated by [10] in the period 2004–2012 for the same site.
The surface soil layer (0.0–0.2 m) is the most important layer regarding water availability in the Caatinga biome [10], providing more than 80% of total transpired water for years with annual rainfall slightly above the long-term average. Regarding the hydrological simulations with climate change scenarios, the average values of root water uptake at depth 0.0–0.2 m remained close to 80% (±7%) with a slight increasing trend (Figure 4). Considering all stochastic realizations, the contribution of the soil top layer to actual transpiration ranged from 60% to 95%.
The temporal pattern of the monthly soil water content for the surface layer (0.0–0.2 m) shows a high correlation to the monthly rainfall pattern, with a large temporal variability on the yearly scale grouped into periods (Figure 5). The highest monthly soil water contents were observed between February and April (rainy season) and the lowest values between July and December (dry season). The average value for the whole simulated period was 0.15 m3·m−3 (±0.039), while the measured average soil water content during the analyzed period 2004–2012 at depth 0–0.2 m was 0.24 m3·m−3 [10].
Monthly average soil water pressure head (h) over depth is displayed in Figure 6. The values of h at 0.1 m and 0.3 m depth show larger variations when compared to deeper layers, reflecting rainfall pattern and shallow root water uptake associated with high evaporation rates. Figure 6B shows the soil water pressure head at 0.1 m depth along the year averaged for the simulated period and for the first (2016) and last (2040) simulated year. Comparing the year 2040 to the overall average, one can observe that there is a tendency of more negative h values during the rainless season (June–December) with pressure head values reaching −110 m by the end of the rainy season (period June–July), 37% lower than registered for the first simulated year (2016). June and July normally represent the onset of leaf shedding in the Caatinga biome, and a drier soil may speed up this phenological behavior.
Comparing the simulated period 2016–2040 to the period (2004–2012) studied by [10], the greatest change in water balance components was observed for the annual amount of deep drainage below the root zone. For 2004–2012, deep drainage averaged 34% of total annual rainfall, whereas for the period 2016–2040, deep drainage accounted for only about 2%. The highest annual value of deep drainage was 427 mm for one of the 2016 realizations. For this specific simulation, total rainfall was 1000 mm; a similar value with measured weather data for the year 2004 was obtained by [10] for the same site. Taking into account only annual averages, deep drainage ranged from 11–42 mm with a high mean standard deviation of 41.5 mm (Figure 7A). Mean annual rainfall has a strong relationship with annual evapotranspiration and deep drainage (Figure 7B), confirming the low dependency of the vegetation on stored soil-water.

4. Discussion

4.1. General Hydrological Features

A lower amount of rainfall would increase the stomatal resistance of vegetation or deplete soil-water stocks from previous years, enhancing severe soil drought and possibly leading to mortality of certain species [29,30]. Comparing the future soil hydrology predictions for the Caatinga forest to earlier simulations [10] with measured weather data for the same Caatinga site, on average, actual transpiration increased by 36%, and actual soil evaporation and interception losses decreased by 16% and 34%, respectively. In general, biological fluxes (transpiration) play a greater role in water fluxes than physical fluxes (evaporation) [2]. This is expected because plant roots are able to take up stored soil-water and moving deeper sources of water to the atmosphere, whereas evaporation is only effective for water at or near the soil surface. The trend of evaporation rates under a warming climate scenario is unclear [31]. Class A Pan measurements [32] and simulations by global circulation models [33] have shown a decline in evaporation, which would be related to an increase in the terrestrial water flux, correlating to an increasing air humidity, or due to changes in radiation intensity or in strength of air circulations.
Water balance investigations for shallow-rooted sites of a dry region have found that 96 to 98% of total precipitation returned to atmosphere as TEI [34], which is the same order of magnitude of the Caatinga biome (a similar shallow-rooted vegetation). For some simulated years, TEI greater than the annual rainfall for the Caatinga biome is observed, which corresponds to years with rainfall amount below the long-term average preceded by years with rainfall above the long-term average. This can be explained by the depletion of soil-water stored from the year before. For the simulated period, the average fraction ± standard deviation of total water use by T was 54% (±4%), E 34% (±4%) and IL 12% (±1%). The simulated transpiration for the Caatinga forest agrees with the compilation on partitioned evapotranspiration carried out by [35], who reported T of the order of 51% for water-limited ecosystems. The behavior of the actual transpiration here observed can be partially explained by the simulated changes in air temperature and rainfall. However, due to the diversity of plant species in the Caatinga biome, different plant responses to drought stress are expected. For instance, transpiration will probably decline when atmospheric CO2 concentration increases [36], enforced by stomatal adjustments to atmospheric variables and soil moisture [29]. Laboratory experiments have shown that the stomatal openings of many plants species decrease under elevated CO2 concentrations [37], which would impact the global water cycle [36]. It is unclear whether this process would have a significant effect on the regional water cycle, especially in water-limited ecosystems, which are typically constrained by water and nutrient availability [35]. Experimental evidence obtained in a water-limited ecosystem [38] has shown that under elevated atmospheric CO2 concentrations, water use increases due to a higher primary productivity, even though stomatal conductance is reduced. Therefore, most predictions of future water availability ignore stomatal-closure effects.
As discussed in [10], other authors have found the soil-water fluxes to be controlled by top layers, for instance [39,40,41]. The importance of top layers for dryland forests is based on maximizing the uptake of ephemeral water pulses from rainfall, together with an optimization of nutrient cycling [42,43,44]. Under drier conditions, however, an increase in water extraction from deeper layers may be expected rather than maintenance of the predominance of shallow root water uptake. However, apparently the Caatinga water balance not only depends on rainfall amount but also on temporal rainfall distribution. The Caatinga vegetation has a shallow and laterally spread root system [11], enhancing the importance of the top layer and indicating that the water regime of this ecosystem is water pulse rather than storage dominated. According to [34], ecosystems dominated by soil-water storage are likely to be more harmed by increased temperature, consequently higher evapotranspiration demand, and decreased rainfall, than ecosystems with soil-water dynamics that depend on pulsed soil-water patterns.

4.2. Final Remarks

Our modeling approach pinpointed important features concerning a reduction in water availability for the Caatinga biome, taking into account the water balance at the ecosystem scale; therefore, our results may provide a big picture of the likelihood of threats to the ecosystem resulting from climate change. Nonetheless, predictions of the response of individual species in the Caatinga to future climate change rely on details at a species level. To improve predictions of drought-related vulnerability of forests, a better understanding of quantitative physiological mechanisms governing drought stress, together with hydrological modeling, is needed [29]. The Caatinga biome shows a remarkable capacity to cope with low soil-water ranges, with pressure head records dropping below −150 m during dry seasons that last up to nine months [10]. A further decrease in water availability, however, would trigger the replacement of prevailing species by pre-adapted individuals already present within the population [45]. Biomes with substantial variability for the traits that regulate the species responses to environment are likely to show greater tolerance to climate changes. Although the genetic response of vegetation to climate change may play an important role in selection pressure of individuals, when environmental variation occurs on a timescale shorter than the life of the plant, any response must be in terms of a plastic phenotype ([46], and references cited therein) These responses alter plants productivity through both growth (photosynthesis and biomass accumulation) and development (phenological and morphological responses) [47].
Besides plant adaptation and replacement, two potential short-term threats to the Caatinga forest are wildfire activity and soil salinity, which are directly linked to drier soils and reduced deep drainage, respectively. Our hydrological soil-water balance simulated a remarkably low soil-water content, which may directly affect soil surface temperature and, together with combustible forest (leaf shedding behavior of overstory vegetation and coarse woody debris), might substantially increase the risk of wildfire occurrence [48,49,50]. Regarding the risks of soil salinity, although the water table is located several meters below the river bed [16], making capillary rise irrelevant, salts can be introduced in the root zone by rain and the weathering of rocks [15]. The reduced deep drainage reported in this research, together with a negative water balance, would represent an increase in soil salinity effects since, in a drier soil, the vegetation experiences higher salt concentration than in a wet soil. Due to the higher atmospheric water demand, with 98% of precipitation being forecasted to be used as TEI, insufficient downward water flow to leach salts out of the soil profile is expected. The increase of salt concentrations in the surface layer, even at low rates, could heavily impact this ecosystem that already depends on shallow soil water. Such a combination of salt and water stress could be very damaging to the biome, provoking modifications in vegetation composition and, perilously, desertification.

5. Conclusions

From the soil-water balance simulations applied to the Caatinga biome, including a climate change over the period 2016–2040, we conclude that:
  • Based on 95% levels of confidence, in order to obtain a positive year-based water budget, annual rainfall should be higher than 443 mm.
  • Compared to simulations with the current climate, climate change would lead to an increase of actual transpiration of 36%, and a decrease of 16% and 34% for soil evaporation and interception losses, respectively, whereas the amount of precipitation returned to the atmosphere as evapotranspiration was predicted to reach, on average, 98%.
  • The greatest change in water balance components under the simulated climate change was predicted for deep drainage, accounting only for 2% of the annual rainfall, followed by a soil-water reduction of 38%.
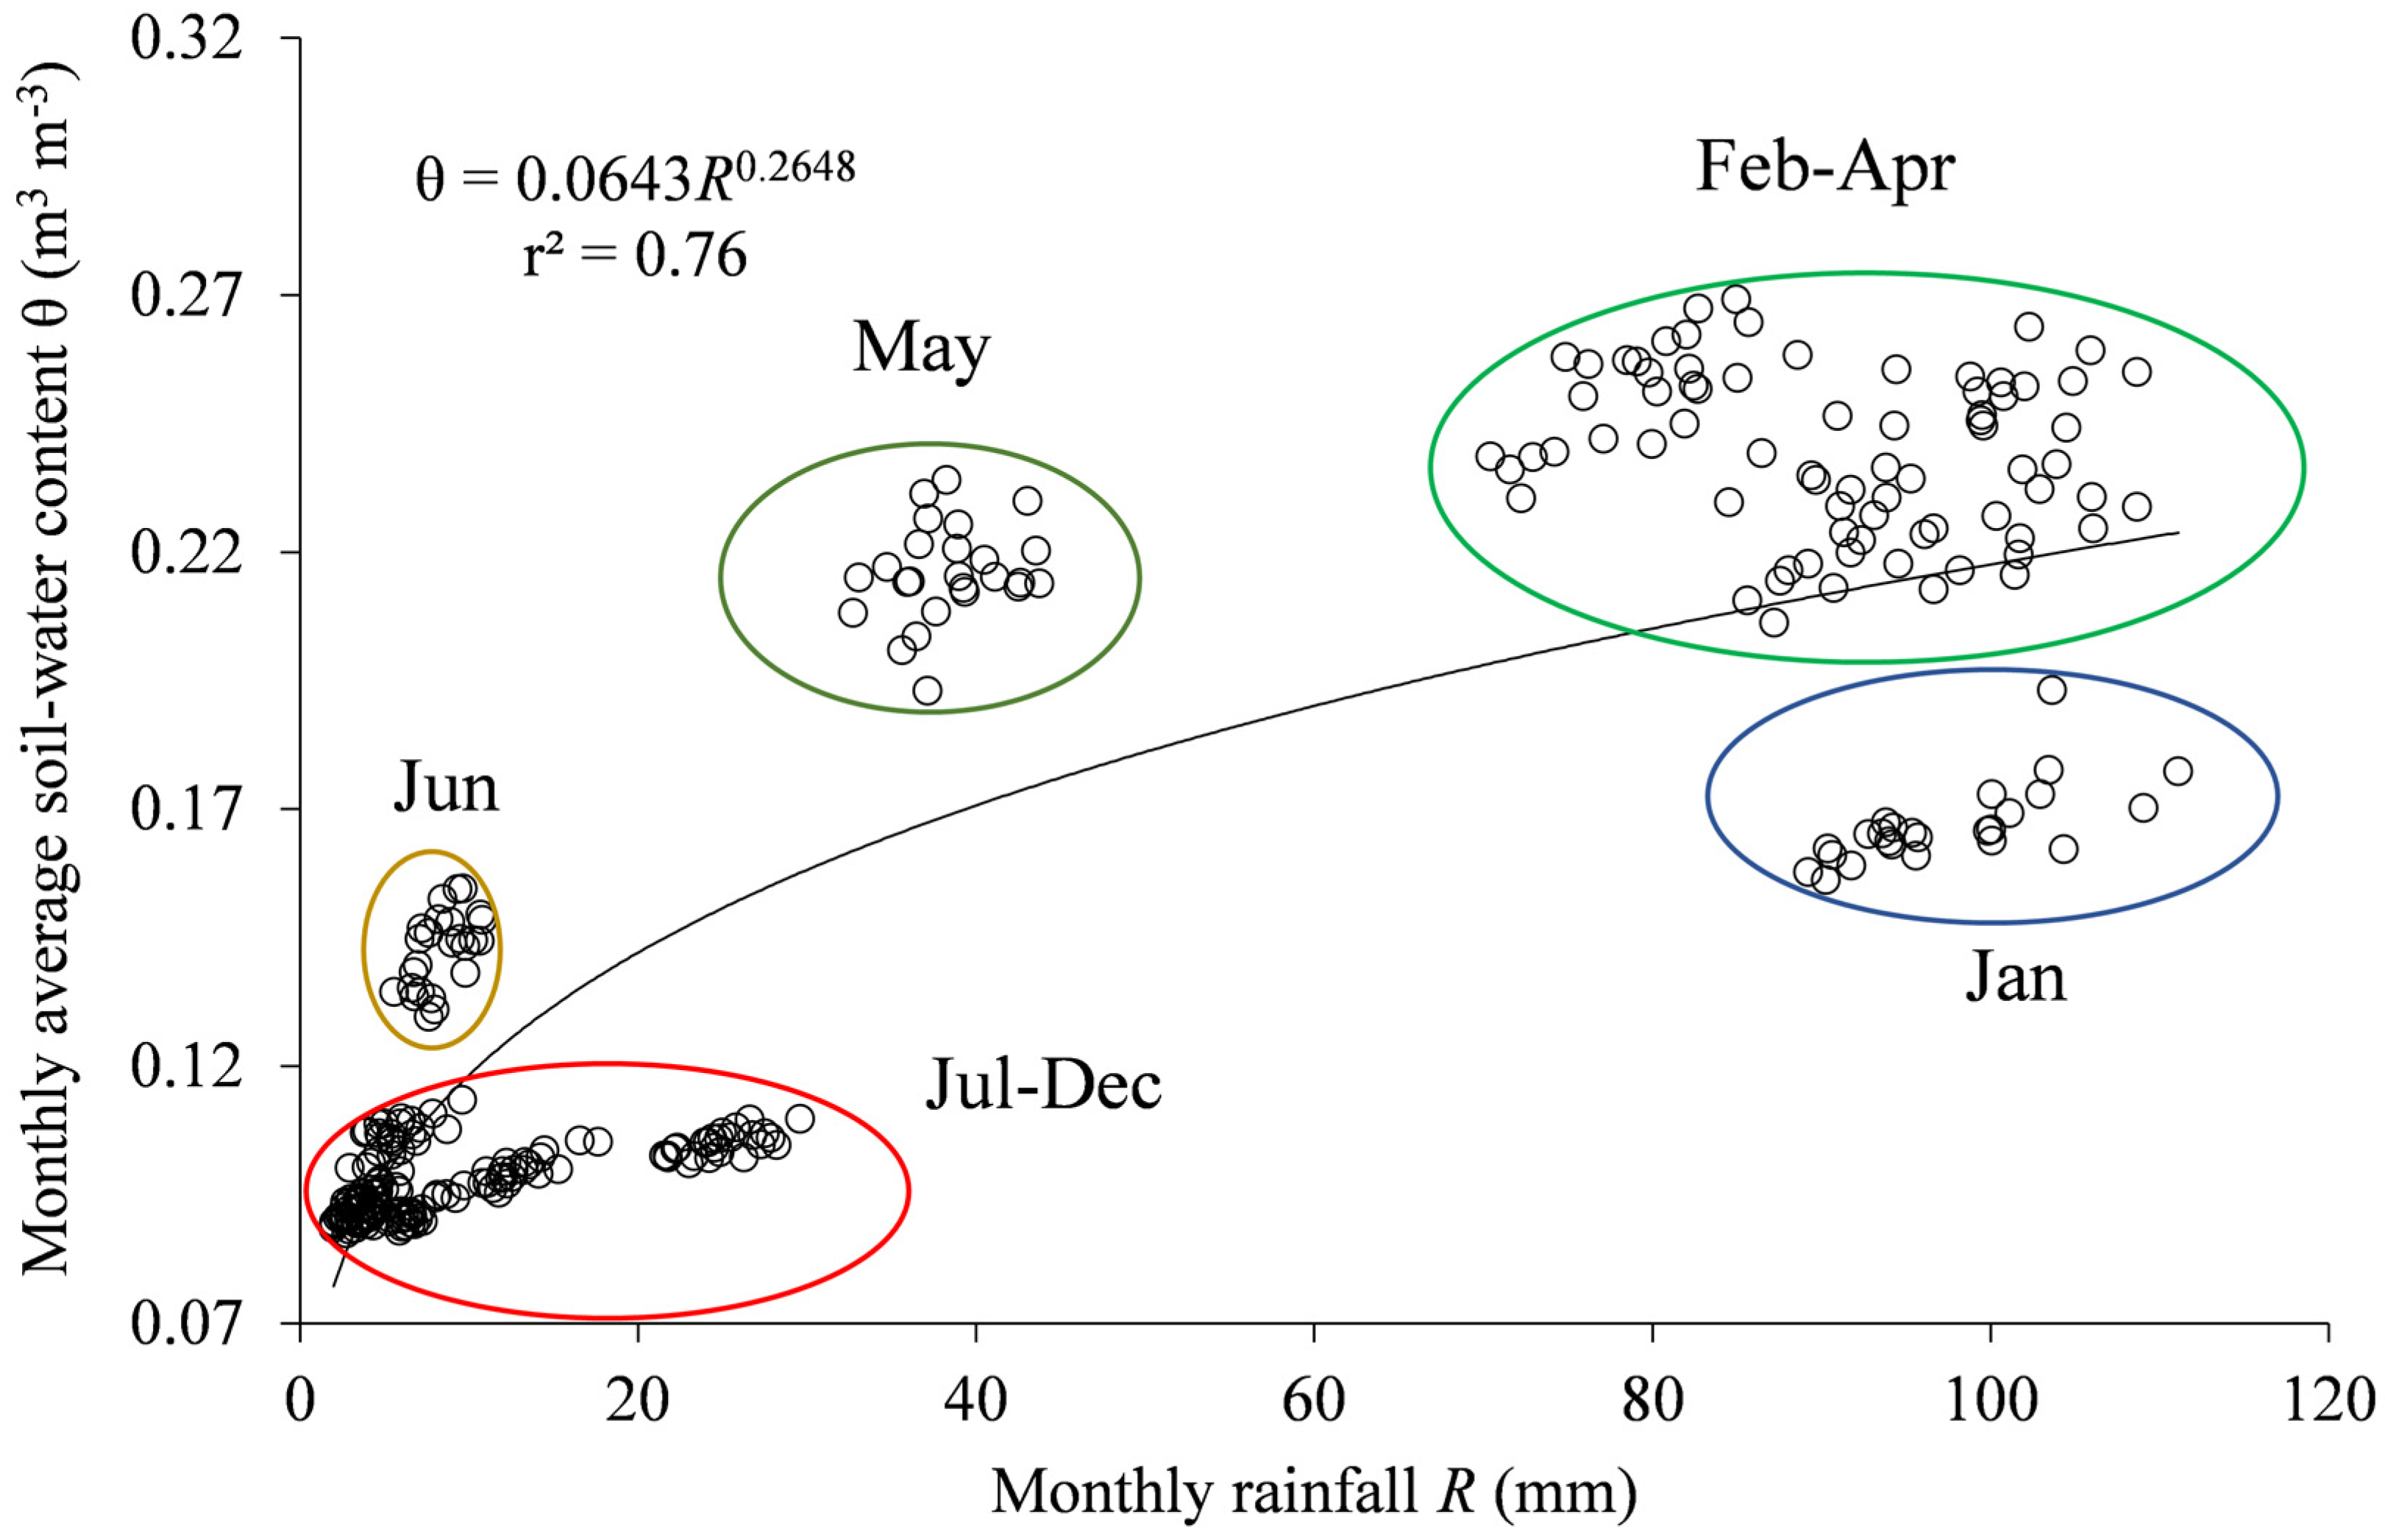
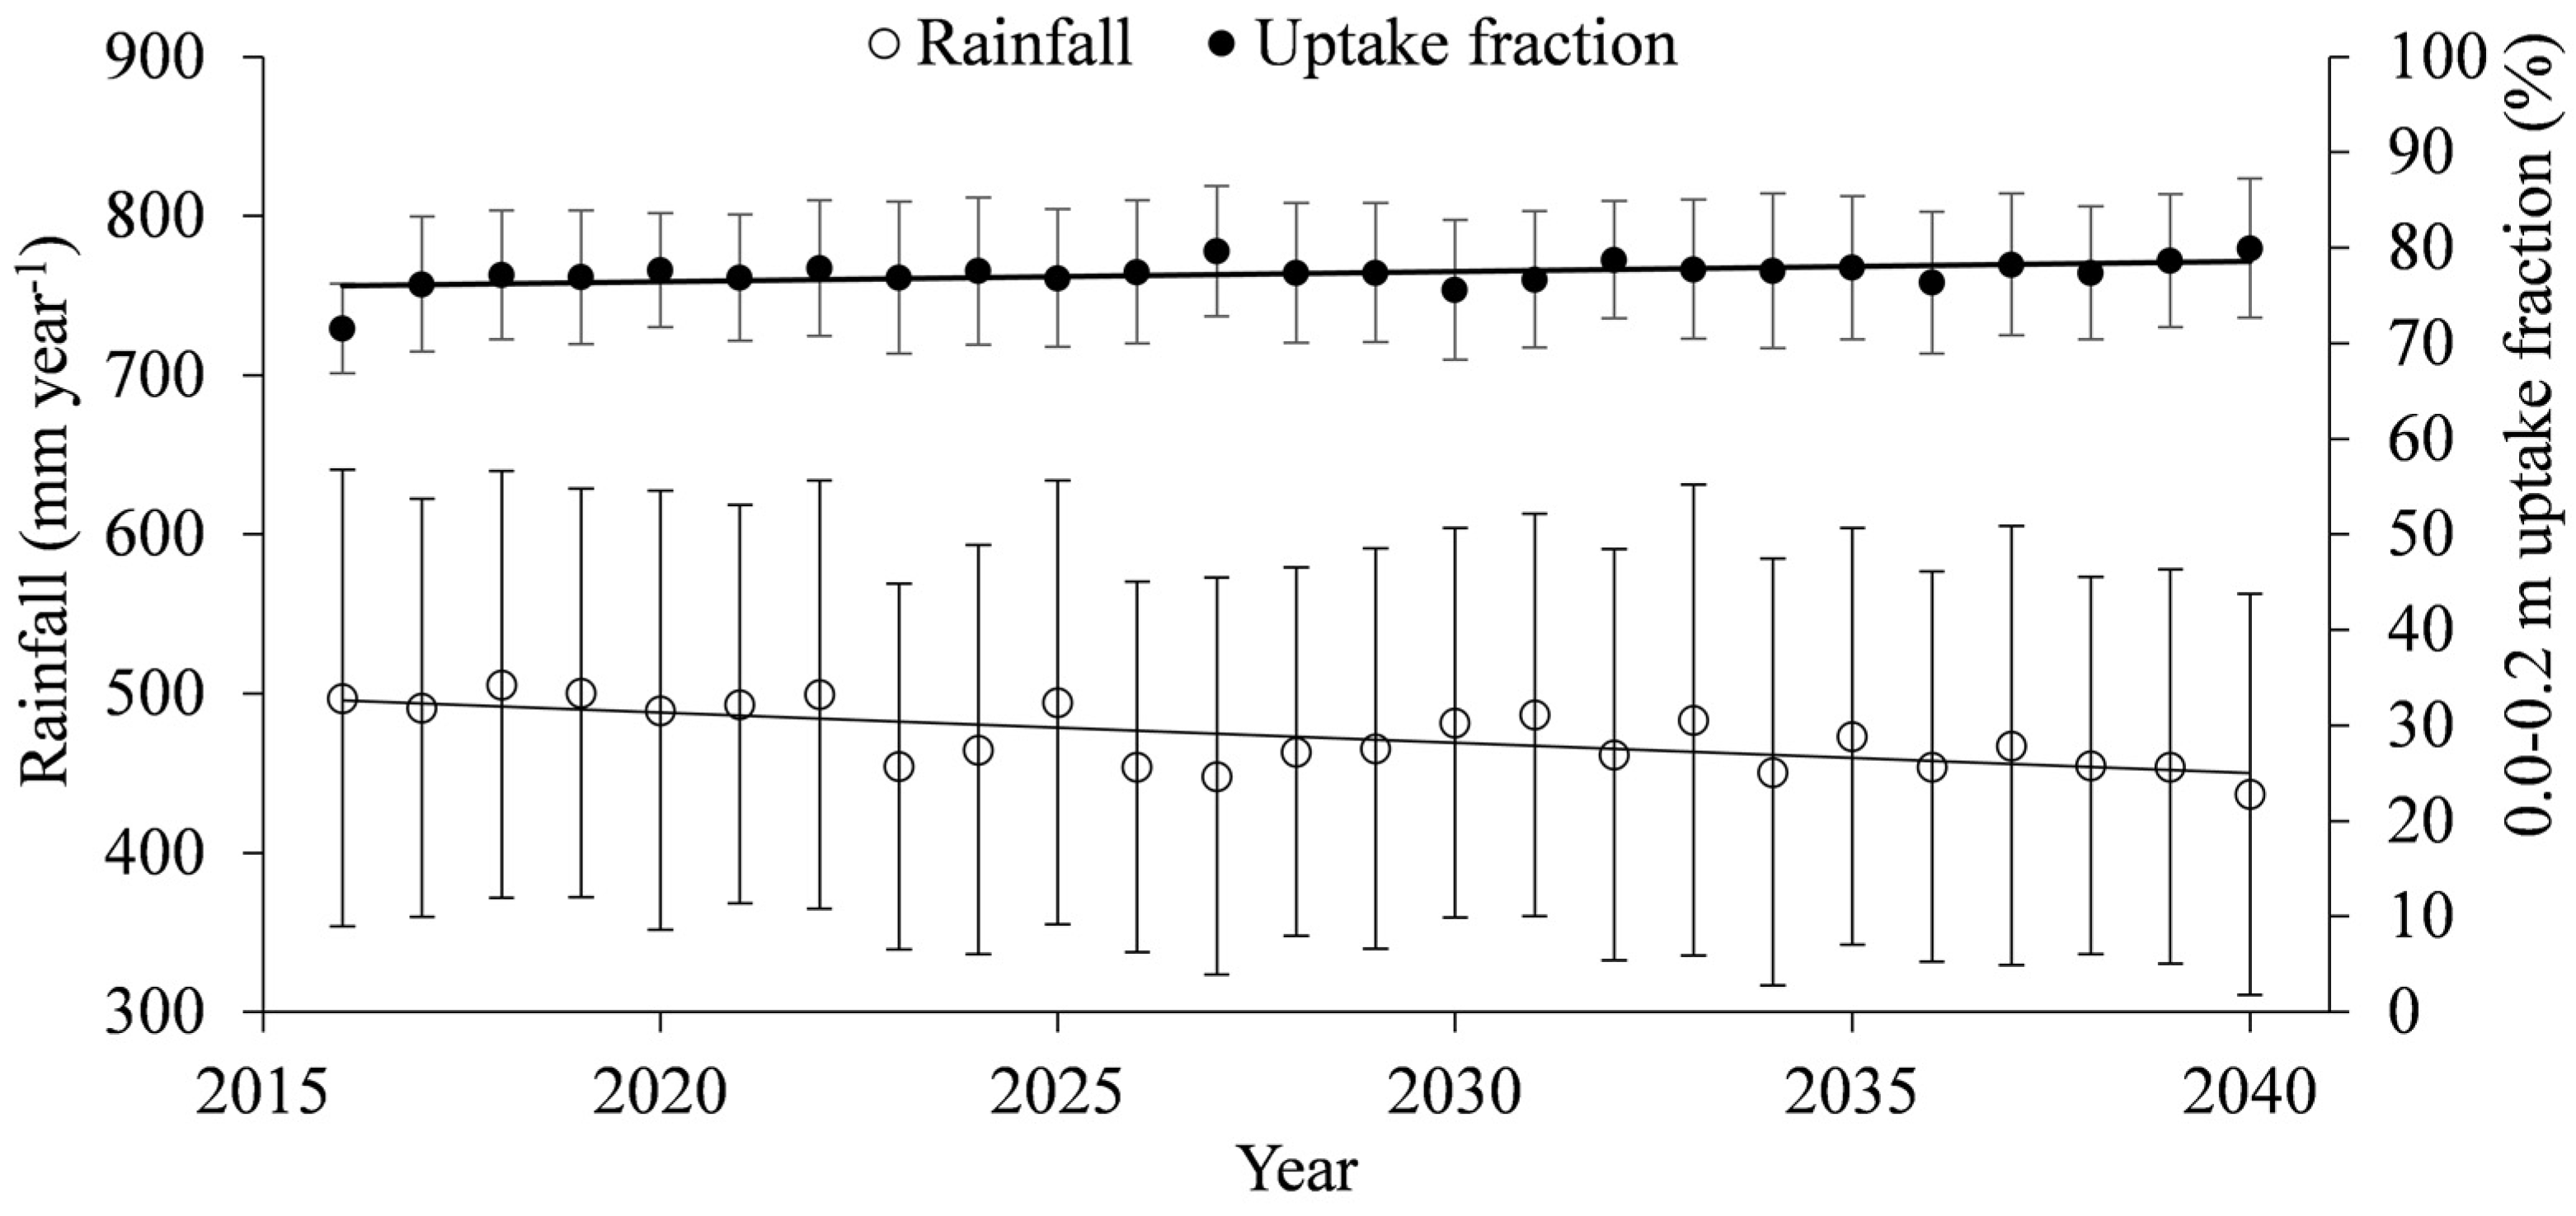
  • Regarding soil water availability, the soil-plant-atmosphere fluxes seem to be controlled by the top layer (0.0–0.2 m), which provides, on average, 80% of the total transpiration, suggesting that the Caatinga biome may become completely soil-water pulse dominated under scenarios of reduced water availability.

Acknowledgments

The authors are grateful to FAPESP (São Paulo Research Foundation) for sponsoring this research through the grant # 2013/08967-8.

Author Contributions

E.A.R.P. performed literature research, future climate generation, model runs and organized results and discussion. Q.d.J.v.L. created software to perform the stochastic analysis, reviewed earlier versions and added to the discussion. A.H.F.B. assisted in results compiling and added to the discussion.

Conflicts of Interest

The authors declare no conflict of interest.

References

  1. Salazar, L.F.; Nobre, C.A.; Oyama, M.D. Climate change consequences on the biome distribution in tropical South America. Geophys. Res. Lett. 2007, 34, 1–6. [Google Scholar] [CrossRef]
  2. Jasechko, S.; Sharp, Z.D.; Gibson, J.J.; Birks, S.J.; Yi, Y.; Fawcett, P.J. Terrestrial water fluxes dominated by transpiration. Nature 2013, 496, 347–350. [Google Scholar] [CrossRef] [PubMed]
  3. Sterling, S.M.; Ducharne, A.; Polcher, J. The impact of global land-cover change on the terrestrial water cycle. Nat. Clim. Chang. 2012, 3, 385–390. [Google Scholar] [CrossRef]
  4. Seneviratne, S.L.; Corti, T.; Davin, E.L.; Hirschi, M.; Jaeger, E.B.; Lehner, I.; Orlowsky, B.; Teuling, A.J. Investigating soil moisture-climate interactions in a changing climate: A review. Earth Sci. Rev. 2010, 99, 125–161. [Google Scholar] [CrossRef]
  5. Marengo, J.A.; Chou, S.C.; Kay, G.; Alves, L.M.; Pesquero, J.F.; Soares, W.R.; Santos, D.C.; Lyra, A.A.; Sueiro, G.; Betts, R.; et al. Development of regional future climate change scenarios in South America using the Eta CPTEC/HadCM3 climate change projections: Climatology and regional analyses for the Amazon, São Francisco and the Paraná River basins. Clim. Dyn. 2012, 38, 1829–1848. [Google Scholar] [CrossRef]
  6. Seneviratne, S.I.; Nicholls, N.; Easterling, D.; Goodess, C.M.; Kanae, S.; Kossin, J.; Luo, Y.; Marengo, J.; Mcinnes, K.; Rahimi, M.; et al. Changes in climate extremes and their impacts on the natural physical environment. In Managing the Risks of Extreme Events and Disasters to Advance Climate Change Adaptation: A Special Report of Working Groups I and II of the Intergovernmental Panel on Climate Change (IPCC); Field, C.B., Barros, V., Stocker, T.F., Qin, D., Dokken, D.J., Ebi, K.L., Mastrandrea, M.D., Mach, K.J., Planttner, G.K., Allen, S.K., et al., Eds.; Cambridge University Press: Cambridge, UK and New York, NY, USA, 2012; pp. 109–230. [Google Scholar]
  7. Allen, C.D.; Macalady, A.K.; Chenchouni, H.; Bachelet, B.; McDowell, N.; Vennetier, M.; Kitzberger, T.; Rigling, A.; Breshears, D.D.; Hogg, E.H.; et al. A global overview of drought and heat-induced tree mortality reveals emerging climate change risks for forests. For. Ecol. Manag. 2010, 259, 660–684. [Google Scholar] [CrossRef]
  8. Wang, L.; D’odorico, P.; Evans, J.P.; Eldridge, D.J.; McCabe, M.F.; Caylor, K.K.; King, E.G. Dryland ecohydrology and climate change: Critical issues and technical advances. Hydrol. Earth Syst. 2012, 16, 2585–2603. [Google Scholar] [CrossRef] [Green Version]
  9. Klein, T.; Yakir, D.; Buchmann, N.; Grünzweig, J.M. Towards an advanced assessment of the hydrological vulnerability of forests to climate change-induced drought. New Phytol. 2014, 3, 712–716. [Google Scholar] [CrossRef] [PubMed]
  10. Pinheiro, E.A.R.; Metselaar, K.; De Jong van Lier, Q.; de Araújo, J.C. Importance of soil water to the Caatinga biome, Brazil. Ecohydrology 2016, 9, 1313–1327. [Google Scholar] [CrossRef]
  11. Pinheiro, E.A.R.; Costa, C.A.G.; de Araújo, J.C. Effective root depth of the Caatinga Biome. J. Arid Environ. 2013, 89, 1–4. [Google Scholar] [CrossRef]
  12. Marengo, J.A.; Torres, R.R.; Alves, L.M. Drought in Northeast Brazil—Past, present, and future. Theor. Appl. Climatol. 2016. [Google Scholar] [CrossRef]
  13. Leal, I.R.; Da Silva, J.M.C.; Tabarelli, M.; Lacher, T.E., Jr. Changing the course of biodiversity conservation in the Caatinga of Northeastern Brazil. Conserv. Biol. 2005, 19, 701–706. [Google Scholar] [CrossRef]
  14. Peter, A.J.; de Araújo, J.C.; Araújo, N.A.M.; Hermann, H.J. Flood avalanches in a semiarid basin with a dense reservoir network. J. Hydrol. 2014, 512, 408–420. [Google Scholar] [CrossRef]
  15. D’odorico, P.; Bhattachan, A.; Davis, K.F.; Ravi, S.; Runyan, C.W. Global desertification: Drivers and feedbacks. Adv. Water Resour. 2013, 51, 326–344. [Google Scholar] [CrossRef]
  16. De Figueiredo, J.V.; de Araújo, J.C.; Medeiros, P.H.A.; Costa, A.C. Runoff initiation in a preserved semiarid Caatinga small watershed, Northeastern Brazil. Hydrol. Process. 2016, 30, 2390–2400. [Google Scholar] [CrossRef]
  17. Medeiros, P.H.A.; de Araújo, J.C. Temporal variability of rainfall in a semiarid environment in Brazil and its effect on sediment transport processes. J. Soils Sediments 2014, 14, 1216–1223. [Google Scholar] [CrossRef]
  18. Costa, C.A.G.; Lopes, J.W.B.; Pinheiro, E.A.R.; de Araújo, J.C.; Gomes Filho, R.R. Spatial behaviour of soil moisture in the root zone of the Caatinga biome. Rev. Ciên. Agron. 2013, 44, 685–694. [Google Scholar] [CrossRef]
  19. Güntner, A.; Krol, M.; de Araújo, J.C.; Bronstert, A. Simple water balance modeling of surface reservoir systems in a large data-scarce semiarid region. Hydrol. Sci. J. 2004, 49, 901–918. [Google Scholar] [CrossRef]
  20. Stöckle, C.O.; Campbell, G.S.; Nelson, R. ClimGen Manual; Biological Systems Engineering Department, Washington State University: Pullman, WA, USA, 1999; p. 28. [Google Scholar]
  21. Kroes, J.G.; van Dam, J.C.; Groenendijk, P.; Hendriks, R.F.A.; Jacobs, C.M.J. SWAP Version 3.2. Theory Description and User Manual; Wageningen: Alterra, The Netherlands, 2008; p. 262. [Google Scholar]
  22. Mualem, Y. A New model for predicting the hydraulic conductivity of unsaturated porous media. Water Resour. Res. 1976, 12, 513–522. [Google Scholar] [CrossRef]
  23. Van Genuchten, M.T. A closed-form equation for predicting the hydraulic conductivity of unsaturated soils. Soil Sci. Soc. Am. J. 1980, 44, 892–898. [Google Scholar] [CrossRef]
  24. De Jong van Lier, Q.; van Dam, J.C.; Metselaar, K.; de Jong, R.; Duijnisveld, W.H.M. Macroscopic Root Water Uptake Distribution Using a Matric Flux Potential Approach. Vadose Zone J. 2008, 7, 1065–1078. [Google Scholar] [CrossRef]
  25. De Jong van Lier, Q.; van Dam, J.C.; Durigon, A.; dos Santos, M.A.; Metselaar, K. Modeling water potentials and flows in the soil-plant system comparing hydraulic resistances and transpiration reduction functions. Vadose Zone J. 2013, 12, 1–20. [Google Scholar] [CrossRef]
  26. Gash, J.H.C. An analytical model of rainfall interception by forests. Q. J. R. Meteorol. Soc. 1979, 105, 43–55. [Google Scholar] [CrossRef]
  27. Medeiros, P.H.A.; de Araújo, J.C.; Bronstert, A. Interception measurement and assessment of Gash model performance for a tropical semi-arid region. Rev. Ciênc. Agron. 2009, 40, 165–174. [Google Scholar]
  28. Gourdiaan, J.; van Laar, H.H. Modelling Potential Crop Growth Processes, 2nd ed.; Kluwer Academic Publishers: Wageningen, The Netherlands, 1994; p. 238. [Google Scholar]
  29. Choat, B.; Jansen, S.; Brodribb, T.J.; Cochard, H.; Delzon, S.; Bhaskar, R.; Bucci, S.J.; Feild, T.S.; Gleason, S.M.; Hacke, U.G.; et al. Global convergence in the vulnerability of forests to drought. Nature 2012, 491, 752–755. [Google Scholar] [CrossRef] [PubMed]
  30. Raz-Yaseef, N.; Yakir, D.; Rotenberg, E.; Schiller, G.; Cohen, S. Ecohydrology of a semi-arid forest: Partitioning among water balance and its components implications for predicted precipitation changes. Ecohydrology 2010, 3, 143–154. [Google Scholar]
  31. Ohmura, A.; Wild, M. Is the hydrological cycle accelerating? Science 2002, 298, 1345–1346. [Google Scholar] [CrossRef] [PubMed]
  32. Peterson, T.C.; Golubev, V.S.; Groisman, P.Y. Evaporation losing its strength. Nature 1995, 377, 687–688. [Google Scholar] [CrossRef]
  33. Wild, M.; Ohmura, A.; Cubasch, U. GCM simulated surface energy fluxes in climate change experiments. J. Clim. 1997, 10, 3093–3110. [Google Scholar] [CrossRef]
  34. Lauenroth, W.K.; Schlaepfer, D.R.; Bradford, J.B. Ecohydrology of Dry Regions: Storage versus Pulse Soil Water Dynamics. Ecosystems 2014, 17, 1469–1479. [Google Scholar] [CrossRef]
  35. Schlesinger, W.H.; Jasechko, S. Transpiration in the global water cycle. Agric. For. Meteorol. 2014, 189–190, 115–117. [Google Scholar] [CrossRef]
  36. Gedney, N.; Cox, P.M.; Betts, R.A.; Boucher, O.; Huntingford, C.; Stott, A. Detection of a direct carbon dioxide effect in continental river runoff records. Nature 2006, 439, 835–838. [Google Scholar] [CrossRef] [PubMed]
  37. Field, C.B.; Jackson, R.B.; Mooney, H.A. Stomatal responses to increased CO2: Implications from the plant to the global-scale. Plant Cell Environ. 1995, 18, 1214–1225. [Google Scholar] [CrossRef]
  38. Nowak, R.S.; Zitzer, S.F.; Babcock, D.; Smith-Longozo, V.; Charlet, T.N.; Coleman, J.S.; Seemann, J.R.; Smith, S.D. Elevated atmospheric CO2 does not conserve soil water in the Mojave desert. Ecology 2004, 85, 93–99. [Google Scholar] [CrossRef]
  39. Liu, Y.; Xu, Z.; Duffy, R.; Chen, W.; An, S.; Liu, S.; Liu, F. Analyzing relationships among water uptake patterns, rootlet biomass distribution and soil water content profile in a subalpine shrubland using water isotopes. Eur. J. Soil Biol. 2011, 47, 380–386. [Google Scholar] [CrossRef]
  40. Raz-Yaseef, N.; Yakir, D.; Schiller, G.; Cohen, S. Dynamics of evapotranspiration partitioning in a semi-arid forest as affected by temporal rainfall patterns. Agric. For. Meteorol. 2012, 157, 77–85. [Google Scholar] [CrossRef]
  41. Gaines, K.P.; Stanley, J.W.; Meinzer, F.C.; McCulloh, K.A.; Woodruff, D.R.; Chen, W.; Adams, T.S.; Lin, H.; Eissenstat, D.M. Reliance on shallow soil water in a mixed-hardwood forest in central Pennsylvania. Tree Physiol. 2015. [Google Scholar] [CrossRef] [PubMed]
  42. Adiku, S.G.K.; Rose, C.W.; Braddock, R.D.; Ozier-Lafontaine, H. On the simulation of root water extraction: Examination of a minimum energy hypothesis. Soil Sci. 2000, 165, 226–236. [Google Scholar] [CrossRef]
  43. Jackson, R.B.; Sperry, J.S.; Dawson, T.E. Root water uptake and transport: Using physiological processes in global predictions. Trends Plant Sci. 2000, 5, 482–488. [Google Scholar] [CrossRef]
  44. Bucci, S.J.; Scholz, F.G.; Goldstein, G.; Meinzer, F.C.; Arce, M.E. Soil water availability and rooting depth as determinants of hydraulic architecture of Patagonian woody species. Oecologia 2009, 160, 631–641. [Google Scholar] [CrossRef] [PubMed]
  45. Kelly, C.K.; Chase, M.W.; de Bruijn, A.; Fay, M.F.; Woodward, F.I. Temperature-based population segregation in birch. Ecol. Lett. 2003, 6, 1–3. [Google Scholar] [CrossRef]
  46. Jump, A.; Peñuelas, J. Running to stand still: Adaptation and response of plants to rapid climate change. Ecol. Lett. 2005, 8, 1010–1020. [Google Scholar] [CrossRef]
  47. Challinor, A.J.; Koehler, A.K.; Ramirez-Villegas, J.; Whitfield, S.; Das, B. Current warming will reduce yields unless maize breeding and seed systems adapt immediately. Nat. Clim. Chang. 2016. [Google Scholar] [CrossRef]
  48. Waring, R.H.; Coops, N.C. Predicting large wildfires across western North America by modeling seasonal variation in soil water balance. Clim. Chang. 2016, 135, 325–339. [Google Scholar] [CrossRef] [PubMed]
  49. Krueger, E.S.; Ochsner, T.E.; Engle, D.M.; Carlson, J.D.; Twidwell, D.; Fuhlendorf, S.D. Soil moisture affects growing-season wildfire size in the Southern Great Plains. Soil Sci. Soc. Am. J. 2015, 79, 1567–1576. [Google Scholar] [CrossRef]
  50. Running, S.W. Is global warming causing more, larger wildfires? Science 2006, 313, 927–928. [Google Scholar] [CrossRef] [PubMed]
Figure 1. Geographical location of the Aiuaba Experimental Basin (AEB) and its subdivision into Soil and Vegetation Associations (SVA), showing the position of rivers and sampling site for soil hydraulic properties.
Forests 08 00062 g001
Figure 2. Mean annual rainfall and air temperature together with trendlines ± standard deviations of 100 stochastic daily data series associated with rainfall reduction and air temperature increase simulated for 2016–2040 relative to 1990–2015.
Forests 08 00062 g002
Figure 3. Mean annual actual transpiration, actual soil evaporation and interception losses with their 95% confidence levels and trendlines.
Forests 08 00062 g003
Figure 4. Annual rainfall and fraction of total transpired water taken up from the 0.0–0.2 m soil layer, together with respective standard deviations. Results obtained from stochastic simulations. Trendlines obtained by linear fitting to average values.
Forests 08 00062 g004
Figure 5. Monthly average soil water content θ at depth 0–0.2 m, together with monthly rainfall R. r2 is the coefficient of determination.
Forests 08 00062 g005
Figure 6. Average monthly soil water pressure head (h) of 100 realizations at four depths (0.1; 0.3; 0.6 and 0.8 m) together with monthly rainfall (A). Soil water pressure head at 0.1 m depth along the year, average for the simulated period and first (2016) and last (2040) simulated year (B).
Forests 08 00062 g006
Figure 7. Mean annual actual evapotranspiration (TEI), deep drainage (D) and rainfall (R) over time (A) together with relationships between TEI and D with mean annual rainfall (B).
Forests 08 00062 g007
Table 1. Main soil and vegetation parameters for the studied site.
General Parameterization
ParameterValueSource
hroot (m)−160[10]
Rood radius (m)4.3 × 10⁻⁴[10]
Canopy albedo (–)0.16[10]
Soil albedo (–)0.24[10]
LAI range (–)0.04–1.3According to Equations (3) and (4)
k (–)0.75[25]
Kc range (–)0.98–1.1According to Equation (2)
Ref (m)0.78[11]
Soil-depth dependent parameterization
ParameterSoil-layer thickness (m)
0.0–0.20.2–0.40.4–0.60.6–0.8
θr (m3·m−3)0.0000.0000.0000.000
θs (m3·m−3)0.4180.4400.4330.415
α·(m−1)6.822.524.913.9
n (–)1.211.861.1621.170
Ks (m·day−1)2.222.50.360.16
RLD (m·m−3)3700280020001600
hroot—wilting point; LAI—leaf area index; k—light extinction coefficient; Kccrop factor; Ref—effective root depth; θr, θs, α, n and Ks according to the van Genuchten equation; RLD—root length density.

