3.1. Response Rate and Owner Demographics
A total of 847 questionnaires were completed and returned for a 53% response rate. Of the 847 responses, 400 (47.2%) indicated they were logging business owners. Data reported here are from the 400 logging business owner responses. Based on VDOF harvest notification data [
13], if we assume there are a maximum of approximately 1000 active logging businesses, then survey responses would represent about 40% of all logging businesses in Virginia. Logging businesses included both full-time (87%) as well as part-time (13%) logging operations. Virginia logging business owners were predominantly men (99.5%), with an average age of 51.2 years (standard deviation (SD) = 12.3). Respondents indicated they had been operating their own logging business for an average of 22.6 years (SD = 13.9). The majority (91.2%) indicated they were White/Caucasian, with 8.3% Black/African American and 0.5% other. Owner demographics are similar to those from the 2009 survey [
11]; however, the average age shows an increase from 48.6 years in 2009 to 51.2 in 2014.
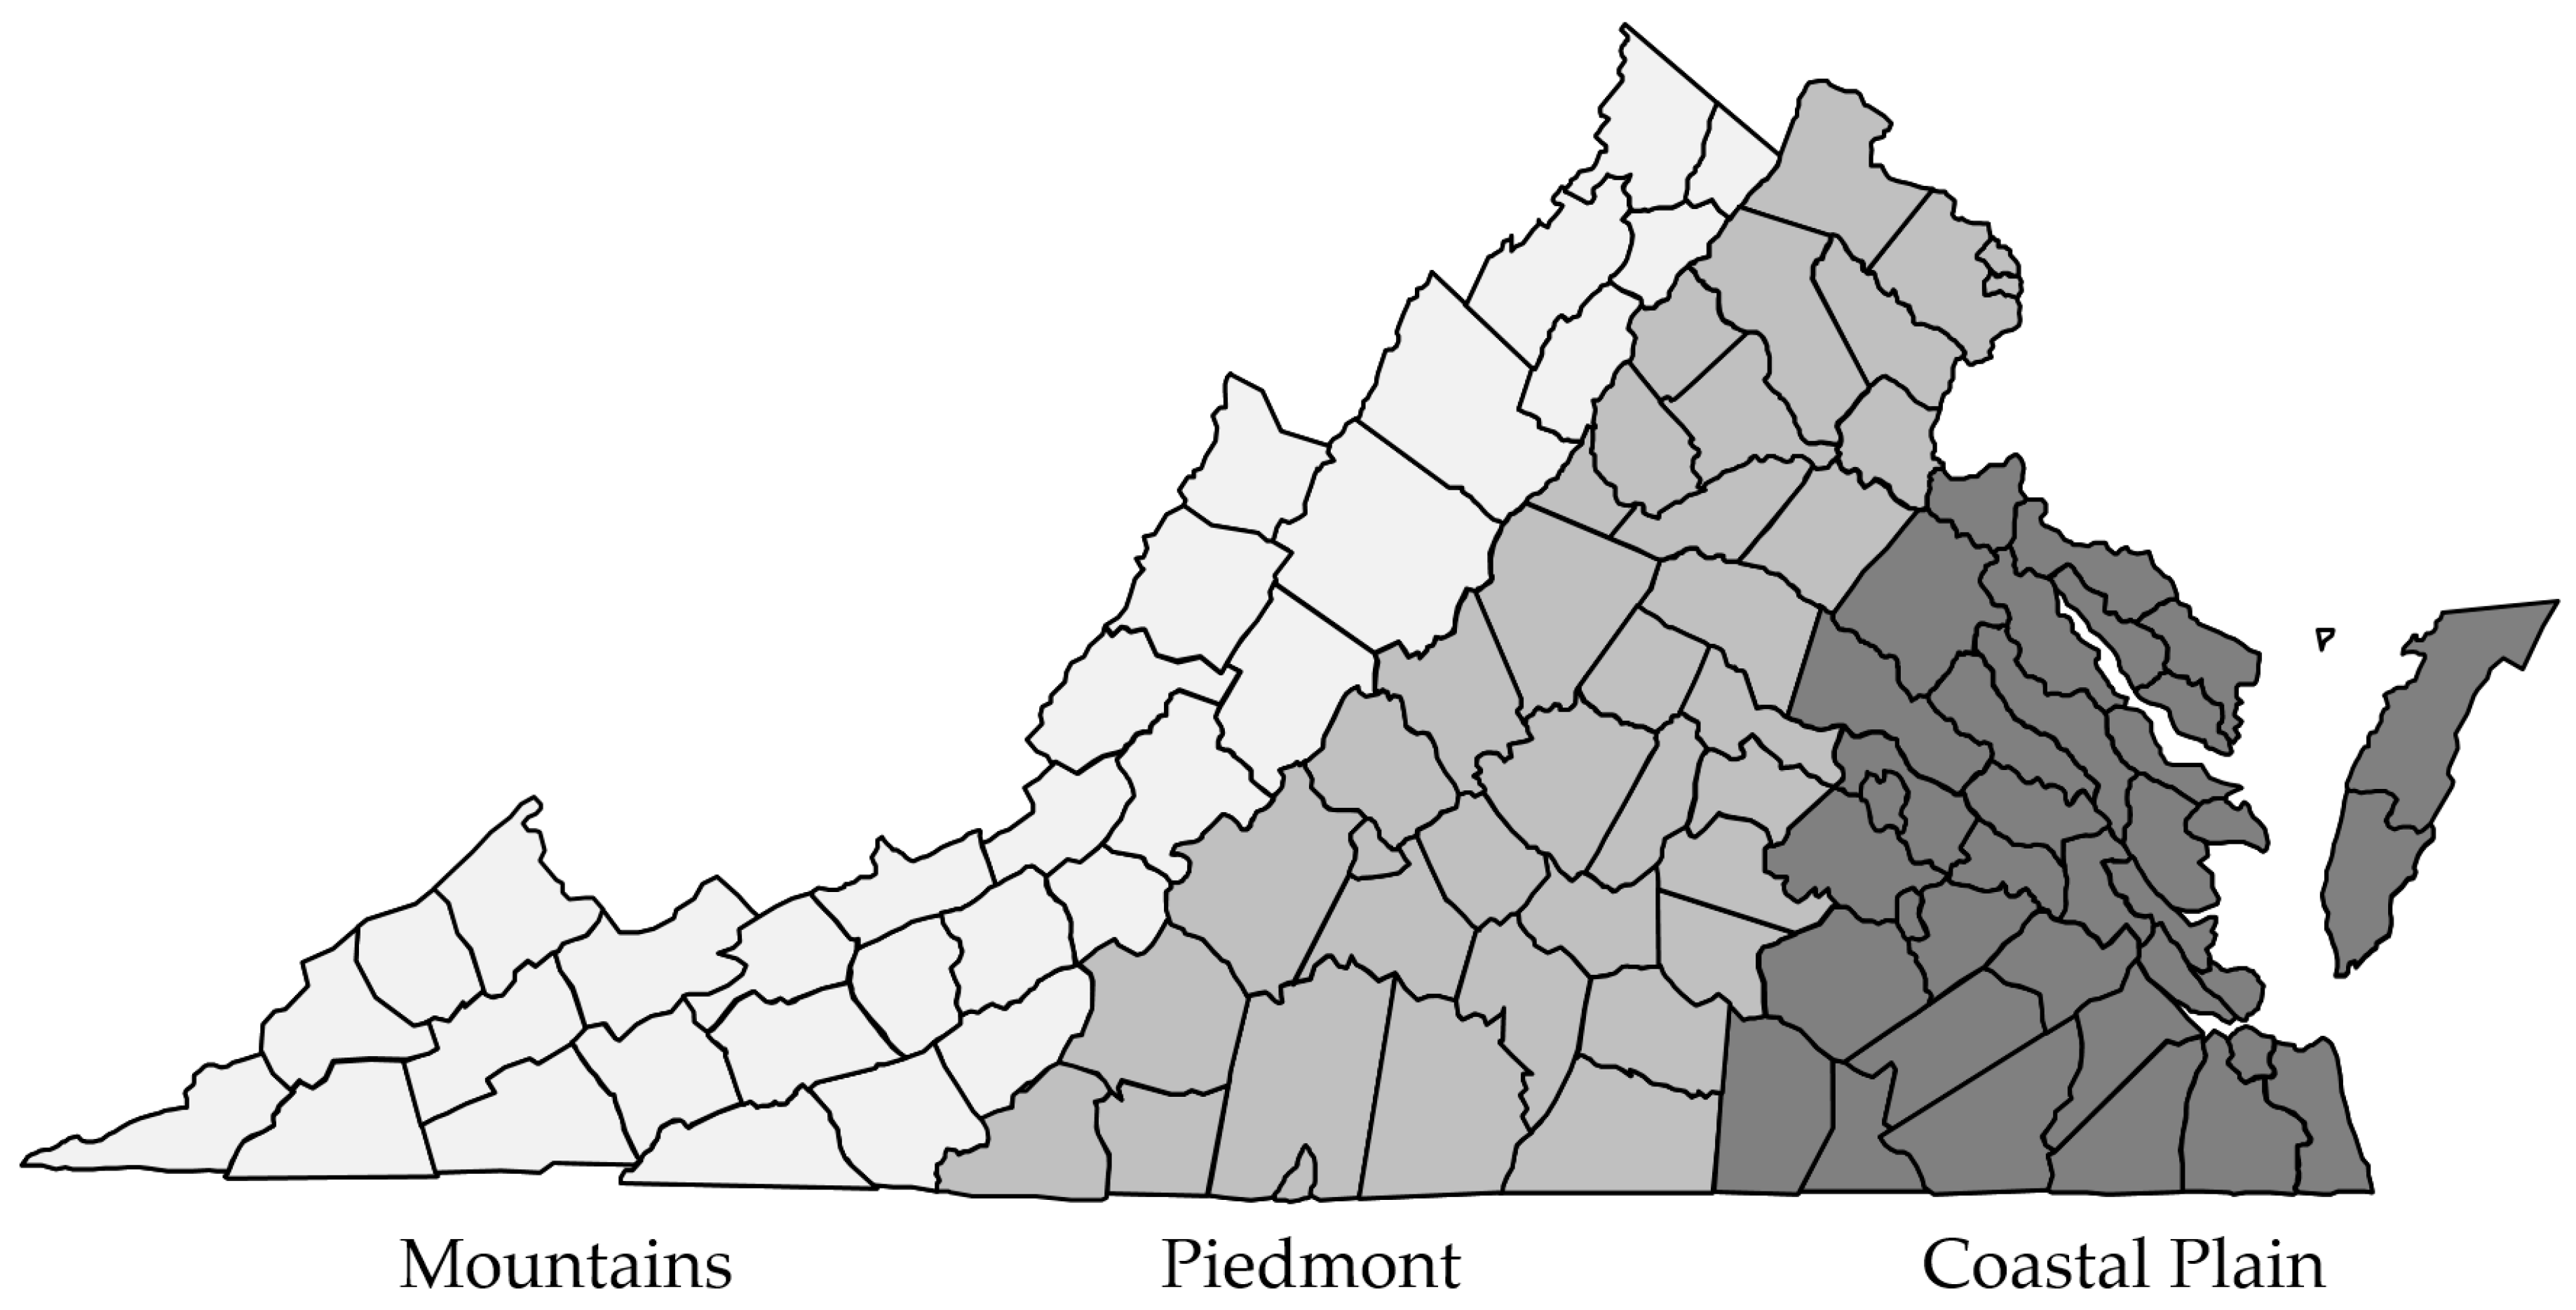
Respondents represented logging businesses operating across all three physiographic regions of Virginia including the Mountains (105), Piedmont (192), and Coastal Plain (70), as well as adjoining states (24); in some cases they did not specify a region (9). These three physiographic regions of Virginia would be similar to physiographic regions occurring throughout much of the Southeastern USA. Owners were asked to indicate their level of formal education. Across all regions, high school graduates were the most common (
Table 1). Business owners in the Coastal Plain tended to have the highest level of formal education, with 26.1% indicating they were college graduates.
3.2. Harvest Types and Tract Characteristics
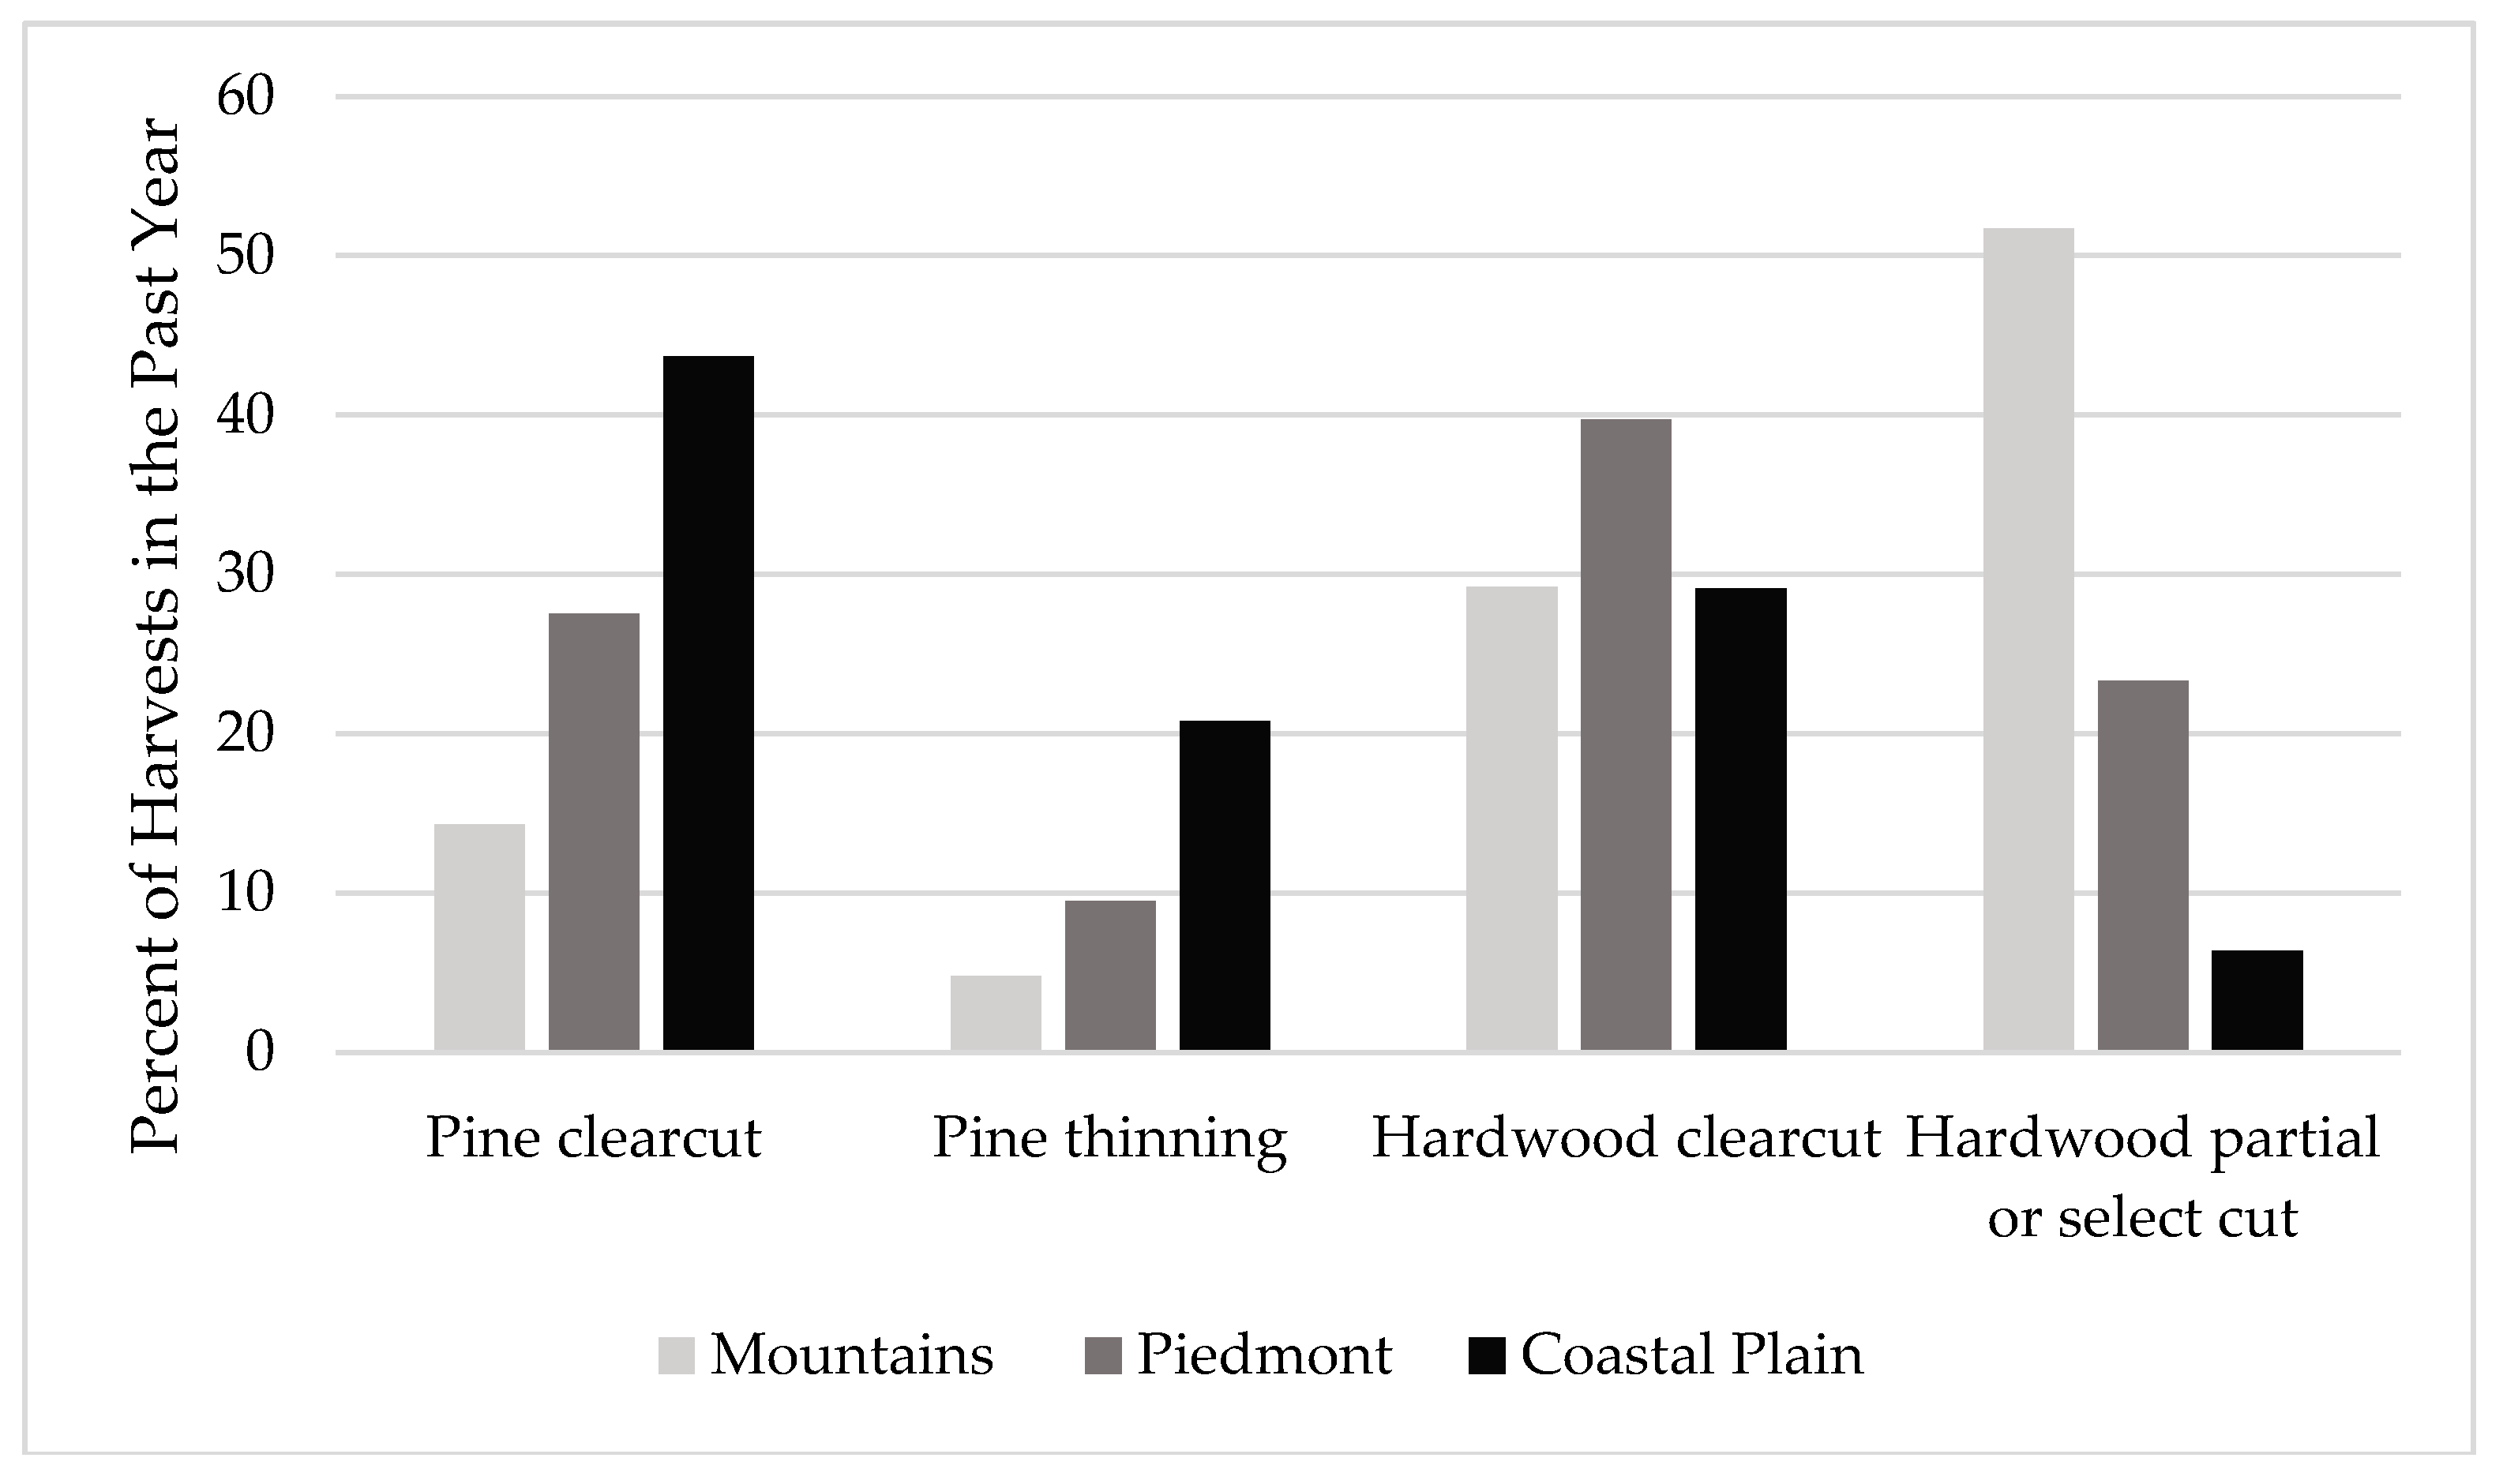
Respondents were asked to report the type of harvests they performed over the past year (
Figure 2). Similar to the 2009 survey of Virginia loggers [
11], the highest percentage of harvests reported in the Mountains were hardwood selection cuts. However this survey showed that the most common harvest type in the Coastal Plain was a pine clearcut, whereas in 2009 it was a pine thinning [
11].
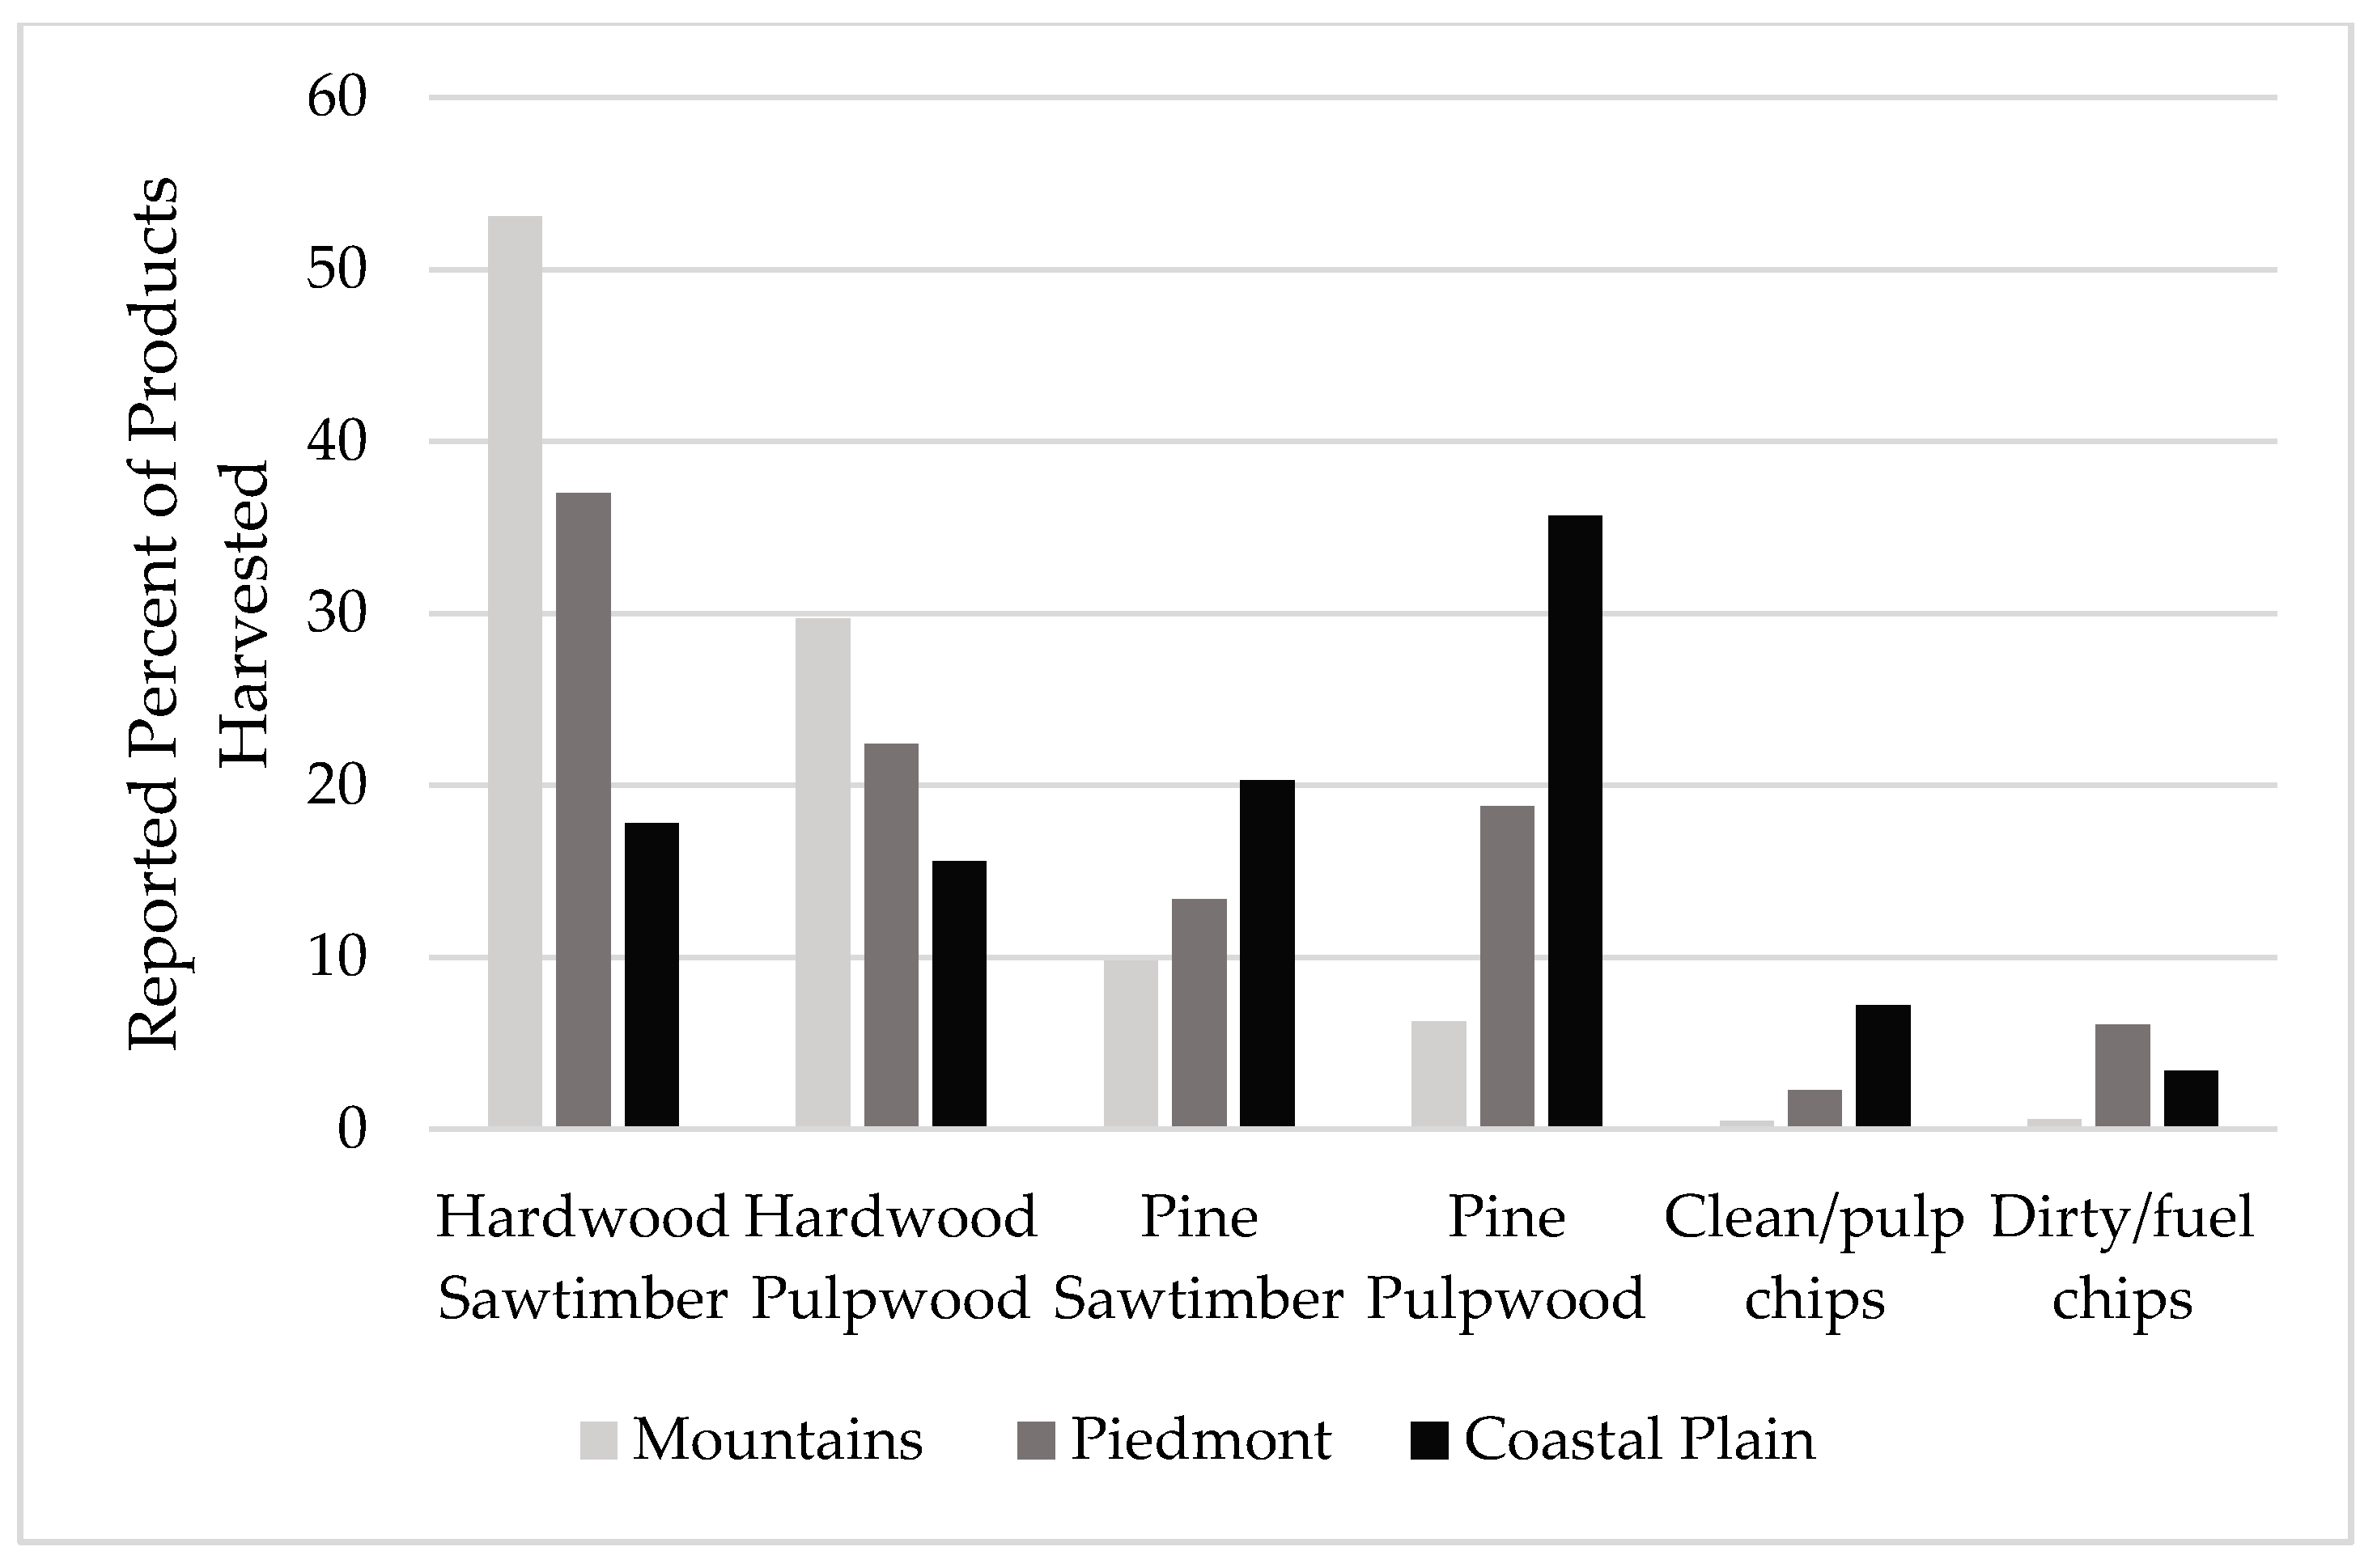
As expected, based on the most prevalent types of harvests reported (
Figure 2), the primary product harvested in the Mountains was hardwood sawtimber while in the Coastal Plain, the most commonly reported product harvested was pine pulpwood (
Figure 3). The most commonly reported average hauling distance for their primary product was between 20 and 60 miles and the most commonly reported distance moved between tracts was 20–40 miles.
Across all regions, the most commonly reported average harvest size over the past year was 40–80 acres. These harvests occur predominantly on forestland owned by private individuals. Harvests on forest industry owned land represented a relatively small portion of all harvests, with 5.2% or less of harvests in any region (
Table 2).
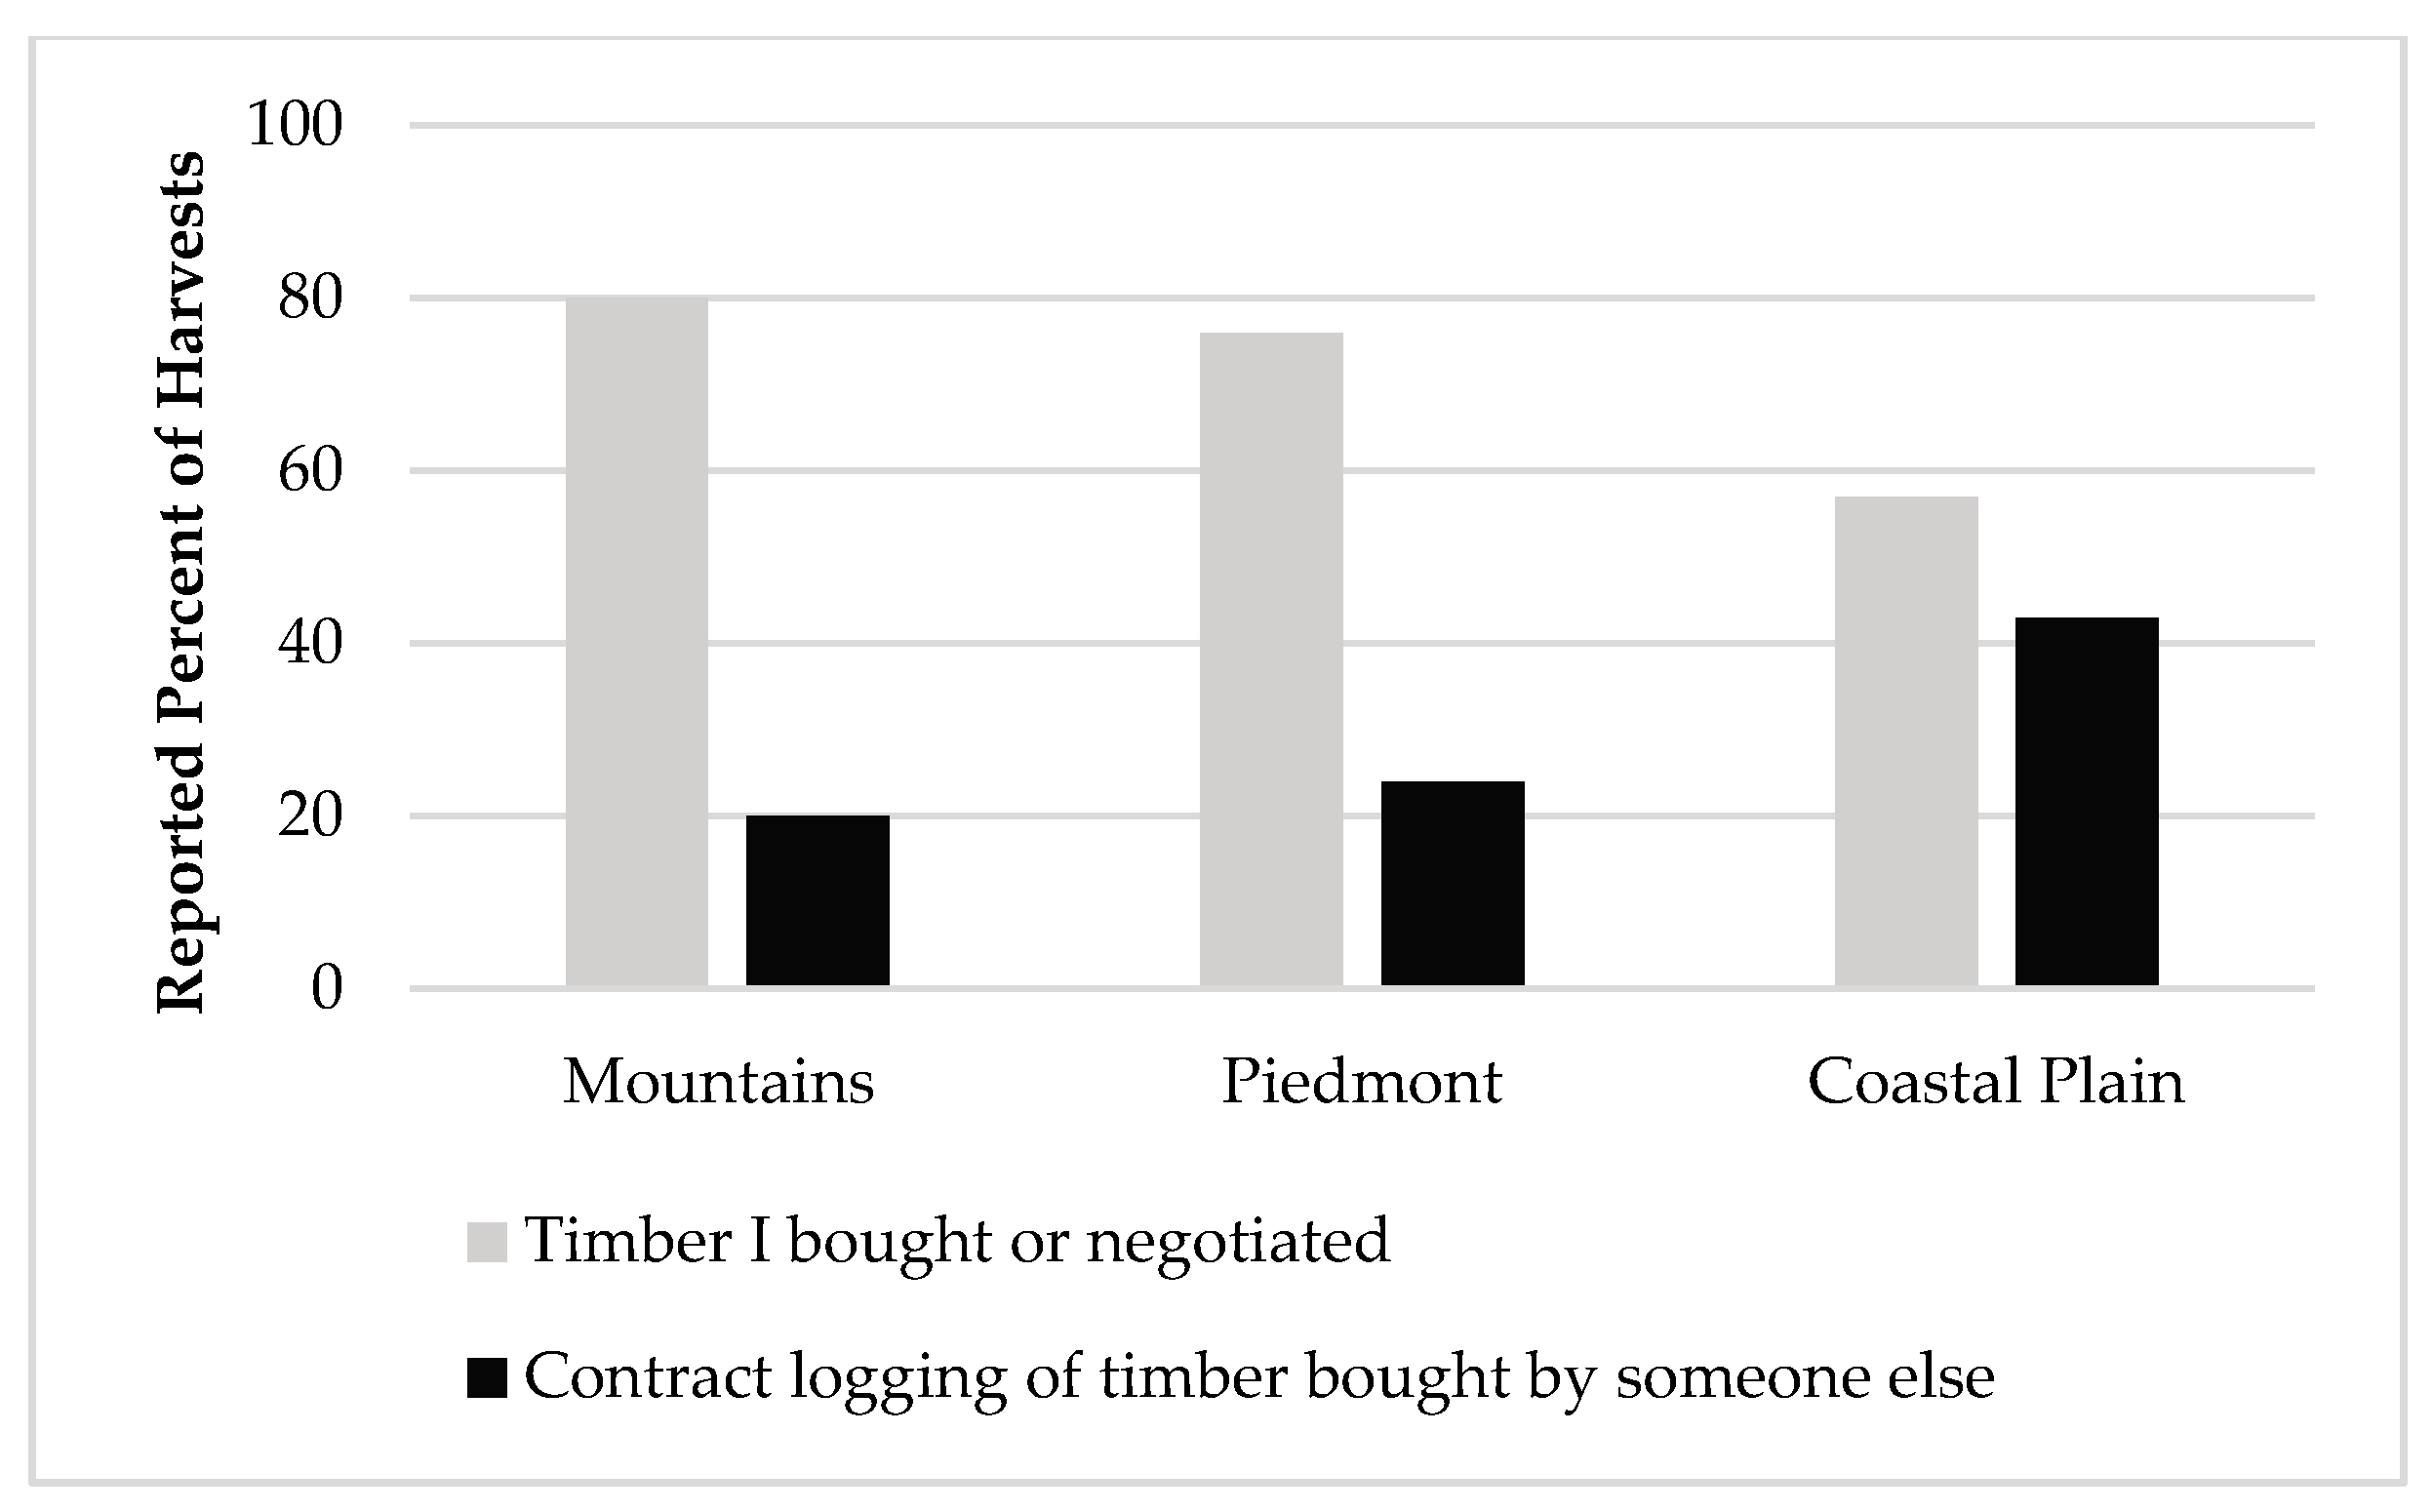
The way loggers acquired the timber they harvested varied by region as well. Business owners were asked to indicate the percent of their harvests in the past year that derived from timber where they bought or negotiated the sale directly, and the percent that was contract logging of timber bought by someone else. The majority of harvests across all regions were bought or negotiated directly by the logger. The coastal plain had the highest reported percentage of sales where the logger was contract logging timber that was bought by someone else (
Figure 4).
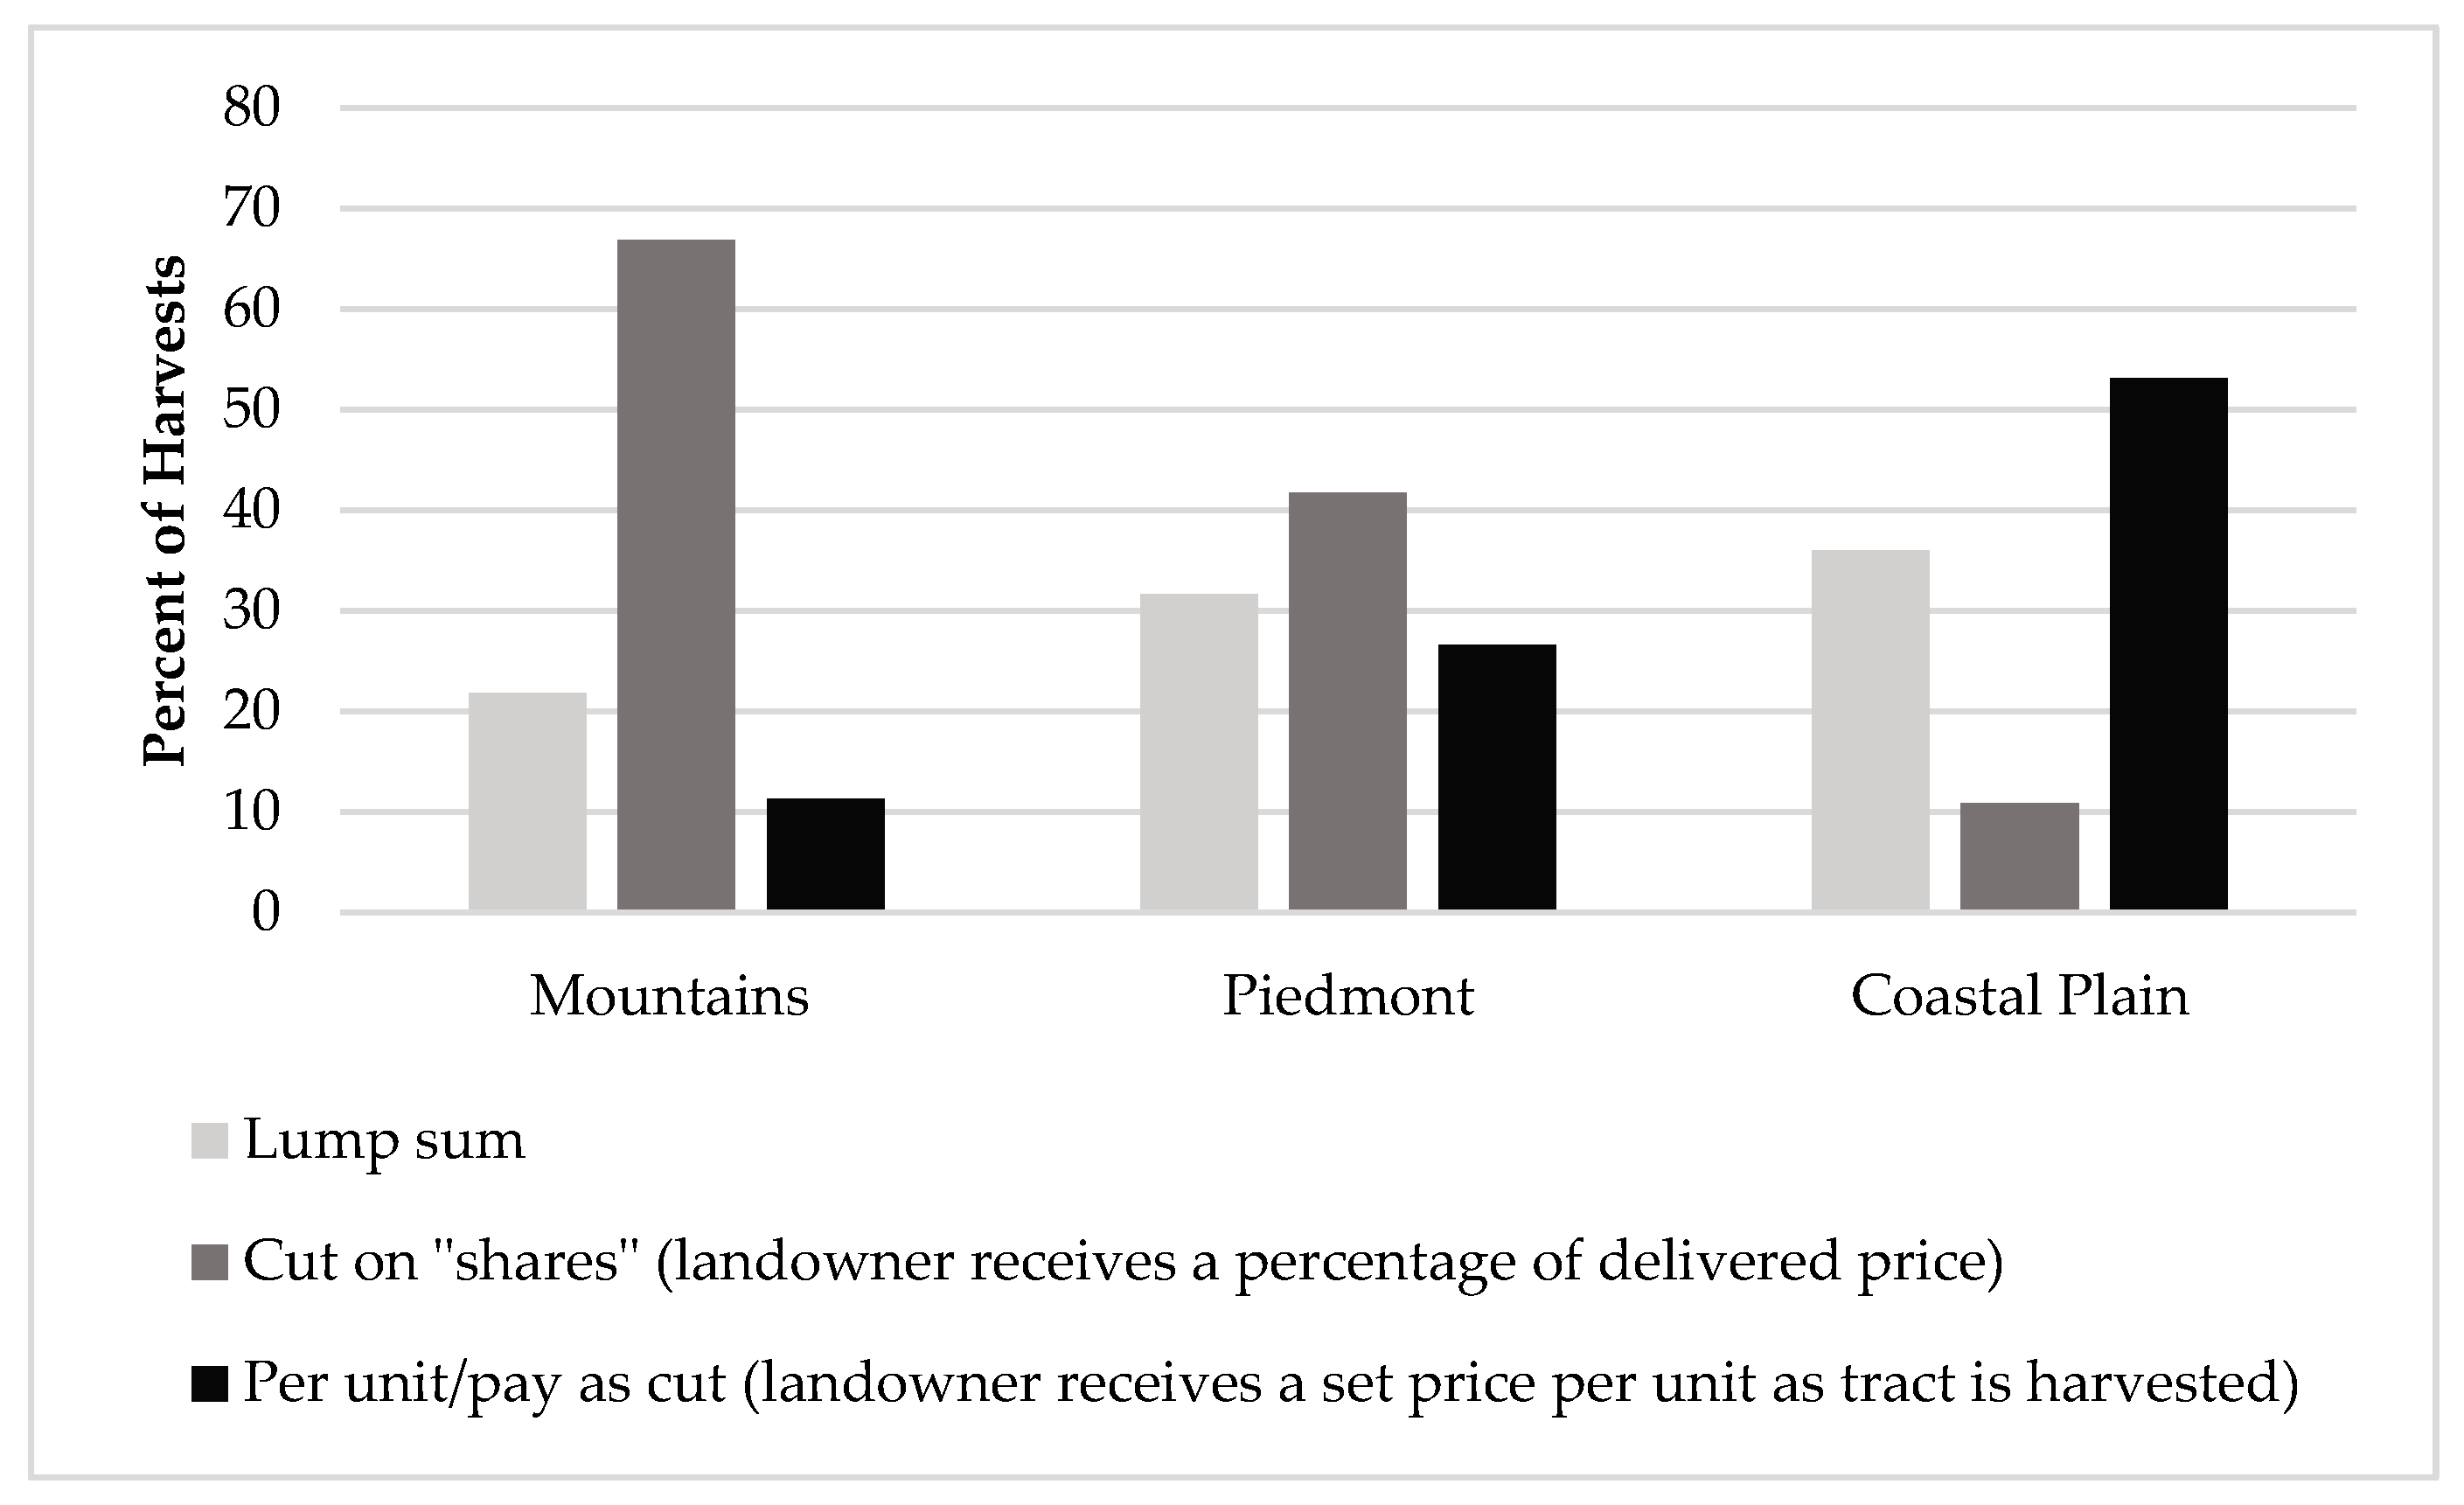
For those sales where the logger indicated that they bought the timber, they were asked specifically how the timber was purchased. Options for the type of sale included lump sum, cut on “shares,” which was defined as the “landowner receives a set percentage of delivered price received as the tract is harvested,” or per unit/pay as cut. Per unit sales were defined as “landowner receives a set price per ton/MBF (thousand board feet) for each ton/MBF as tract is harvested.” In the Mountains, the majority of sales were cut on “shares,” whereas in the Coastal Plain the majority of sales were per unit/pay as cut (
Figure 5).
3.3. Harvesting System and Production Characteristics
The majority of harvests reported were on forestland owned by private individuals (
Table 2). Forest landowners often rely on harvests to meet their forest management objectives. Without a viable logging workforce capable of implementing multiple types of harvests, many landowners would not be able to meet their forest management objectives. The production level and type of equipment utilized on a logging operation are two important factors for determining the capabilities of a logging operation. Awareness of the characteristics and types of logging businesses within a region and the equipment they utilize can help forest managers select the most appropriate operation to meet their forest harvesting and management objectives.
Logging business owners were asked to report production in terms of loads or tons produced per crew per week, and number of crews owned. Values reported in loads per week were converted to tonnes per week based on average payloads for the trucking configuration they most commonly used. Tonnes per business per week was based on production per crew and the number of crews owned per business. Total reported production in the three regions was 240,727 tonnes per week with the majority of the total production reported in the Piedmont region (57.9%) and only 8.9% from the Mountains (
Table 3). There were considerable differences in average production rates by region. Production in terms of t/crew/week and t/business/week both showed significant differences between regions (
P < 0.0001). The Coastal Plain had the highest average tonnes per business per week (1403.55), tonnes per crew per week (864.01), and also had more crews per business (1.48). Compared to reported production values from the 2009 survey [
11], the overall average number of crews per business increased from 1.16 to 1.20. The number of crews per business stayed the same in the Mountains, but increased in the Piedmont (from 1.12 to 1.2) and Coastal Plain (from 1.43 to 1.48). The number of workers per crew was nearly identical to 2009 levels in the Mountains and Piedmont and decreased from an average of 4.21 to 4.16 in the Coastal Plain. Production levels in 2009 were reported in loads per week with a statewide average of 20.42 loads per crew per week. If we assumed this production was entirely from tractor-trailers (highest average payloads) with a payload of 22.7 t/load (25 tons) then that would be 463.1 t/crew/week. Assuming tractor-trailer payloads for all production would result in the highest possible production levels from the 2009 survey results, which is still lower than the 2014 calculated overall average production level of 530.9 t/crew/week. Increases in production per crew since the 2009 survey could be from increased mechanization and overall efficiency, but are also likely a result of improved markets and increased demand following the recession, which likely impacted operations during the previous survey timeframe.
Business owners were asked to estimate the total current value for all logging equipment used for producing wood (excluding trucks and trailers). We used a method similar to Baker and Greene’s [
10] to evaluate production in terms of annual tonnes per
$1000 investment and found an overall average of approximately 112.6 tonnes per
$1000 investment. This was highest in the Coastal Plain at over 125 tonnes annually per
$1000 investment (
Table 3). Baker and Greene [
10] looked only at feller-buncher/grapple skidder crews in Georgia between 1987 and 2007 and reported values for tonnes per
$1000 investment that ranged between 112 and 165. They calculated a value for logging equipment based on reported equipment type and age, whereas we asked respondents to estimate the value of their equipment. However, the results are similar to their findings, especially in the Coastal Plain, which predominantly uses feller-buncher/grapple skidder operations.
Reported production levels (
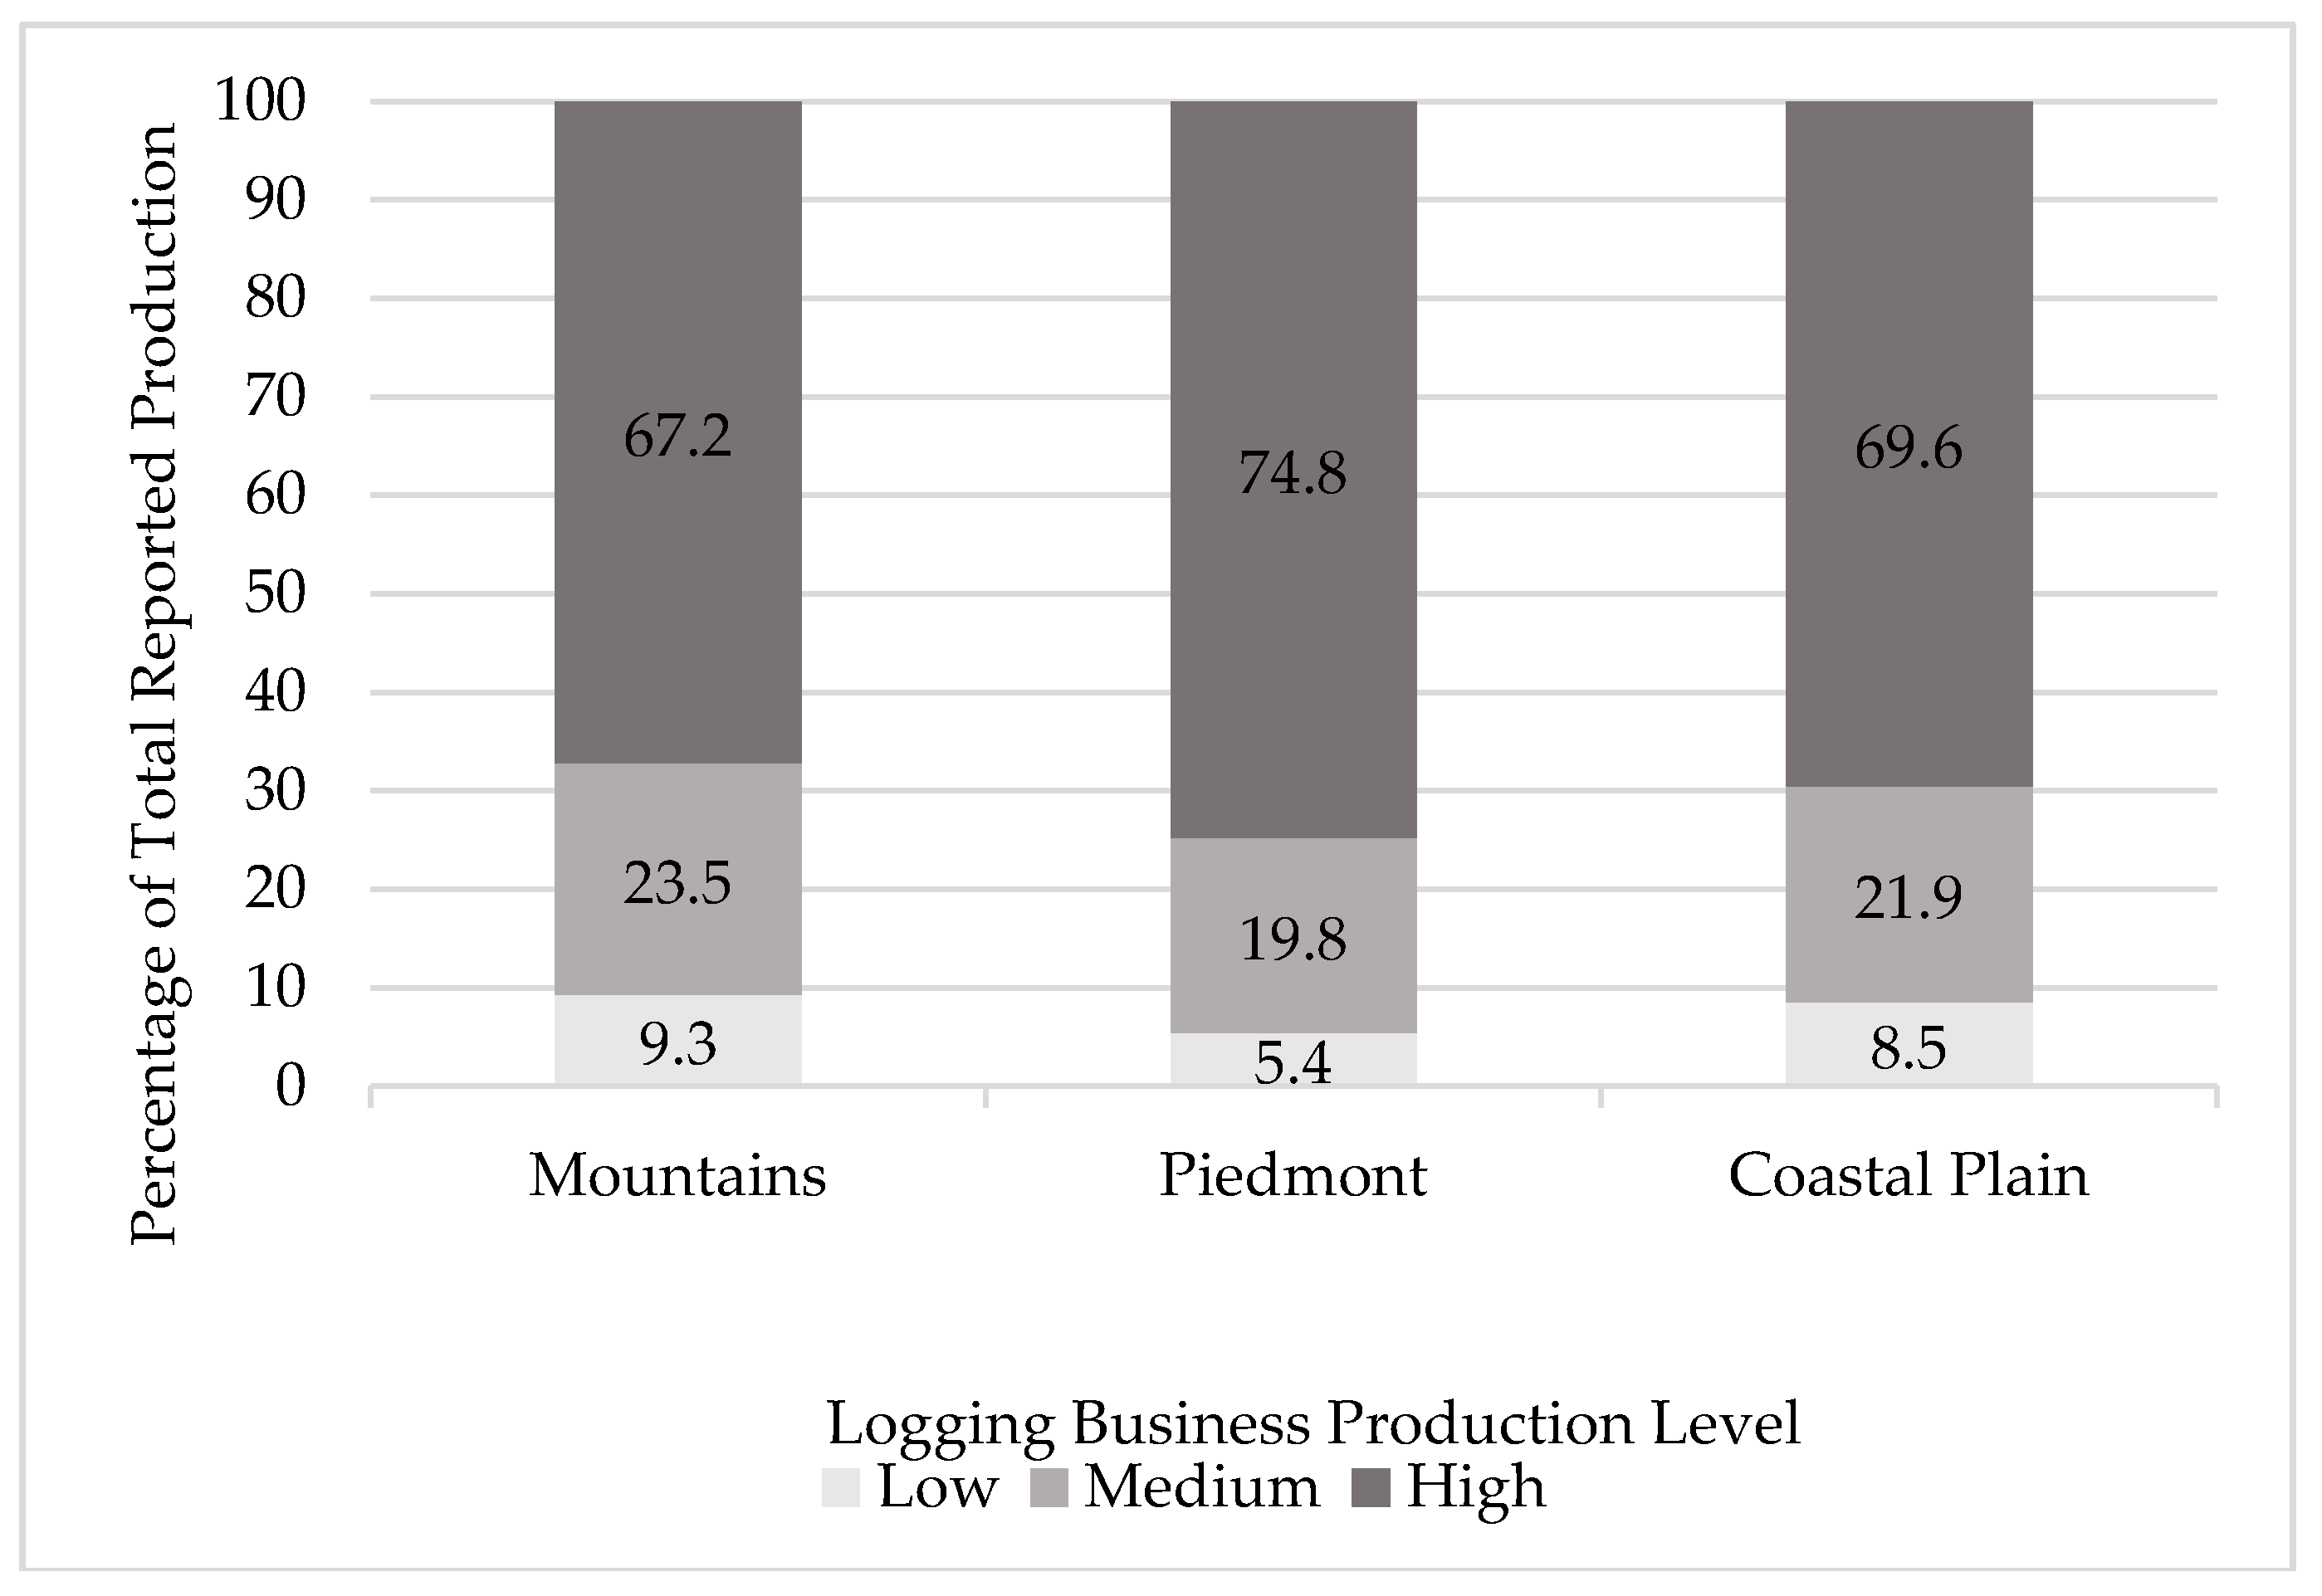
Table 3) indicate that there is considerable variation in weekly production between businesses. To further compare production levels, the businesses were sorted by region based on the total reported tonnes of production per business. Businesses were then categorized into groups based on reported production levels. The categories were high (upper 1/3 of businesses), medium, and low (lower 1/3 of businesses) (
Figure 6). Results indicate that production is not evenly distributed across logging businesses, and a relatively small proportion of the businesses account for the majority of production. Across all regions, the high-production businesses accounted for over two-thirds of all production and the low-production businesses accounted for less than 10% of all reported production. This was most pronounced in the Piedmont, where the high-production group accounted for nearly 75% of production.
Business owners were asked to indicate the equipment utilized for different harvesting functions on their operations. They were provided a list of common equipment options for each harvesting function and were asked to circle the one that they most commonly used. They were also provided an option for listing “other” equipment used for that function. While almost all types of equipment can be found on operations in each region, the most common types of equipment utilized varied by region (
Table 4). Chainsaws were the most common felling method reported by businesses in the Mountains (88.4%), while rubber-tired feller-bunchers were most common in the Coastal Plain (84.1%). The Mountains showed the most diversity in terms of trucking configurations, while operations in the Piedmont and Coastal Plain predominantly utilized tractortrailers.
The percent of all responses by logging businesses shows how there is diversity in terms of the types of equipment utilized on harvesting operations (
Table 4). However, there are also substantial differences in the overall production rates between different types of operations (
Figure 6). Therefore, we also determined the percent of overall total reported production that was produced by businesses commonly utilizing that type of equipment for a specific harvesting function. This shows the relative proportion of all timber harvested using that method. Some harvesting methods tend to be less productive in terms of tonnes produced. For example, overall, 43.7% of respondents indicated that they primarily used a chainsaw for felling; however, only 10.1% of all reported production was from operations primarily felling with chainsaws (
Table 4). While there are multiple equipment types used in each region, the overall majority of production is felled with rubber-tired feller-bunchers (81.7%), skidded with grapple skidders (93.2%), delimbed using pull-through delimbers (64.6%), bucked with a buck/slasher saw (88.9%), loaded with a trailer mounted knuckleboom loader (90.0%), and trucked using a tractor-trailer (90.9%).
3.4. Biomass Harvesting
Respondents were asked to report if they harvested biomass or “fuel chips” for energy. Overall, 25% of businesses reported they harvested biomass. Previous studies have noted that biomass harvests in Virginia were typically performed on integrated harvesting operations, where biomass is produced from residues concurrently with roundwood production [
17]. With integrated harvesting operations, biomass harvesting is often more feasible for businesses with higher production levels because there is a larger quantity of residues available and it is more likely that the operation could justify adding a chipper to utilize residues for energy. Biomass harvesting was compared by region across production categories (high, medium, and low production). Production of biomass was more common among the higher production levels, with the majority of the high-production businesses producing biomass in the Piedmont and Coastal Plain (
Table 5). Significant differences across business production categories were observed in the Mountains (
X2 = 0.0054), Piedmont (
X2 < 0.0001), and Coastal Plain (
X2 = 0.0421). This question related to harvesting fuel chips was independent of the question related to type of equipment used for chipping (
Table 4), so while the percentages are similar to those reporting chippers they do not match exactly because respondents who indicated they produced fuel chips may not have all reported the primary type of equipment utilized.
3.5. Harvest Planning and Implementation of BMPs
Harvest planning is an important tool to ensure efficient and effective logging operations. Pre-harvest planning of items such as roads, skid trails, landings, and stream crossings can impact the productivity of the operation, and can also have an impact in terms of compliance with implementation of Best Management Practices (BMPs) for water quality. Implementation of BMPs for water quality is important throughout the USA [
18] and responses indicate that Virginia logging businesses invest a substantial amount of time in pre-harvest planning and the implementation of BMPs to protect water quality.
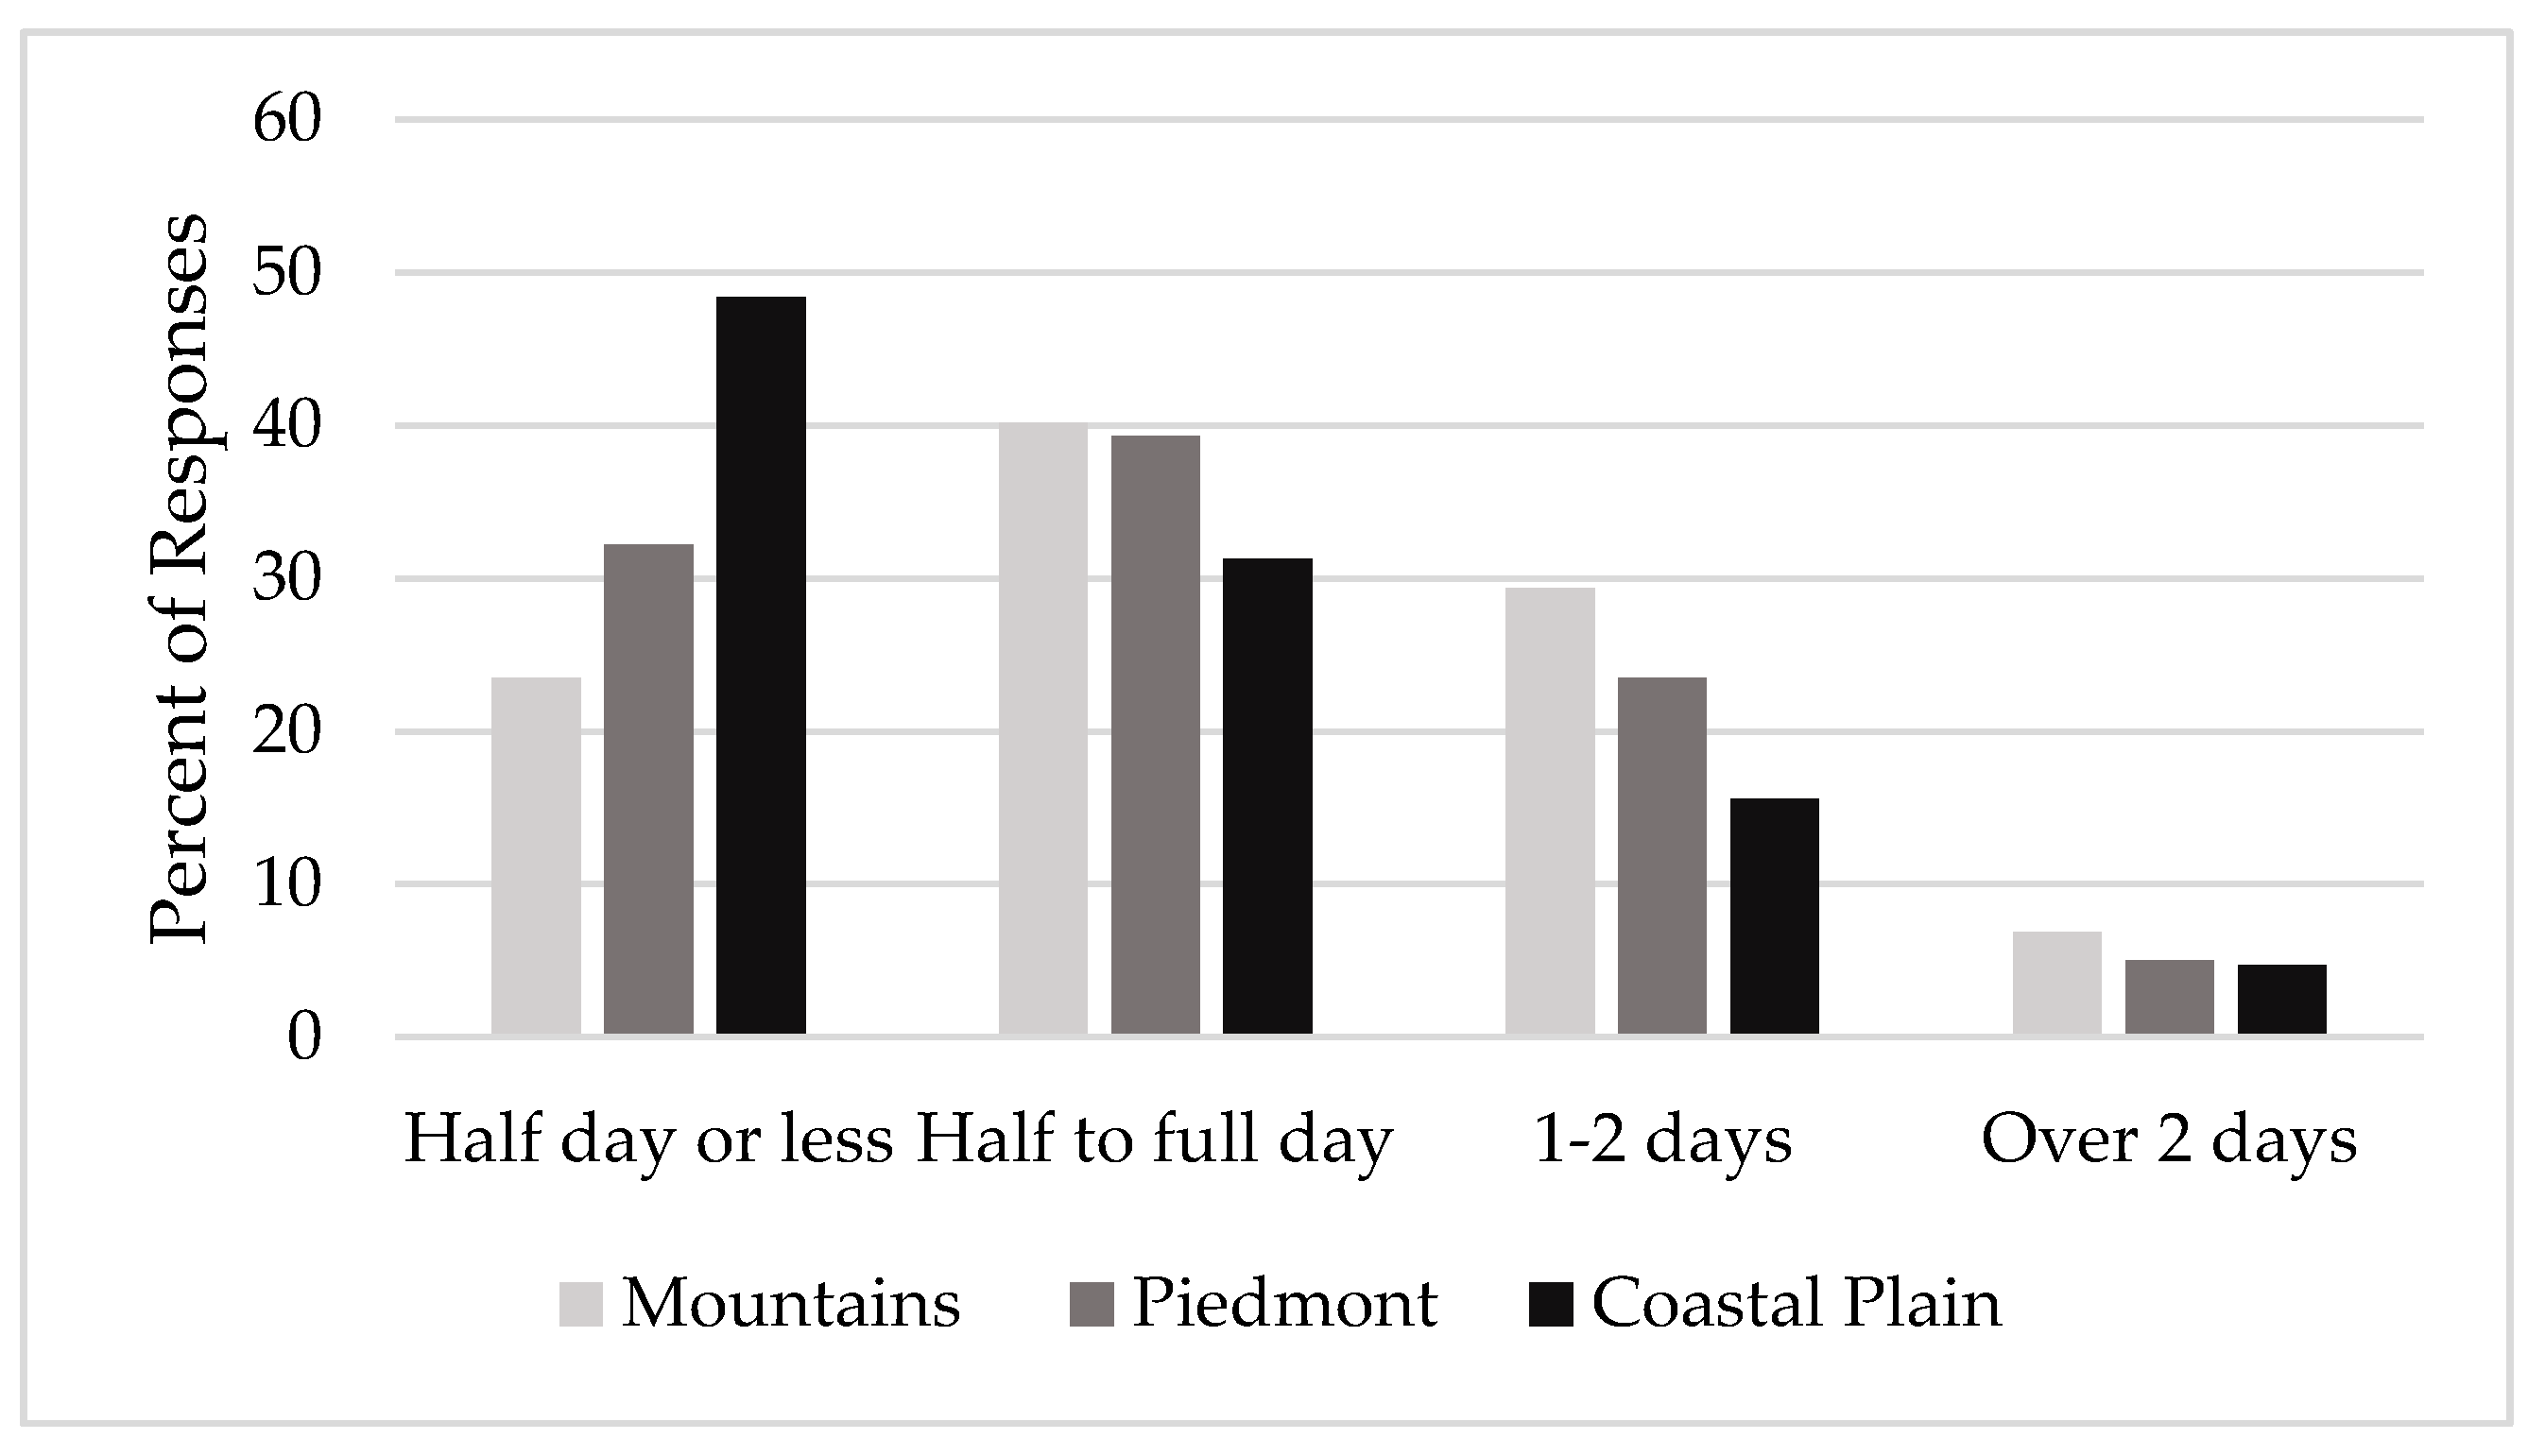
Loggers in the Mountains and Piedmont tended to spend more time on pre-harvest planning than those in the Coastal Plain. The most common response indicated that they typically spend a half to a full day per tract on pre-harvest planning, while those in the Coastal Plain tended to spend a half day or less (
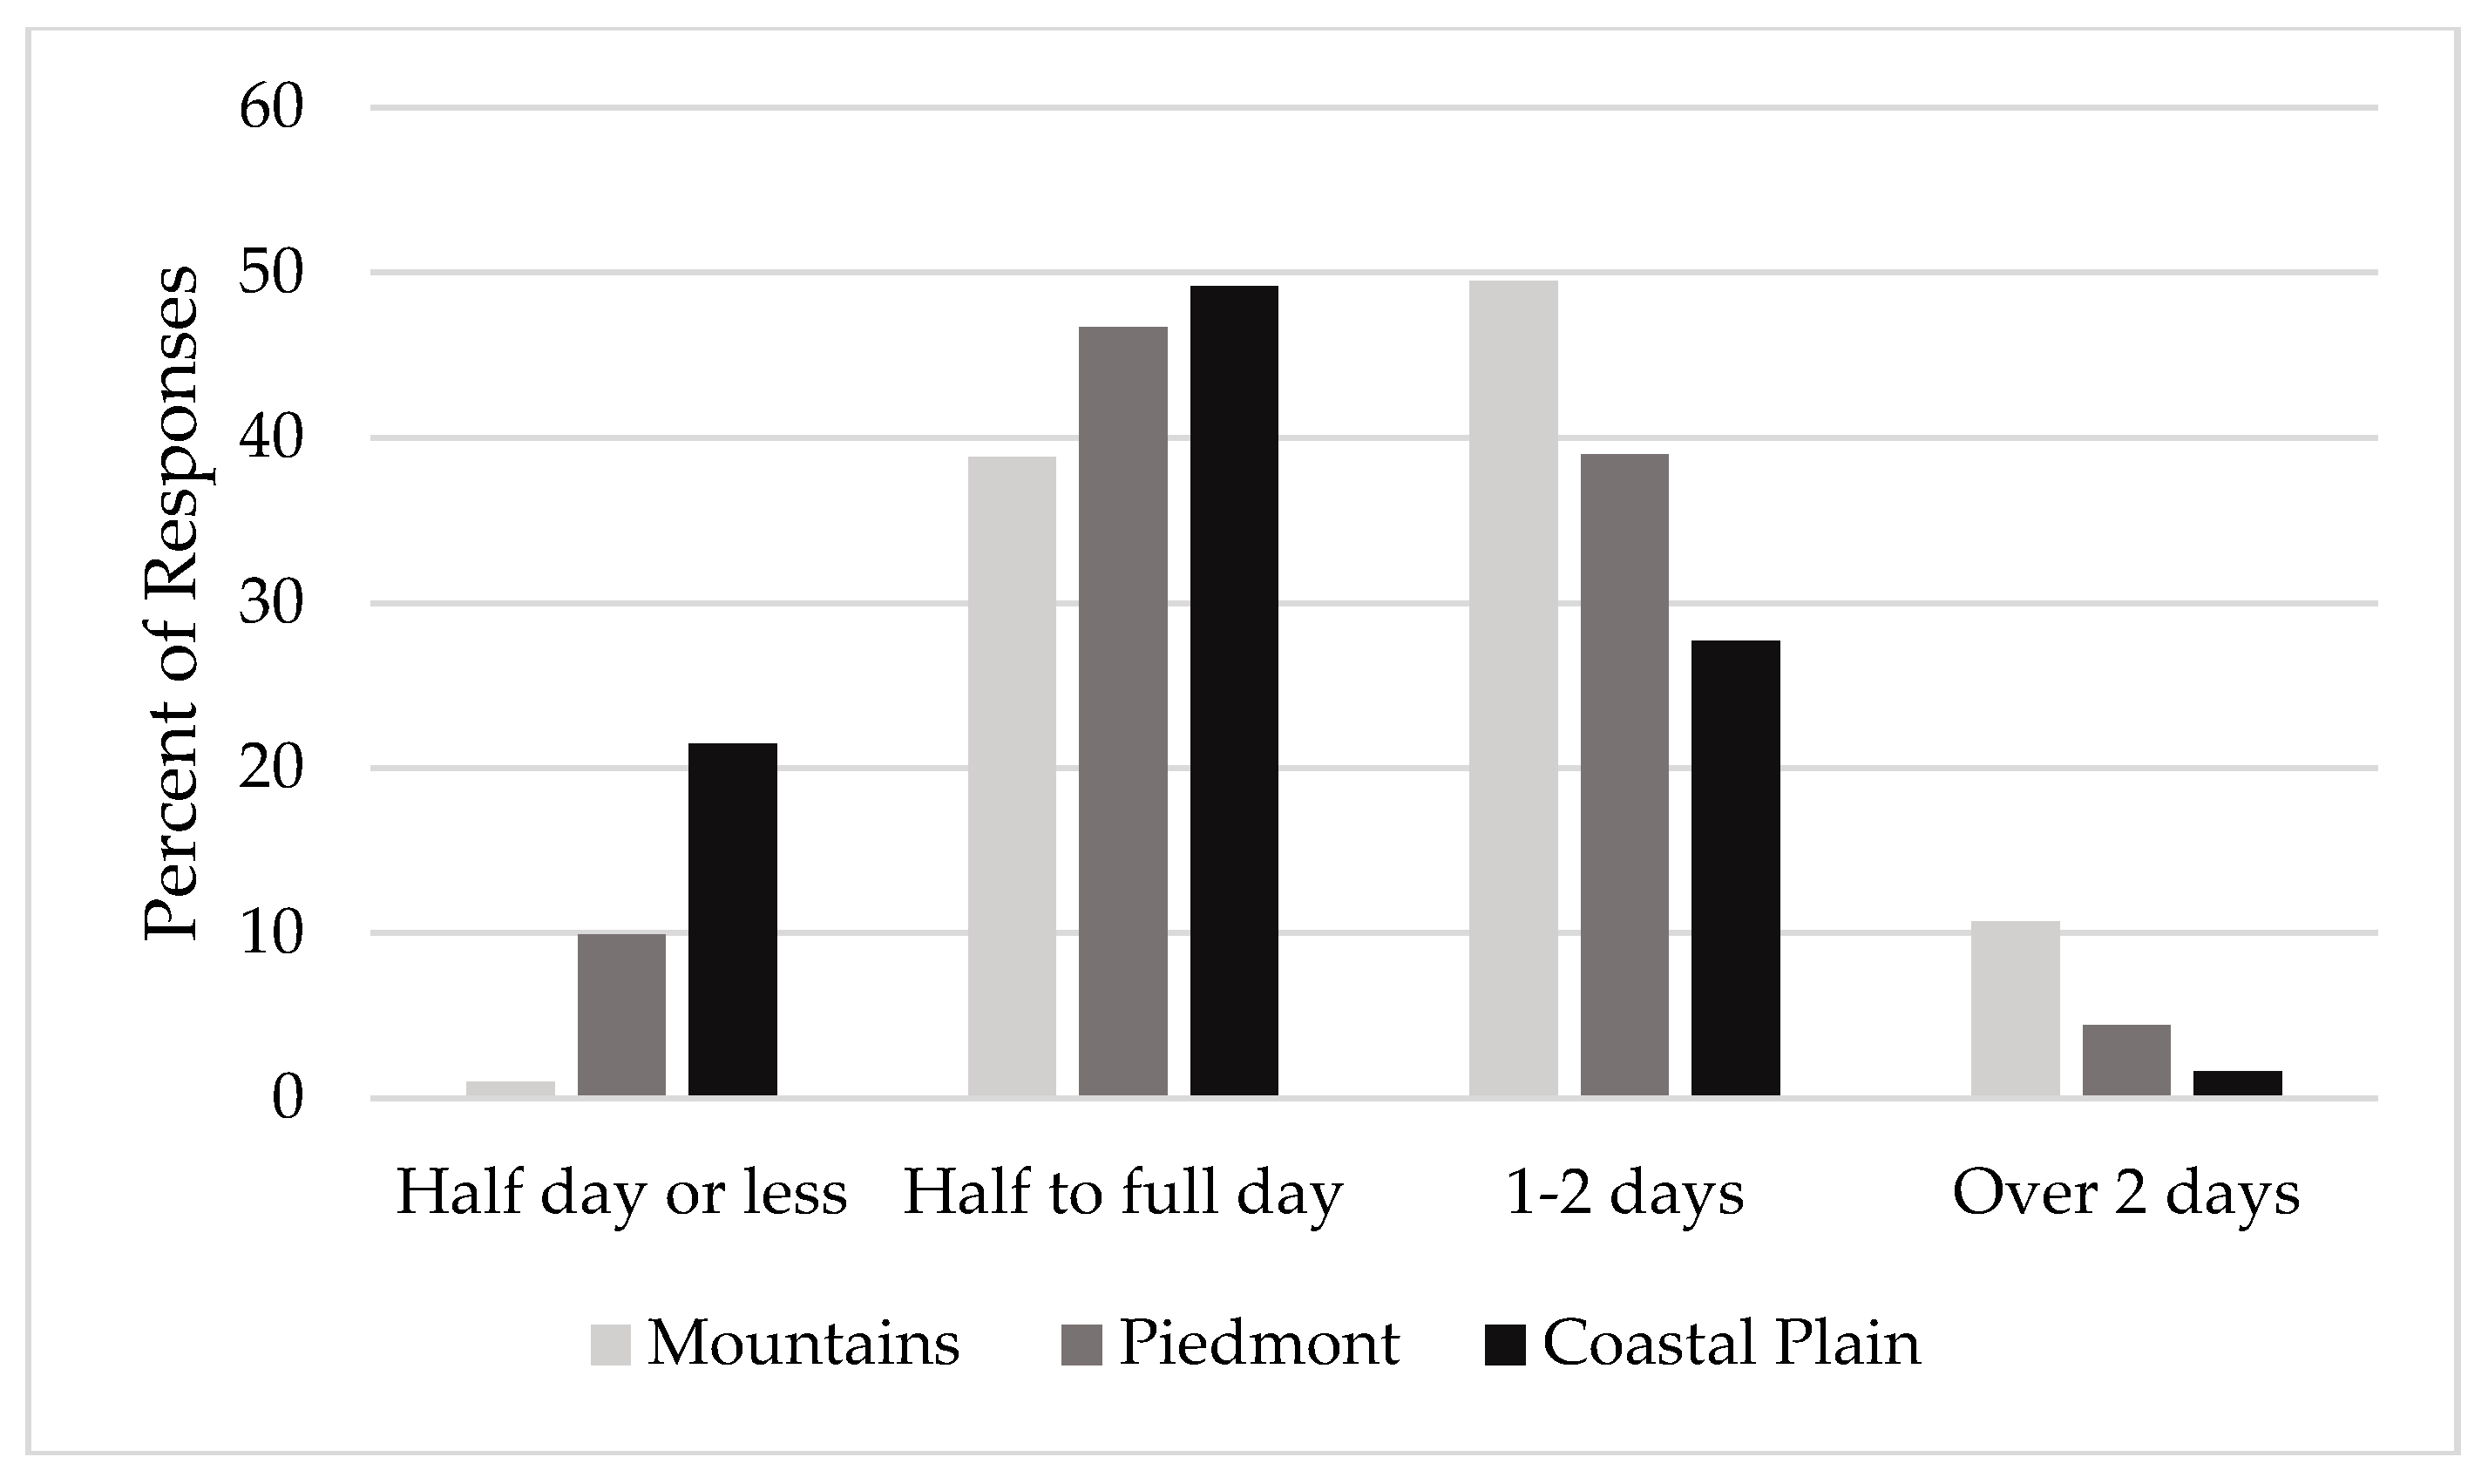
Figure 7). This is likely due to the more challenging terrain in the Mountains and Piedmont. Similarly, logging businesses in the Mountains tended to spend more time per tract closing out the site and implementing BMPs. The most common response in the Mountains was 1–2 days spent closing out the tract, whereas the most common time reported in the Piedmont and Coastal Plain was a half to a full day (
Figure 8).
3.6. Use of Technology and Common Operational Challenges
Owners were asked about the use of various types of technology in their business (
Table 6). Similar to other operational characteristics, this also varied by region. Use of all technologies across all regions showed increases from the 2009 survey. It is interesting to note that the reported percentage of e-mail use is higher than use of the Internet for businesses in the Piedmont and Coastal Plain. This could potentially be because the owners were not necessarily thinking of e-mail as using the Internet and thought of Internet usage as more related to things such as company websites, social media, online purchasing, or other web-based activities.
At the end of the questionnaire, respondents were given an open-ended question related to the biggest problem they faced in their business. There was considerable variation in these responses and many were hard to categorize; however, there were some common responses. Common issues cited by business owners often related to challenges with labor and dealing with employees, e.g., “getting reliable help,” or “lack of qualified personnel at a reasonable rate,” or “finding people who are willing to show up for work.” Other common problems identified included complying with regulations, especially regulations related to transportation and trucking. With most logging businesses, fuel for trucks and in-woods equipment can be a major expense, so it is not surprising that one of the common problems identified was the cost of fuel. Other common expenses in logging operations were identified as a problem, such as the cost of insurance, parts, and new equipment. Prices received for their products at the mill were also a common problem identified by business owners. While some problems such as finding qualified employees or dealing with regulations may be common in any business, some problems identified by logging businesses are somewhat unique to the industry. For example, some owners reported challenges related to procuring the future tracts they will harvest, e.g., “running out of timber to harvest,” “lack of timber,” or “trying to find timber close to home.” Weather in general was listed as a problem, as well as finding “winter tracts” or tracts with suitable ground conditions that could be harvested during the typically wetter winter months.


