Article

De Novo Transcriptome Sequencing in Passiflora edulis Sims to Identify Genes and Signaling Pathways Involved in Cold Tolerance

1
Co-Innovation Center for Sustainable Forestry in Southern China, Nanjing Forestry University, Nanjing 210037, China
2
College of Forestry, Nanjing Forestry University, Nanjing 210037, China
3
Institute of Mountain Resources, Guizhou Academy of Science, Guiyang 550001, China
4
Guizhou Botanical Garden, Guizhou Academy of Science, Guiyang 550001, China
*
Authors to whom correspondence should be addressed.
Forests 2017, 8(11), 435; https://doi.org/10.3390/f8110435
Submission received: 22 September 2017 / Revised: 31 October 2017 / Accepted: 6 November 2017 / Published: 12 November 2017
(This article belongs to the Special Issue Genetics and Genomics of Forest Trees)

Abstract

:
The passion fruit (Passiflora edulis Sims), also known as the purple granadilla, is widely cultivated as the new darling of the fruit market throughout southern China. This exotic and perennial climber is adapted to warm and humid climates, and thus is generally intolerant of cold. There is limited information about gene regulation and signaling pathways related to the cold stress response in this species. In this study, two transcriptome libraries (KEDU_AP vs. GX_AP) were constructed from the aerial parts of cold-tolerant and cold-susceptible varieties of P. edulis, respectively. Overall, 126,284,018 clean reads were obtained, and 86,880 unigenes with a mean size of 1449 bp were assembled. Of these, there were 64,067 (73.74%) unigenes with significant similarity to publicly available plant protein sequences. Expression profiles were generated, and 3045 genes were found to be significantly differentially expressed between the KEDU_AP and GX_AP libraries, including 1075 (35.3%) up-regulated and 1970 (64.7%) down-regulated. These included 36 genes in enriched pathways of plant hormone signal transduction, and 56 genes encoding putative transcription factors. Six genes involved in the ICE1–CBF–COR pathway were induced in the cold-tolerant variety, and their expression levels were further verified using quantitative real-time PCR. This report is the first to identify genes and signaling pathways involved in cold tolerance using high-throughput transcriptome sequencing in P. edulis. These findings may provide useful insights into the molecular mechanisms regulating cold tolerance and genetic breeding in Passiflora spp.

1. Introduction

Passiflora is the largest genus of the Passifloraceae family, with more than 500 species [1]. Passiflora species are distributed throughout Latin America, and Brazil and Colombia are the centers of diversity for this genus [2], and many of these species are widely cultivated for their edible fruit, medicinal efficacy, and ornamental properties. In the early 20th century, Passiflora edulis Sims as an edible fruit was introduced to China, mainly in Taiwan, Guangdong, Guangxi and Fujian. P. edulis is known for its taste, is used in Brazilian traditional folk medicine and is included in pharmacopoeias of several countries [3,4]. Leaf extracts of P. edulis are considered to treat alcoholism, anxiety and insomnia [5]. The flower has been used for the treatment of cough and bronchitis, and the seed oil as a lubricant and massage oil [6].
Low temperatures represent a major abiotic constraint to plant growth, productivity and distribution [7]. To ensure optimal growth and survival, plants must respond and adapt to cold stress, by implementing a wide range of biochemical and physiological processes. Currently, the most thoroughly understood cold-signaling pathway is the ICE1–CBF–COR pathway. C-repeat binding factors (CBFs) can activate the expression of numerous downstream cold-responsive (COR) genes by binding to the cis-acting elements [8,9]. Overexpression of AtCBF1 or AtCBF3 enhanced chilling, drought and salt stress tolerance in many species, including Brassica spp. [10], wheat (Triticum aestivum L.) [11], tomato (Solanum lycopersicum L.) [12] and rice (Oryza sativa L.) [13]. Inducer of CBF expression 1(ICE1) belongs to the bHLH transcription factor (TF) family, which control CBF genes [14]. ICE1 is affected by ambient temperature and is in an inactive state in a warm environment; however, it is activated upon exposure to cold and induces CBF expression. Mitogen-activated protein kinase (MAPK) kinase 2 (MKK2) is activated by cold and controls COR expression to improve plant tolerance to freezing [15]. Recent studies have shown that chilling stress activates SNF1-related protein kinases 2.6/open stomata 1 (SnRK2.6/OST1), and then SnRK2.6 interacts with and phosphorylates ICE1 to activate the CBF–COR gene-expression cascade and increase cold tolerance [14,16]. In Arabidopsis thaliana (L.) Heynh, only 12% of COR genes were regulated by CBF [17], which indicated that other regulatory pathways may also be activated in response to cold stress. The abscisic acid (ABA) signal transduction pathway played a key role in plant cold tolerance, with approximately 10% of the ABA response genes involved in cold stress [18], and ABA signaling pathways may be involved in regulating COR expression [19,20].
The passion fruit (P. edulis), also known as the purple granadilla, is widely cultivated as the new darling of the fruit market throughout southern China. This exotic and perennial climber is adapted to warm and humid climates, and thus is generally intolerant of cold. Fortunately, we have developed a cold-tolerant P. edulis variety (‘Pingtang 1’, KEDU), which is widely cultivated in the south of Guizhou. From breeding and popularization, this variety has undergone testing of several rounds of extreme low temperature, especially in the 2008 Snow Disaster in the south of China; it showed significantly higher cold tolerance in the field than the other varieties mainly cultivated in Guangdong and Guangxi [21]. However, there is limited information about gene regulation and signaling pathways related to the cold stress response in this species. Here, two transcriptome libraries (KEDU_AP vs. GX_AP) were constructed from the aerial parts of cold-tolerant and cold-susceptible varieties of P. edulis, respectively. De novo transcriptome sequencing was carried out to identify genes and signaling pathways involved in cold tolerance. This report is the first to identify genes and signaling pathways involved in cold tolerance using high-throughput transcriptome sequencing in P. edulis.

2. Materials and Methods

2.1. Plant Materials

In a previous field investigation in Pingtang County, Guizhou Province, we found that after the 2008 Snow Disaster, several P. edulis (‘Pingtang 1’) survived and that they could survive winter temperatures below −2°C [21]. We carried out conservation and cutting propagation, and in a series of experiments found that ‘Pingtang 1’ had significantly higher cold tolerance than ‘Purple Fragrance 1’ [21]. The two varieties of P. edulis, cold-tolerant ‘Pingtang 1’ and cold-susceptible ‘Purple Fragrance 1’ were planted in Pingtang County, Guizhou Province (25°44′24.77″ N, 106°48′45.44″ E; altitude 884 m). The aerial parts (stem, leaf, flower and fruit) of ‘Pingtang 1’ and ‘Purple Fragrance 1’ were sampled for RNA extraction in the winter of 2016 (November 9, temperature of 4–6 °C). All P. edulis samples were stored at −80 °C in an ultra-low temperature freezer.

2.2. Total RNA Extraction, cDNA Library Preparation and Transcriptome Sequencing

Total RNA was extracted from samples according to the protocol of RNeasy Plant Mini Kit (Qiagen, Hilden, Germany). RNA integrity was monitored by agarose gel electrophoresis (1%) and using an Agilent 2100 Bioanalyzer (Agilent Technologies, Palo Alto, CA, USA). The cDNA library of ‘Pingtang 1’ was named KEDU_AP and that of ‘Purple Fragrance 1’ named GX_AP. Following the manufacturer’s instructions, two cDNA libraries were generated using a NEBNext® Ultra™ RNA Library Prep Kit for Illumina® (NEB, Boston, Massachusetts, USA). According to the manufacturer’s recommendations, clustering of the index-coded samples was performed on a cBot Cluster Generation System using TruSeq PE Cluster Kit v3-cBot-HS (Illumina, San Diego, CA, USA). The prepared libraries were sequenced, and 150-bp paired-end reads were generated (Illumina Hiseq 2500, San Diego, CA, USA). The raw images were transformed using CASAVA base-calling into the FASTQ format of raw reads (raw data). To get clean reads, low-quality reads and adapter sequences were removed using SeqPrep (https://github.com/jstjohn/SeqPrep) and Cutadapt [22].

2.3. Transcriptome Assembly and Function Annotation

Transcriptome assembly was achieved using Trinity version r20140413p1 [23] based on the left.fq and right.fq, with the min_kmer_cov set as 2 by default and all other parameters set as their defaults. For function annotation, the longest transcript of each gene was defined as the ‘unigene’. All assembled unigenes were BLASTed in Nr, Nt, Pfam, KOG/COG, Swiss-Prot, KEGG ortholog database (KO) and Gene ontology (GO) databases using BLAST2GO of version 2.5 with a cut-off E-value of 10−6 [24].

2.4. Differential Expression Analysis

Gene expression level of all samples was estimated by mapping clean reads to the Trinity transcripts assembly using RSEM version 1.2.15 [25], with the bowtie2 parameter set at mismatch 0. Then, read counts for each gene were obtained from the mapping results. Prior to Differentially expressed genes (DEG) analysis, the read counts were normalized using the edgeR program package with the Trimmed Mean of M-values method [26,27]. The DEGseq R package was used to analyze differential expression of two P. edulis samples. The p-value was adjusted using q-value [28]. The significant differential expression threshold was set as q-value < 0.005 and |log2(foldchange)| > 1 [29]. The identified DEGs were used for GO enrichment analyses, which were performed using the GOseq R package (version 1.10.0), based on the Wallenius non-central hypergeometric distribution [30]. Kyoto encyclopedia of genes and genomes (KEGG) enrichment analysis was performed using KOBAS version 2.0.12 [31].

2.5. Quantitative Real-Time PCR (qRT-PCR)

Total RNA was extracted from various samples with the RNeasy Plant Mini Kit (Qiagen, Hilden, Germany) and treated with RNAse-free DNase I (Ambion, Austin, Texas, USA). Of the DNase-treated RNA, 1 µg was reverse transcribed using random hexamer primers. The resulting cDNA was diluted, and 2 µL of the diluted cDNA was used. Specific primers (Tm, 58–61 °C) were designed to generate PCR products of 70–150 bp (Table S1). The qRT-PCR was performed on an ABI ViiA 7 Real-time PCR platform. FastStart Universal SYBR Green Master (Rox) was used for qRT-PCR assays according to the manufacturer’s protocol. For each sample, three replicates were performed in a final volume of 20 µL containing 10 μL of SYBR Premix Ex Taq (2×), 0.4 μL of 50 × ROX Reference Dye II, 0.4 μL (10 μM) of each primer, 2 μL of cDNA, and 6.8 μL of dH2O. Thermo-cycling conditions were as follows: initial denaturation at 95 °C for 30 s, followed by 40 cycles of 95 °C for 5 s, and 60 °C annealing and extension for 34 s. All reactions were performed in triplicate. The specificity of the PCR amplification procedures was checked with a heat dissociation protocol after the final cycle of the PCR to ensure that each amplicon was a single product. Relative expression was calculated as the difference in delta-Ct between the target gene and the internal control, histone H3.3 (HIS) gene.

3. Results

3.1. Transcriptome Sequencing and De Novo Assembly

In total, there were 60,881,198 raw reads generated from KEDU_AP and 71,719,162 from GX_AP. The sequencing raw data were submitted to the Short Reads Archive (SRA) database under the accession number SRP106510. Of the raw reads from KEDU_AP, more than 95.87% bases had a q value ≥ 20, and for GX_AP 95.15%. The GC-contents were 44.84% and 45.20% for KEDU_AP and GX_AP, respectively. After removing low-quality reads, 57,840,324 clean reads from KEDU_AP and 68,443,694 from GX_AP were obtained. These were used for de novo assembly.
The Trinity software generated 127,474 transcripts with an average length of 1077 bp and an N50 of 2057 bp (Table 1). In total, 86,880 unigenes were obtained in the range of 201–13,397 bp with an N50 length of 2222 bp. Of these, 20,947 (24.11%) were 200–500 bp, 21,684 (24.96%) were 500–1000 bp, 22,051 (25.38%) were 1–2 kb and the remaining 22,198 (25.55%) were >2 kb (Table 1).

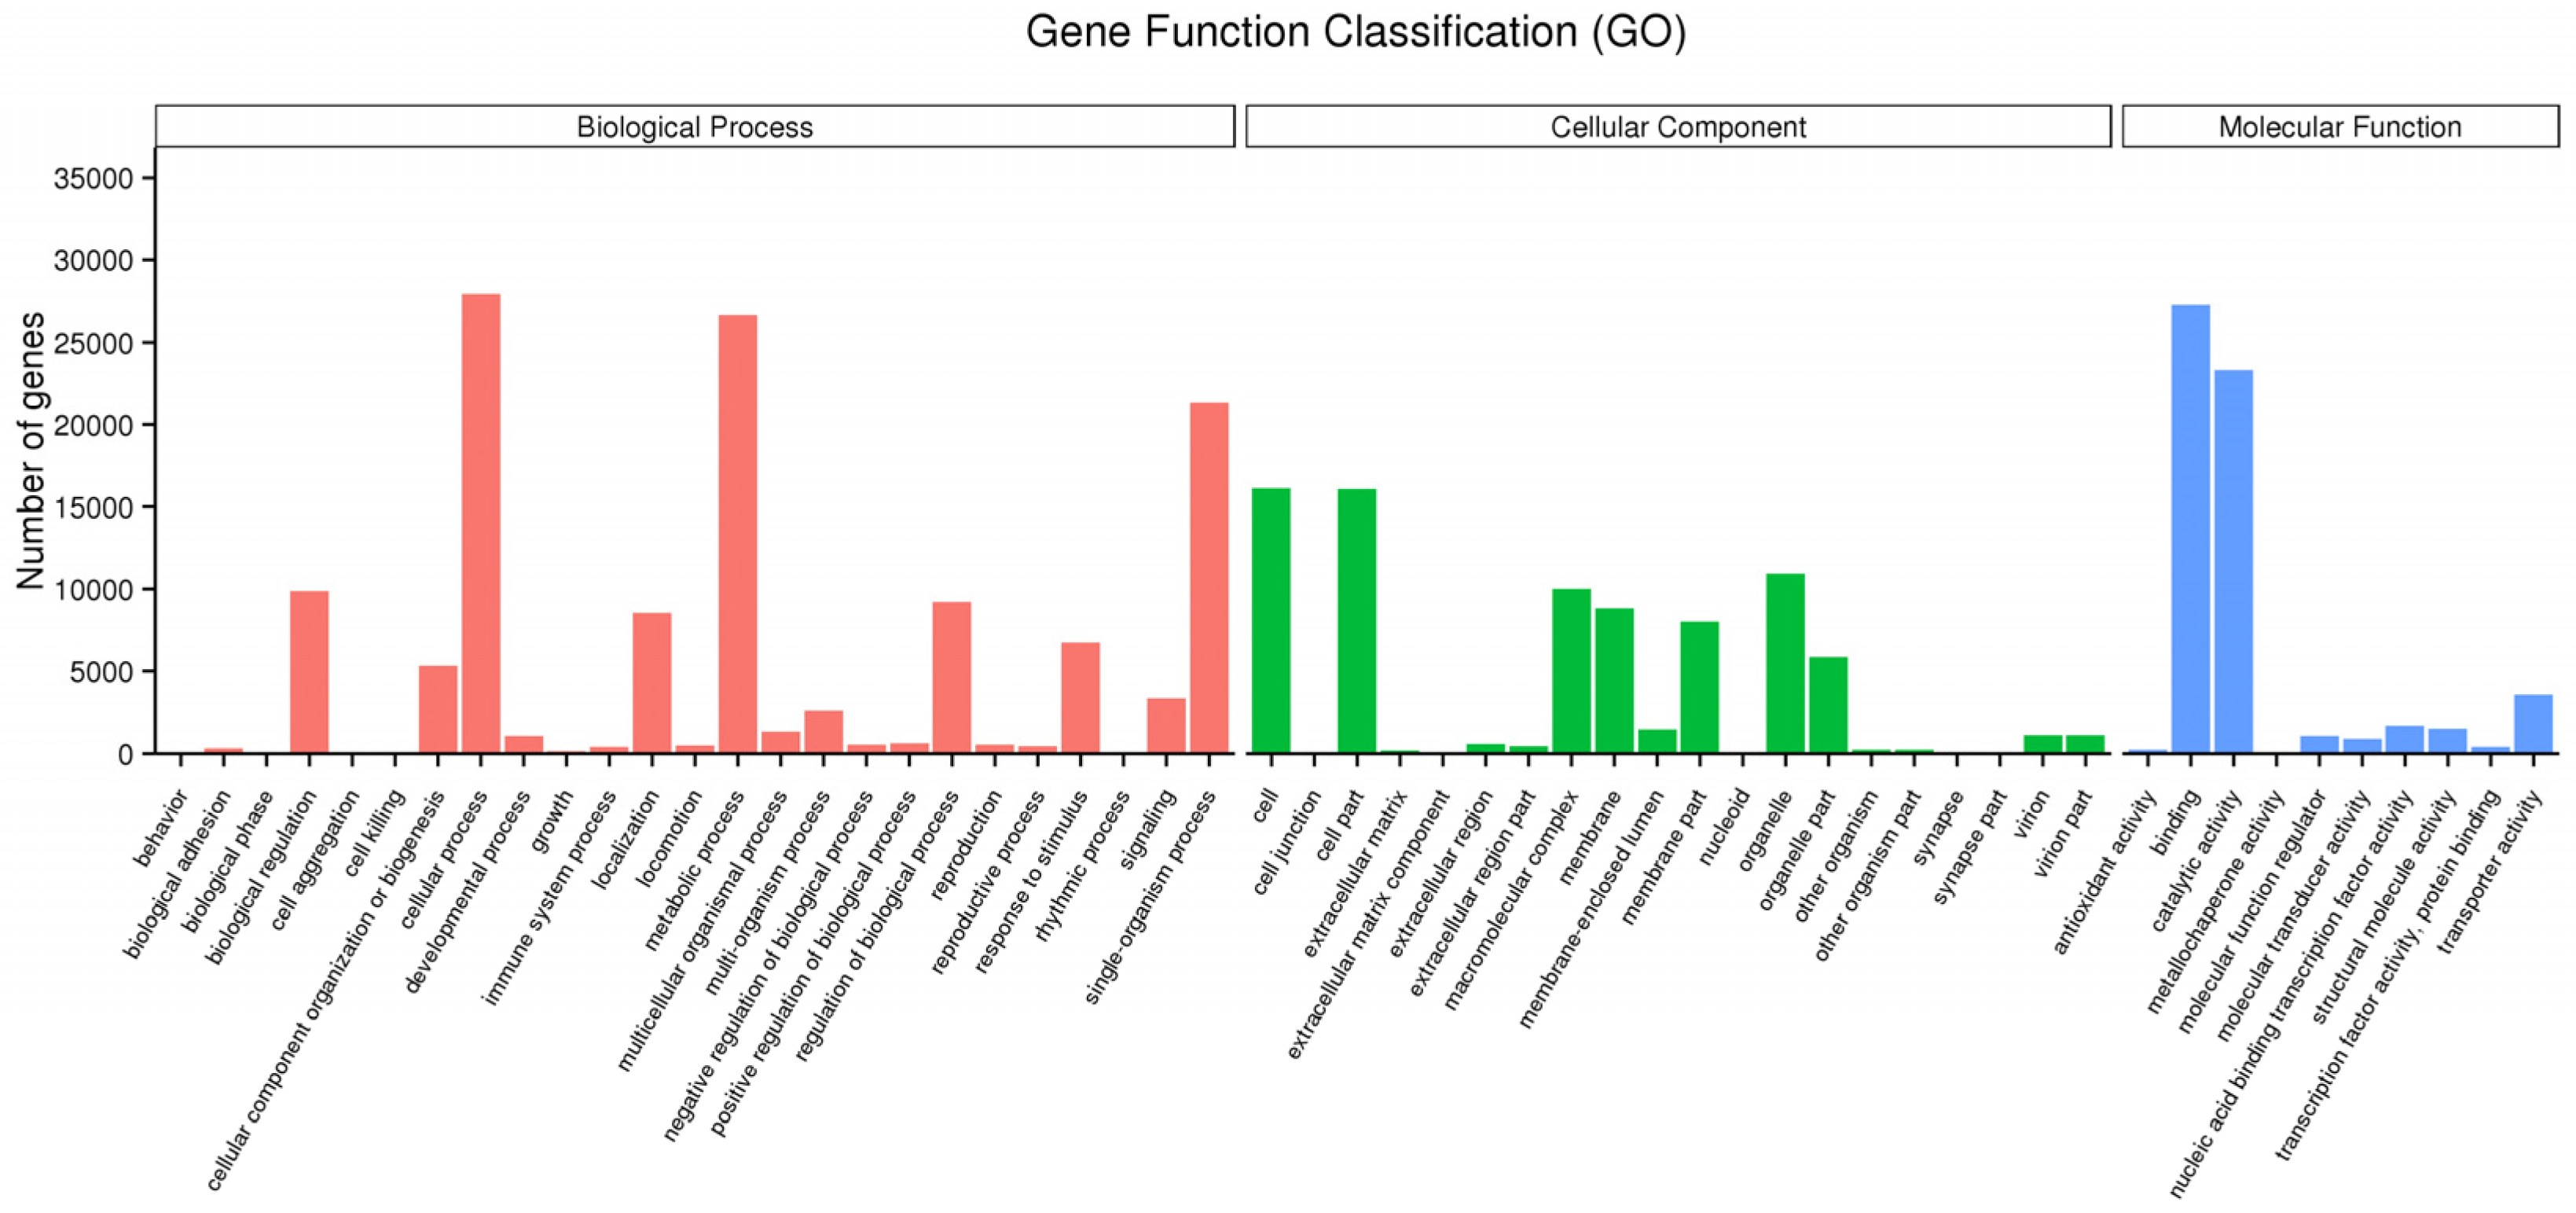
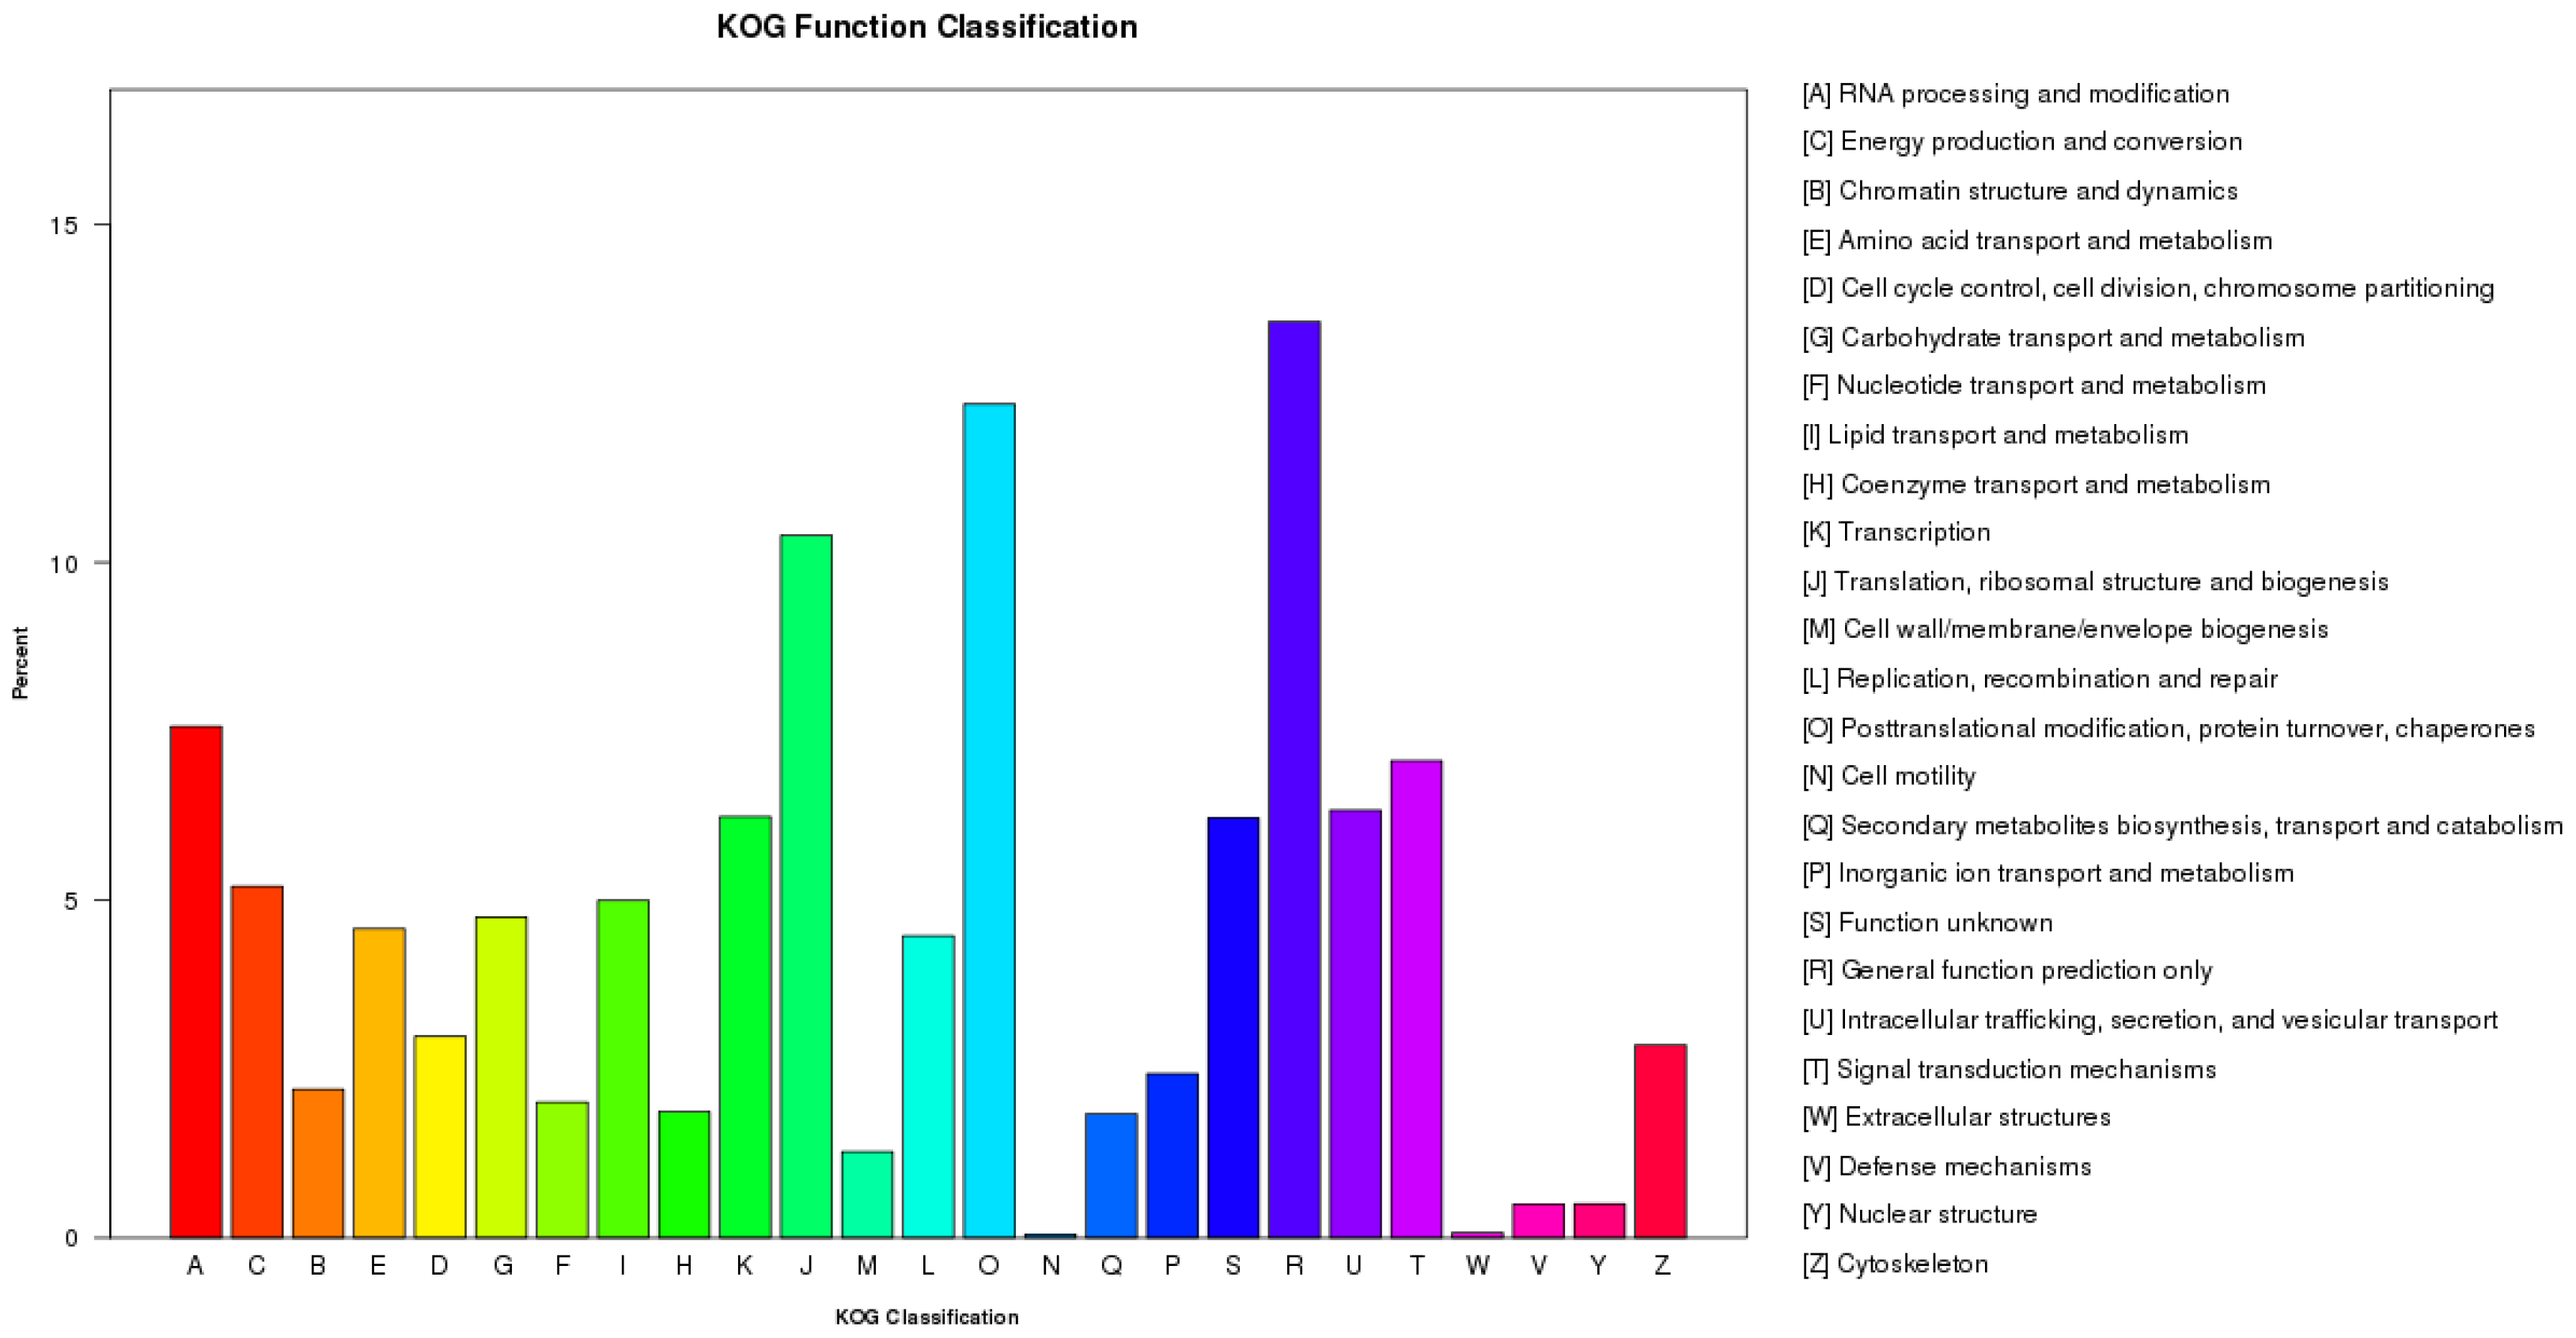
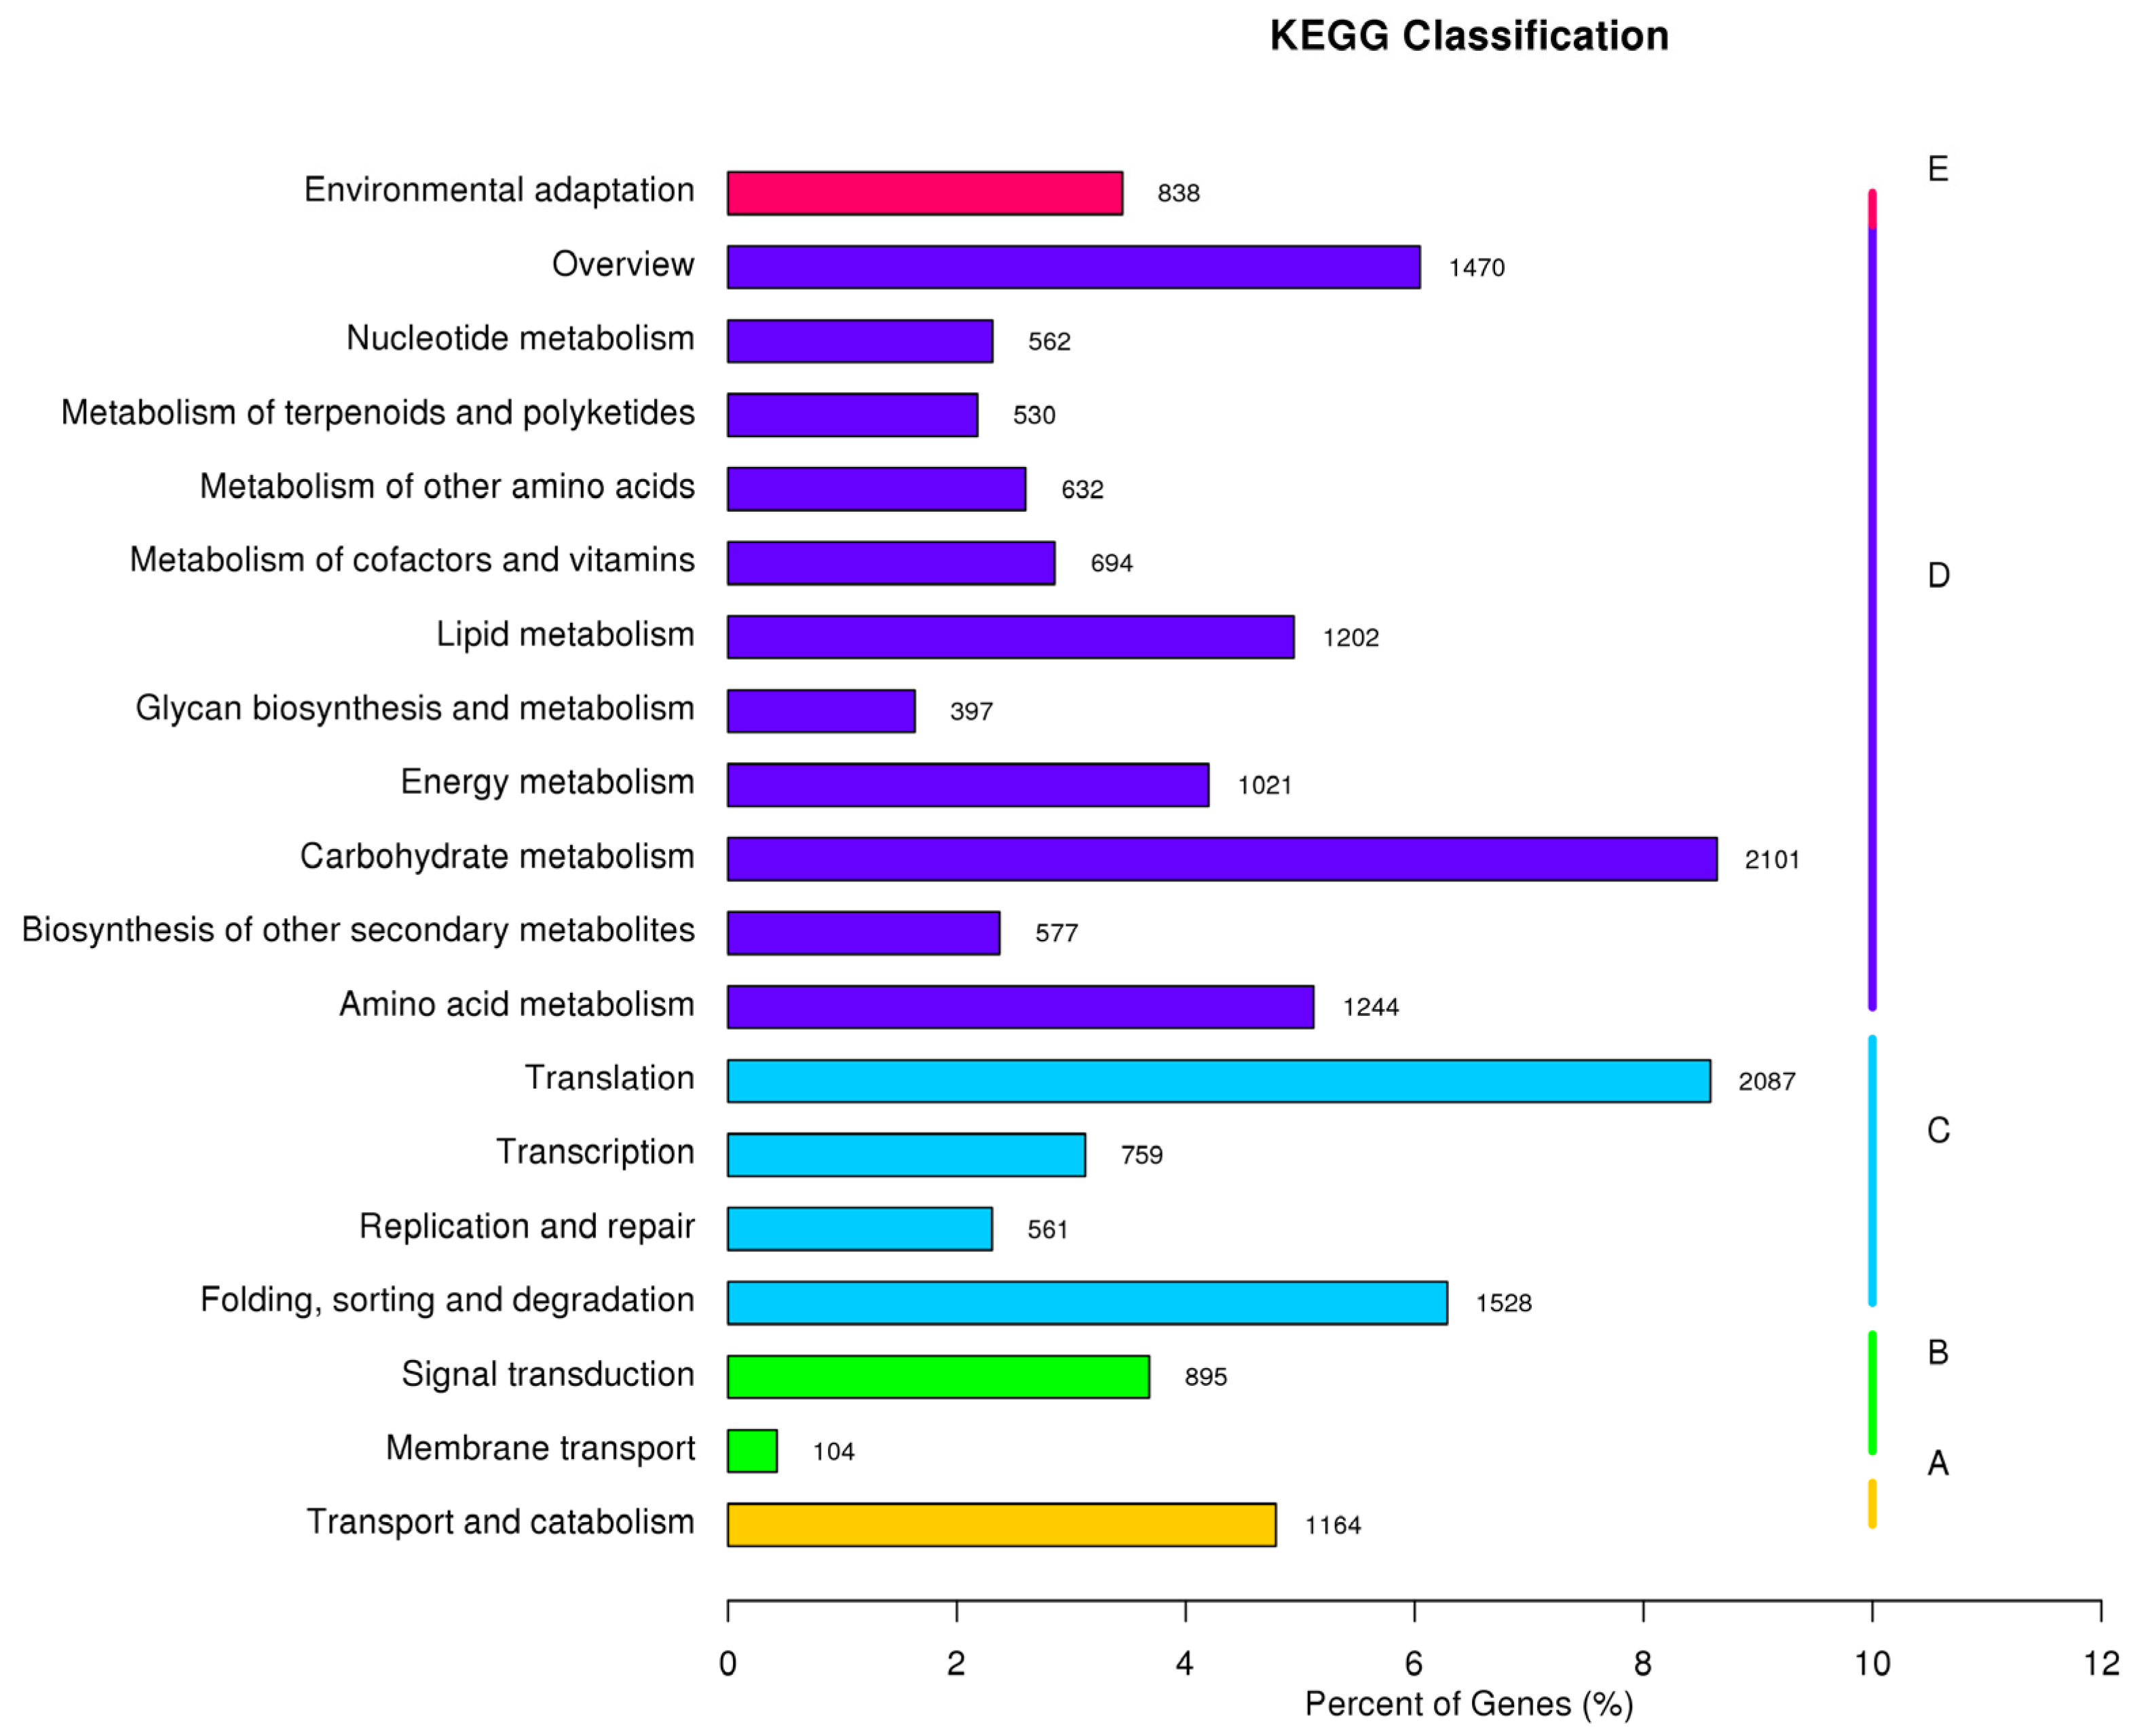
3.2. Function Annotation and Classification

All the 86,880 assembled unigenes were annotated to the seven databases using the BLAST algorithm (Table 2). In total, 64,067 unigenes were annotated, accounting for 73.74% (Table 2). There were 10,457 (12.03%) unigenes successfully annotated in all seven databases. Analyses showed that 60,028 (69.09%) unigenes had high homology with sequences in the Nr database and 46,093 (53.05%) in the Nt database. The details of other database proportions are shown in Table 2.
There were 46,754 unigenes divided into three functional GO categories: biological process (BP), cellular component (CC) and molecular function (MF) (Figure 1). In the BP category, these matched unigenes were annotated to 25 GO terms, with the three top terms being ‘cellular process’ (27,925), ‘metabolic process’ (26,692) and ‘single-organism process’ (21,336). For CC and MF, these unigenes were clustered into 20 and 10 GO terms, respectively, with ‘cell’ (16,101) and ‘binding’ (27,248) as the largest subcategories. There were 17,742 unigenes divided into 26 groups for KOG analysis (Figure 2): the largest group was R (general functional prediction only), followed by O (post-translational modification, protein turnover and chaperon) and then J (translation, ribosomal structure and biogenesis).
A total of 18,366 unigenes were assigned to 19 metabolic pathways in the KEGG database (Figure 3). These 19 KEGG pathways were clustered into five branches: cellular processes (A) of 1164 unigenes, environmental information processing (B) of 999 unigenes, genetic information processing (C) of 4935 unigenes, metabolism (D) of 10,430 unigenes and organismal systems (E) of 838 unigenes. The metabolic pathways with the largest number of unigenes were ‘carbohydrate metabolism’ (2101), followed by ‘translation’ (2087) and ‘folding, sorting and degradation’ (1528).

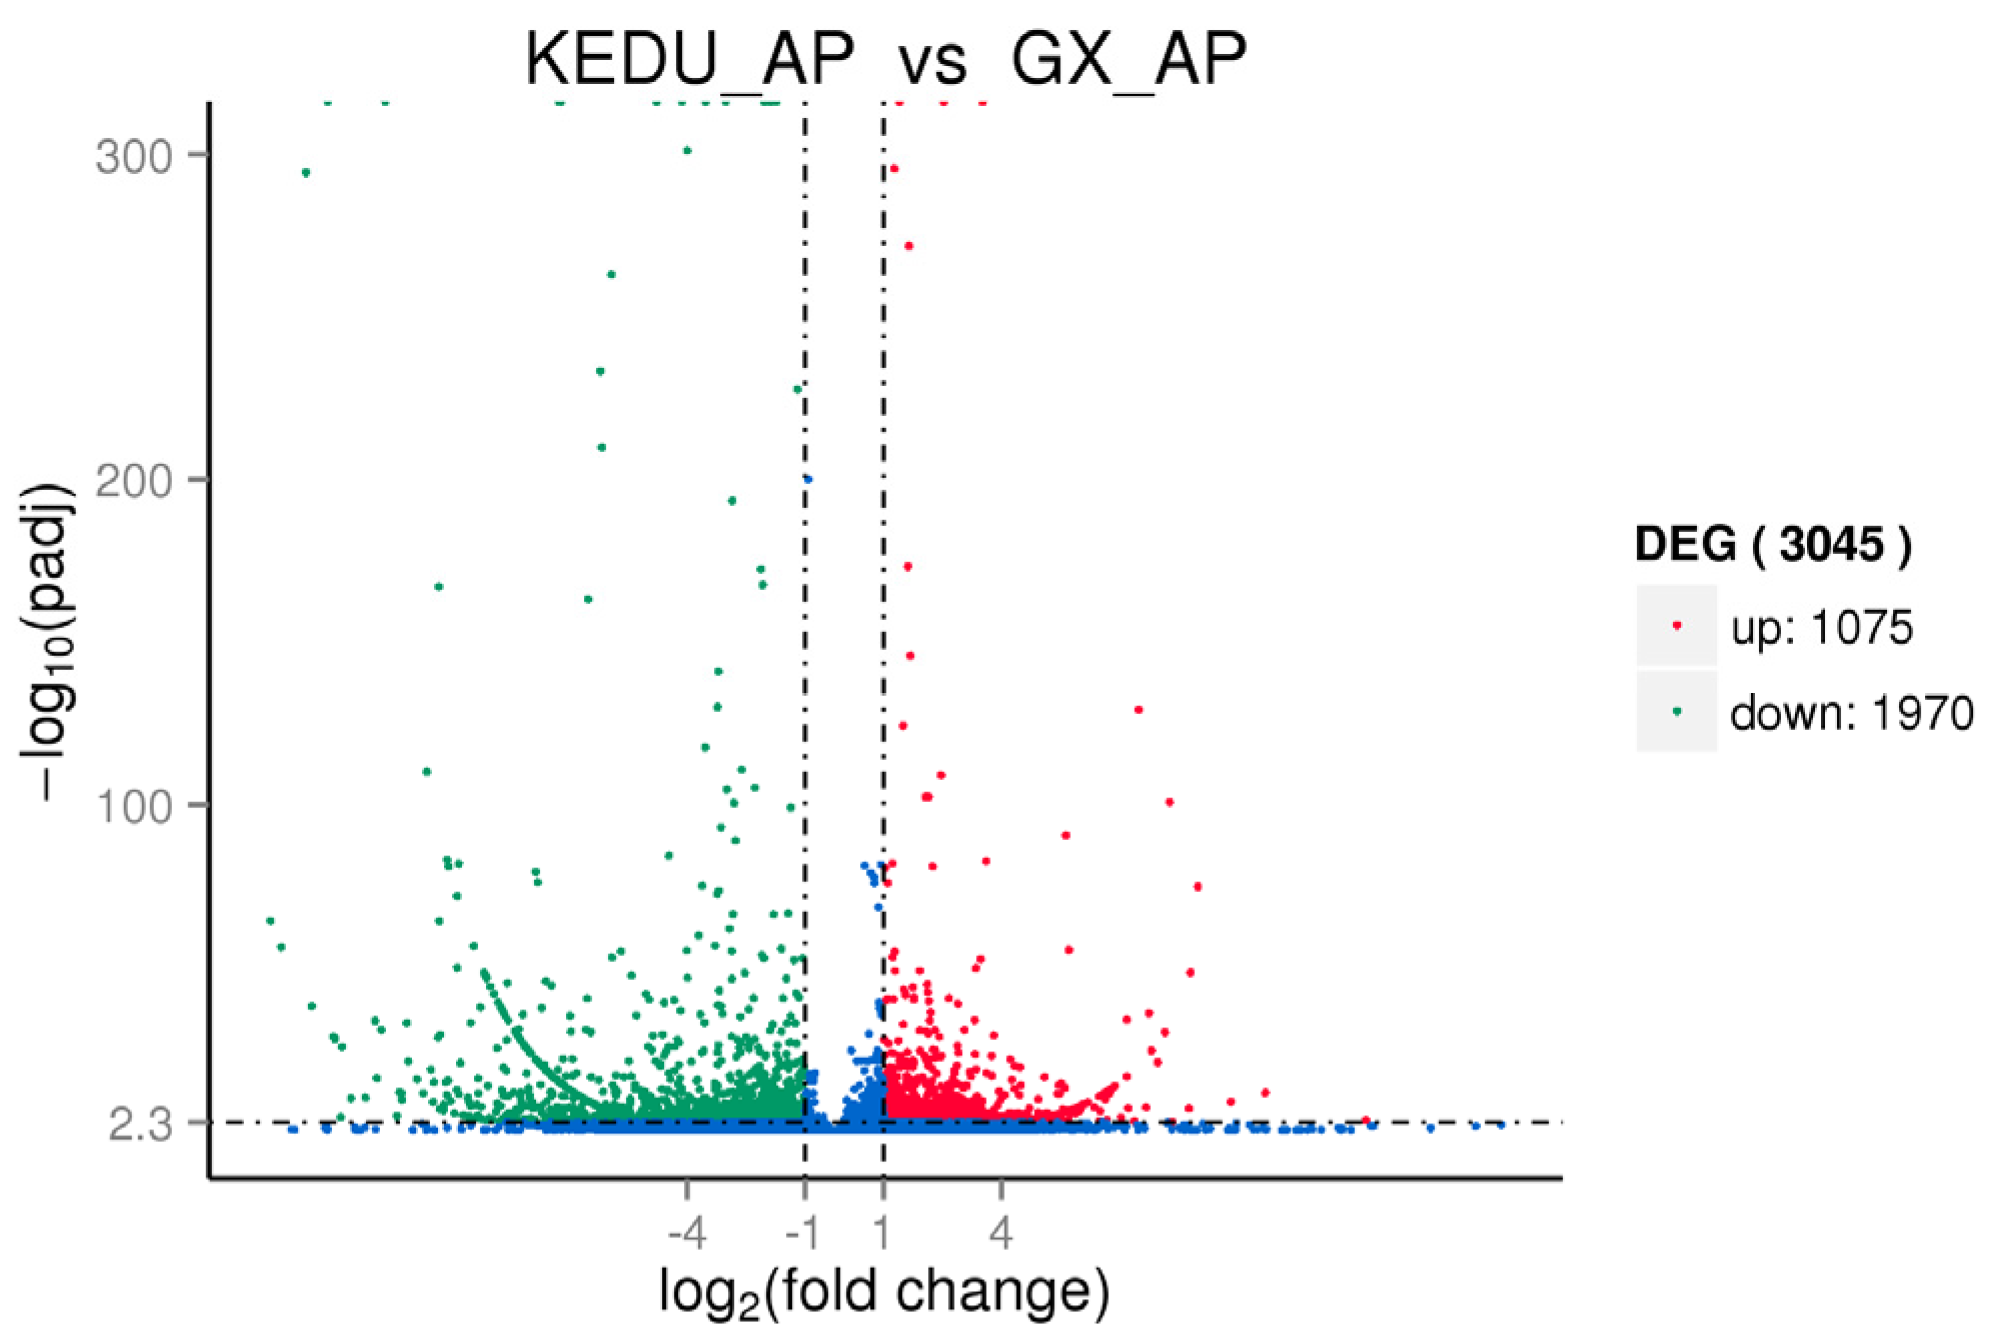
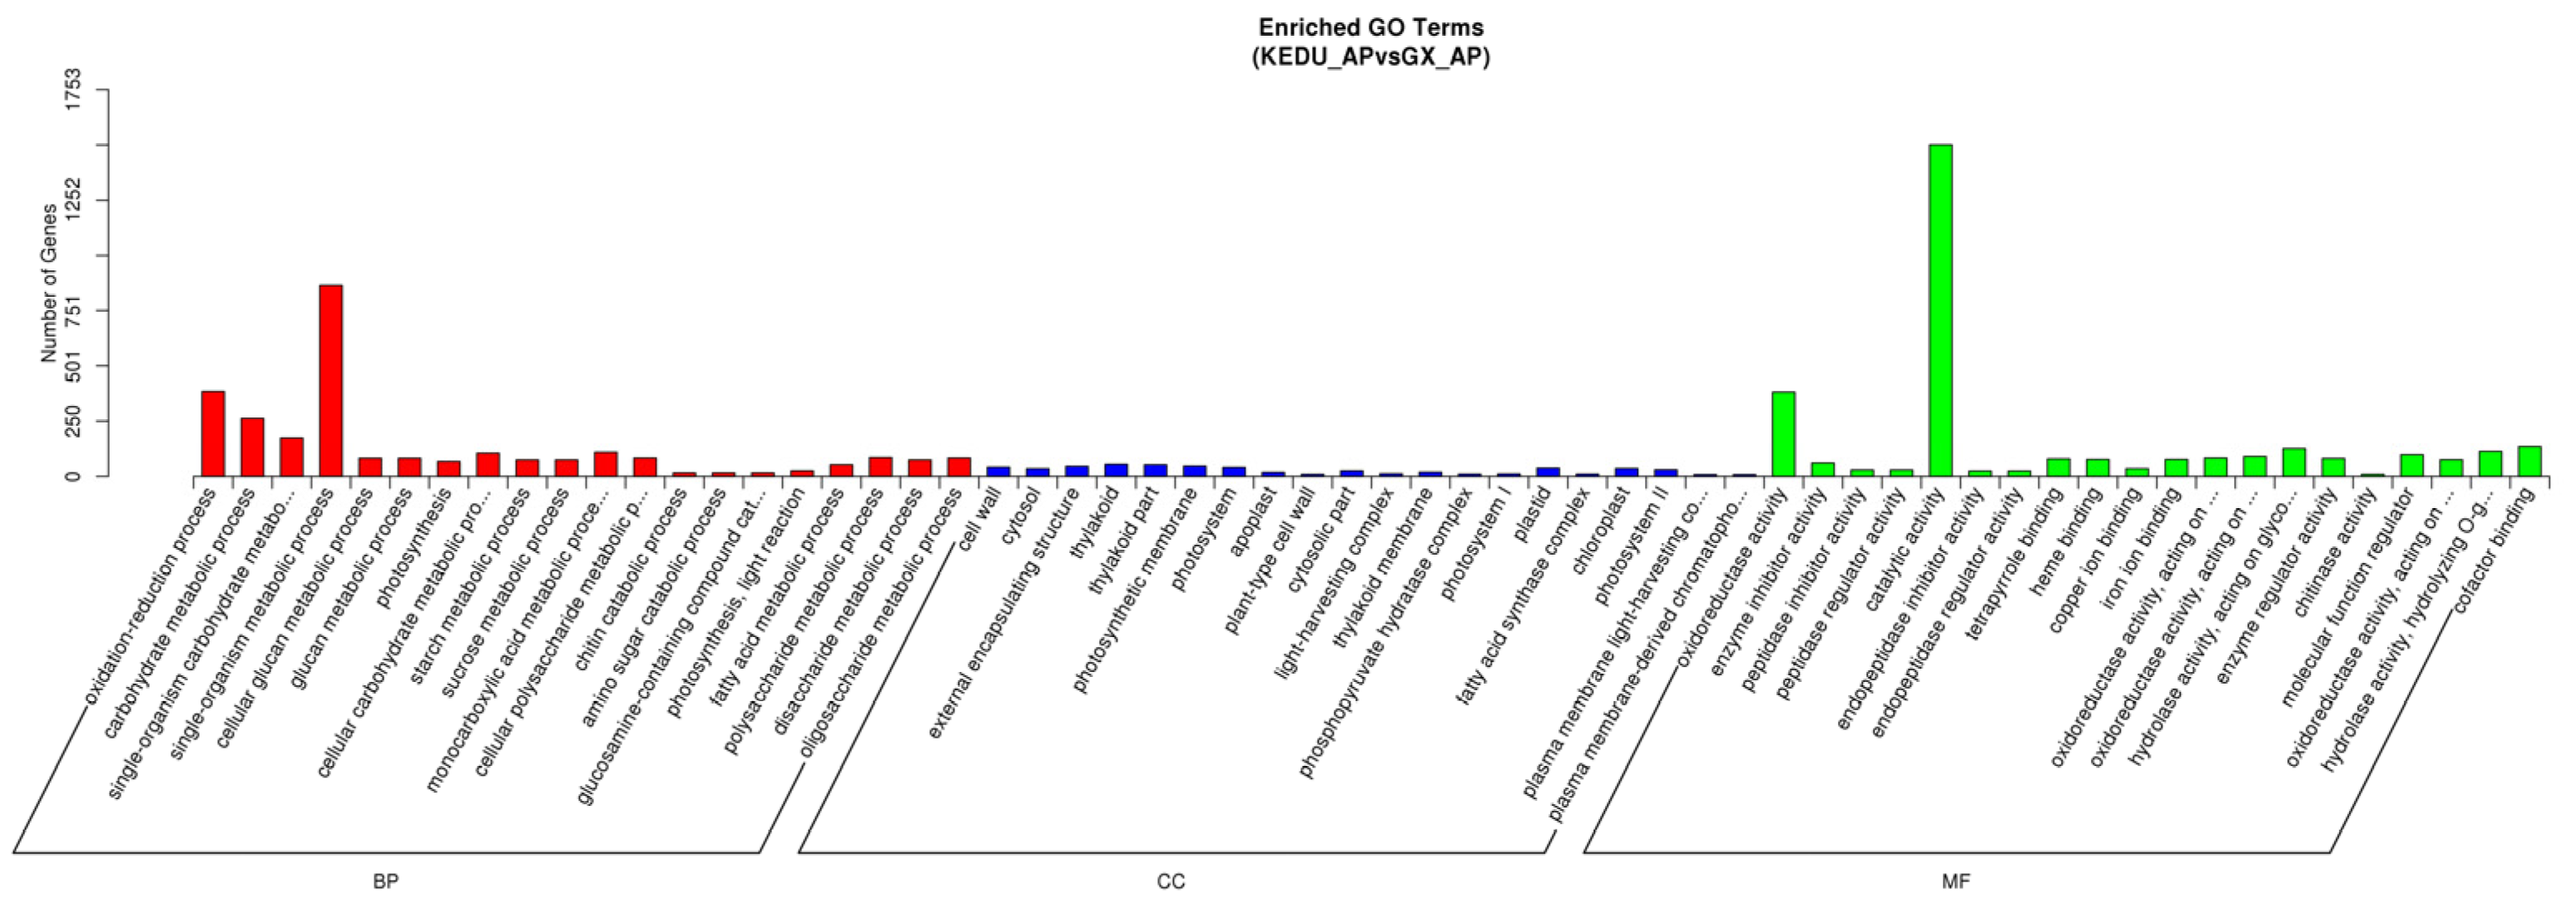
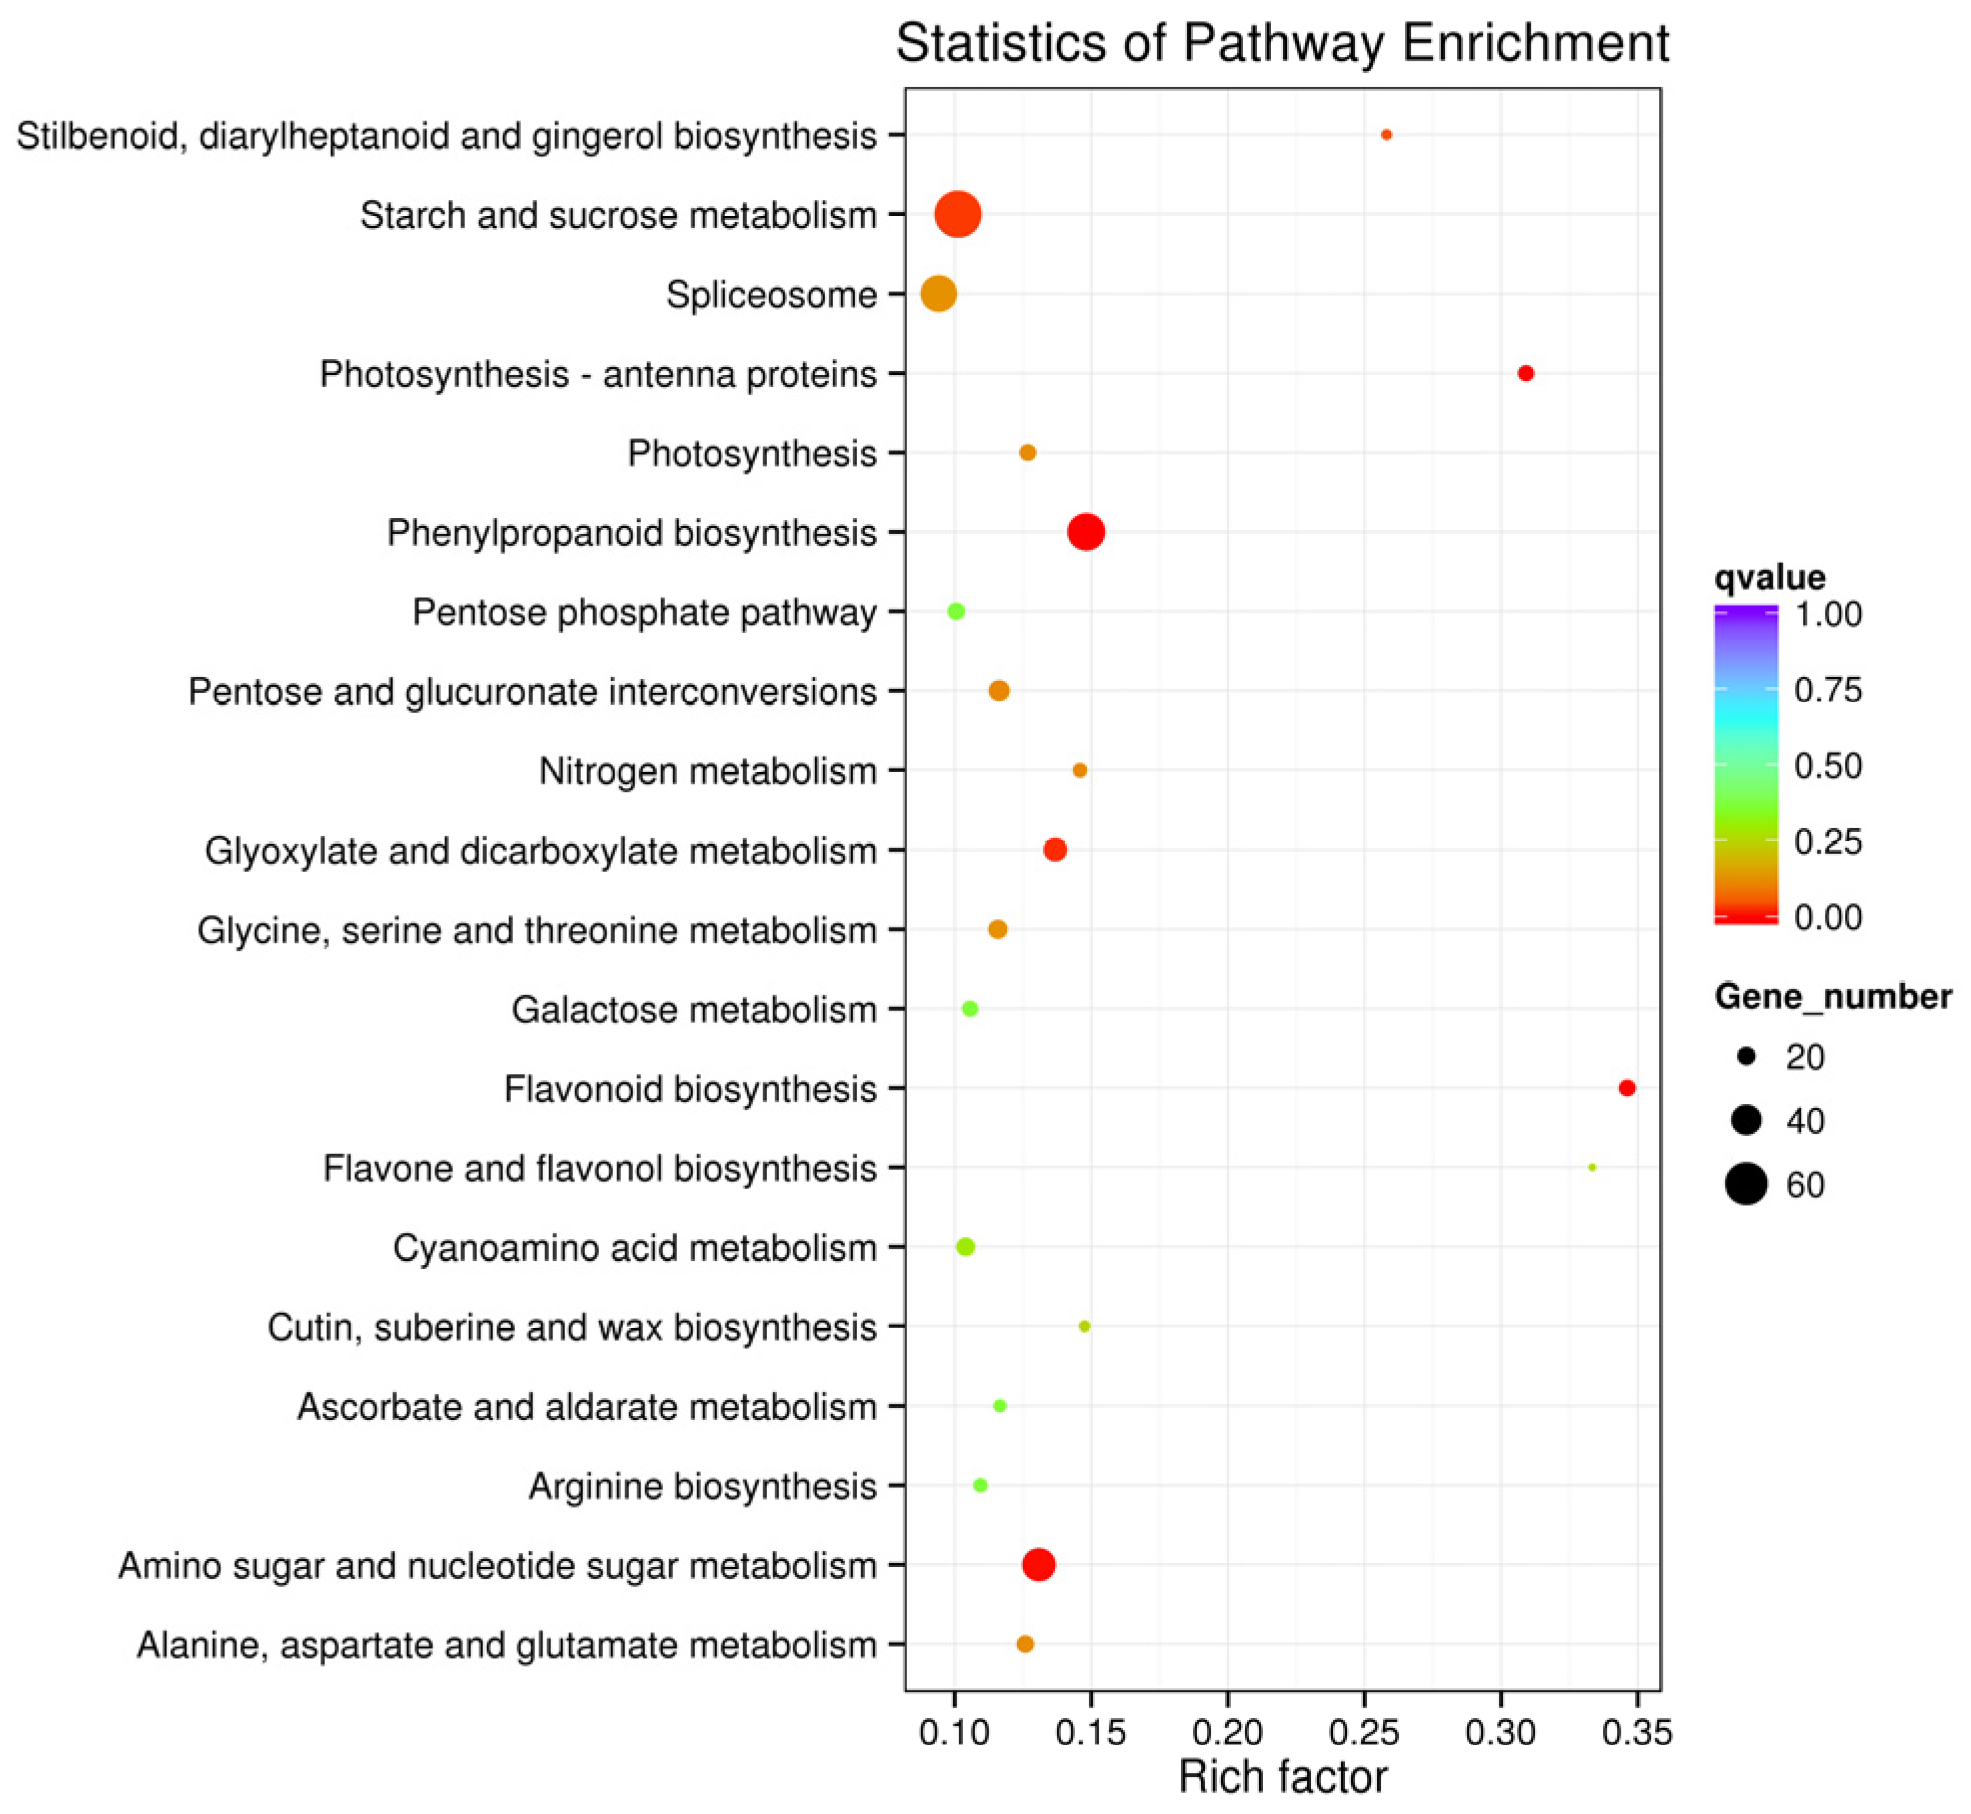
3.3. DEG Identification, GO and KEGG Enrichment Analysis

A total of 80,810 unigenes (Fragments per kilobase of exon per million fragments mapped (FPKM) > 0.3) in two groups were identified, with 57,213 unigenes in common. There were 3045 significant DEGs identified between the KEDU_AP and GX_AP libraries. For these DEGs, if log2Foldchange >1, the DEG was considered as up-regulated but if log2Fold change <−1, it was considered as down-regulated. The 3045 DEGs included 1075 up-regulated and 1970 down-regulated DEGs (Figure 4).
Between the two libraries of enriched GO terms, the analysis showed that ‘catalytic activity’ and ‘single-organism metabolic process’ had the highest degree of enrichment (Figure 5). In the KEGG enrichment analysis (Figure 6), the most significantly enriched pathway was ‘flavonoid biosynthesis’, which mainly consisted of up-regulated DEGs. The second most significantly enriched pathway was ‘phenylpropanoid biosynthesis’, which also mainly consisted of up-regulated DEGs. Down-regulated DEGs were dominant in the ‘photosynthesis-antenna proteins’ and ‘amino sugar and nucleotide sugar metabolism’ (Figure S1). The greatest numbers of DEGs were involved in ‘starch and sucrose metabolism’, followed by ‘phenylpropanoid biosynthesis’.

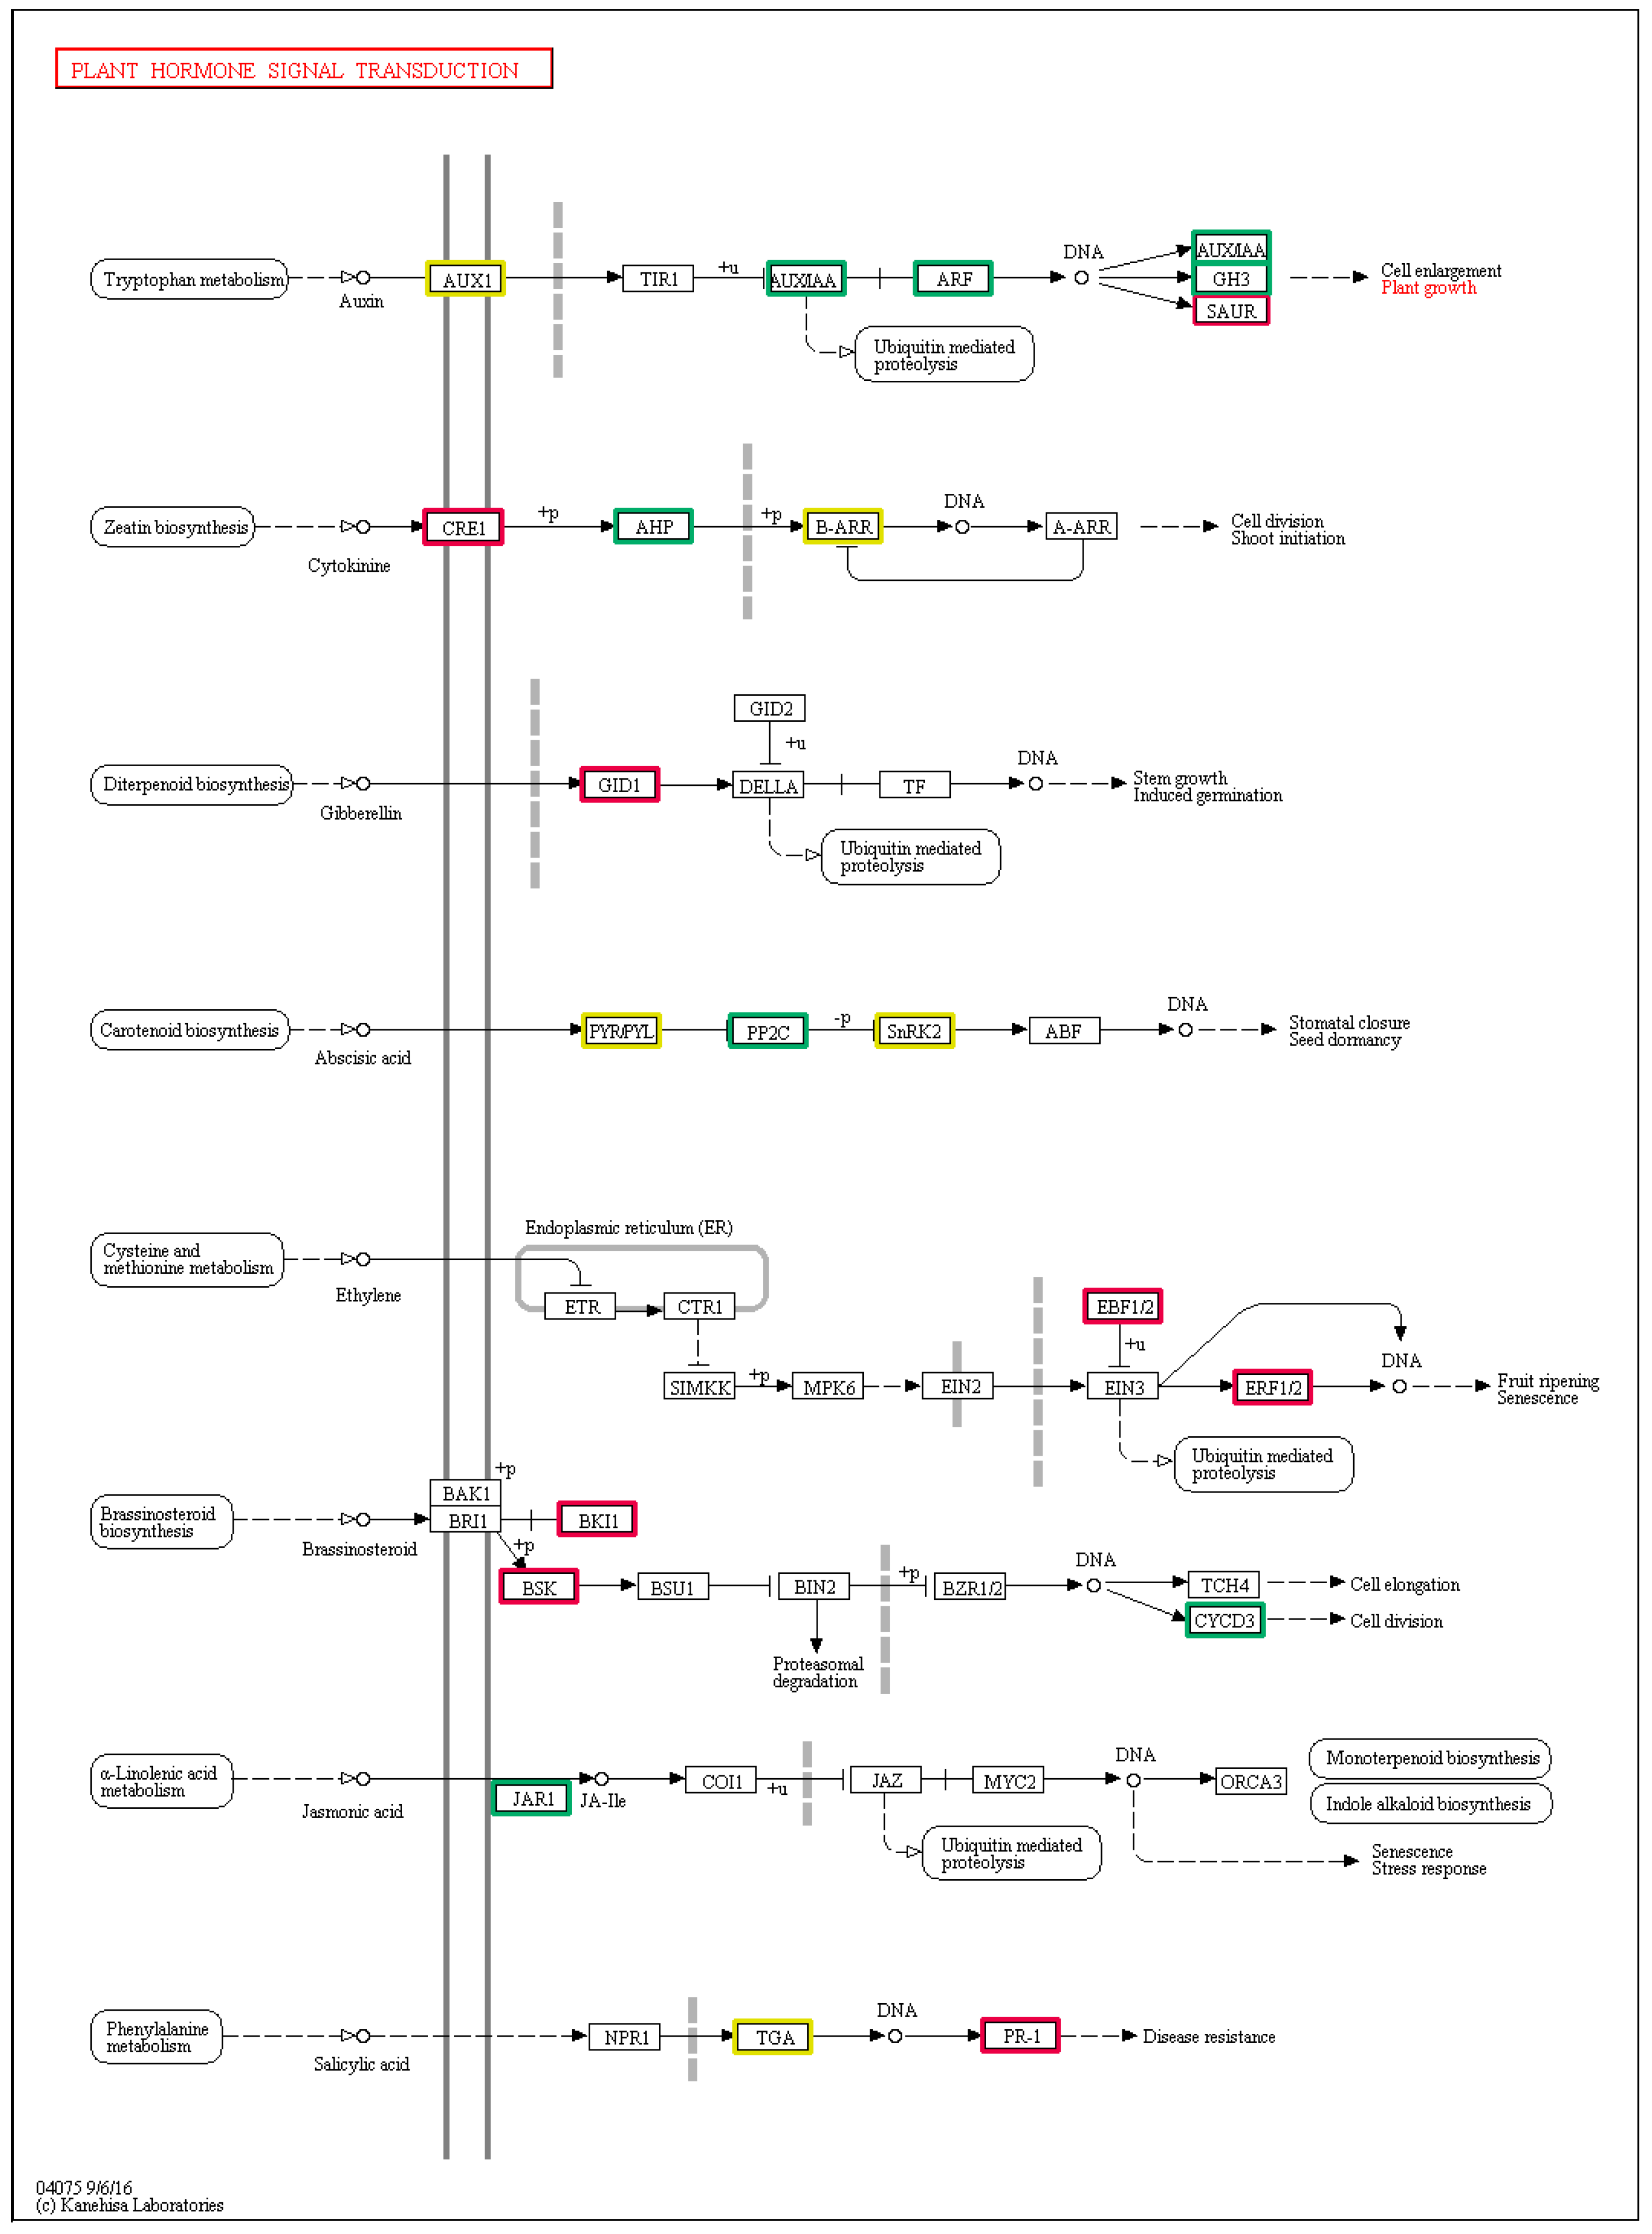
3.4. DEGs Involved in the Plant Hormone Signal Transduction Pathways

Plant hormones play an important role in plant cold tolerance. A total of 36 DEGs and 677 background unigenes were in the enriched pathway of plant hormone signal transduction (Figure 7). Plant hormone signal transduction contained eight sub-paths. In the auxin signal transduction sub-pathway, there were two up-regulated and nine down-regulated genes. In the cytokinin signal transduction sub-pathway, there were three up-regulated and four down-regulated genes. There was just one up-regulated gene in the gibberellin signal transduction sub-pathway. Only one down-regulated gene was related to jasmonic acid signal transduction. There were up-regulated and down-regulated genes in the brassinolide and salicylic acid signal transduction pathways, which of them all contained three up-regulated genes and one down-regulated gene. Ethylene and ABA have vital functions in cold-stress signaling. In the ethylene signal transduction sub-pathway, there were two up-regulated genes and one down-regulated gene. In the ABA signal transduction sub-pathway, there were two up-regulated genes and one down-regulated gene for PYR/PYL, two down-regulated genes for PP2C, and one up-regulated and two down-regulated genes for SnRK2.

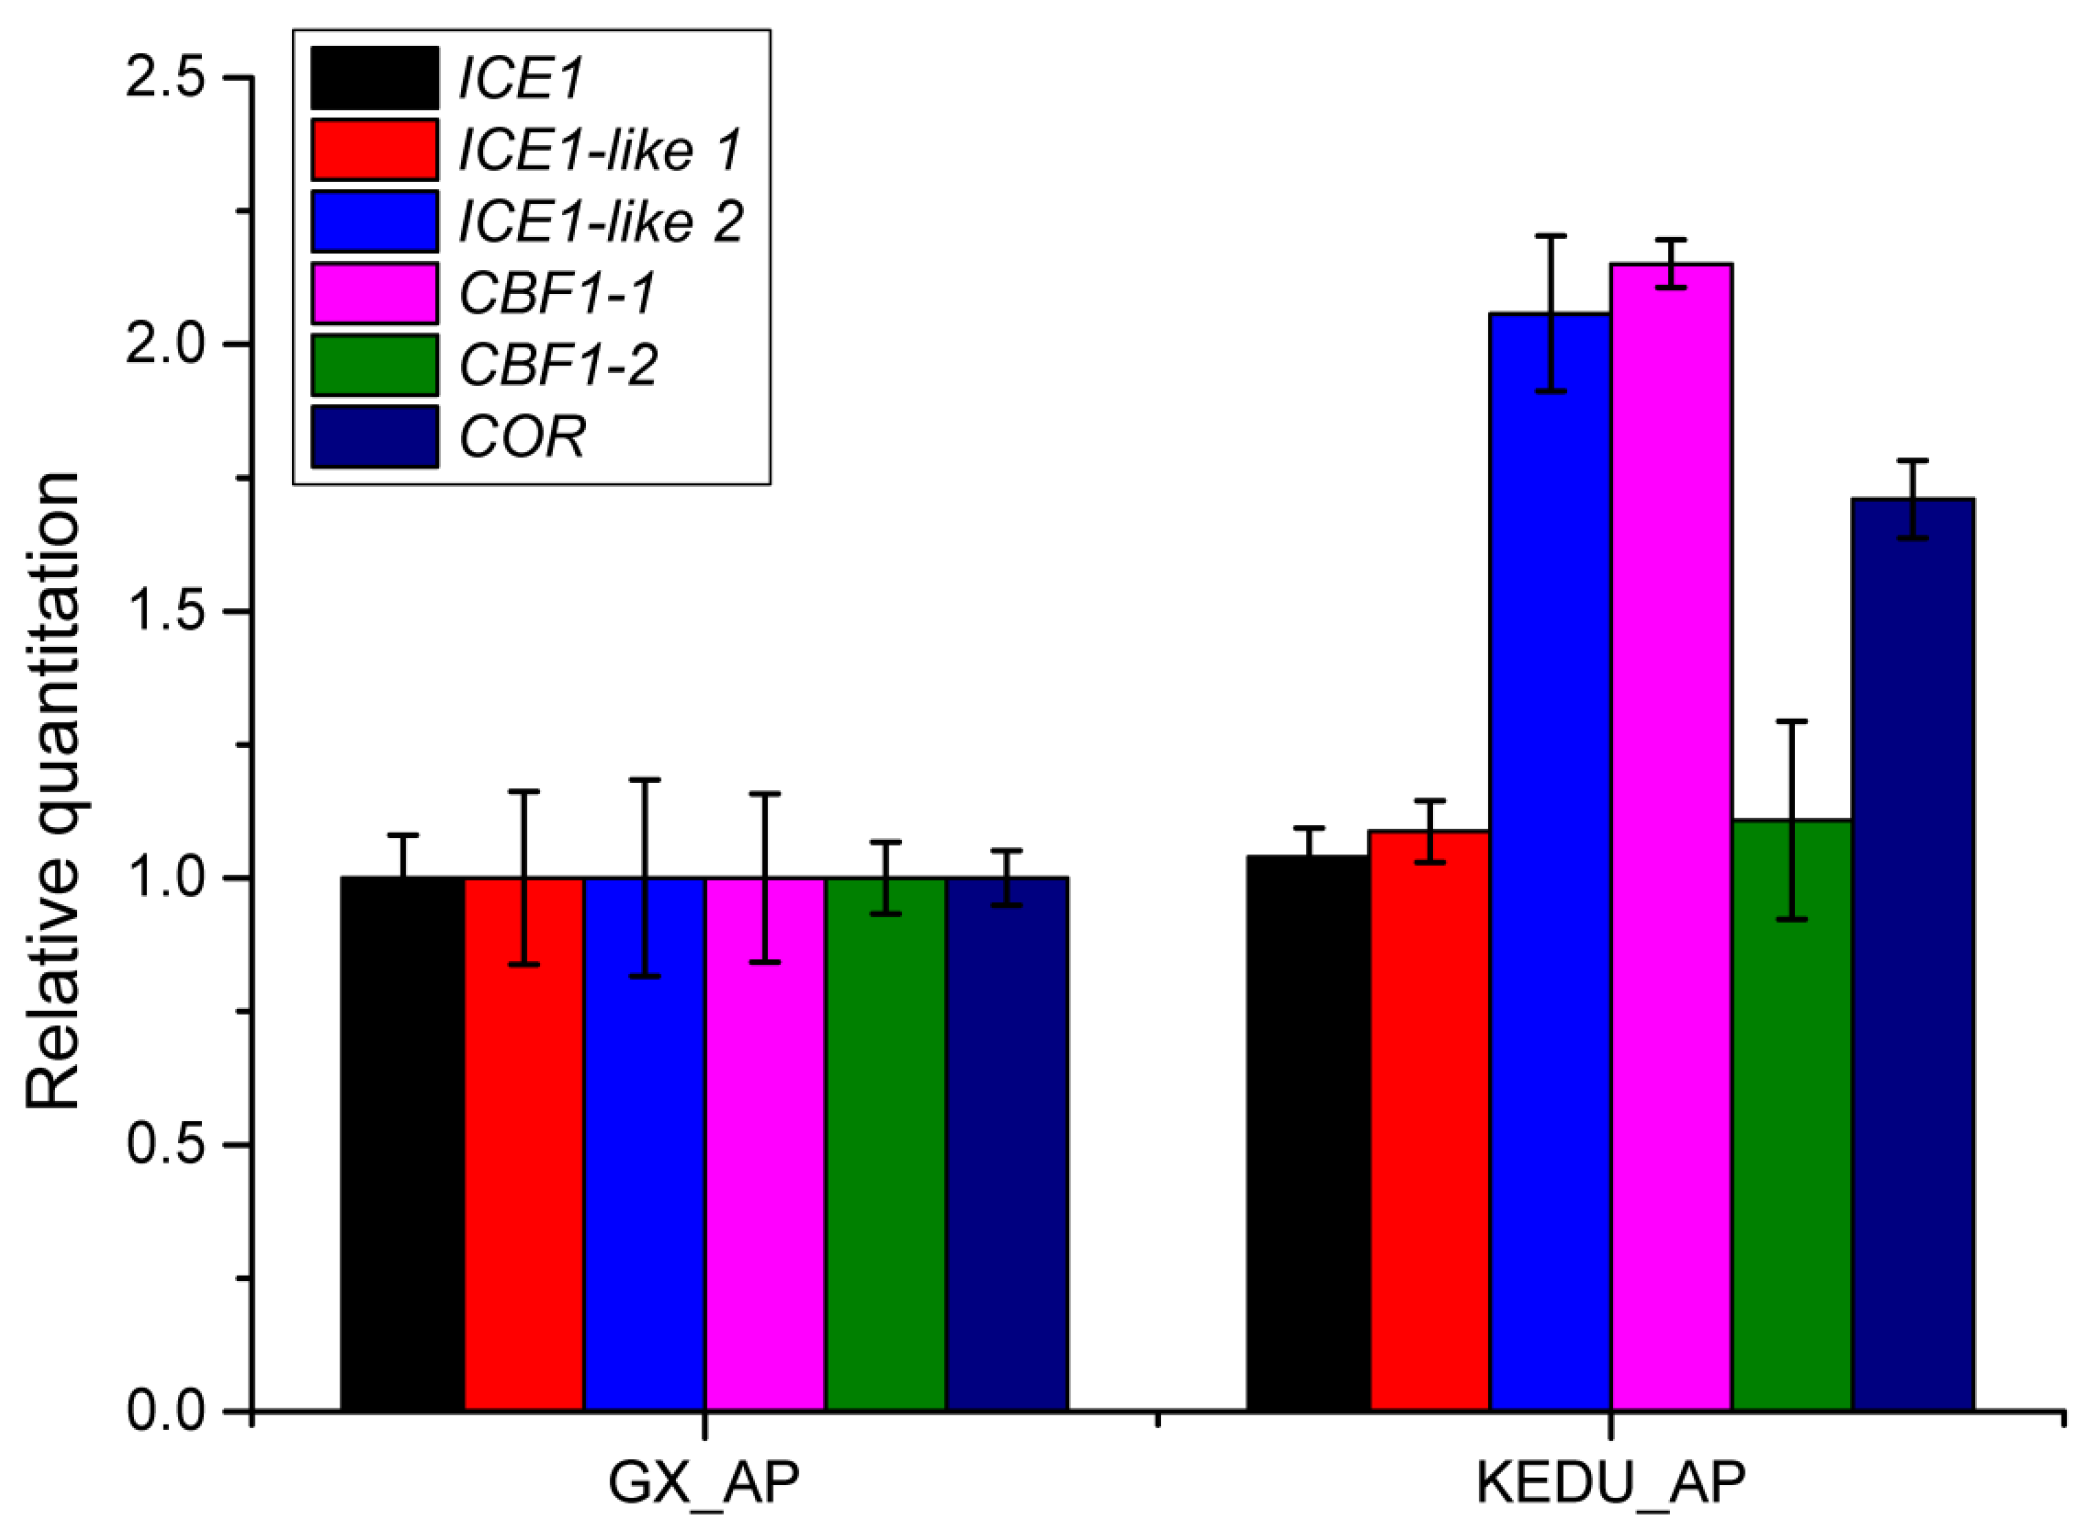
3.5. Verification by qRT-PCR

In the ICE1–CBF–COR pathway, we identified one ICE1, one COR, two ICE1-like and two CBF genes. These genes were up-regulated in cold-tolerant variety ‘Pingtang 1’ (KEDU_AP) by qRT-PCR verification (Figure 8). To verify the reliability of the transcriptome data, 11 DEGs were randomly selected and examined using qRT-PCR at the transcriptional level (Figure S2). The expression patterns of the 11 DEGs were consistent with the transcriptome data (R2 = 0.81321, p-value = 0.002334). These results indicate that our transcriptomic analysis was highly reproducible and reliable.

4. Discussion

As a key messenger, the cytosolic Ca2+ occupies an important role in response to cold stress [32,33]. Research shows that cold-induced Ca2+ influx is positively correlated with accumulation of cold-induced transcripts in Arabidopsis [34] and alfalfa (Medicago sativa L.) [35]. Cold stress increases the cytosolic Ca2+ level, and this is then sensed by Ca2+ sensor proteins such as calmodulin (CaM) and calcineurin B-like proteins (CBLs) [36,37]. The increased levels of Ca2+ in plant cells affect the expression level of CBF and COR genes in the cold signaling pathway [7,38]. In this study, 332 unigenes were annotated as CaMs and CBLs, and included 14 DEGs. Among these DEGs, seven (four CaM and three CBL) genes were up-regulated in KEDU_AP, and seven (six CaM and one CBL) were down-regulated (Figure S3 and Table 3).
Plant protein kinases, such as Mitogen-activated protein kinases (MAPKs), play a central role in cellular signaling. MKK2 is a member of the MAPK family, and is upstream of MPK4 and MPK6, which are activated by low temperatures [14]. Previous studies showed that the influx of calcium is involved in cold-stress regulation of MAPKs [39]. The receptor-like kinase CRLK1 may associate calcium signaling with the MAPK cascade by binding to calcium, and CaM interacts with MEK kinase 1 (MEKK1) [40] (Figure 9). We identified 93 MAPK unigenes, which included 11 DEGs: nine up-regulated and two down-regulated (Figure S3 and Table 3).
In this work, 56 differentially expressed TFs were identified, and were divided into six TF families: AP2/EREBP, WRKY, bZIP, MYB, NAC and B-ARR (Figure S4 and Table 3). Most of them have been reported to be associated with cold tolerance in plants [41,42,43,44]. The TFs of CBFs belong to the AP2/EREBP family [45]. Three CBF genes are known in Arabidopsis, and are induced with plant exposure to cold, and regulate COR gene accumulation [46,47] (Figure 9). Overexpression of OsMYB4 could improve freezing tolerance in Arabidopsis by increasing COR gene expression, and OsMYBS3 and OsMYB2 enhanced cold resistance in rice [48,49,50]. We identified six genes in the ICE1-CBF-COR pathway of P. edulis, and their expression levels in the cold-tolerant variety ‘Pingtang 1’ were higher than that in cold-susceptible ‘Purple Fragrance 1’.
In addition to the TFs, other important genes involved in plant cold tolerance include late-embryogenesis-abundant proteins (LEAs), antifreeze proteins (AFPs), superoxide dismutase (SOD) and proline [51,52,53]. LEAs are highly hydrophilic and provide protection for plants during cold stress. We also found four differentially expressed LEAs (Figure S3 and Table 3), with a high expression level in KEDU_AP.
In this study, we identified candidate genes and signaling pathways associated with cold tolerance by transcriptome sequencing of cold-tolerant variety ‘Pingtang 1’ and cold-susceptible ‘Purple Fragrance 1’. The heatmap of DEGs showed that many genes related to cold-tolerance had higher expression levels in the cold-tolerant variety, indicating that they played a role in the chilling stress response. This report is the first to identify genes and signaling pathways involved in cold tolerance using high-throughput transcriptome sequencing in P. edulis. These findings may provide useful insights into the molecular mechanisms regulating cold tolerance and genetic breeding in Passiflora spp.

5. Conclusions

P. edulis is mainly distributed in tropical and subtropical regions and has difficulty surviving at low temperatures. To elucidate the molecular mechanisms of cold tolerance, we collected the aboveground parts of cold-tolerant variety ‘Pingtang 1’ and cold-susceptible ‘Purple Fragrance 1’ and subjected them to high-throughput sequencing. In total, 26,284,018 clean reads were obtained, and 86,880 unigenes with a mean size of 1449 bp were assembled. There were 3045 significant differentially expressed genes (DEGs) identified between ‘Pingtang 1’ (KEDU_AP) and ‘Purple Fragrance 1’ (GX_AP). To provide reference for the cold-tolerance breeding of P. edulis, we screened many DEGs, constructed their expression profiles and analyzed their functions; some potentially vital cold-tolerance genes and transcription factors were identified, and the expression levels of the two varieties were compared and analyzed. As the first report on the high-throughput sequencing of cold-tolerant P. edulis, this study should provide novel insights into cold-tolerance genes for P. edulis and be a valuable molecular basis for study in Passiflora spp.

Supplementary Materials

The following are available online at www.mdpi.com/1999-4907/8/11/435/s1, Table S1: Primer sequences; Figure S1: KEGG pathway enrichment of up-regulated and down-regulated DEGs; Figure S2: Comparison of expression results between RNA sequencing (RNA-seq) and qRT-PCR; Figure S3: Heatmap of important DEGs associated with cold-tolerance; Figure S4: Heatmap of differentially expressed transcription factors (TFs) associated with cold-tolerance.

Acknowledgments

This project was supported by the Key Science and Technology Program of Guizhou Province ((2016)2525), the National Key Research and Development Program of China (2016YFC050260404), the Key Science and Technology Program of Guangzhou Province (201604020006), the Applied Basic Research Program of Guizhou Province ((2014)200208), the Priority Academic Program Development of Jiangsu Higher Education Institutions (PAPD) and the Collaborative Innovation Plan of Jiangsu Higher Education (CIP).

Author Contributions

S.L. and M.X. analyzed the data and wrote the manuscript. S.L. and C.C. performed the experiments. G.C., L.Z. and C.G. participated in data analysis. A.L. provided helpful suggestions in design of the project. M.X. conceived and designed the project. All authors read and approved the final manuscript.

Conflicts of Interest

The authors declare no conflict of interest.

Abbreviations

NrNCBI non-redundant protein sequences
NtNCBI non-redundant nucleotide sequences
PfamProtein family
COGClusters of orthologous groups of proteins
KOGEuKaryotic Orthologous Groups
Swiss-ProtA manually annotated and reviewed protein sequence database
KEGGKyoto encyclopedia of genes and genomes
KOKEGG ortholog database
GOGene ontology
FPKMFragments per kilobase of exon per million fragments mapped
DEGsDifferentially expressed genes

References

  1. Rodriguez, R.R.; Dallas, M.P. Aislamientoy cultivo de protoplastos enmaracuyá isolation and cultive of protoplast in passion fruit. Acta Biol. Colomb. 2004, 9, 35–46. [Google Scholar]
  2. Benincá, J.P.; Montanher, A.B.; Zucolotto, S.M.; Schenkel, E.P.; Fröde, T.S. Evaluation of the anti-inflammatory efficacy of Passiflora edulis. Food Chem. 2007, 104, 1097–1105. [Google Scholar] [CrossRef]
  3. Bernacci, L.C.; Soares-Scott, M.D.; Junqueira, N.T.V.; Passos, I.R.D.S.; Meletti, L.M.M. Passiflora edulis sims the correct taxonomic way to cite the yellow passionfruit (and of others colors). Rev. Bras. Frutic. 2008, 30, 566–576. [Google Scholar] [CrossRef]
  4. Rudnicki, M.; de Oliveira, M.R.; Veiga Pereira, T.d.; Reginatto, F.H.; Dal-Pizzol, F.; Fonseca Moreira, J.C. Antioxidant and antiglycation properties of Passiflora alata and Passiflora edulis extracts. Food Chem. 2007, 100, 719–724. [Google Scholar] [CrossRef]
  5. Benigni, R.; Capra, C.; Cattorini, P. Plante medicinale; chimica, farmacologia e terapia. Milan Inverni Della Beffa 1962, 2, 1012–1022. [Google Scholar]
  6. Zibadi, S.; Watson, R.R. Passion fruit (Passiflora edulis) composition, efficacy and safety. Evid. Based Integr. Med. 2004, 1, 183–187. [Google Scholar] [CrossRef]
  7. Chinnusamy, V.; Zhu, J.K.; Sunkar, R. Gene regulation during cold stress acclimation in plants. Methods Mol. Biol. 2010, 639, 39–55. [Google Scholar] [PubMed]
  8. Chinnusamy, V.; Zhu, J.; Zhu, J.K. Cold stress regulation of gene expression in plants. Trends Plant Sci. 2007, 12, 444–451. [Google Scholar] [CrossRef] [PubMed]
  9. Thomashow, M.F. Plant cold acclimation: Freezing tolerance genes and regulatory mechanisms. Annu. Rev. Plant Biol. 1999, 50, 571–599. [Google Scholar] [CrossRef] [PubMed]
  10. Jaglo, K.R.; Kleff, S.; Amundsen, K.L.; Zhang, X.; Haake, V.; Zhang, J.Z.; Deits, T.; Thomashow, M.F. Components of the Arabidopsis C-repeat/dehydration-responsive element binding factor cold-response pathway are conserved in Brassica napus and other plant species. Plant Physiol. 2001, 127, 910–917. [Google Scholar] [CrossRef] [PubMed]
  11. Pellegrineschi, A.; Reynolds, M.; Pacheco, M.; Brito, R.M.; Almeraya, R.; Yamaguchi-Shinozaki, K.; Hoisington, D. Stress-induced expression in wheat of the Arabidopsis thaliana DREB1a gene delays water stress symptoms under greenhouse conditions. Genome 2004, 47, 493–500. [Google Scholar] [CrossRef] [PubMed]
  12. Hsieh, T.H.; Lee, J.T.; Yang, P.T.; Chiu, L.H.; Charng, Y.Y.; Wang, Y.C.; Chan, M.T. Heterology expression of the arabidopsis C-repeat/dehydration response element binding factor 1 gene confers elevated tolerance to chilling and oxidative stresses in transgenic tomato. Plant Physiol. 2002, 129, 1086–1094. [Google Scholar] [CrossRef] [PubMed]
  13. Oh, S.J.; Song, S.I.; Kim, Y.S.; Jang, H.J.; Kim, S.Y.; Kim, M.; Kim, Y.K.; Nahm, B.H.; Kim, J.K. Arabidopsis CBF3/DREB1a and ABF3 in transgenic rice increased tolerance to abiotic stress without stunting growth. Plant Physiol. 2005, 138, 341–351. [Google Scholar] [CrossRef] [PubMed]
  14. Zhu, J.K. Abiotic stress signaling and responses in plants. Cell 2016, 167, 313–324. [Google Scholar] [CrossRef] [PubMed]
  15. Teige, M.; Scheikl, E.; Eulgem, T.; Doczi, R.; Ichimura, K.; Shinozaki, K.; Dangl, J.L.; Hirt, H. The MKK2 pathway mediates cold and salt stress signaling in Arabidopsis. Mol. Cell 2004, 15, 141–152. [Google Scholar] [CrossRef] [PubMed]
  16. Ding, Y.; Li, H.; Zhang, X.; Xie, Q.; Gong, Z.; Yang, S. Ost1 kinase modulates freezing tolerance by enhancing ice1 stability in arabidopsis. Dev. Cell 2015, 32, 278–289. [Google Scholar] [CrossRef] [PubMed]
  17. Fowler, S. Arabidopsis transcriptome profiling indicates that multiple regulatory pathways are activated during cold acclimation in addition to the CBF cold response pathway. Plant Cell 2002, 14, 1675–1690. [Google Scholar] [CrossRef] [PubMed]
  18. Kreps, J.A.; Wu, Y.; Chang, H.S.; Zhu, T.; Wang, X.; Harper, J.F. Transcriptome changes for Arabidopsis in response to salt, osmotic, and cold stress. Plant Physiol. 2002, 130, 2129–2141. [Google Scholar] [CrossRef] [PubMed]
  19. Mantyla, E.; Lang, V.; Palva, E.T. Role of abscisic acid in drought-lnduced freezing tolerance, cold acclimation, and accumulation of lti78 and rabi8 proteins in Arabidopsis thaliana. Plant Physiol. 1995, 107, 141–148. [Google Scholar] [CrossRef] [PubMed]
  20. Gilmour, S.J.; Thomashow, M.F. Cold acclimation and cold-regulated gene expression in ABA mutants of Arabidopsis thaliana. Plant Mol. Biol. 1991, 17, 1233–1240. [Google Scholar] [CrossRef] [PubMed]
  21. Dong, W.P.; Luo, C.; Long, X.Q.; Hu, J.; Li, Y. Effects of low temperature stress on physiological indexes of cold resistance of Passiflora edulis. Plant Physiol. J. 2015, 51, 771–777. [Google Scholar]
  22. Martin, M. Cutadapt removes adapter sequences from high-throughput sequencing reads. EMBnet J. 2011, 17, 10–12. [Google Scholar] [CrossRef]
  23. Grabherr, M.G.; Haas, B.J.; Yassour, M.; Levin, J.Z.; Thompson, D.A.; Amit, I.; Adiconis, X.; Fan, L.; Raychowdhury, R.; Zeng, Q.; et al. Full-length transcriptome assembly from RNA-seq data without a reference genome. Nat. Biotechnol. 2011, 29, 644–652. [Google Scholar] [CrossRef] [PubMed]
  24. Götz, S.; García-Gómez, M.J.; Terol, J.; Williams, T.D.; Nagaraj, S.H.; Nueda, M.J.; Robles, M.; Talón, M.; Dopazo, J.; Conesa, A. High-throughput functional annotation and data mining with the blast2go suite. Nucleic Acids Res. 2008, 36, 3420–3435. [Google Scholar] [CrossRef] [PubMed]
  25. Li, B.; Dewey, C.N. Rsem: Accurate transcript quantification from RNA-seq data with or without a reference genome. BMC Bioinform. 2011, 12, 323. [Google Scholar] [CrossRef] [PubMed]
  26. Robinson, M.; Oshlack, A. A scaling normalization method for differential expression analysis of RNA-seq data. Genome Biol. 2010, 11, R25. [Google Scholar] [CrossRef] [PubMed]
  27. Robinson, M.; McCarthy, D.; Smyth, G. Edger: A bioconductor package for differential expression analysis of digital gene expression data. Bioinformatics 2010, 26, 139–140. [Google Scholar] [CrossRef] [PubMed]
  28. Storey, J.D.; Tibshirani, R. Statistical significance for genomewide studies. Proc. Natl. Acad. Sci. USA 2003, 100, 9440–9445. [Google Scholar] [CrossRef] [PubMed]
  29. Anders, S.; Huber, W. Differential expression analysis for sequence count data. Genome Biol. 2010, 11, R106. [Google Scholar] [CrossRef] [PubMed]
  30. Young, M.D.; Wakefield, M.J.; Smyth, G.K.; Oshlack, A. Gene ontology analysis for RNA-seq: Accounting for selection bias. Genome Biol. 2010, 11, R14. [Google Scholar] [CrossRef] [PubMed]
  31. Mao, X.; Cai, T.; Olyarchuk, J.G.; Wei, L. Automated genome annotation and pathway identification using the kegg orthology (ko) as a controlled vocabulary. Bioinformatics 2005, 21, 3787–3793. [Google Scholar] [CrossRef] [PubMed]
  32. Reddy, A.S.N.; Ali, G.S.; Celesnik, H.; Day, I. Coping with stresses roles of calcium and calciumcalmodulin-regulated gene expression. Plant Cell 2011, 23, 2010–2032. [Google Scholar] [CrossRef] [PubMed]
  33. Janska, A.; Marsık, P.; Zelenkova, S.; Ovesna, J. Cold stress and acclimation—What is important for metabolic adjustment. Plant Biol. 2010, 12, 395–405. [Google Scholar] [CrossRef] [PubMed]
  34. Henriksson, K.N.; Trewavas, A.J. The effect of short-term low-temperature treatments on gene expression in arabidopsis correlates with changes in intracellular Ca2+ levels. Plant Cell Environ. 2003, 26, 485–496. [Google Scholar] [CrossRef]
  35. Reddy, V.S.; Reddy, A.S.N. Proteomics of calcium-signaling components in plants. Phytochemistry 2004, 65, 1745–1776. [Google Scholar] [CrossRef] [PubMed]
  36. Tuteja, N.; Mahajan, S. Further characterization of calcineurin B-like protein and its interacting partner CBL-interacting protein kinase from Pisum sativum. Plant Signal. Behav. 2007, 2, 358–361. [Google Scholar] [CrossRef] [PubMed]
  37. Pandey, G.K. Emergence of a novel calcium signaling pathway in plants CBL-CIPK signaling network. Physiol. Mol. Biol. Plants 2008, 14, 51–68. [Google Scholar] [CrossRef] [PubMed]
  38. Theocharis, A.; Cle’ment, C.; Barka, E.A. Physiological and molecular changes in plants grown at low temperatures. Planta 2012, 235, 1091–1105. [Google Scholar] [CrossRef] [PubMed]
  39. Sangwan, V.; Örvar, B.L.; Beyerly, J.; Hirt, H.; Dhindsa, R.S. Opposite changes in membrane fluidity mimic cold andheat stress activation of distinct plant map kinase pathways. Plant J. 2002, 31, 629–638. [Google Scholar] [CrossRef] [PubMed]
  40. Yang, T.; Ali, G.S.; Yang, L.; Du, L.; Reddy, A.S.N.; Poovaiah, B.W. Calciumcalmodulin-regulated receptor-like kinase CRLK1 interacts with MEKK1 in plants. Plant Signal. Behav. 2010, 5, 991–994. [Google Scholar] [CrossRef] [PubMed]
  41. Rushton, P.J.; Somssich, I.E.; Ringler, P.; Shen, Q.J. Wrky transcription factors. Trends Plant Sci. 2010, 15, 247–258. [Google Scholar] [CrossRef] [PubMed]
  42. Jakoby, M.; Weisshaara, B.; Dröge-Laserb, W.; Vicente-Carbajosac, J.; Tiedemannd, J.; Kroje, T.; Parcye, F. Bzip transcription factors in Arabidopsis. Trends Plant Sci. 2002, 7, 106–111. [Google Scholar] [CrossRef]
  43. Van Buskirka, H.A.; Thomashow, M.F. Arabidopsis transcription factors regulating cold acclimation. Physiol. Plant. 2006, 126, 72–80. [Google Scholar] [CrossRef]
  44. Zhang, L.; Zhao, G.; Jia, J.; Liu, X.; Kong, X. Molecular characterization of isolated wheat MYB genes and analysis of their expression during abiotic stress. J. Exp. Bot. 2012, 63, 203–214. [Google Scholar] [CrossRef] [PubMed]
  45. Stockinger, E.J.; Gilmour, S.J.; Thomashow, M.F. Arabidopsis thaliana cbf1 encodes an ap2 domain-containing transcriptional activator that binds to the C-repeatydre, a cis-acting DNA regulatory element that stimulates transcription in response to low temperature and water deficit. Proc. Natl. Acad. Sci. USA 1997, 94, 1035–1040. [Google Scholar] [CrossRef] [PubMed]
  46. Medina, J.N.; Bargues, M.N.; Terol, J.; Pe’rez-Alonso, M.; Salinas, J. The Arabidopsis CBF gene family is composed of three genes encoding AP2 domain-containing proteins whose expression is regulated by low temperature but not by abscisic acid or dehydration. Plant Physiol. 1999, 119, 463–469. [Google Scholar] [CrossRef] [PubMed]
  47. Gilmour, S.J.; Zarka, D.G.; Stockinger, E.J.; Salazar, M.P.; Houghton, J.M.; Thomashow, M.F. Low temperature regulation of the arabidopsis cbf family of ap2 transcriptional activators as an early step in coldinduced cor gene expression. Plant J. 1998, 16, 433–442. [Google Scholar] [CrossRef] [PubMed]
  48. Su, C.-F.; Wang, Y.-C.; Hsieh, T.-H.; Lu, C.-A.; Tseng, T.-H.; Yu, S.-M. A novel mybs3-dependent pathway confers cold tolerance in rice. Plant Physiol. 2010, 153, 145–158. [Google Scholar] [CrossRef] [PubMed]
  49. Vannini, C.; Locatelli, F.; Bracale, M.; Magnani, E.; Marsoni, M.; Osnato, M.; Mattana, M.; Baldoni, E.; Coraggio, I. Overexpression of the rice osmyb4 gene increases chilling and freezing tolerance of arabidopsis thaliana plants. Plant J. 2004, 37, 115–127. [Google Scholar] [CrossRef] [PubMed]
  50. Yang, A.; Dai, X.; Zhang, W.-H. A r2r3-type myb gene, osmyb2, is involved in salt, cold, and dehydration tolerance in rice. J. Exp. Bot. 2012, 63, 2541–2556. [Google Scholar] [CrossRef] [PubMed]
  51. Gill, S.; Tuteja, N. Reactive oxygen species and antioxidant machinery in abiotic stress tolerance in crop plants. Plant Physiol. Biochem. 2010, 48, 909–930. [Google Scholar] [CrossRef] [PubMed]
  52. Szabados, L.; Savour, A. Proline: A multifunctional amino acid. Trends Plant Sci. 2010, 15, 89–97. [Google Scholar] [CrossRef] [PubMed]
  53. Griffith, M.; Yaish, M. Antifreeze proteins in overwintering plants: A tale of two activities. Trends Plant Sci. 2004, 9, 399–405. [Google Scholar] [CrossRef] [PubMed]
Figure 1. Gene ontology (GO) classification of unigenes. All the annotated unigenes were divided into three functional GO categories: biological process (BP), cellular component (CC) and molecular function (MF).
Forests 08 00435 g001
Figure 2. EuKaryotic Orthologous Groups (KOG) annotation of putative proteins. The x-axis indicates the names of the 25 groups of KOG. The y-axis indicates the percentage of the number of genes annotated to the group out of the total number of genes annotated.
Forests 08 00435 g002
Figure 3. Kyoto encyclopedia of genes and genomes (KEGG) annotation of putative proteins. The x-axis indicates the percentage of the number of genes annotated to the pathway out of the total number of genes annotated. The y-axis indicates the name of the KEGG metabolic pathway. The genes were divided into five branches according to the KEGG metabolic pathway: Cellular Processes (A), Environmental Information Processing (B), Genetic Information Processing (C), Metabolism (D) and Organismal Systems (E).
Forests 08 00435 g003
Figure 4. Differentially expressed genes (DEGs) identified between KEDU_AP and GX_AP. The red dots represent significant up-regulated genes and the green dots represent down-regulated genes.
Forests 08 00435 g004
Figure 5. Functional gene ontology classification of DEGs. The y-axis indicates the number of DEGs in a category.
Forests 08 00435 g005
Figure 6. KEGG pathway enrichment of DEGs. The y-axis indicates the pathway name, and the x-axis indicates the enrichment factor corresponding to the pathway. The q-value is represented by the color of the dot. The number of DEGs is represented by the size of the dots.
Forests 08 00435 g006
Figure 7. DEGs involved in the plant hormone signal transduction pathway. The enriched KEGG ortholog database (KO) terms are colored according to DEG regulation: red indicates up-regulation, green indicates down-regulation, and yellow indicates both up- and down-regulation.
Forests 08 00435 g007
Figure 8. The expression of six genes involved in the ICE1–CBF–COR pathway. ICE, Cluster-5862.10114; ICE-like 1, Cluster-5862.30769; ICE-like 2, Cluster-5862.1181; CBF1-1, Cluster-5862.30492; CBF1-2, Cluster-5862.29181; and COR, Cluster-5862.23126.
Forests 08 00435 g008
Figure 9. Diagram of cold-responsive regulatory networks [8,14]. The arrows indicate activation, whereas lines ending with a bar indicate negative regulation; the “?” indicates unknown cis-elements. Abbreviations: CaM, calmodulin; CBLs, calcineurin B-like proteins; MAPKs, mitogen-activated protein kinases; ICE1, inducer of CBF expression 1; MYB, V-MYB avian myeloblastosis viral oncogene homolog; MYBRS, MYB transcription factor recognition sequence; OST1, open stomata 1 (SnRK2.6); HOS1, high expression of osmotically responsive genes1; CBF, C-repeat binding factor; COR, cold-responsive genes; CRT, C-repeat elements; DRE, dehydration-responsive elements; LOS2, low expression of osmotically responsive genes 2; ZAT10 and ZAT12 are two C2H2 zinc finger transcription factors.
Forests 08 00435 g009
Table 1. Length distribution of unigenes and transcripts.
Nucleotide LengthTranscriptsUnigenes
200–500 bp60,59820,947
0.5–1k bp22,60521,684
1–2k bp22,07322,051
>2k bp22,19822,198
Total127,47486,880
Min length (bp)201201
Mean length (bp)10771449
Max length (bp)13,39713,397
N50 (bp)20572222
Table 2. Unigenes were annotated to the seven databases.
ComponentNumber of UnigenesPercentage (%)
Annotated in NCBI non-redundant protein sequences (NR)60,02869.09
Annotated in NCBI non-redundant nucleotide sequences (NT)46,09353.05
Annotated in KEGG ortholog database (KO)24,31227.98
Annotated in Swiss-Prot47,71754.92
Annotated in Pfam45,54452.42
Annotated in Gene ontology (GO)46,75453.81
Annotated in EuKaryotic Orthologous Groups (KOG)17,74220.42
Annotated in all databases10,45712.03
Annotated in at least one database64,06773.74
Total unigenes86,880
Table 3. Identified DEGs, unigene numbers and ratios of DEG/unigene.
ComponentUnigenesDEGsRatio (%)
AP2/EREBP21683.7
WRKY161127.5
bZIP18184.4
MYB387143.6
NAC221115.0
B-ARR20315
CaM/CBLs332144.2
MAPK931111.8
LEA38410.5

