Wild Apple Growth and Climate Change in Southeast Kazakhstan

Abstract
:1. Introduction
2. Materials and Methods
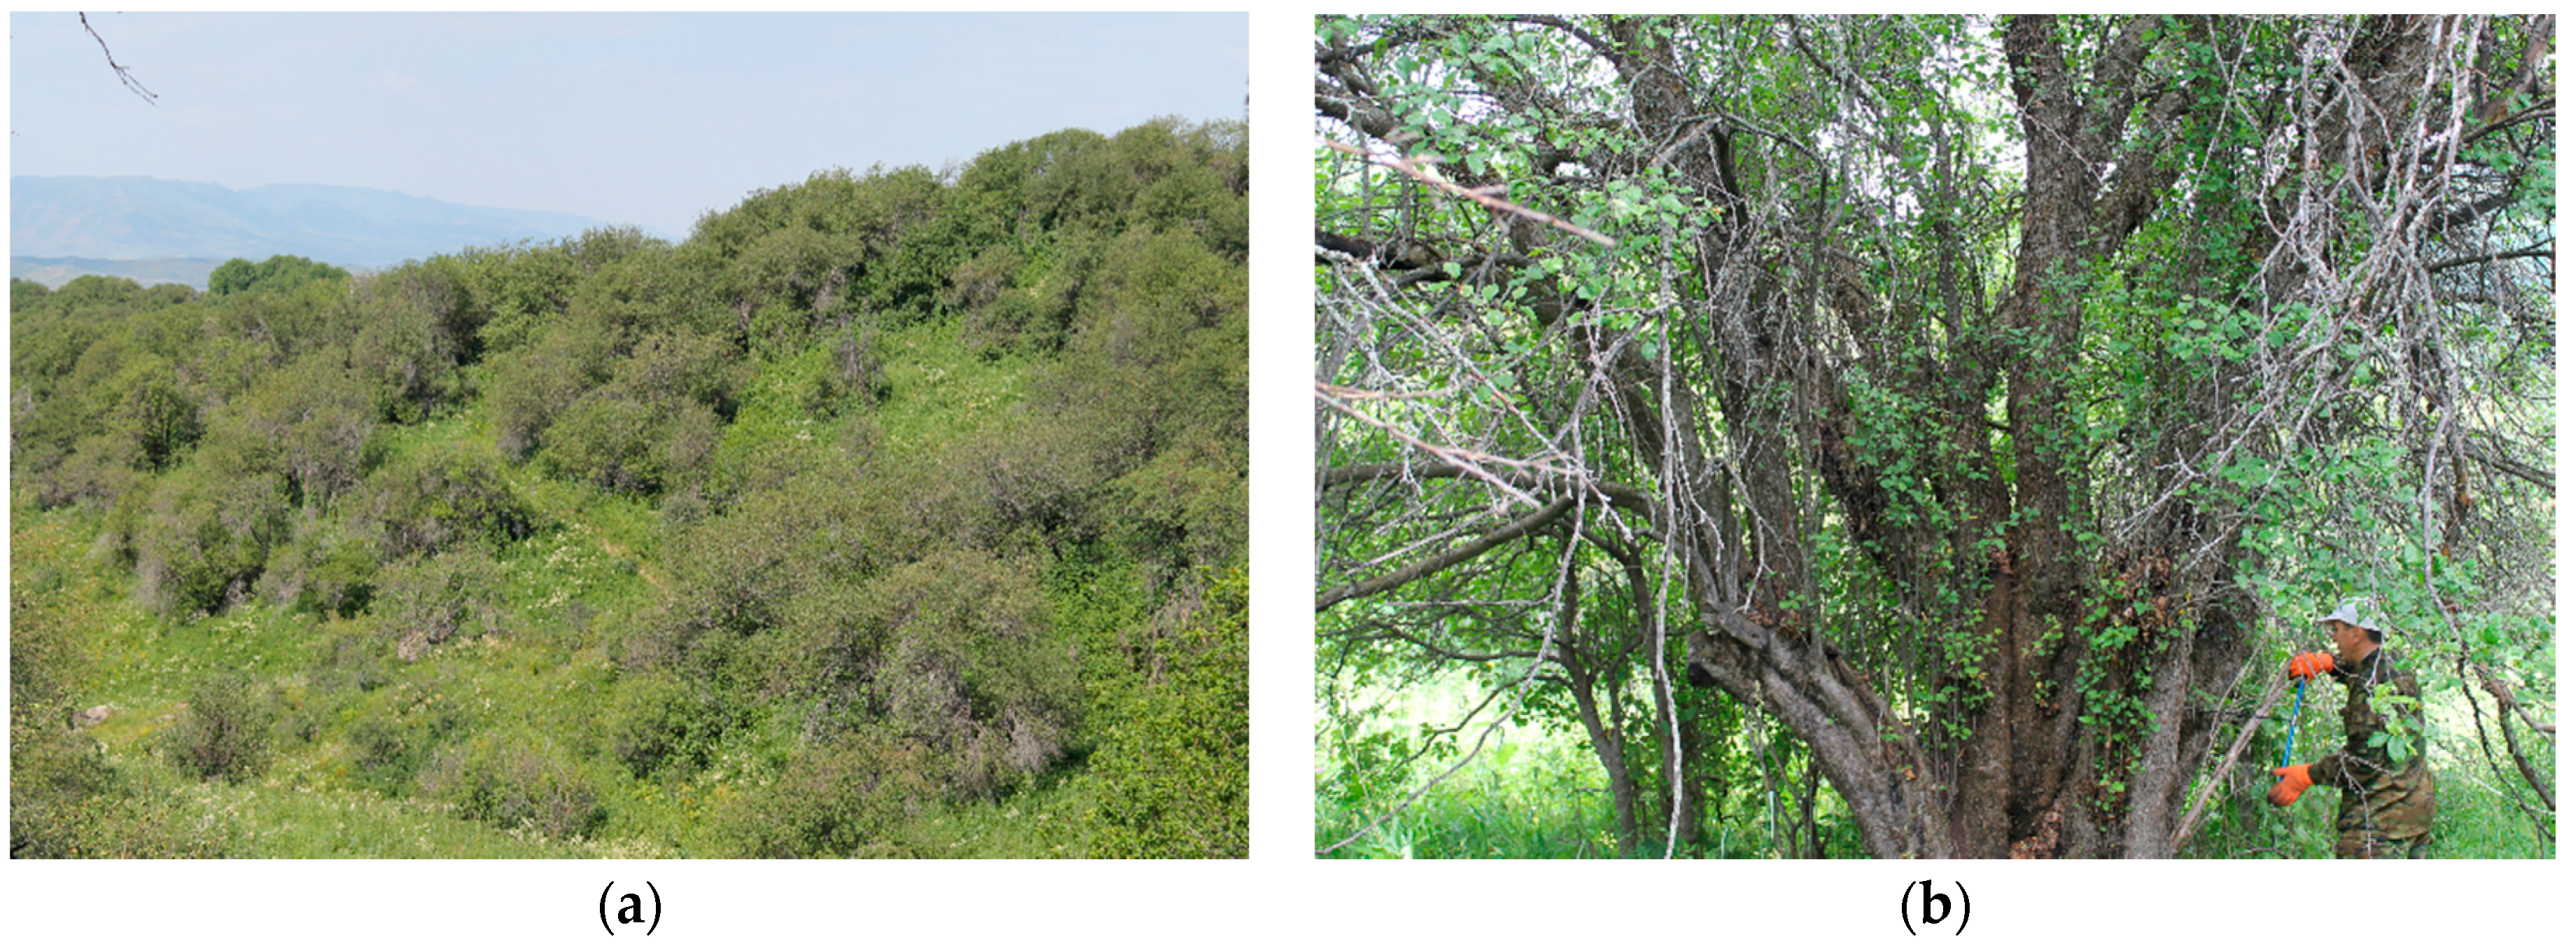
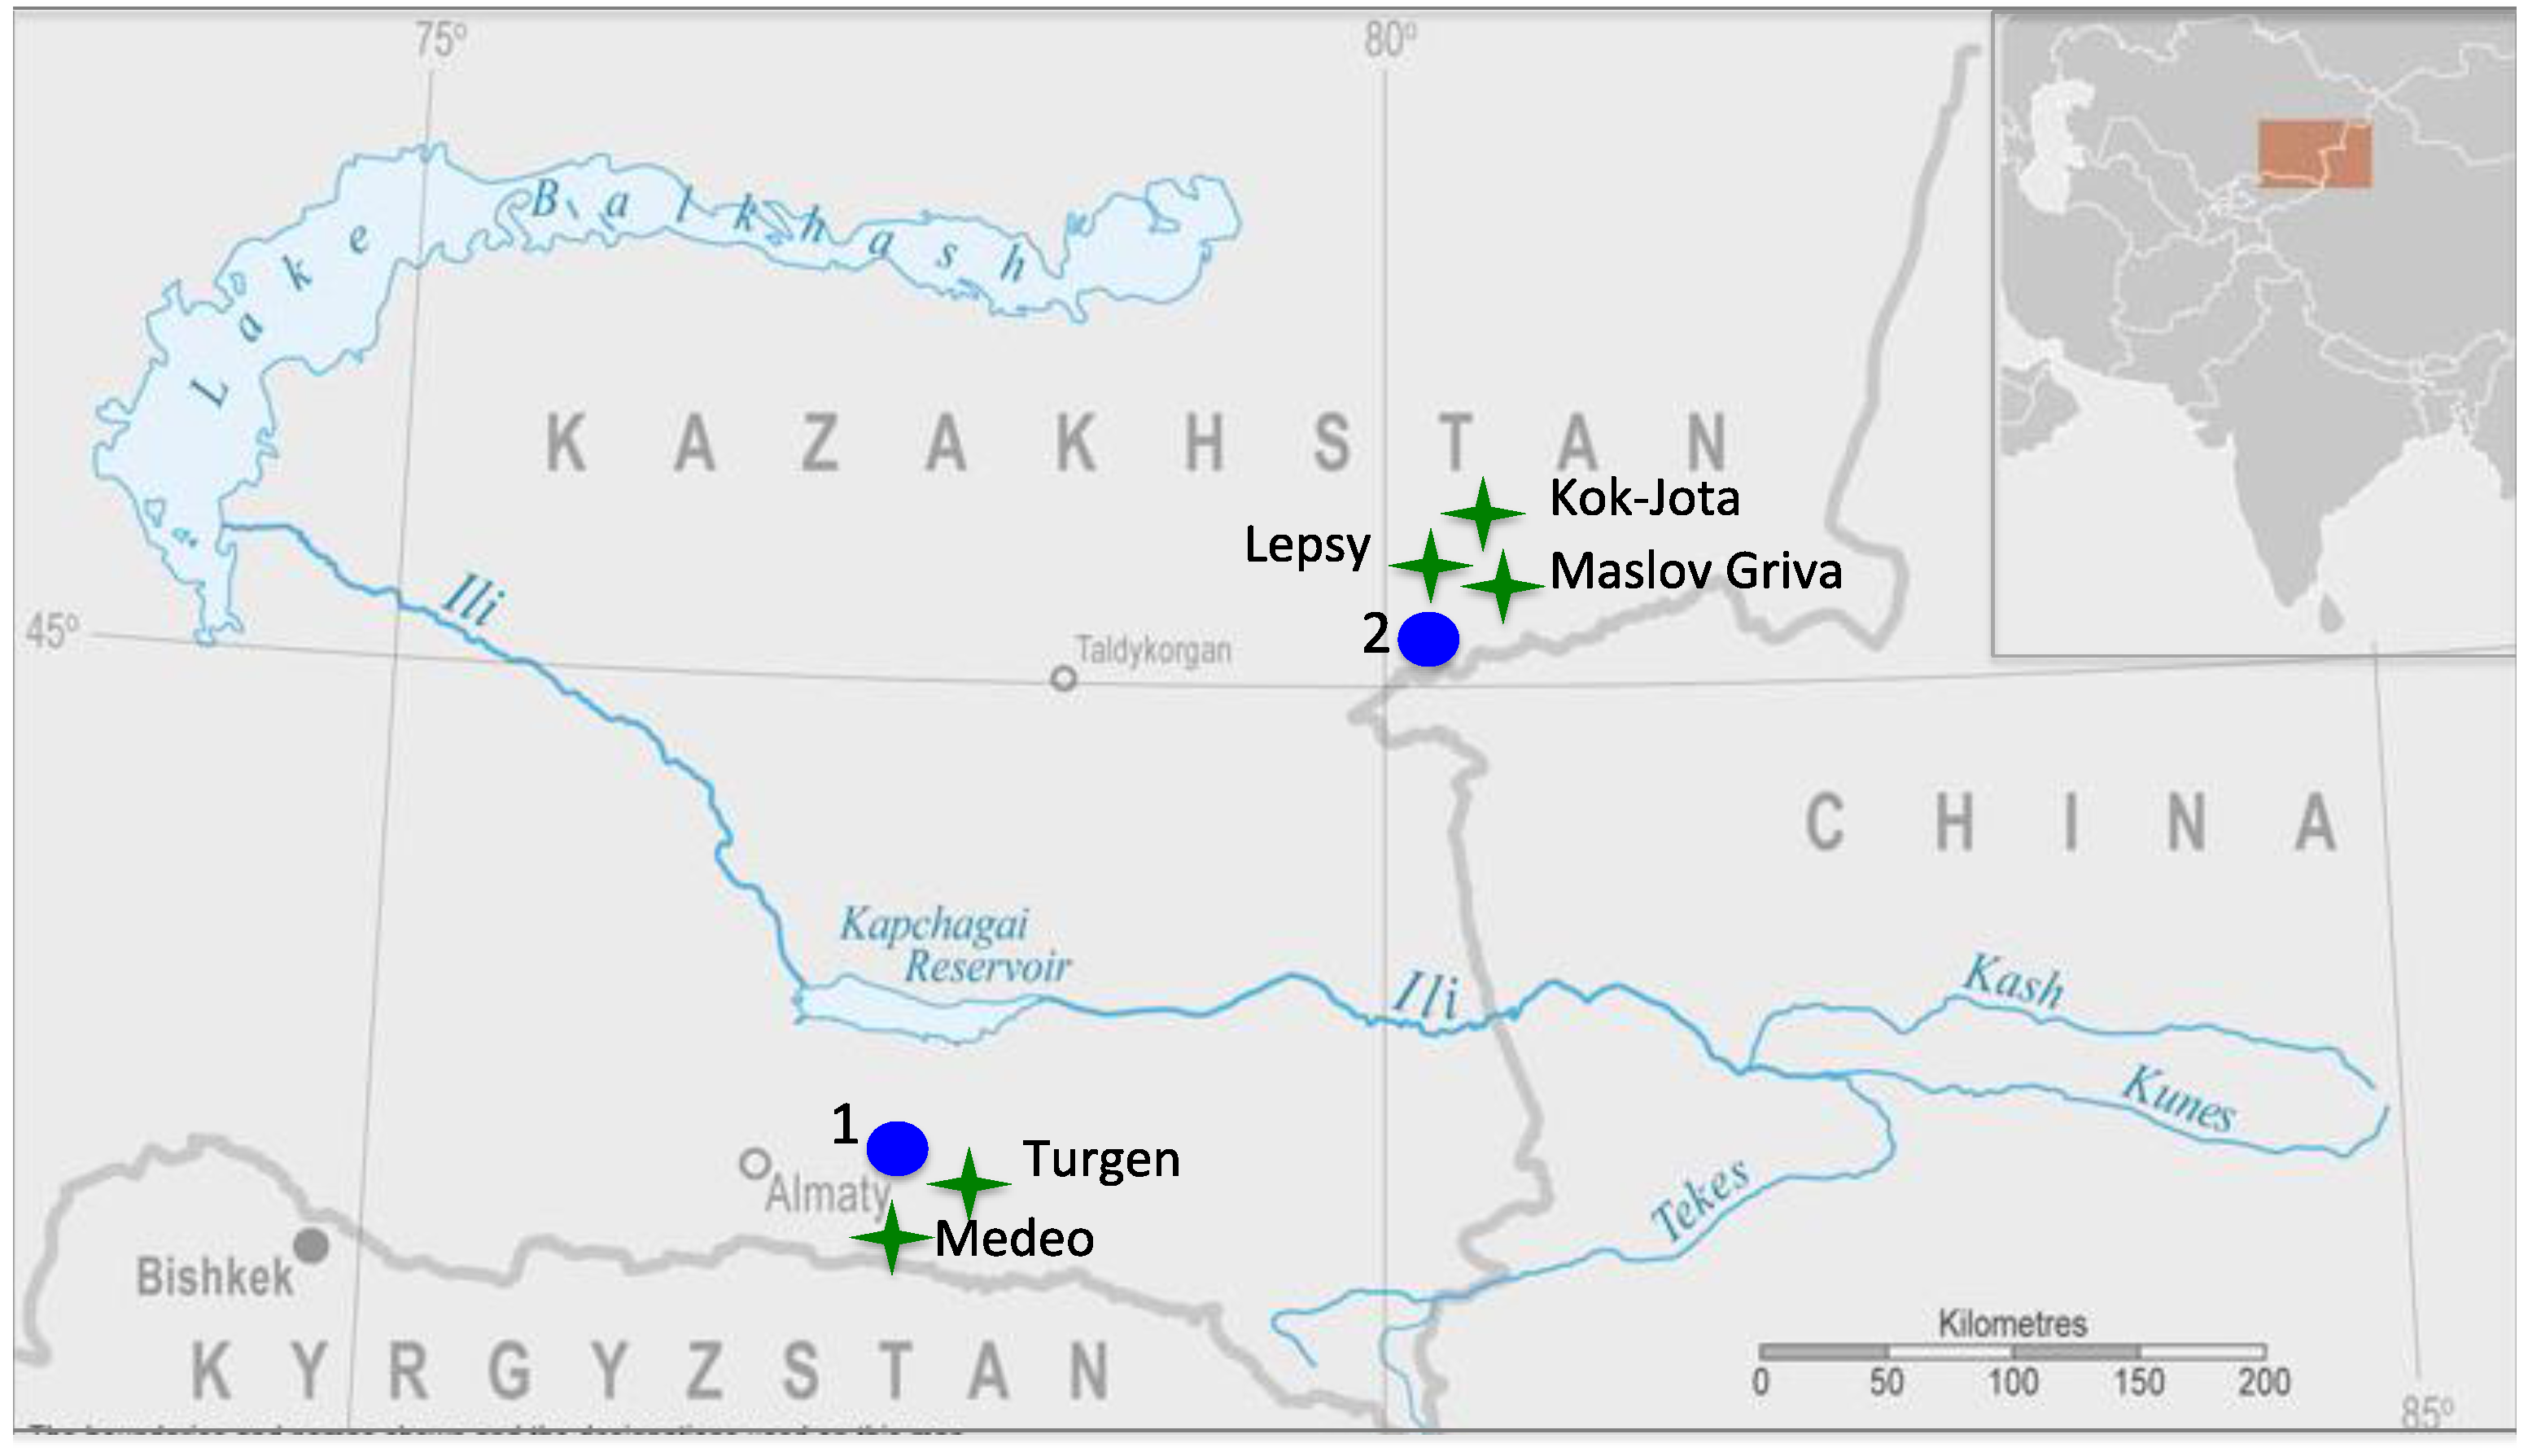
2.1. Study Areas
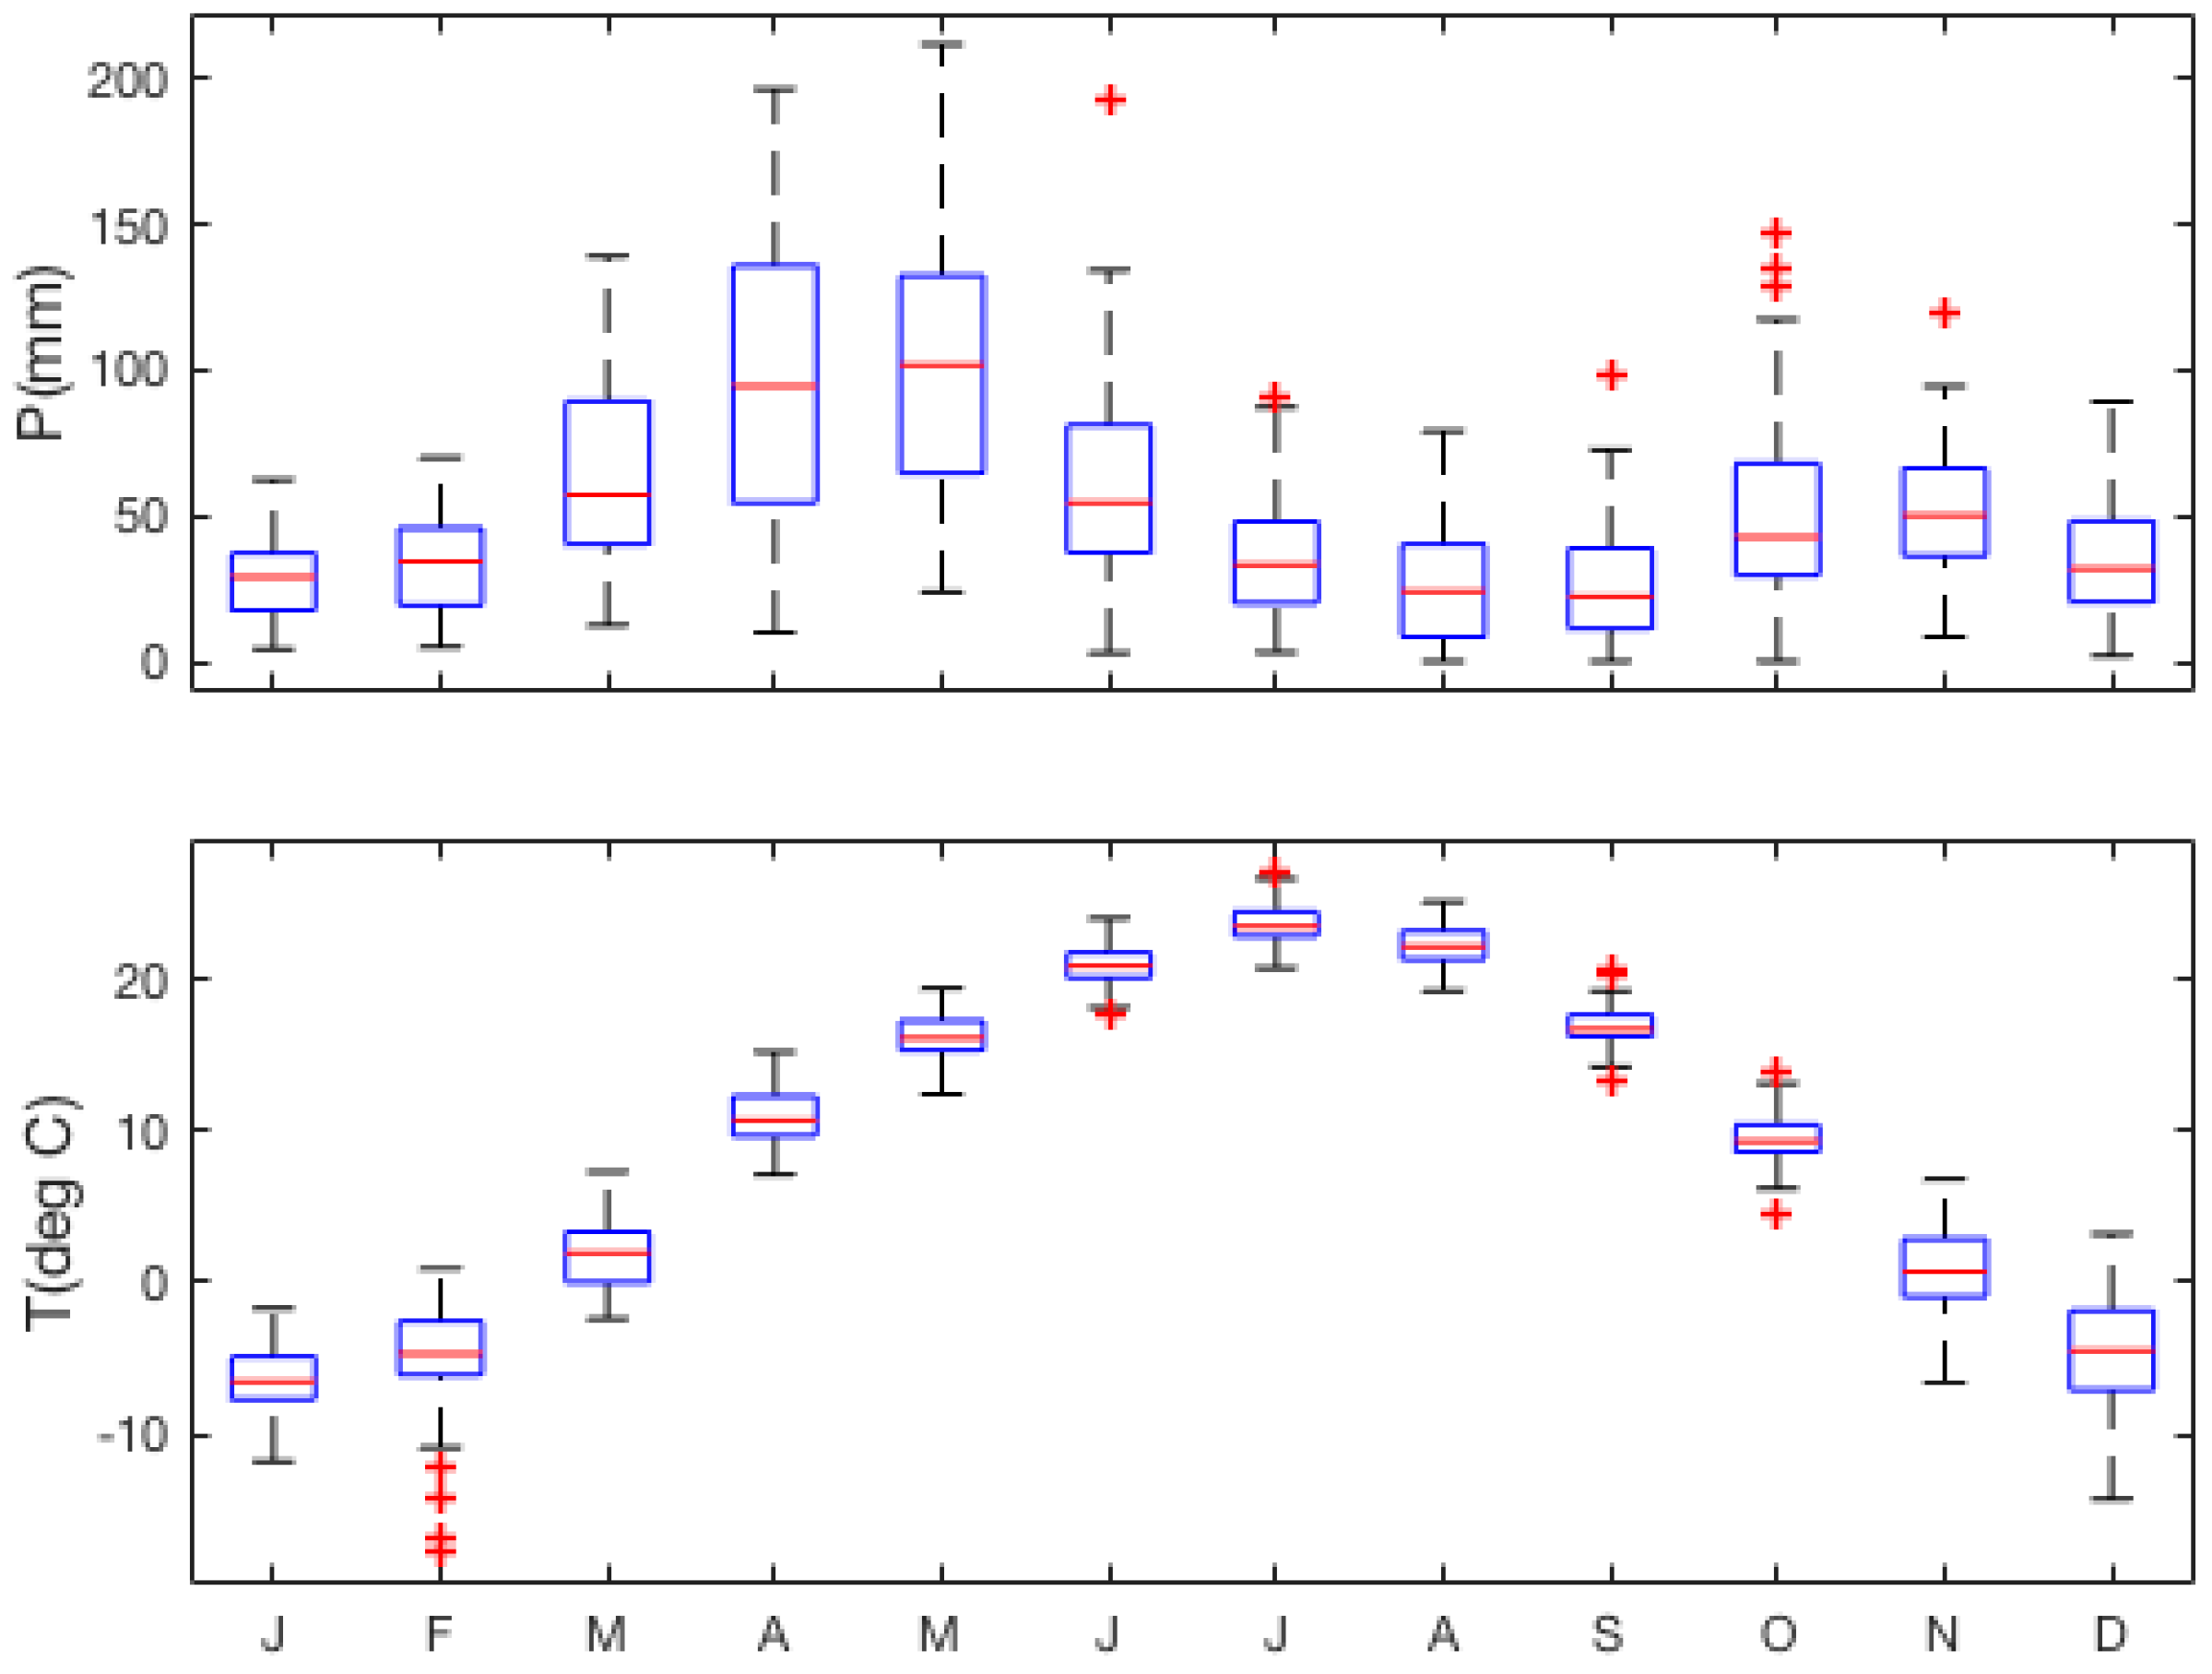
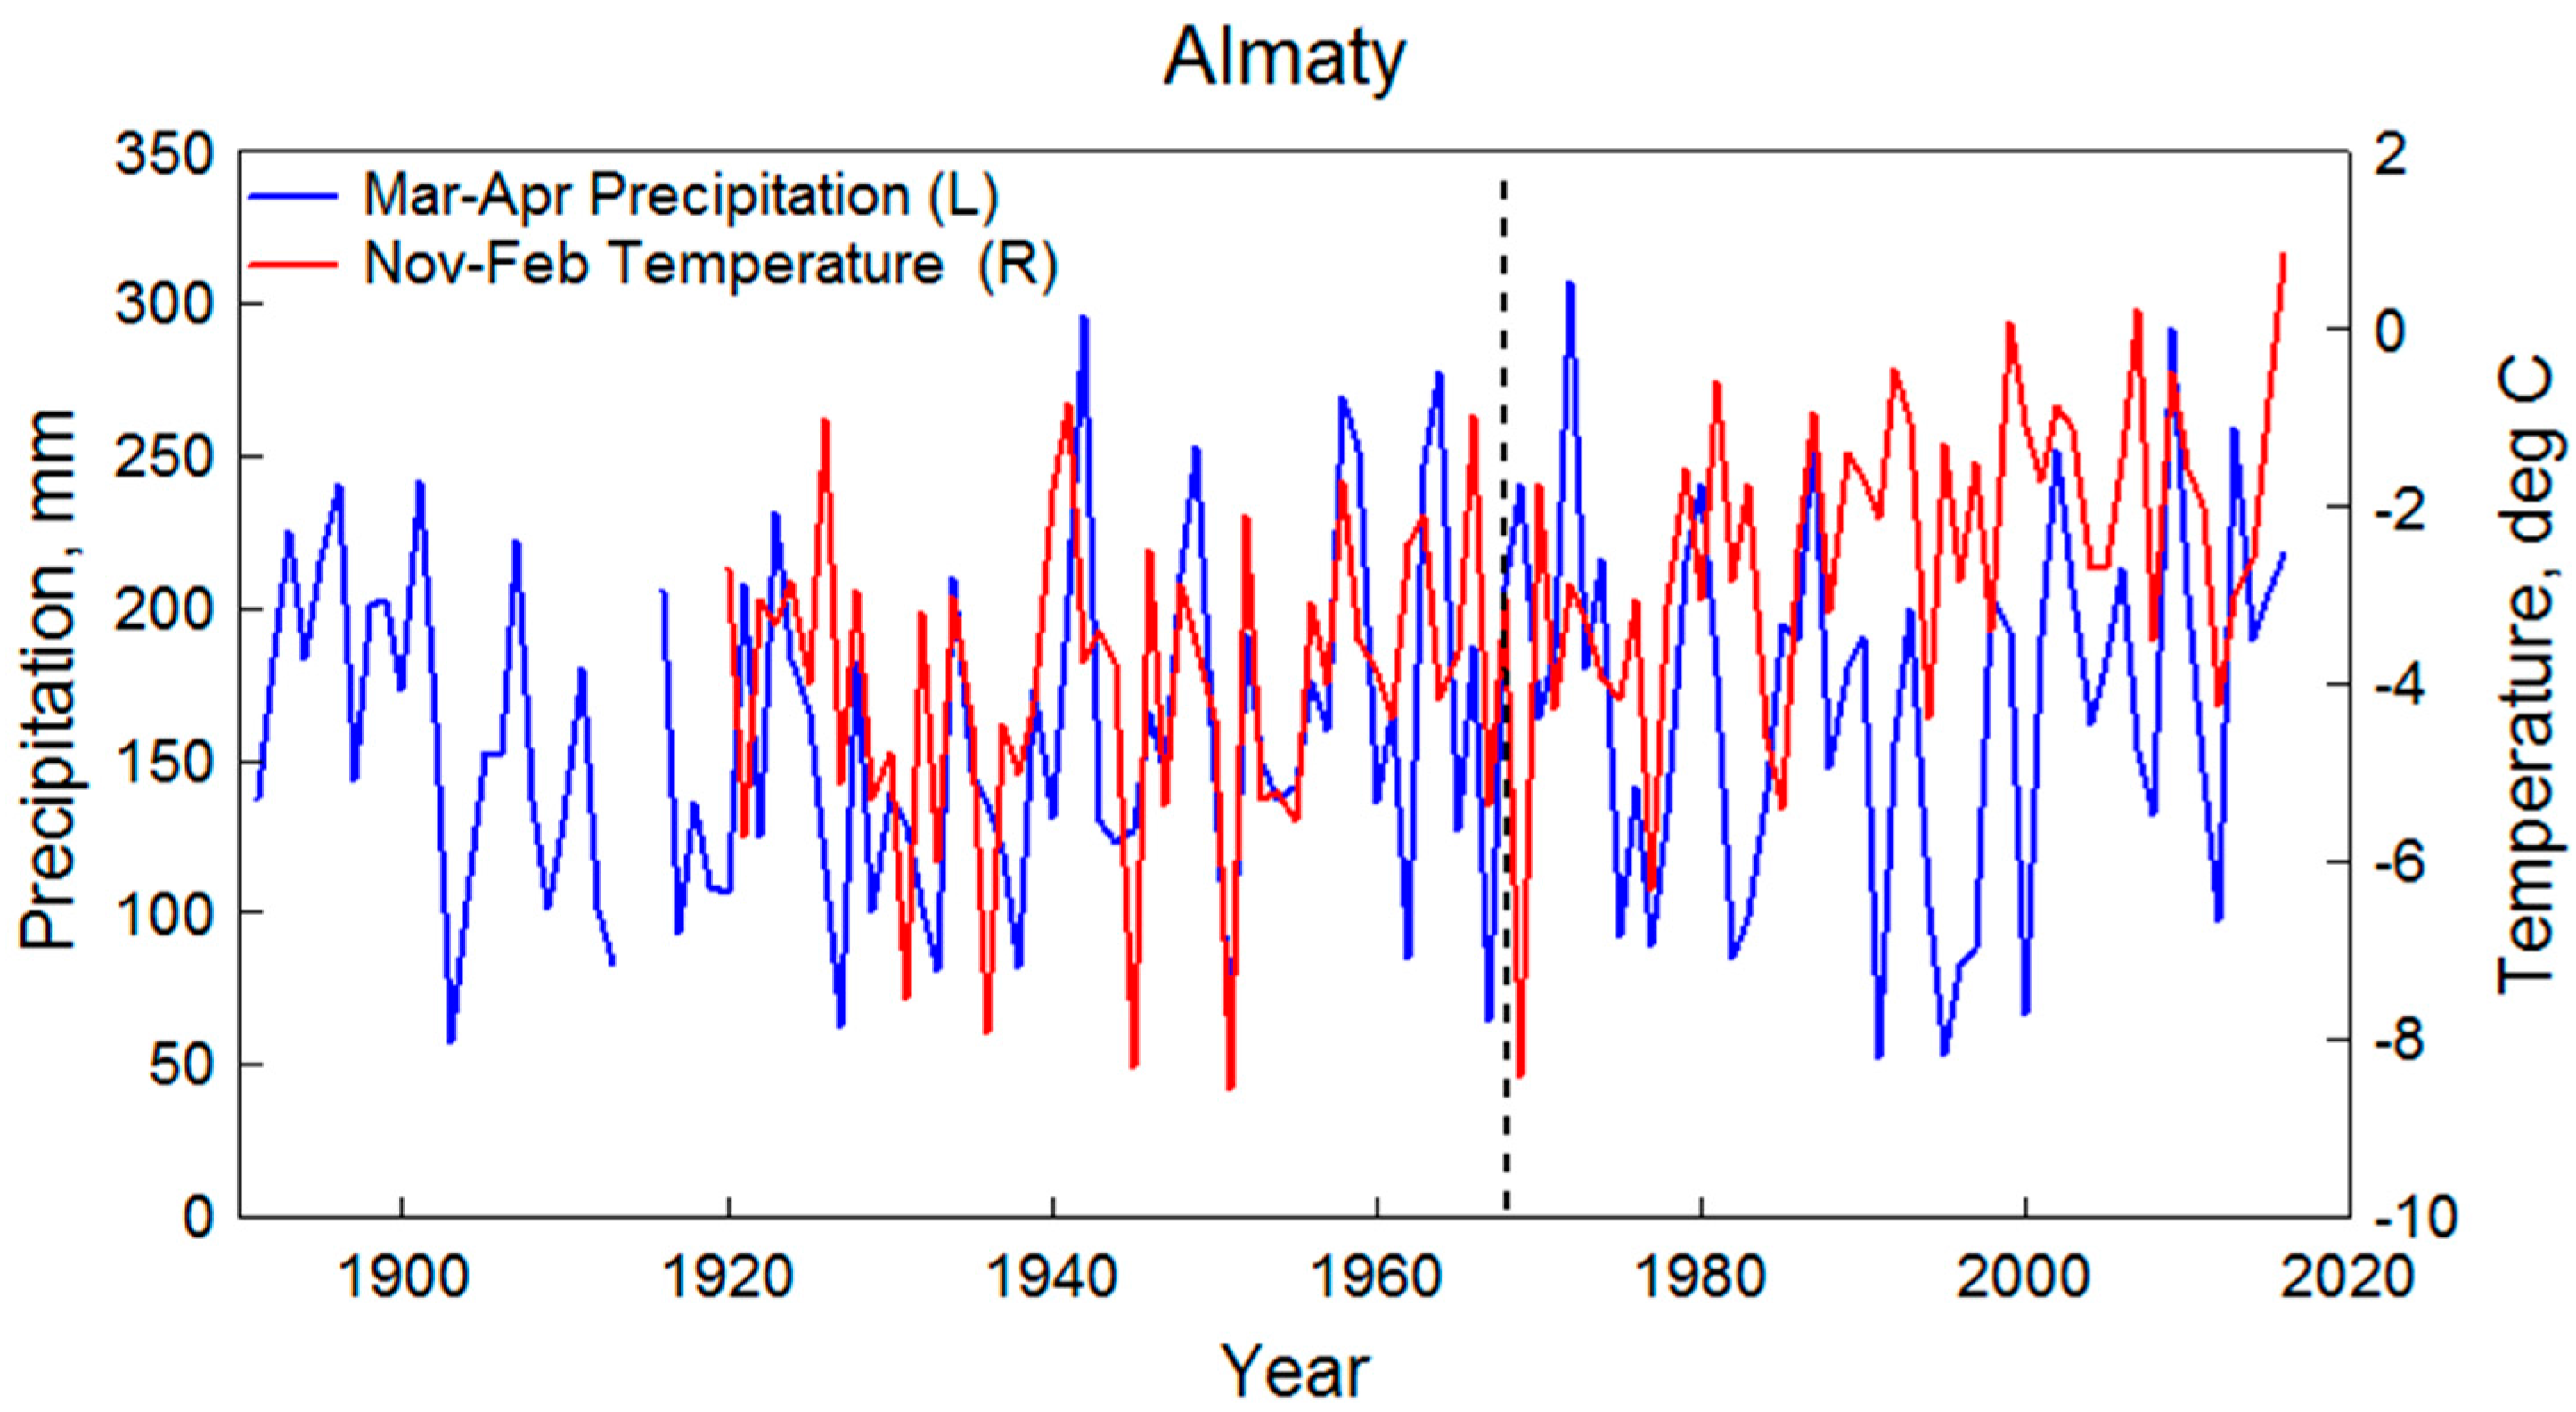
2.2. Weather Data
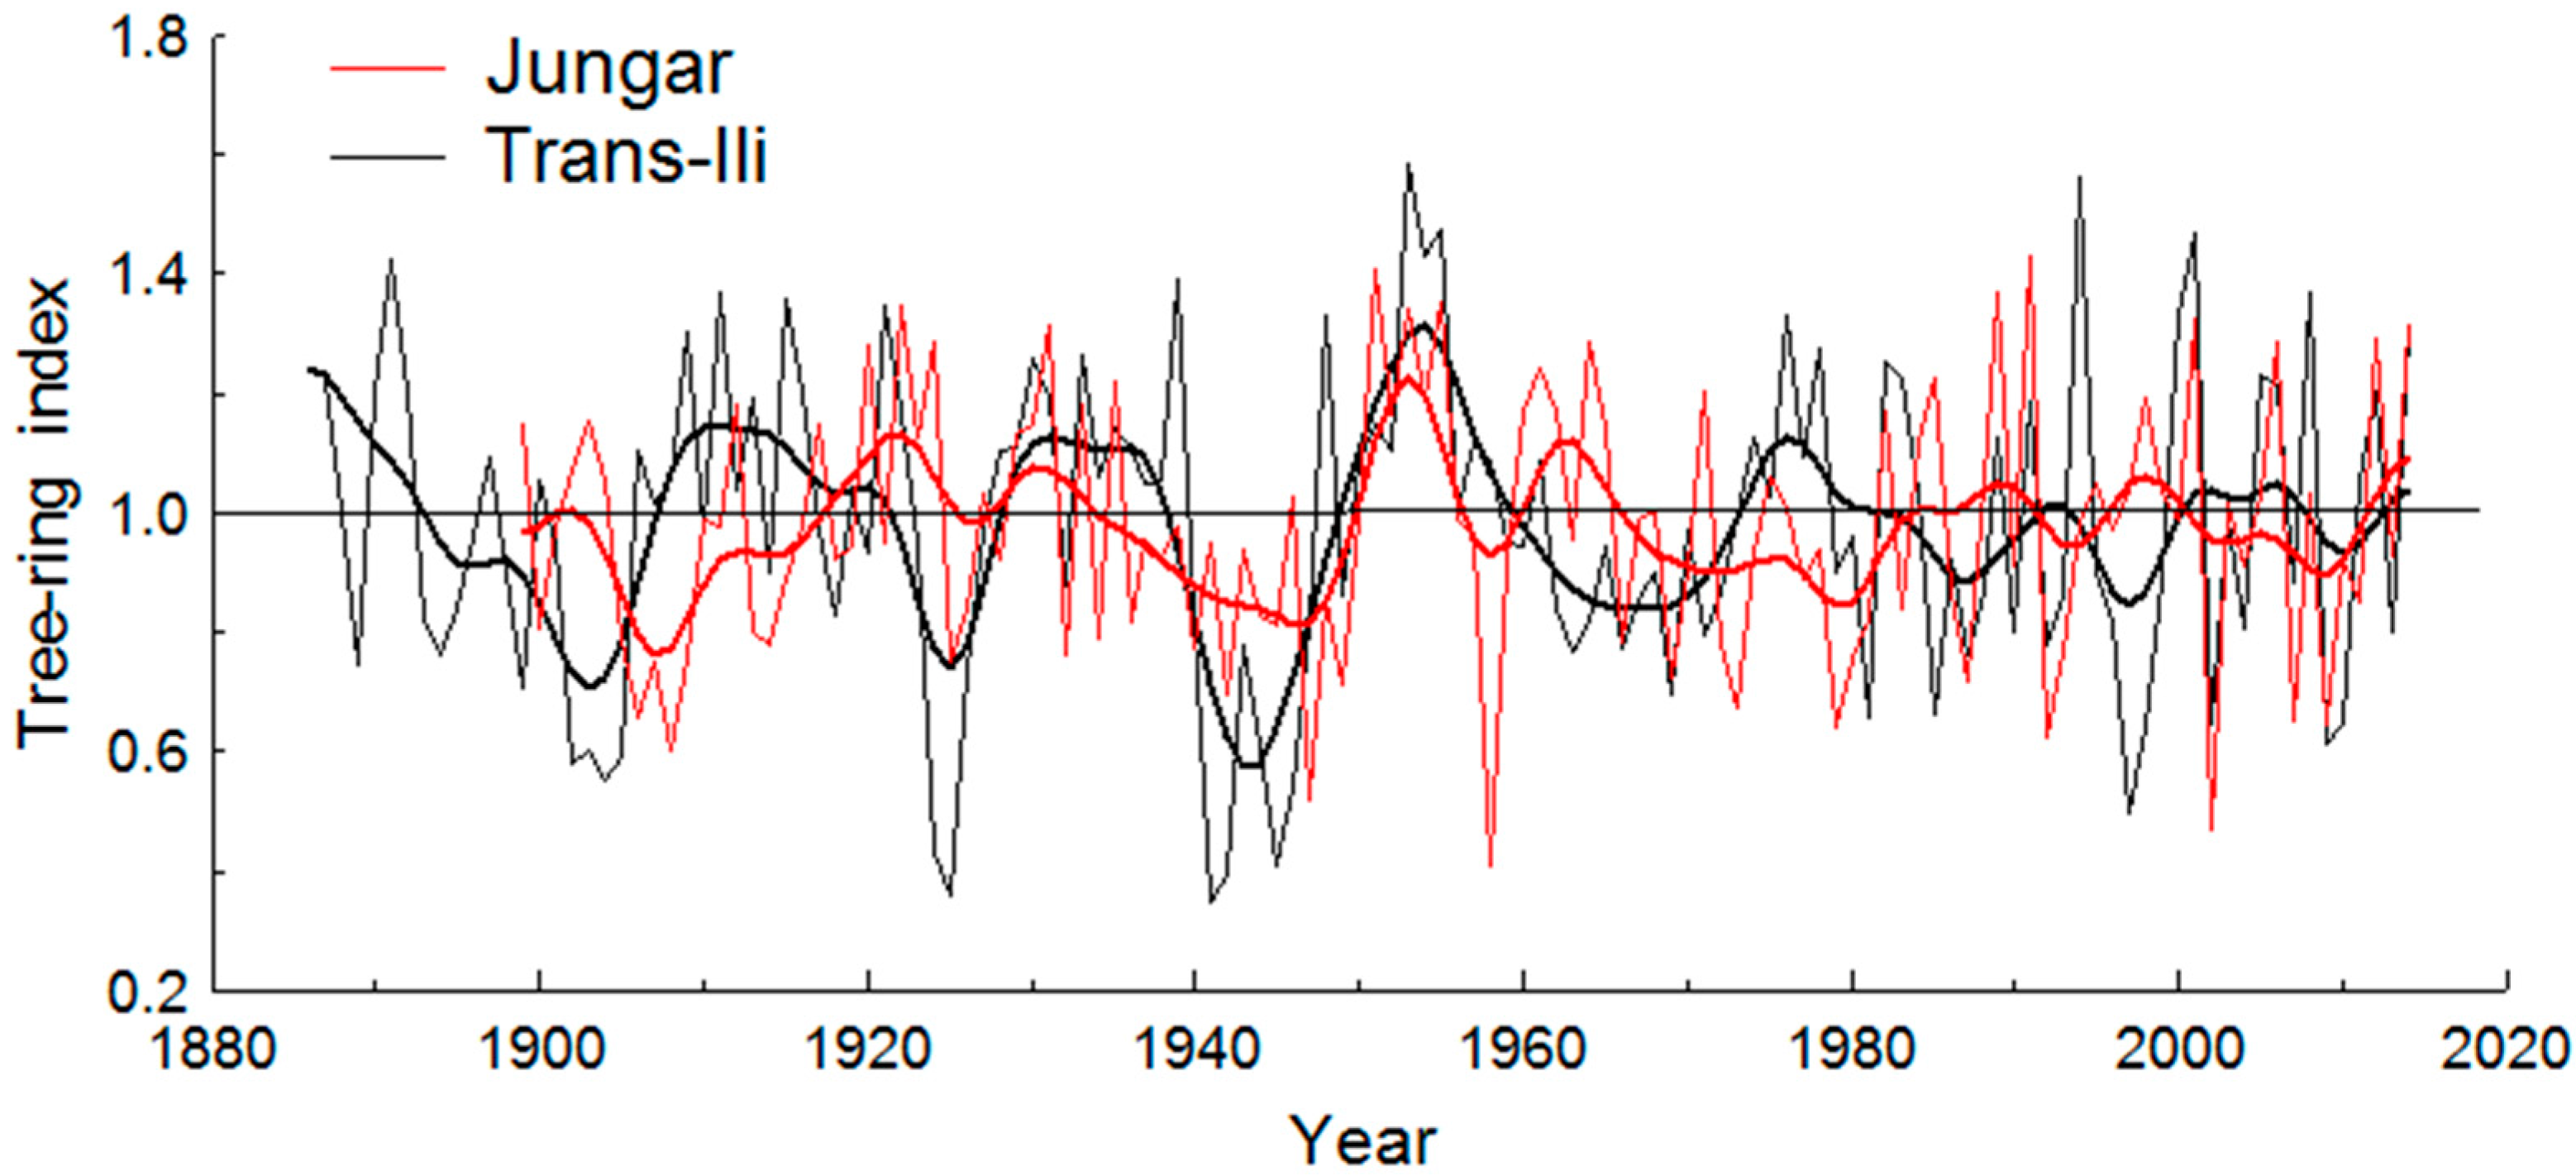
2.3. Tree-Ring Data
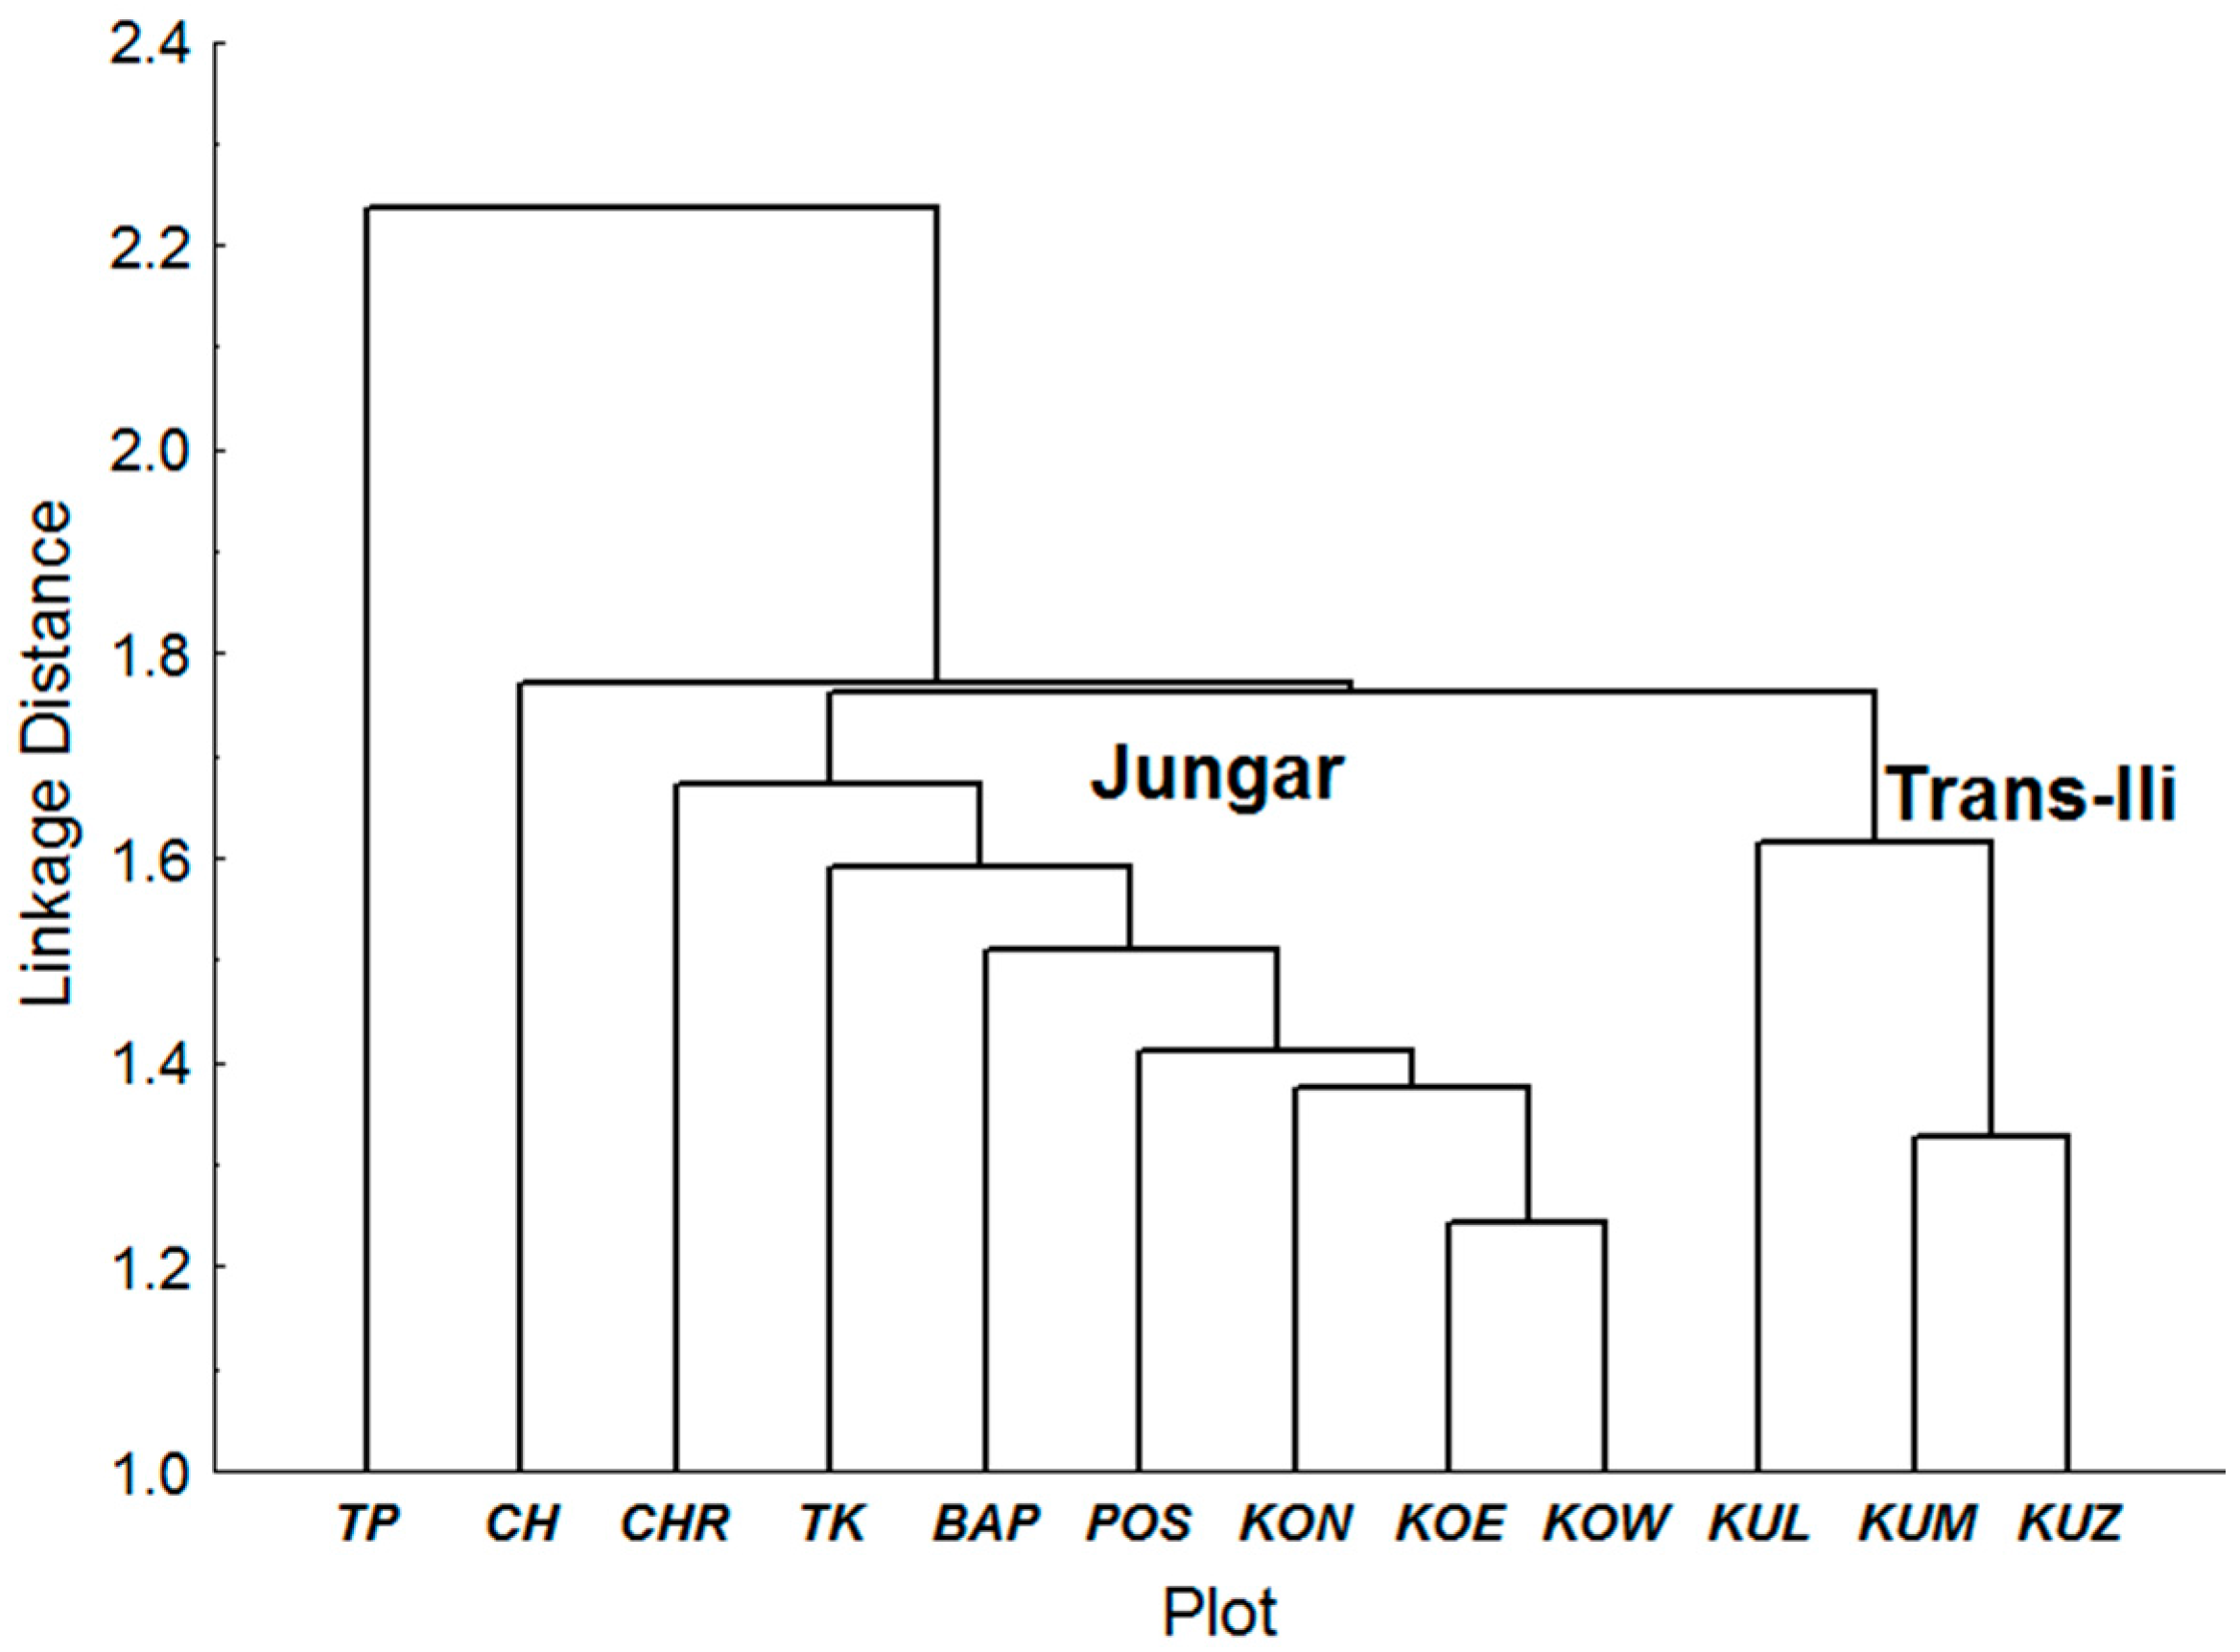
2.4. Statistical Analysis
3. Results
3.1. Apple Growth Variations
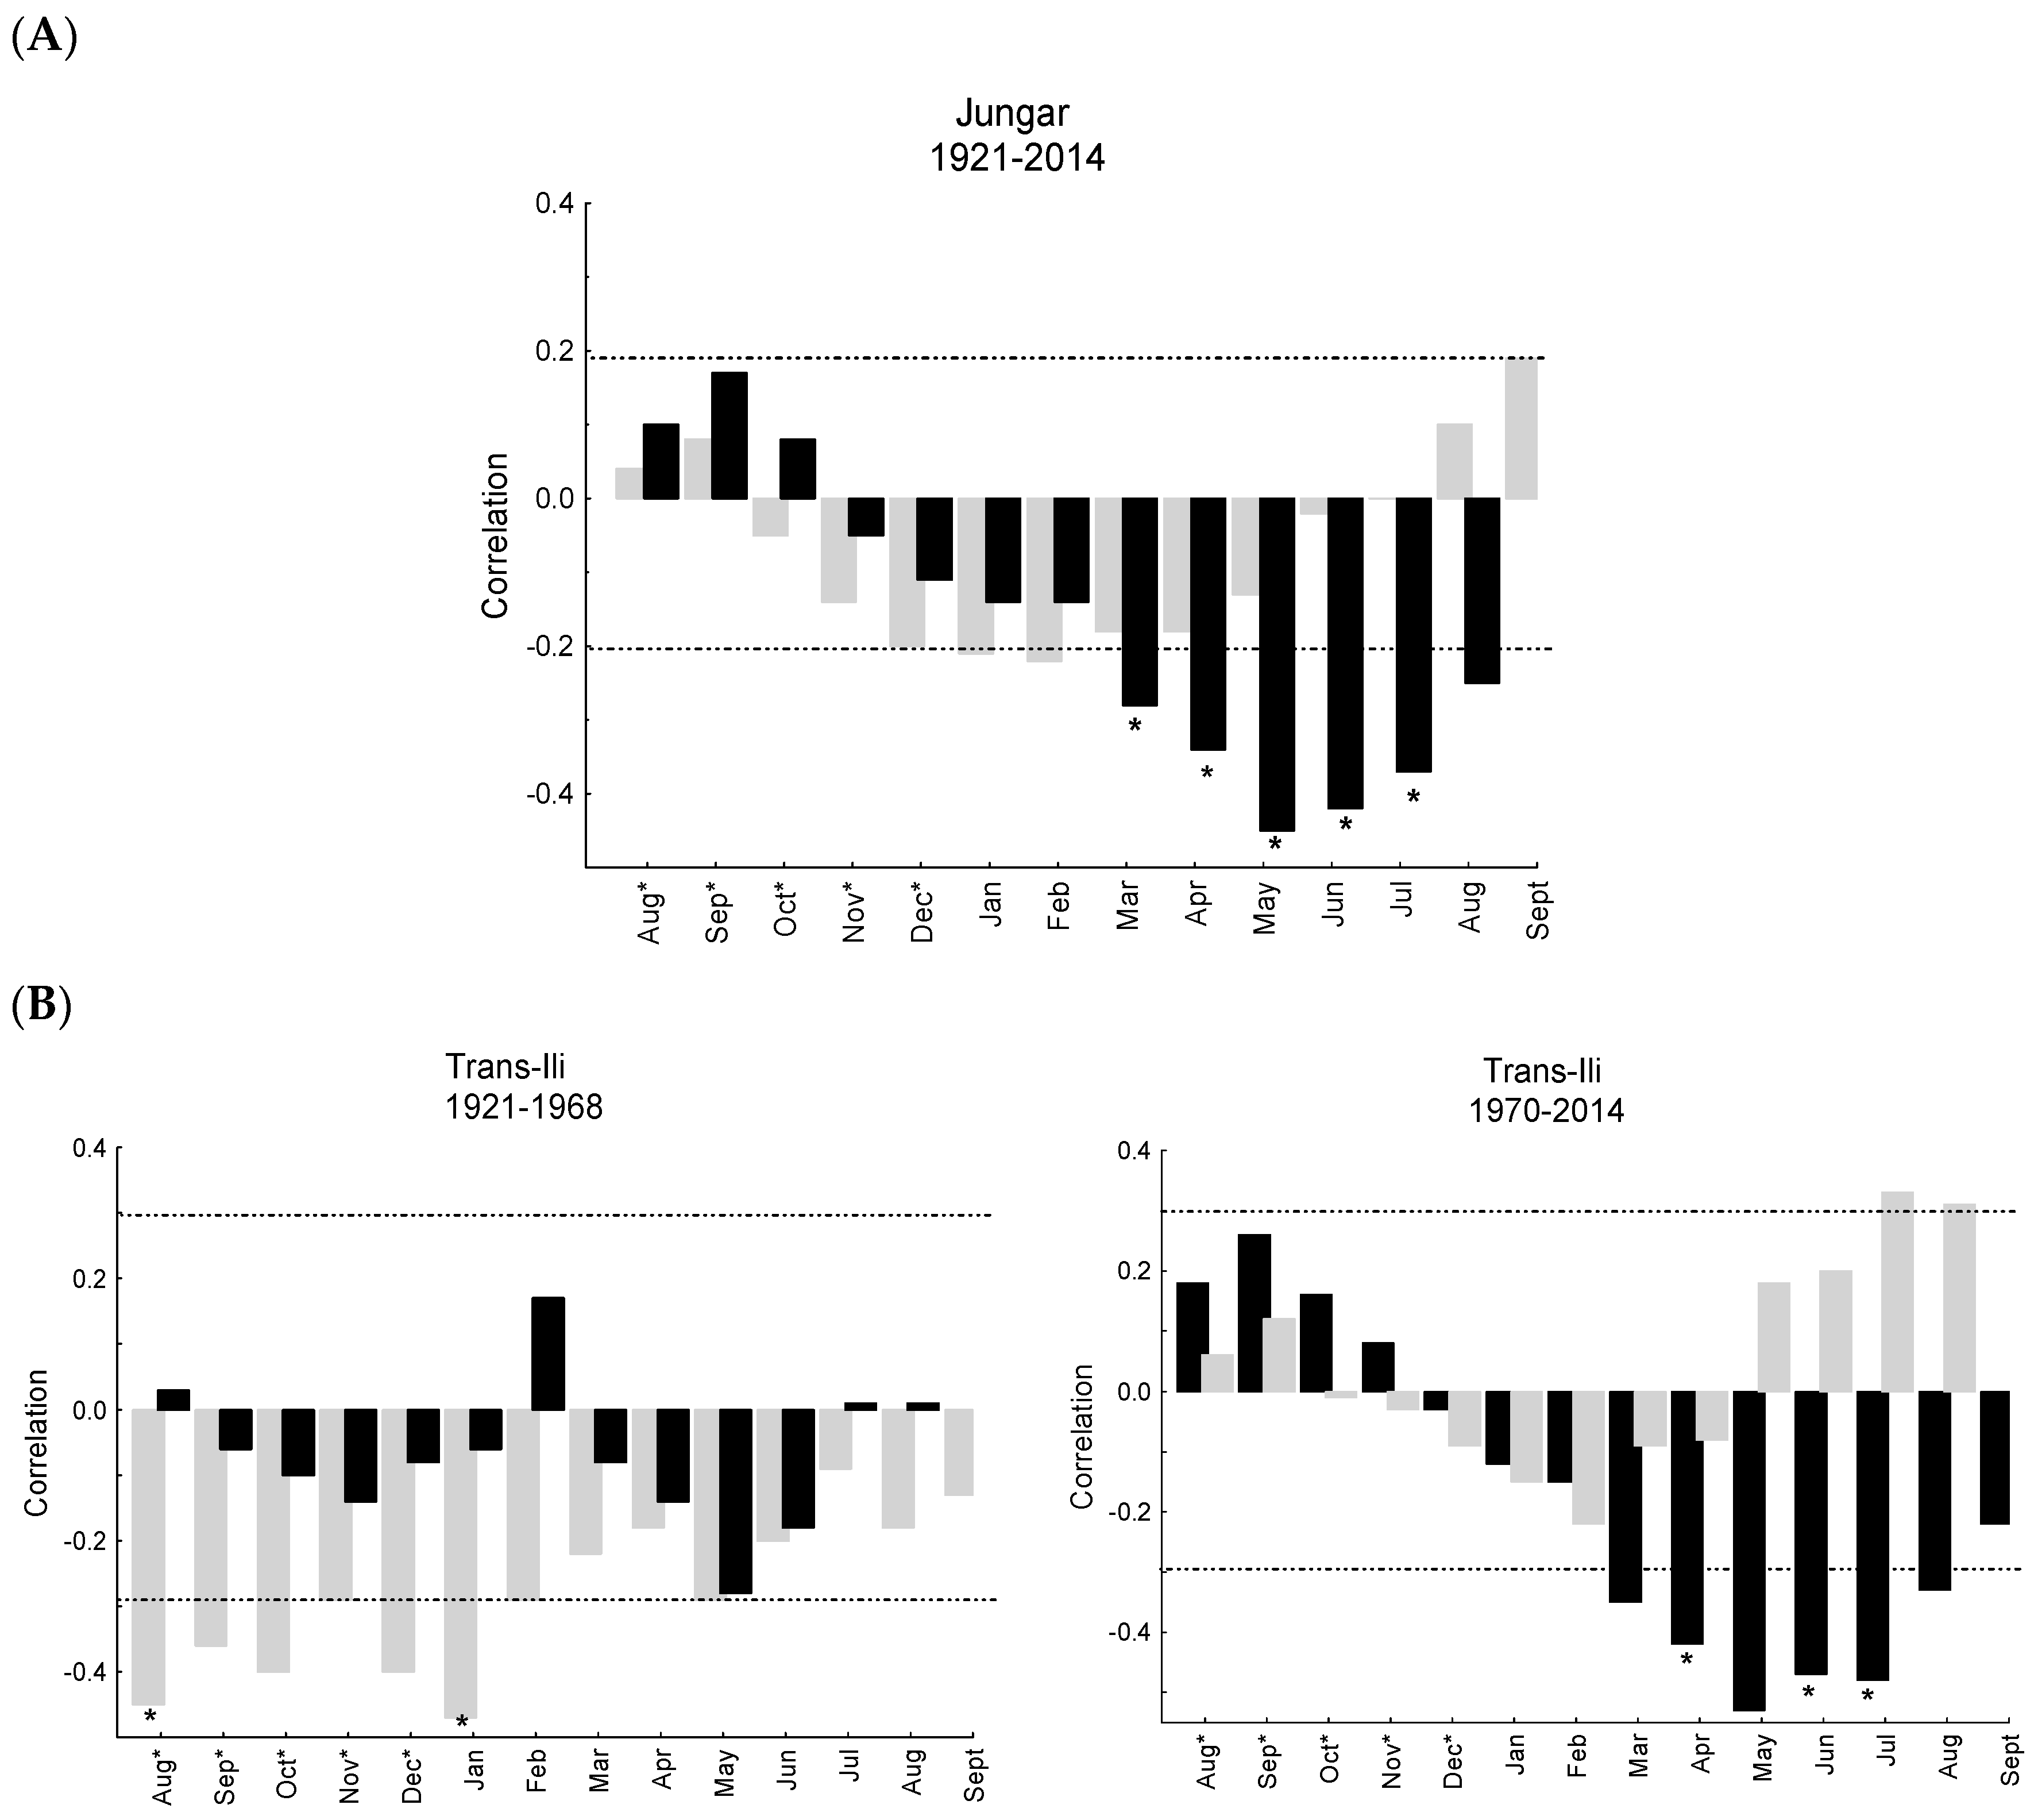
3.2. Apple Growth Response to Climate
4. Discussion
5. Conclusions
Supplementary Materials
Acknowledgments
Author Contributions
Conflicts of Interest
References
- Cornille, A.; Giraud, T.; Smulders, M.J.M.; Roldán-Ruiz, I.; Gladieux, P. The domestication and evolutionary ecology of apples. Trends Genet. 2014, 30, 57–65. [Google Scholar] [CrossRef] [PubMed]
- Forte, A.V.; Ignatov, A.N.; Ponomarenko, V.V.; Dorokhov, D.B.; Saveleyev, N.I. Phylogeny of the Malus (apple tree) species, inferred from the morphological traits and molecular DNA analysis. J. Genet. 2002, 38, 1150–1160. [Google Scholar]
- Maxted, N.; Kell, S. Establishment of a Global Network for the. In Situ Conservation of Crop Wild Relatives: Status and Needs; FAO Commission on Genetic Resources for Food and Agriculture: Rome, Italy, 2009. [Google Scholar]
- Duan, N.; Bai, Y.; Sun, H.; Wang, N.; Ma, Y.; Li, M.; Wang, X.; Jiao, C.; Legall, N.; Mao, L.; et al. Genome re-sequencing reveals the history of apple and supports a two-stage model for fruit enlargement. Nat. Commun. 2017, 8, 249. [Google Scholar] [CrossRef] [PubMed]
- Velasco, R.; Zharkikh, A.; Affourtit, J.; Dhingra, A.; Cestaro, A.; Kalyanaraman, A.; Fontana, P.; Bhatnagar, S.K.; Troggio, M.; Pruss, D.; et al. The genome of the domesticated apple (Malus × domestica Borkh.). Nat. Genet. 2010, 42, 833–839. [Google Scholar] [CrossRef] [PubMed] [Green Version]
- Zhukovsky, P.A. Cultivated Plants and Their Ancestors; Nauka: Leningrad, USSR, Russia, 1971; p. 79. [Google Scholar]
- Dzhangaliev, A. The wild apple tree of Kazakhstan. Hortic. Rev. 2003, 29, 63–304. [Google Scholar]
- Luby, J.; Forsline, P.; Aldwinckle, H.; Bus, V.; Geibel, M. Silk road apples—Collection, evaluation, and utilization of Malus sieversii from Central Asia. HortScience 2001, 36, 225–231. [Google Scholar]
- Baranov, V.I. Development of Tertiary Flora on the Territory of USSR; Scientific Bulletin of Kazan University: Botany, Kazan, Russia, 1954; Volumes 3, p. 362. [Google Scholar]
- Beer, R.; Kaiser, F.; Schmidt, K.; Ammann, B.; Carraro, G.; Grisa, E.; Tinner, W. Vegetation history of the walnut forests in Kyrgyzstan (Central Asia): Natural or anthropogenic origin? Quat. Sci. Rev. 2008, 27, 621–632. [Google Scholar] [CrossRef]
- Aizen, V.B.; Aizen, E.M.; Melack, J.M. Precipitation, melt and runoff in the northern Tien Shan. J. Hydrol. 1996, 186, 229–251. [Google Scholar] [CrossRef]
- World Conservation Monitoring Centre. IUCN Red List of Threatened Plants; Walter, K.S., Gillett, H.J., Eds.; World Conservation Union: Gland, Switzerland; Cambridge, UK, 1998; p. 862. [Google Scholar]
- Cornille, A.; Gladieux, P.; Smulders, M.J.M.; Roldan-Ruiz, I.; Laurens, F.; Le Cam, B.; Nersesyan, A.; Clavel, J.; Olonova, M.; Feugey, L.; et al. New insight into the history of domesticated apple: Secondary contribution of the European wild apple to the genome of cultivated varieties. PLoS Genet. 2012, 8, e1002703. [Google Scholar] [CrossRef] [PubMed] [Green Version]
- Esper, J.; Schweingruber, F.H.; Winiger, M. 1300 years of climatic history for Western Central Asia inferred from tree-rings. Holocene 2002, 12, 267–277. [Google Scholar] [CrossRef]
- Solomina, A.; Maximova, A.; Cook, A. Picea Schrenkian ring width and density at the upper and lower tree limits in the Tien Shan Mountains (Kirgizstan Republic) as a source of paleoclimatic information. Geogr. Environ. Sustain. 2014, 7, 66–79. [Google Scholar] [CrossRef]
- Zhang, T.; Yuan, Y.; He, Q.; Wei, W.; Diushen, M.; Shang, H.; Zhang, R. Development of tree-ring width chronologies and tree-growth response to climate in the mountains surrounding the Issyk-Kul Lake, Central Asia. Dendrochronologia 2014, 32, 230–236. [Google Scholar] [CrossRef]
- Seim, A.; Omurova, G.; Azisov, E.; Musuraliev, K.; Aliev, K.; Tulyaganov, T.; Nikolyai, L.; Botman, E.; Helle, G.; Dorado Liñan, I.; et al. Climate Change Increases Drought Stress of Juniper Trees in the Mountains of Central Asia. PLoS ONE 2016, 11, e0153888. [Google Scholar] [CrossRef] [PubMed]
- Feng, T.; Zhang, Y.; Chen, X. Study on the age structure and density of the wild apple forest of Malus sieversii. J. Fruit Sci. 2007, 24, 571–573. [Google Scholar]
- Routson, K.J.; Routson, C.C.; Sheppard, P.R. Dendrochronology reveals planting dates of historic apple trees in the southwestern United States. J. Am. Pomol. Soc. 2012, 66, 9–15. [Google Scholar]
- Sagitov, A.O.; Mukhamadiev, N.S.; Ashikbaev, N.J.; Mendibaeva, G.J.; Panyushkina, I.P.; Lynch, A.M.; O’Connor, C.D. Toward dendrochronological research of wild apple forests in the southeastern Kazakhstan. In Proceedings of the Innovative and Environmentally Friendly Technologies for Plant Protection, Almaty, Kazakhstan, 24–25 September 2015; pp. 171–175. [Google Scholar]
- Vavilov, N. Wild relatives of fruit trees in the Asian part of USSR and the origin of fruit trees. In Works on the Applied Botany, Genetics, Artificial Selection; USSR: Frunze, The Republic of Kyrgyzstan, 1931; pp. 3–44. [Google Scholar]
- Stokes, M.A.; Smiley, T.L. An Introduction to Tree-Ring Dating; University of Chicago Press: Chicago, IL, USA, 1968; p. 73. [Google Scholar]
- Holmes, R.L. Computer-Assisted Quality Control in Tree-Ring Dating and Measurement. Tree-Ring Bull. 1983, 43, 69–78. [Google Scholar]
- Cook, E.R.; Kairiūkštis, L. Methods of Dendrochronology: Applications in the Environmental Sciences; Kluwer Academic Publishers: Dordrecht, The Netherlands, 1992; p. 394. [Google Scholar]
- Cook, E.R.; Holmes, R.L. User’s manual for Program ARSTAN. In Tree-Ring Chronologies of Western North America: California, Eastern Oregon and Northern Great Basin with Procedures Used in the Chronology Development Work Including Users Manuals for Computer Programs COFECHA and ARSTAN; Holmes, R.L., Adams, R.K., Fritts, H.C., Eds.; University of Arizona: Tucson, AZ, USA, 1986; pp. 50–65. [Google Scholar]
- Ward, J.H. Hierarchical Grouping to Optimize an Objective Function. J. Am. Stat. Assoc. 1963, 58, 236–244. [Google Scholar] [CrossRef]
- StatSoft, Inc. STATISTICA (Data Analysis Software System), Version 8.0. 2007. Available online: www.statsoft.com (accessed on 24 October 2017).
- Haan, C.T. Statistical Methods in Hydrology, 2nd ed.; Iowa State Press: Ames, IA, USA, 2002; p. 496. [Google Scholar]
- Meko, D.M.; Touchan, R.; Anchukaitis, K.J. Seascorr: A MATLAB program for identifying the seasonal climate signal in an annual tree-ring time series. Comput. Geosci. 2011, 37, 1234–1241. [Google Scholar] [CrossRef]
- Snedecor, G.W.; Cochran, W.G. Statistical Methods, 8th ed.; Iowa State University Press: Ames, IA, USA, 1989; p. 503. [Google Scholar]
- Bloomfield, P. Fourier Analysis of Time Series: An Introduction, 2nd ed.; Wiley: New York, NY, USA, 2000; p. 261. [Google Scholar]
- Torrence, C.; Compo, G.P. A Practical Guide to Wavelet Analysis. Bull. Am. Meteorol. Soc. 1998, 79, 61–78. [Google Scholar] [CrossRef]
- Harris, I.; Jones, P.D.; Osborn, T.J.; Lister, D.H. Updated high-resolution grids of monthly climatic observations—The CRU TS3.10 Dataset. Int. J. Climatol. 2014, 34, 623–642. [Google Scholar] [CrossRef] [Green Version]
- Wu, B.; Wang, J. Winter Arctic Oscillation, Siberian High and East Asian Winter Monsoon. Geophys. Res. Lett. 2002, 29, 3-1–3-4. [Google Scholar] [CrossRef]
- Jhun, J.; Lee, E. A New East Asian Winter Monsoon Index and Associated Characteristics of the Winter Monsoon. J. Clim. 2004, 17, 711–726. [Google Scholar] [CrossRef]
- D’Arrigo, R.; Jacoby, G.; Wilson, R.; Panagiotopoulos, F. A reconstructed Siberian High index since A.D. 1599 from Eurasian and North American tree rings. Geophys. Res. Lett. 2005, 32. [Google Scholar] [CrossRef] [Green Version]
- Kalmykov, S.S. Wild Fruit Trees of Western Tien Shan; Alma-Ata: Almaty, Kazakhstan, 1956; p. 101. [Google Scholar]
- Linkosalo, T. Mutual regularity of spring phenology of some boreal tree species: Predicting with other species and phenological models. Can. J. For. Res. 2000, 30, 667–673. [Google Scholar] [CrossRef]
- Luedeling, E.; Zhang, M.; Girvetz, E.H. Climatic changes lead to declining winter chill for fruit and nut trees in California during 1950–2099. PLoS ONE 2009, 4, e6166. [Google Scholar] [CrossRef] [PubMed]
- Luedeling, E.; Brown, P.H. A global analysis of the comparability of winter chill models for fruit and nut trees. Int. J. Biometeorol. 2011, 55, 411–421. [Google Scholar] [CrossRef] [PubMed]
- Menzel, A.; Sparks, T. Temperature and plant development: Phenology and seasonality. In Plant Growth Climate Change; Blackwell Publ.: Oxford, UK, 2006; pp. 70–95. [Google Scholar]
- Aizen, V.B.; Aizen, E.M.; Melack, J.M.; Dozier, J. Climatic and Hydrologic Changes in the Tien Shan, Central Asia. J. Clim. 1997, 10, 1393–1404. [Google Scholar] [CrossRef]
- Shiklomanov, A.I.; Lammers, R.B.; Lettenmaier, D.P.; Polischuk, Y.M.; Savichev, O.G.; Smith, L.C.; Chernokulsky, A.V. Hydrological changes: Historical analysis, contemporary status, and future projections. In Regional Environmental Changes in Siberia and Their Global Consequences; Springer: New York, NY, USA, 2013; pp. 111–154. [Google Scholar]
- Zuo, Z.; Zhang, R.; Wu, B.; Rong, X. Decadal variability in springtime snow over Eurasia: Relation with circulation and possible influence on springtime rainfall over China. Int. J. Climatol. 2012, 32, 1336–1345. [Google Scholar] [CrossRef]
- Cohen, J.; Saito, K.; Entekhabi, D. The role of the Siberian high in northern hemisphere climate variability. Geophys. Res. Lett. 2001, 28, 299–302. [Google Scholar] [CrossRef]
- Panagiotopoulos, F.; Shahgedanova, M.; Hannachi, A.; Stephenson, D.B. Observed Trends and Teleconnections of the Siberian High: A Recently Declining Center of Action. J. Clim. 2005, 18, 1411–1422. [Google Scholar] [CrossRef]
- Zhou, S.; Miller, A.J.; Wang, J.; Angell, J.K. Trends of NAO and AO and their associations with stratospheric processes. Geophys. Res. Lett. 2001, 28, 4107–4110. [Google Scholar] [CrossRef]


| Mountain Range | Grid Coordinates | Elevation m a.s.l. | Number of Series | Period | Length | R | SD | AR Lag1 Lag2 |
|---|---|---|---|---|---|---|---|---|
| Jungar | 45° N, 80° E | 1254–1475 | 81 | 1899–2014 | 116 | 0.57 | 0.21 | 0.10 0.18 |
| Trans-Ili | 43° N, 77° E | 1540–1600 | 42 | 1886–2014 | 129 | 0.59 | 0.28 | 0.31 0.14 |
| Season | Correlation Intervals | Test Statistics | |||
|---|---|---|---|---|---|
| Full | Early | Late | ΔZ | p | |
| Jungar | |||||
| March–May P | 1921–2014 | 1921–1967 | 1968–2014 | ||
| −0.45 | −0.37 | −0.52 | 0.19 | 0.37 | |
| Trans-Ili | |||||
| March–May P | 1921–2014 | 1921–1967 | 1968–2014 | ||
| −0.33 | −0.16 | −0.55 | 0.46 | 0.03 | |
| Trans-Ili Subperiods | |||||
| * Novemberyear1–January T | 1921–1968 | 1921–1944 | 1945–1968 | ||
| −0.47 | −0.49 | −0.46 | −0.04 | 0.89 | |
| March–May P | 1970–2014 | 1970–1992 | 1993–2014 | ||
| −0.53 | −0.54 | −0.55 | 0.01 | 0.99 | |
© 2017 by the authors. Licensee MDPI, Basel, Switzerland. This article is an open access article distributed under the terms and conditions of the Creative Commons Attribution (CC BY) license (http://creativecommons.org/licenses/by/4.0/).
Share and Cite
Panyushkina, I.P.; Mukhamadiev, N.S.; Lynch, A.M.; Ashikbaev, N.A.; Arizpe, A.H.; O’Connor, C.D.; Abjanbaev, D.; Mengdіbayeva, G.Z.; Sagitov, A.O. Wild Apple Growth and Climate Change in Southeast Kazakhstan. Forests 2017, 8, 406. https://doi.org/10.3390/f8110406
Panyushkina IP, Mukhamadiev NS, Lynch AM, Ashikbaev NA, Arizpe AH, O’Connor CD, Abjanbaev D, Mengdіbayeva GZ, Sagitov AO. Wild Apple Growth and Climate Change in Southeast Kazakhstan. Forests. 2017; 8(11):406. https://doi.org/10.3390/f8110406
Chicago/Turabian StylePanyushkina, Irina P., Nurjan S. Mukhamadiev, Ann M. Lynch, Nursagim A. Ashikbaev, Alexis H. Arizpe, Christopher D. O’Connor, Danyar Abjanbaev, Gulnaz Z. Mengdіbayeva, and Abay O. Sagitov. 2017. "Wild Apple Growth and Climate Change in Southeast Kazakhstan" Forests 8, no. 11: 406. https://doi.org/10.3390/f8110406