Article

The Effect of Customer–Contractor Alignment in Forest Harvesting Services on Contractor Profitability and the Risk for Relationship Breakdown

1
SCA Forest Products, Skepparplatsen 1, SE-851 88 Sundsvall, Sweden
2
Département des Sciences du Bois et de la Forêt, Faculté de Foresterie et de Géomatique, 2405 rue de la Terrasse, Université Laval, Québec, QC G1V 0A6, Canada
3
Department of Forest Biomaterials and Technology, Swedish University of Agricultural Sciences, Skogsmarksgränd, SE-901 83 Umeå, Sweden
*
Author to whom correspondence should be addressed.
Forests 2017, 8(10), 360; https://doi.org/10.3390/f8100360
Submission received: 23 August 2017 / Revised: 16 September 2017 / Accepted: 16 September 2017 / Published: 25 September 2017
(This article belongs to the Special Issue Forest Operations, Engineering and Management)

Abstract

:
In forest operations, the interface between forest companies and harvesting contractors is of special importance, considering that it is the first link in the forest industry’s supply chains. Supply operations account for a significant share of the final costs of wood products (up to 50%). This study investigates the effect of customer–contractor alignment on contractors’ profit margins and on the risk for business relationship breakdown. Alignment is empirically measured for a Swedish forest company and 74 of its harvesting contractors, who were monitored during a four-year period. Two measures of alignment are employed: (1) the customer-perceived value of the contractors’ services; and (2) the contractors’ perceived alignment with the forest company expectations. Results indicate that the two measures of alignment are largely independent from each other, and that customer-perceived value affects both contractor profitability and the risk of relationship breakdown. Conflict between the two parties and lack of trust for the customer were found to be common complaints among contractors who ceased working for the studied forest company. Consequently, customer–contractor alignment should be considered a key objective by contractors who strive for business success, and also by forest companies who wish to improve their supply chain performance.

1. Introduction

1.1. Background

Forests are major sources of renewable products, annually contributing some 3.5 billion cubic meters of wood to the world economy and thus making the forest industry a potentially important part of the bioeconomy of the future [1] (p. 329). However, this potential development depends on the forest industry managing to stay competitive against, for instance, the concrete, plastic, and petroleum industries. Although it benefits from its status as a renewable product, wood must compensate for inherent disadvantages such as its geographical dispersion of production, acute sensitivity to weather and climate, and public scrutiny of its forest management. Competition in today’s markets often stands between supply chains of interlinked companies rather than between individual firms. To stay competitive in such an environment requires purposeful actions in regard to production technology and operations management. In literature discussing management of supply chains, alignment of a company with its suppliers and distribution channels is often identified as a key success factor (e.g., [2,3]). The notion of alignment may be considered from several different perspectives. In this study, alignment between two firms in a supply chain is considered as a consequence of two factors: (a) the supplying firm’s performance in relation to its customer’s requirements; and (b) the degree to which the configuration of the relationship corresponds to the supplying firm’s preferences. Ensuring that all parties in a supply chain align towards a common goal is no simple task, and limited information and guidelines seem to be available to production managers. In the forest industry, the outsourcing of forest operations has become common practice all over the world (e.g., [4]). Consequently, many forest companies rely on the services of small or medium-sized harvesting contractors (e.g., [5,6]). Despite the long tradition in the forest industry of working with contracted harvesting resources, large variations in contractor performance have been found regarding, for instance, contractor profitability (e.g., [7,8,9,10]), technical efficiency [11,12,13], and various aspects of the service delivered to the customer [14,15].
For forest companies who rely on the services of a number of contractors, such variation in performance means that some contractors are more in alignment with the companies’ service needs than others [14], which ultimately may lead to difficulties for the forest companies in fulfilling their own downstream requirements. Eriksson et al. [14] addressed this issue by analyzing harvesting contractor performance from a customer’s point of view. They suggested four generic approaches to contractor alignment: incentives, supplier development, use of power advantage, and active sourcing. Further, they developed a process that can be used to choose a strategy for aligning the performance of a company’s contractor fleet with the company’s needs. The process is designed to provide contractor-specific blends of the four generic approaches to help forest companies to maximize the effect of their efforts to improve contractor performance. The sole purpose of this process is contractor performance alignment from the customer’s perspective, which of course overlooks the contractors’ perspectives on the relationship. This may be a limitation of the process, since the risk for poor contractor performance is not the only risk associated with outsourced harvesting operations. The most obvious risk for a company may be that one or several of its suppliers decide to take their business elsewhere or terminate their enterprise, both of which could cause serious supply shortages if the company is unable to regain its suppliers or find replacements. To avoid such a situation, it may benefit companies better to align with their contractors in order to ensure that the contractors commit to their customer. To achieve such commitment, the alignment of performance may need to be supplemented by alignment of other dimensions such as strategy, culture, leadership style [16], pricing, reliability, responsiveness, and quality management [17].
In the Nordic countries, harvesting contractors perform fully mechanized cut-to-length thinning and final felling operations, by use of harvesters and forwarders. In a series of articles in the magazine of the Swedish Forest Machine Owners Association (e.g., [18,19,20,21]), the business environment for harvesting contractors provided by large forest companies is highlighted in numerous statements as a major threat to the contractors’ prosperity and ultimately to the whole forest industry. Such statements, paired with reports of the low profitability of many contractors (e.g., [7,8,9]), stalling or declining productivity [22,23], and rising costs ([24] and [1] (p. 249)), give the impression of serious structural problems in the forest sector. Researchers interested in contractor performance have reported large variations (e.g., [9,11,15,25]), even among contractors working within the same business context [14,26]. For the most part, researchers have focused on contractor-specific factors as explanatory variables. Such factors include, for instance, leadership and processes [27], knowledge, performance measurement [25], and the number of customers [11,28,29]. However, the suggestion from practitioners (such as the Swedish Forest Machine Owners Association) that the business environment is a key determinant of contractor performance has largely been overlooked by researchers, despite indications that good relations with a single customer is often common among high-performing contractors [11,28,29]. Further, few, if any, studies have taken a longitudinal perspective to the identification of the factors that lead to sustained benefits. All in all, little is known about what harvesting contractors can do to maximize their performance, or how customers of harvesting services can reduce their risk of contractor-related problems. Below, the two perspectives on the customer–contractor relationship are described and the concepts of alignment, contractor performance, and supply risk are outlined.

1.2. Two Perspectives on the Customer–Contractor Relationship

The relationship between harvesting contractors and their customers, like any relationship between two independent sides, may be looked upon from two perspectives where each side has their own unique expectations and perceptions. From the customer’s perspective, low cost has historically been the most frequently used measure in evaluating contractor performance [6]. Nowadays, customers of harvesting services also consider other more qualitative measures, with high contractor performance across a range of service aspects being necessary to fulfill customer requirements [14,30]. The switch from a cost-only focus in forest harvest contracting to a situation where many aspects of the service are valued is similar to the broader understanding of customer value that now prevails in a more general business context. For instance, Grönroos [31] suggests that a customer’s perception of the value of a service—apart from its monetary cost—depends on the perceived value of the core solution (i.e., the physical result of the service), the perceived value of various additional services associated with the core solution, and the perceived cost of upholding the business relationship (e.g., the cost of supervision).
From the contractors’ perspective, the ability to operate efficiently is to some extent determined by the working environment [11]. The working environment may differ between customers of harvesting services depending on, for instance, the customers’ different needs of flexibility [15,32]. Further, preferences on how the harvesting service should be performed may differ considerably between service buyers [26]. This suggests that contractors may utilize variations in potential customers’ preferences and operating environments to gain benefits by securing contracts with the customer whose needs the contractor can meet at the lowest cost.

1.3. Alignment

The notion of alignment has been used to address a variety of issues related to a company’s internal operation, such as the relationship between a company’s functional strategies to its holistic business strategy [33,34]. In supply chains involving multiple organizations, misalignments between supply chain partners may harm the overall effectiveness [2], and may be measured in several dimensions such as, for instance, cost reduction efforts, pricing, reliability, responsiveness, and quality management [17]. Eriksson et al. [14] assumed the customer’s perceived value of a harvesting contractor’s services as a measure of alignment, and suggested a process that forest products companies can use to actively manage the performance of their contractor fleets. However, taking only one perspective into account (as did Eriksson et al. [14]) is bound to give a somewhat incomplete description of the involved parties’ alignment. Accordingly, it may be necessary to measure, in addition to the customer’s perceived value of a service, the degree to which the contractors perceive alignment with their customer in order to achieve a complete picture of the alignment of studied relationships. Such a contractor-centered perspective is taken by Mäkinen [28], who in addition to considering the financial success of contractors also measured their capacity utilization and satisfaction with their customer. He found that the financially most successful contractor group also was the most satisfied with their customer. They also had the highest capacity utilization. This led him to conclude that the key success factor appeared to be working for a customer who provided a beneficial operating environment. This may be the clearest example from the literature that describes a situation where the customer’s alignment with the contractor gives mutual benefits for both parties. In Mäkinen’s study [28], the benefit for the contractor was financial success, and for the customer in the form of high contractor capacity utilization (and supposedly a competitive price).
To get a more complete picture of customer–contractor alignment, this study will address the notion from the previously described two perspectives: the customer’s and the contractor’s. Customer-perceived value [31] is used to reflect the customer’s perspective on relationship alignment, whereas the contractor perspective is represented by contractor perceptions on the business and operating environments offered by their customer.

1.4. Contractor Performance

The term ‘firm performance’ comprises a range of evaluative factors and assessments, but all measurements of a firm’s performance need to somehow support the firm’s strategic objectives [35]. Among harvesting contractors, a variety of reasons have been identified behind the foundation or takeover of harvesting firms, and their strategic objectives also differ markedly [36], thus making a comprehensive and yet homogenous definition of contractor performance a challenge. However, profitable operations allow contractors to stay in business and to acquire resources that can be used to reach other objectives—personal or professional; it is this which prompts the use of profitability as the primary measure of contractor performance. Focusing on this criterion has the advantage that it simplifies the measure of contractor performance and enables direct comparisons of performance between contractors; this essential simplicity explains its popularity in studies of harvesting contractors (e.g., [9,25]). Profitability may be measured with a range of key ratios, usually based on a firm’s earnings put in relation to either the firm’s turnover, or some proportion of the firm’s assets. Net profit margin (i.e., the share of the turnover that harvesting contractors have left after all expenses and taxes have been deducted) may be the most commonly used key ratio in analyses of firm profitability. For Finnish and Swedish conditions, published surveys of contractors’ finances have indicated an average net profit margin for harvesting contractors of around 4–7% with some annual fluctuations, and with a considerable share of the contractors reporting losses [7,9]. The profit margin key ratio gives an indication of the contractor firm’s ability to price its services and control its costs, and ultimately illustrates how effective the firm is in creating excess resources.

1.5. Supply Risk

Outsourcing in itself introduces some risk to a firm’s supply, since by definition it involves the firm giving up some of its control in exchange for some potential benefits [37]. In the worst case scenario, this loss of control may lead to higher procurement costs, interrupted downstream operations, or an inability to meet demand, if suppliers fail to perform as expected. To mitigate such risks, a frequently used method is to use several sources for a certain product or service, so that unexpected disruptions at a single supplier will have a limited effect on the total supply [38]. In the forest industry, a common setting is one where large forest companies employ several small harvesting contractors (e.g., [39]). Consequently, any disruptions in a contractor’s service need to be of significant magnitude to cause much of a problem for the average customer of harvesting services. On the other hand, a current trend in Sweden is to minimize roundwood stocks, so if one or more contractors in a certain area completely stop production, even large forest companies may face serious difficulties in meeting mill demand, or in fulfilling harvesting agreements with private landowners. Thus, such disruptions may cause costly problems and possibly lost business opportunities. In this context, it is a benefit for forest companies to have stable, or at least predictable, relationships with their contractors. To address these issues, this study evaluates supply risk by considering the risk for breakdown of the customer–contractor relationship, more specifically by following the relationship status over several years to see whether a breakup has occurred or not.

1.6. Study Objectives

As shown above, poor contractor performance within the forest industry is likely to cause supply disturbances, harvesting operations out of alignment with downstream requirements, and poor contractor profitability. Hypothetically, the degree of such problems can be related to the degree of alignment between harvesting contractors and their customers. However, these issues have previously not been experimentally demonstrated. Therefore, the overall aim of this study was to improve our knowledge of the effect of the customer-contractor relationship on contractor performance and the supply risk for the customer of harvesting services. The specific objectives of this study were to
(1)
define and apply criteria for measurement of alignment from both the customers’ and the contractors’ perspectives
(2)
analyze the relationship between customer–contractor alignment and contractor profitability
(3)
analyze the effect of both customer–contractor alignment and contractor profitability on the risk for relationship breakdown over time.
This study analyzes customer–contractor alignment from two perspectives:
(1)
Customer perceptions of the received value from contractor services.
(2)
Contractor perceptions of how well customers’ business and operational environments align with the contractors’ preferences.
The main hypothesis of the study is that customer–contractor alignment can foster both a lasting relationship and performance levels that meet customer expectations on high quality services as well as contractor expectations on high profits.

2. Materials and Methods

This study builds on previous research by Eriksson and Lindroos [26] and Eriksson et al. [14], with the parts used here being summarized in Section 3.1. In that previous work, alignment was studied from the customer perspective in a case of a large Swedish forest industry company and 74 of its harvesting contractors employed on a long-term basis during the period 2006–2009. The current study supplements the previously collected data with the contractors’ perspectives on their alignment with the customer, and with data on their profitability during the same time period. Further, this study also adds a longitudinal dimension by tracking the development of the customer–contractor relationship and the contractors’ profitability in 2011–2013 (ca. 4 years after the initial data collection) to measure how the more recent situation relates to the historic relationship with their customer. The study can be classified as using mixed methods, since use of qualitative methods (interviews and questionnaires) were mixed with the use of quantitative methods (e.g., collection of production data). Full coverage of contractors and customer representatives were aimed for in all data collections.

2.1. Measurement of Customer-Perceived Value of Harvesting Services

The customer-perceived value of a service was defined by Grönroos [31] as a composite of four generic attributes: the core solution, additional services, price, and relationship costs. Eriksson and Lindroos [26] adapted this framework for the study of forest harvesting services, identifying several sub-attributes. Furthermore, they measured the customer-perceived value of the harvesting services from each of the contractors included in this study, using survey items for sub-attributes associated with three generic attributes: core solution; additional services; and relationship costs. These items assessed the customer’s satisfaction with contractors’ services on 10-graded Likert scales. Further, the long-term ability of the contractors to maintain a competitive service price was assessed by identifying and collecting data for some key performance indicators reflecting harvesting and forwarding efficiency. These indicators (Table 1) were used by the customer company to monitor operations and are described more in detail in Eriksson et al. [14]. The data on the four measures collected in the previous studies [14,26] were used as input on customer-perceived value in this study.
Prior to performing analyses, all variables were standardized (mean value = 0, standard deviation (SD) = 1) to allow for easier interpretation of figures and comparison of regression coefficients. In addition, a composite index of customer-perceived value of harvesting services (CPV index) was constructed by calculating a standardized (mean value = 0, SD = 1) mean value of the standardized scores for the attribute-specific measures for each contractor.
Equation (1) describes the calculation of the composite measure of operational efficiency used in subsequent analyses. A multiplicative format was chosen to reflect the interdependence between harvesters and forwarders in the studied harvesting system.
Operational efficiency = Relative harvester productivity × Harvester utilization rate × Relative forwarder productivity × Forwarder utilization rate

2.2. Measurement of Contractor-Perceived Alignment

Information on the contractors’ perceptions of their alignment with the customer was collected through a questionnaire that all participating contractors were asked to complete. It was designed to provide a reliable measure of how well the relationship with the customer corresponded to contractor preferences. Five items were developed and pre-tested on two contractors who were not part of the final sample to ensure their validity. The final questionnaire comprised five statements describing their perceived alignment with the client in 2009, which was the end of the period covered by the data presented in Section 3.1. Contractors were asked to indicate the extent to which they agreed. The following items were used (translated from Swedish):
(1)
The company was the preferred client of my services five years ago.
(2)
My preferred way of working was compatible with the company’s way of working five years ago.
(3)
My values were compatible with the company’s values five years ago.
(4)
Having the company as a client helped me fulfill my business objectives five years ago.
(5)
I had a good business relationship with the company five years ago.
Answers were given on a 1–10 Likert scale, where 1 meant that the contractor totally disagreed, and 10 meant that the contractor totally agreed with the statement. Finally, all contractors were asked to tell without any formal restrictions their reasons for working with the client and, if applicable, their reasons for not working for the client anymore.
All information was collected by telephone in the summer of 2014. At least three attempts were made to reach contractors that did not initially respond. Fifty-five contractors were reached in this manner. Of the remaining 19 contractors, 18 contractors could not be reached, of which one had passed away; seven did not respond to any contact attempts despite still being in operation; while the remaining ten had dissolved their companies and it proved impossible to obtain valid contact information. In addition to these 18 contractors, one contractor declined to participate in the study despite assurances of strict anonymity. A total response rate of 76% was therefore obtained.
In addition, a composite index of contractor-perceived customer alignment (Alignment index) was constructed by calculating the standardized (mean value = 0, SD = 1) mean value of the scores for the above described items for each responding contractor.

2.3. Records of Customer–Contractor Relationship Status

Four groups of contractors were formed to analyze changes in relationship status. The groups were formed according to their relationship status with the case company at the end of 2013: the first group comprised contractors still employed by the company; the second was of bankrupted or dissolved contractor firms; the third was of firms who had left the case company to start business relationships with other customers; and finally the fourth group comprised both the contractors from the second and third groups, i.e., all contractors who were no longer employed by the company regardless of the reasons. Further, a binary variable was constructed where 1 was assigned to contractors that still worked for the customer on a long-term basis at the end of 2013, and 0 was given to all other contractors. Contractor firms in which the owner had retired but transferred the firm to a family member were considered to be the same entity.

2.4. Records of Contractor Profitability

All incorporated businesses are by law required to annually file their financial reports at the Swedish Companies Registration Office, where the reports are publicly available for a fee. In this study, the contractors’ net profit margin was selected as a measure of contractor profitability and collected from the annual financial reports of the studied contractors. Yearly net profit margins were aggregated to three-year averages for each contractor to reduce the effect of extraordinary events—such as machine investments or sales—on contractor financial key ratios. Net profit margins were recorded for two three-year aggregates. The first period covered the three fiscal years for each contractor that best corresponded to Eriksson and Lindroos’s [26] study period (2006–2009), and the second aggregate covered the latest three financial statements from each contractor that were publicly available in June 2014. It was not possible to obtain financial information for the exact same periods from each contractor since starting dates for their fiscal years differ.

2.5. Analyses

Due to the aforementioned non-responses, data on the contractors’ perceived alignment were missing for 24% of the contractors comprised in the initial dataset. Data imputation was used to compensate for the consequent lack of data in the variable alignment index. This imputation was made according to a model in which non-respondents were assigned alignment index values based on whether they were still employed by the customer or not. The rationale behind the model was derived from the significant differences in alignment index between contractor. The customer-perceived value index did not differ noticeably between respondents and non-respondents, but a fairly large—albeit statistically insignificant—difference in net profit margin of 3% was noted to the respondents’ advantage. Consequently, the applied imputation model should be sufficient to avoid problematic effects in the subsequent analyses due to non-response errors.
A one-way ANOVA was used to test for pairwise comparisons between contractor groups, and Pearson’s test was used to analyze correlations between variables. Ordinary least squares regression was used to analyze factors affecting contractor profitability, and binary logistic regression was used to analyze factors affecting the risk for relationship breakdown. The critical significance level was set to 0.05 in all analyses, but parameters with higher p-values are sometimes presented to show tendencies in the data. In the regression analyses, all independent variables were entered in standardized format (mean = 0, SD = 1) to allow for easy comparisons between variables, whereas the dependent variables were kept in their original form.

3. Results

Results are presented using the layout applied in the methods section: (1) contractor-perceived customer alignment, (2) customer-perceived value, (3) risk for relationship breakdown, and (4) contractor profitability.

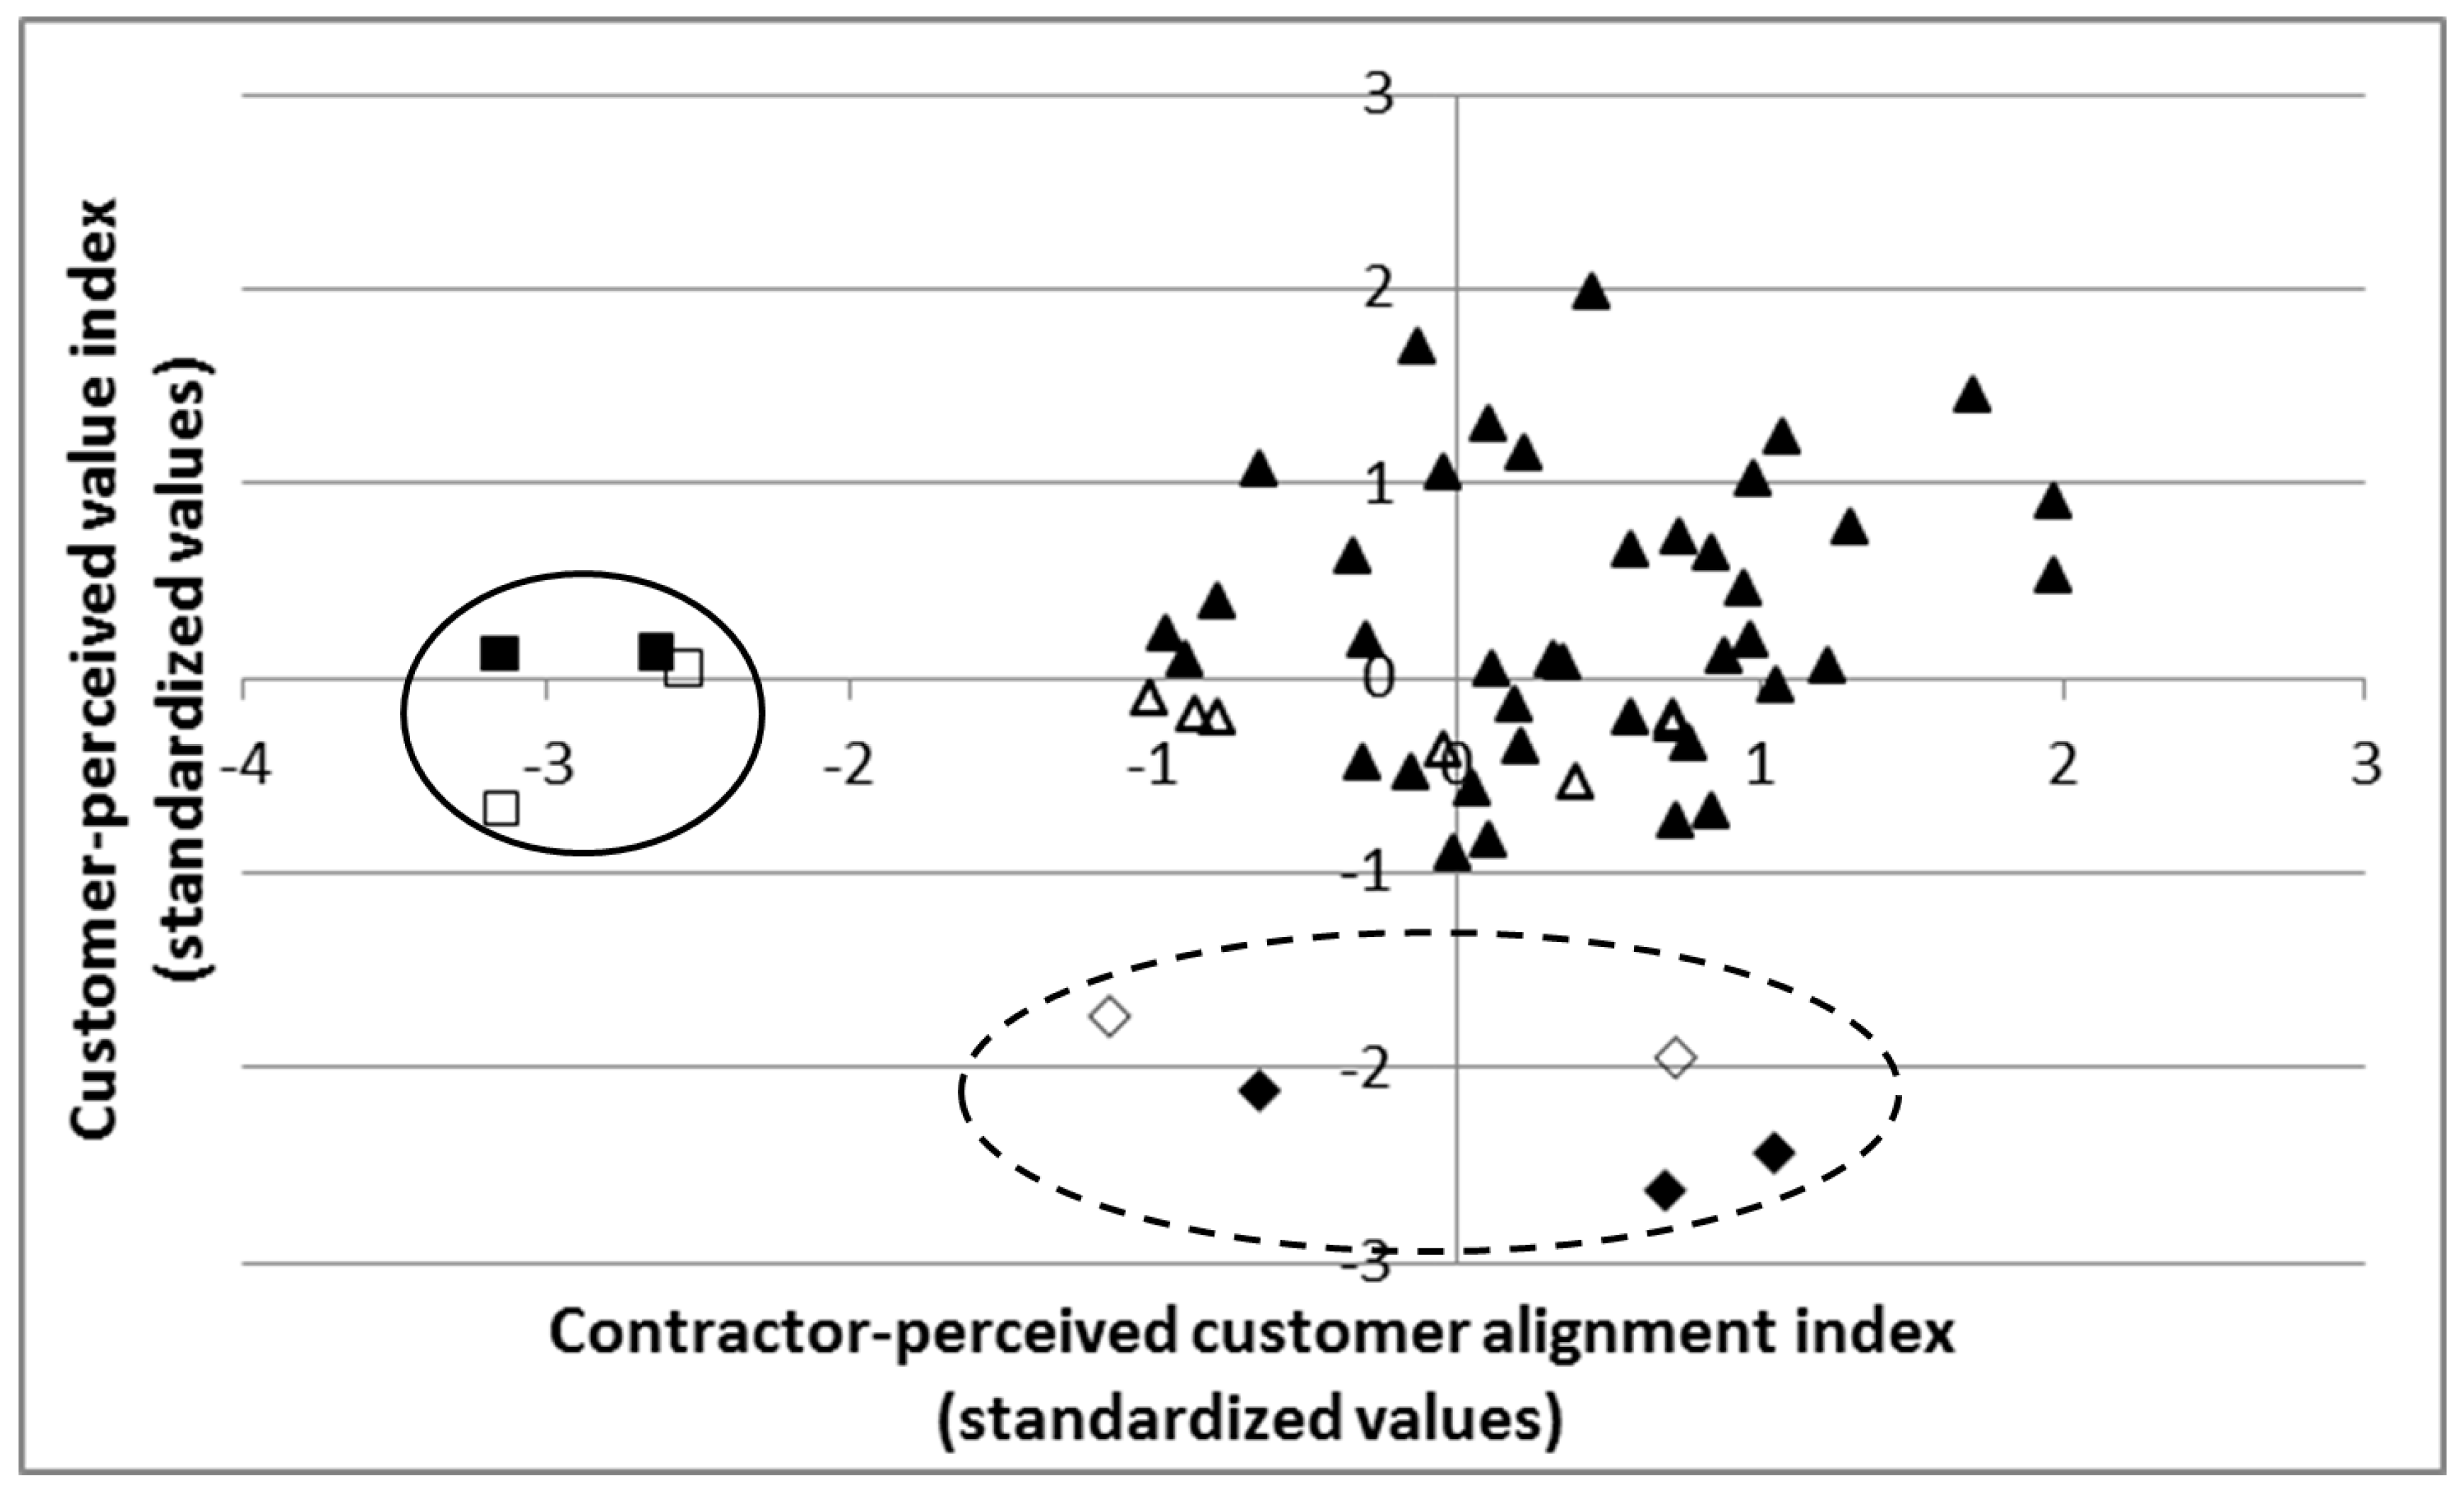
3.1. Contractor-Perceived Customer Alignment

Most of the contractors who responded to the survey in this study indicated that their customer was well aligned with their needs (see Table 2). In contrast to the general picture, however, a few contractors perceived severe misalignment, as indicated by scores at the very low end of the item scales. All items were highly correlated to each other (Pearson’s correlations between 0.43 and 0.66 significant at the p-value < 0.001 level), indicating a reliable composite measure.

3.2. Customer-Perceived Value of Harvesting Services

In the data collected by Eriksson and Lindroos [26], the customer expressed a relatively high appreciation for the contractors’ services (Table 3), at least for the three attributes measured on a Likert scale. Common to all customer-perceived value attributes is that they cover large ranges, indicative of significant potential improvements in the supply chain that could be achieved by a closer alignment of contractor performance with customer requirements.
The two alignment measures were plotted against each other (Figure 1). This allowed for the identification of two groups of contractors that stand out from the rest: group A, consisting of four contractors that expressed a very low perceived alignment with the customer, and group B, consisting of five contractors for which the customer perceived a very low value from their services. When the contractors in group A were asked why they perceived such misalignment, all but one (who declined to give a more detailed answer) described a very low level of trust in their client, frequently associating their customer with attributes such as having no respect or trust, unprofessional behavior, and dishonesty. These responses are clearly indicating a relationship with a certain level of conflict rather than alignment. For group B, the two contractors with the lowest perceived alignment had a similar (although not quite as severe) opinion of their customer, whereas the remaining three contractors gave no such indication of dissatisfaction. Ten of the interviewed contractors stopped working for the customer after the first study period. The reasons for this cessation varied, but three aspects were identified in the answers provided by the interviewees. First, seven out of the ten contractors who stopped working for the customer described a severely deteriorating relationship where they ultimately had lost trust in the customer’s officials. It was not possible to clearly establish the root cause of these conflicts, but it is worth noting that many of the contractors who had quit performed rather poorly from the customer’s perspective. In comparison, those contractors who did not quit performed noticeably above average. Second, four contractors indicated low price as the main reason why they decided to look elsewhere for better options. Three out of these contractors were also included in the first group. Finally, one of the interviewed contractors had been forced to file for bankruptcy (which also was the case for an additional three contractors in the non-responding group).

3.3. Risk for Relationship Breakdown

The status of the relationships between the customer and its contractors was monitored from the end of 2009 to the end of 2013 (i.e., if the contractors were still employed by the customer or not). During this time span, about 30% of the contractors stopped working for the company (Table 4). All contractors were divided into two groups according to the status of their relationship at the end of 2013. Contractors who had quit working for the customer were further segregated into two categories based on their current business status (i.e., if they were still in operation or not). Pairwise comparisons between groups revealed that contractors who continued to work with the customer showed a significantly higher contractor-perceived customer alignment index as well as customer-perceived value index than contractors who had quit (Table 4). Unsurprisingly, low profitability was a typical characteristic of contractor firms that later went bankrupt or were liquidated. Furthermore, contractors who decided to end the relationship for other reasons (mostly to start working for another customer) were on average less profitable than those who decided to stay. In the second period, no difference in profitability could be observed between contractor groups, indicating that the contractors who abandoned the case company for other customers actually managed to find customers whose business proposals were more in alignment with their own preferences.
Binary logistic regression was used to analyze what led to the observed events among the contractors. For the full dataset, net profit margin and perceived value from additional services (which in this case mostly corresponds to the customer’s perception of how well the contractor runs his business) both significantly increased the chance of a sustained relationship, whereas perceived value from the core solution rather counter-intuitively increased the risk of a dissolved relationship (Table 5, model a). Although there was not a significant statistical relationship (p = 0.104), there was still some limited evidence that the contractors’ perceived alignment with the customer, as measured by the alignment index variable, had a tendency to affect the chance of a sustained relationship. Indeed, most interviewees who had taken their business elsewhere reported that they did so because of dissatisfaction, or even conflict, with the customer. After calculation of the probabilities for a continued relationship and classifying probabilities over 50% as cases where a continued relationship was likely, model a managed to predict the relationship status after the study period correctly for 80% of all contractors. However, the hit ratio was unevenly distributed, with 90% of continuously employed contractors and 55% of contractors who quit classified correctly according to model a. This is indicative of the complexity of modelling relationship breakdown.
An analysis was also made for a subset of the data comprising all contractors who currently are active, either as contractors with the case company or for some other customer (Table 5, model b). In this analysis, the same pattern emerged as with the full dataset, but with one distinction: net profit margin did not affect the chance of a sustained relationship for this group. Consequently, there is no evidence that contractors who took their business elsewhere did so or were forced to do so because of low profitability. This result may suggest that other factors are considered when a contractor decides to change customer, or the customer decides to terminate a contract. Model b managed to predict the relationship status correctly for 87% of all the surviving contractors. The hit ratio was unevenly distributed, with 98% of continuously employed contractors and 30% of contractors who quit classified correctly according to model b, which further underlines the difficulty of accurately predicting relationship breakdown. For this group of contractors, the probability of an average contractor quitting was only 8%.
None of the contractors whom the customer perceived to deliver above-average value and who simultaneously made profits, which represented 42% of the total sample, quit working for the customer during the studied period (see Figure 2). However, 51% of the remaining contractors (i.e., 30% of the total number of contractors) who either made losses, were perceived to deliver below-average value, or both, had quit working for the customer, indicating the importance of achieving mutual benefit to sustain a business relationship.

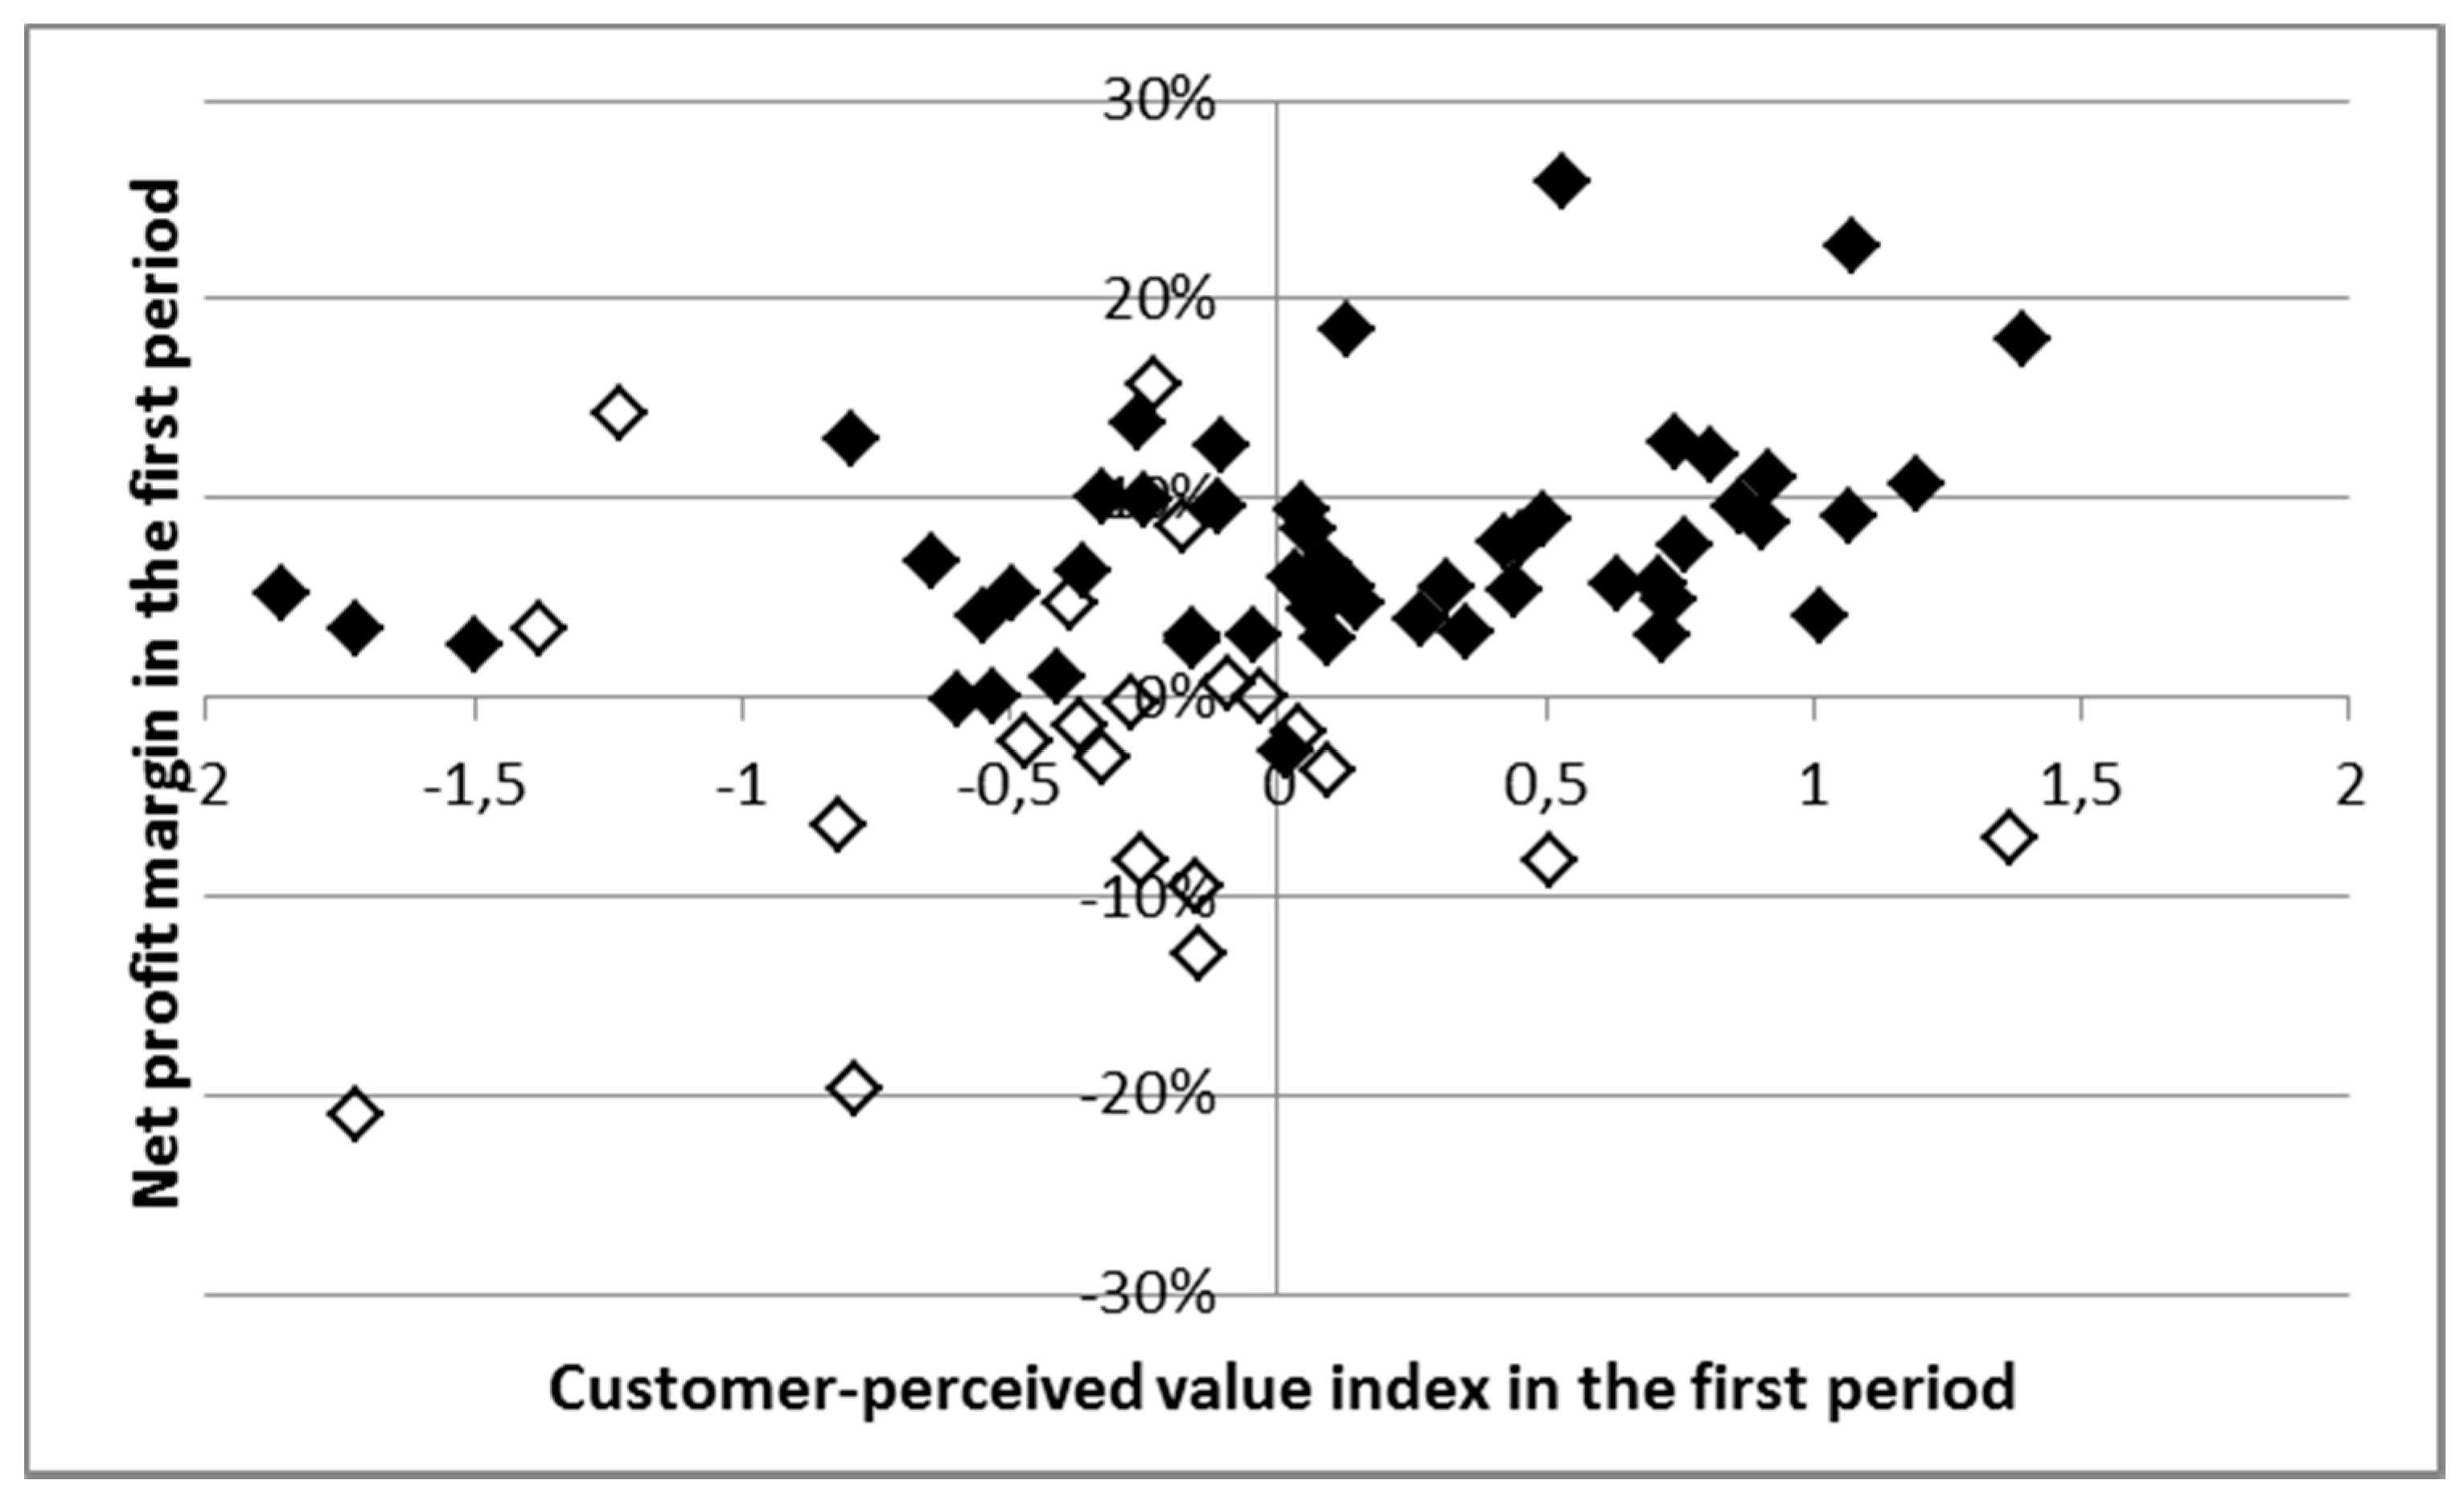
3.4. Contractor Profitability and Its Predictors

The average contractor in the study was profitable during the first study period. Profitability ranged from −21 to +23% and more than a quarter of the contractors were losing money, indicating a difficult situation for many of them (Table 6). Average profit increased in the second study period. However, by the end of the second period, 12 of the contractors had been liquidated or gone bankrupt, reducing the sample from 74 to 62 contractors. Of these 62 contractors, nine had switched to other customers and were still active (constituting the majority of category “other reasons” in Table 4).
In this study, customer-perceived value and its attributes, as well as the contractor-perceived customer alignment index, was hypothesized to relate to the contractor’s net profit margin. Many of these variables were found to correlate to each other, but the alignment index did not correlate significantly to other variables except for the customer-perceived value attribute of operational efficiency (Table 7). The customer-perceived value index, however, showed a significant positive correlation to net profit margin in both periods, identifying customer satisfaction as a key objective for contractors who pursue financial objectives. The attributes of customer-perceived value all correlated significantly to the customer-perceived value index (0.43–0.66), and most of them also correlated to each other (0.28–0.57), with the exception of operational efficiency which only correlated significantly to additional services (0.46). Judging by the correlation of net profit margin between periods, profitable contractors tend to stay profitable. Notably, all significant correlations in the matrix are positive.
As could have been expected from the observed correlations (Table 7), the customer-perceived value index had a significant effect on contractor net profit margin in the first period at the p < 0.05 level, whereas the significance level needed to be relaxed somewhat to detect any effect of the alignment index (p = 0.09; Table 8, model A). Replacing the customer-perceived value index with its attributes revealed that the only attribute with a significant effect on contractor profitability was operational efficiency (Table 8, model B). This is most likely linked to the nature of the predominant business model in this case, in which the vast majority of the work is paid by piece rates, which intrinsically means that more efficient contractors will have better cash flows. In this more detailed model (B), no tendency was observed for the alignment index, indicating that the tendency observed in model A may have been caused by the correlation between operational efficiency and the alignment index (see Table 7) rather than by the alignment index on its own merits. The explanatory power of both models is low (R2 of 11.6 and 12.5%, respectively), something which is possibly related to a high frequency of extreme observations in the net profit margin variable (see Figure 2).
In the second period, the customer-perceived value index had a significant effect on net profit margin, but when replaced by its attributes, only operational efficiency remained significant. However, when entering the net profit margin from the first period as a variable in the regression, all other variables lost their explanatory power—indicating past profitability as the key determinant of present profitability (Table 8, model C), at least for cases when no information on other aspects of present performance is available. Focusing only on contractors who continued to work for the customer, both the magnitude of the effect and the explanatory power of past profitability increased substantially (Table 8, model D), for which the parameter increased from 0.32 to 0.57, and R2 from 13 to 34% compared to the model (C) developed from the full dataset. This indicates that a contractor’s profit level is likely to be sustained as long as the contractor retains the relationship with the same customer. Notably, the average profitability for contractors who went to work for other customers was 5% percent units higher in the second period than in the first (see Table 4), even though the difference was not significant. This suggests that the change of customer may have worked as a reset for the profitability for this group by giving them a fresh start in a new environment, possibly an environment more in alignment with their requirements.
To summarize, customer–contractor alignment was considered from both the customer’s and the contractors’ perspectives. The two variables, customer-perceived value index and contractor-perceived alignment index, were developed and measured to enable analysis of alignment from both perspectives and were found to be uncorrelated to each other (Table 7). However, contractors’ operational efficiency was found to relate positively to the contractor-perceived alignment index (Table 7), suggesting that high operational efficiency may benefit both sides of the relationship. This is supported by the finding that the customer-perceived value index and its attribute operational efficiency were both significantly and positively related to current contractor profitability. To predict future profitability, past profitability was found to be the best predictor, especially for contractors who stayed in the relationship with the customer (Table 8). Contractors who quit working for the customer were significantly less aligned to the customer from both the customer’s and the contractors’ perspectives (Table 4), and stood out from other contractors by reporting, for instance, conflict and lack of trust with the customer’s officials. High contractor net profit margin and high customer-perceived value from additional services decreased the likelihood of relationship breakup, whereas high customer-perceived value from the core solution increased the risk (Table 5).

4. Discussion

Customer-perceived value of contractors’ services and contractor-perceived alignment with the customer were hypothesized to affect both contractors’ profitability and the probability of a retained customer relationship. A positive relationship would indicate that a contractor who manages to engage with a customer that offers a business environment in alignment with the contractors’ needs, and who manages to meet that customer’s expectations, would be in a position of competitive advantage compared to his or her peers. The study did indeed find partial support for this hypothesis, but neither customer-perceived value (or its attributes) nor the alignment index managed to explain much variance in profitability. An interpretation of this is that the primary source of competitive advantage for many harvesting contractors may be found in internal factors such as effective entrepreneurship or leadership rather than in their relationship to the customer, a tentative conclusion which concurs with findings from earlier studies (e.g., [25,27,29]). However, the differences between contractors who decided to terminate their relationship and contractors who continued to work for the customer indicate that a change of customer may contribute to resetting profitability for contractors who switch to a different business or operating environment. This indicates that a change of customer may be an attractive move for contractors in some specific situations, for instance, when a contractor’s production resources better align with some other customer’s operating environment. In 1994, Anderson et al. [40] reported that present customer satisfaction and past profitability both had positive effects on present profitability in a cross-industrial study of 77 Swedish companies, corresponding well with the results of our study. This study, in addition to considering a customer-perceived value index, also developed and analyzed measures associated with its attributes: core solution, additional services, price, and relationship costs. This indicated operational efficiency as the primary driver of profitability. Seemingly, operational efficiency is the alignment ‘focal point’ of this case, since it is also specified by the customer as a key attribute of the harvesting service [26], and was the only customer-perceived value attribute that correlated significantly to contractor-perceived customer alignment (see Table 7). Many of the interviewed contractors also perceived high expectations from the customer on maintaining a high pace in production and to constantly improve efficiency; these demands seem to have alienated some, primarily less efficient, contractors, and in extreme cases even led to open conflict. The commonly adopted piece rate pricing policy in the forest industry suggests that operational efficiency may be considered a general focal point for relationship alignment in forest harvesting services. Hypothetically, however, this may vary between companies.
High perceived value from additional services safeguarded against relationship breakdown (see Table 5). This is likely caused by the fact that one of the main points of outsourcing is to reduce the need for first level supervision by letting the contractor take on this role in exchange for a profit. Since many of the items used to quantify additional services were associated with how well a contractor runs the business (see [26], for details), high performance in additional services indicates that this transfer of managerial responsibility is working well. If a contractor is perceived to fail in managing the crew or crews, the customer may face a situation where it needs to allocate resources to the close supervision of the contractor to avoid receiving sub-standard services; this may lead the customer to look for other options to free up these resources.
The results from this study showed, somewhat counter-intuitively, an increased risk of a terminated relationship associated with high customer-perceived value from the core solution (i.e., in this case, perceived log quality, thinning quality, and environmental considerations, see [26]). This finding resembles the results from a previous study [41], in which trucking contractors’ service level to the customer was found to have a negative effect on contractor profitability, indicating low or no return on some core attributes of the service. A possible explanation is if the customer is, for instance, interested in quality being above a certain threshold level rather than maximized service quality [42]. Hypothetically, a contractor in such a case—one who is providing services far above the threshold—would have the incentive to change customer if the potential new customer is also offering a premium for quality. Relationships that end as a result of such recognition may not be entirely negative when considering the forest industry as a whole. Indeed, it contributes to relocating contractor resources and capabilities to supply chains where they are better appreciated, and presumably yield better benefits.
From the forest company’s perspective, the benefit that contractors get from finding the right customer underlines the importance of providing a business environment suited for contractors that they wish to keep in service. In this study, the fairly high scores that the majority of contractors gave to the items measuring their perceived alignment with the customer (see Table 2) indicate that the customer company provides a reasonably attractive environment for most of its contractors. Further, the positive relationship between customer-perceived value and contractor profitability shows that the company provides incentives for the contractors to fulfill the company’s needs. However, on a more detailed level, most attributes of customer-perceived value did not have any effect on contractor profitability. This indicates low incentives for contractors to focus on improvement of important aspects of their services, such as log quality, thinning quality, and environmental considerations, all associated with the attribute ‘core solution’. Consequently, the customer would be likely to benefit from adjusting its incentives program so that the contractors gain appreciably by performing well in the most important service attributes to the customer [14]. The chance for a sustained relationship was found to relate positively to contractor profitability and high perceived value from additional services (i.e., in this case, contractor management, collaboration, flexibility, and delivery performance, see [26] for details) whereas high perceived value from the core solution posed a risk for relationship breakup. Consequently, these variables could be used by the company to monitor the level of risk for flight or defaults in its contractor fleet and to evaluate, for instance, its pricing of harvesting services. In addition, interviews with contractors who had ceased working for the company identified lack of trust and conflicts with company officials as important causes of relationship breakdown. This indicates that the contractors’ perceived level of trust or conflict with the customer may lead to contractor flight, and consequently is a driver of supply risk for the customer, underlining the importance of good contractor relations for the customer.
This study used a limited sample to investigate customer–contractor alignment and its effects on contractor success in the forest harvesting business. Inherently, this will, of course, make some of the results case specific or at least somewhat biased due to the specific conditions of the sample. For instance, when analyzing the performance of contractors operating as third party service-supplier, Erlandsson et al. [15] have suggested adding the forest owner’s perspective to the here addressed costumer and contractor perspectives. Häggström and Lindroos [43] suggest a wider approach for performance in forest operations in general, as a product of complex interactions between human, technology, organization, and environment. Hence, there is growing support for a need of a more holistic view on performance in general, and especially for contractors. Moreover, cases of large forest companies relying on fleets of small harvesting contractors can be found in the forest industry all over the world. This, together with findings from the cited literature supporting the results, indicates that some generalizations can be made from our study. However, some special caution is advised when interpreting the results relating to specifics of the group of contractors who quit working for their customer. The response rate for this group was comparatively low, which may have caused errors due to possible non-response bias.
Naturally there are also limitations and possibilities for improvements in the applied methods and studied aspects of customer–contractor alignment. As indicated above, the performance within forest operations is dependent on numerous, entangled factors and actors. The scope could thus be broadened to cover aspects omitted in the current study. For instance, strategies and expectations for the innovation processes required for continuously improved performances both influence and are influenced by the relationships between costumer and contractor [44,45]. Thus, alignment within, for instance, those aspects could also be included in future analyses.
The use of self-reported data enables gathering of perceptual data that otherwise are difficult to come by, but the method also has limitations [46]. To mitigate the possible methodological shortcomings with self-reported data, a combination of various empirical and self-reported sources were used. For instance, the perceptions reported by customers were compared with the perceptions reported by contractors (e.g., Figure 1). Thus, the absolute values of the respective perception indexes might have been influenced by, for instance, same-source bias, but the influence on the comparisons of (standardized) indexes from different sources should be low. Another possible methodological weakness of the study is that it is in part based on retrospective interviews and surveys with contractors, making faulty recollections a potential source of error. Such response errors have been shown to relate negatively to the saliency of the recalled event [47]. Since the relationship with the forest company certainly represents a salient part of the contractors’ professional life at the time of the study, the likelihood of significant effects due to response errors should be low.

5. Conclusions

The objectives of this study were to define and operationalize alignment from both the customers’ and the contractors’ perspectives, and to empirically analyze its effect on contractor profitability and the development of the customer–contractor relationship over time. Measures of customer-perceived value of contractor services, and contractor-perceived alignment to the customer were developed and applied in a study of a Swedish forest company and its employed contractors.
Findings from this study demonstrate effects of previous contractor profitability, and the customer’s perceived value of the contractors’ services on contractor profitability. Further, we demonstrate that contractor profitability reduces the risk of relationship breakup, whereas attributes of the customer’s perceived value of contractor services have mixed effects. Contractors who decided to change customer or liquidate their firm during the studied period reported conflict and lack of trust as important reasons for ending the relationship with the customer, which indicates an interesting area for future research.
Contractors in the forest harvesting business should seek out the customer that offers business opportunities that are in close alignment with their capabilities and resources to optimize their chances of success. When contractors are employed by the best possible customer, results from this study indicate that the best strategy is to focus on internal efficiency and to be perceived as a promising contractor by the customer. For contractors working on a piece rate basis, this primarily means focusing on operational efficiency to maintain a high cash flow and competitively price their services. Forest companies, on the other hand, would benefit from applying a process for management of its contractor fleet, such as the one suggested by Eriksson et al. [14], to improve alignment of its contractors. Further, companies may benefit from monitoring the profitability of their contractors and use it as an indicator of their contractor-related supply risk.
Results from this study show that customer–contractor alignment does affect outcomes for both contractors and their customers. Consequently, alignment between supply chain partners should be a priority for both practitioners and researchers interested in improving forest operations from a supply chain perspective. If successful, such efforts would contribute to simultaneously improve the value of contractor services to downstream actors and provide contractors with better business opportunities.

Acknowledgments

We would like to thank Pelle Gemmel and Magnus Larsson for helpful comments on earlier versions of the manuscript. This study was conducted as part of the Swedish Forest Industry Research School on Technology (FIRST) program.

Author Contributions

M.E. conceived and designed the study, collected and analyzed the data, and wrote the paper. L.L. and O.L. conceived and designed the study and contributed to the writing of the paper.

Conflicts of Interest

The authors declare no conflict of interest.

References

  1. Anon. Skogsstatistisk Årsbok 2014 (Swedish Statistical Yearbook of Forestry 2014); Skogsstyrelsen: Jonkoping, Sweden, 2014; pp. 249, 329, (In Swedish and English). [Google Scholar]
  2. Lee, H.L. The triple—A supply chain. Harv. Bus. Rev. 2004, 82, 102–112. [Google Scholar] [PubMed]
  3. Cavinato, J.L.; Flynn, A.E.; Kauffmann, R.G. The Supply Management Handbook, 7th ed.; McGraw-Hill: New York, NY, USA, 2006. [Google Scholar]
  4. Häggström, C. Human Factors in Mechanized Cut-to-Length Forest Operations. Ph.D. Thesis, Swedish University for Agricultural Sciences, Acta Universitatis Agriculturae Sueciae, Umeå, Sweden, 2015. [Google Scholar]
  5. St-Jean, E.; LeBel, L. The Influence of decisional autonomy on performance and strategic choices—The case of subcontracting SMEs in logging operations. In Global Perspectives on Sustainable Forest Management; Okia, C.A., Ed.; InTech: Rijeka, Croatia, 2012; pp. 59–74. [Google Scholar]
  6. Ager, B. Skogsbrukets Rationalisering och Humanisering 1900–2011 och Framåt (The rationalization and humanization of forestry 1900–2011 and onwards); Arbetsrapport 378; Swedish University for Agricultural Sciences: Umeå, Sweden, 2012; (In Swedish with English summary). [Google Scholar]
  7. Berg, S. Skogsentreprenadföretagens Lönsamhet (Logging Contractors’ Profitability). Master’s Thesis, Swedish University for Agricultural Sciences, Uppsala, Sweden, 2009. (In Swedish with English summary). [Google Scholar]
  8. Soirinsuo, J.; Mäkinen, P. Importance of the financial situation for the growth of a forest machine entrepreneur. Scand. J. For. Res. 2009, 24, 264–272. [Google Scholar] [CrossRef]
  9. Penttinen, M.; Mikkola, J.; Rummukainen, A. Profitability of Wood Harvesting Enterprises; Working Papers of the Finnish Forest Research Institute; Finnish Forest Research Institute: Helsinki, Finland, 2009; Volume 126. [Google Scholar]
  10. Kelly, M.C.; Germain, R.H. Is it efficient to single-handedly run a multi-machine harvesting operation? A case study from the Northeast United States? Int. J. For. Eng. 2016, 27, 140–150. [Google Scholar] [CrossRef]
  11. LeBel, L.; Stuart, W.B. Technical efficiency evaluation of logging contractors using a nonparametric model. J. For. Eng. 1998, 9, 15–24. [Google Scholar]
  12. Carter, D.R.; Cubbage, F.W. Stochastic frontier estimation and sources of technical efficiency in southern timber harvesting. For. Sci. 1995, 41, 576–593. [Google Scholar]
  13. Conrad, J.-L., IV; Vokoun, M.M.; Prisley, S.P.; Bolding, C. Barriers to logging production and efficiency in Wisconsin. Int. J. For. Eng. 2017, 28, 57–65. [Google Scholar] [CrossRef]
  14. Eriksson, M.; LeBel, L.; Lindroos, O. Management of outsourced forest harvesting operations for better customer-contractor alignment. For. Policy Econ. 2015, 53, 45–55. [Google Scholar] [CrossRef]
  15. Erlandsson, E.; Lidestav, G.; Fjeld, D. Measuring quality perception and satisfaction for wood harvesting services with a triad perspective. Int. J. For. Eng. 2017, 28, 18–33. [Google Scholar] [CrossRef]
  16. Chorn, N.H. The “alignment” theory: Creating strategic fit. Manag. Decis. 1991, 29, 20–24. [Google Scholar] [CrossRef]
  17. Siguaw, J.A.; Simpson, P.M. Toward assessing supplier value: Usage and importance of supplier selection, retention, and value-added criteria. J. Mark. Channels 2004, 11, 3–31. [Google Scholar] [CrossRef]
  18. Anon. Entreprenadföretagare om Skogsindustrin: Omodern och Oproffsig (Harvesting contractor about the forest industry: Out of date and unprofessional). Skogsentreprenören 2012, 1, 16. (In Swedish) [Google Scholar]
  19. Sandström, U. Är entreprenörsstrategin i det svenska skogsbruket på väg att totalhaverera? (Is the contracting strategy of Swedish forest industry completely failing?). Skogsentreprenören 2012, 2, 10–11. (In Swedish) [Google Scholar]
  20. Sandström, U. Ris och ros för nyckeltalen (Cheers and boos for the key ratios). Skogsentreprenören 2012, 1, 10–11. (In Swedish) [Google Scholar]
  21. Sandström, U. Det är dags att stoppa nu (It is time to stop now)! Skogsentreprenören 2013, 1, 13. (In Swedish) [Google Scholar]
  22. Brunberg, T. Produktiviteten vid drivning från 2008 till 2011 (Productivity in Logging 2008 to 2011); Resultat No 2; Skogforsk: Uppsala, Sweden, 2012; (In Swedish with a summary in English). [Google Scholar]
  23. Anon. Finnish Statistical Yearbook of Forestry 2010; Finnish Forest Research Institute: Helsinki, Finland, 2012; p. 472. [Google Scholar]
  24. Brunberg, T. Skogsbrukets kostnader och intäkter 2011—Kraftig ökning av skogsbrukskostnaden (Forestry Costs and Revenues 2011—Major Increase in Costs); Resultat No 5; Skogforsk: Uppsala, Sweden, 2012; (In Swedish with a summary in English). [Google Scholar]
  25. Cacot, E.; Emeyriat, R.; Bouvet, A.; Helou, T.E. Tools and analysis of key success factors for mechanized forest contractors specializing in mechanized harvesting in the Aquitaine region. In Proceedings of the FORMEC 2010, Padova, Italy, 11–14 July 2010. [Google Scholar]
  26. Eriksson, M.; Lindroos, O. Customer-perceived value in forest harvesting operations. In Proceedings of the 34th Council of Forest Engineering, Quebec City, QC, Canada, 12–15 June 2011. [Google Scholar]
  27. Norin, K.; Thorsén, Å. Skogsbrukets “bästa” entreprenadföretag—Deras starka sidor och vad de vill förbättra (The Top Logging Contractors—Their Strengths and Aims); Resultat No 9; Skogforsk: Uppsala, Sweden, 1998; (In Swedish with a summary in English). [Google Scholar]
  28. Mäkinen, P. Success factors for forest machine entrepreneurs. J. For. Eng. 1997, 8, 27–35. [Google Scholar]
  29. Norin, K.; Karlsson, A. Så arbetar en vinnare—Djupintervjuer med tio lönsamma skogsentreprenörer (What Makes a Winner?—Searching Interviews with Ten Successful Forestry Contractor Businesses); Resultat No 21; Skogforsk: Uppsala, Sweden, 2010; (In Swedish with a summary in English). [Google Scholar]
  30. Ulaga, W.; Eggert, A. Value-based differentiation in business relationships: Gaining and sustaining key supplier status. J. Mark. 2006, 70, 119–136. [Google Scholar] [CrossRef]
  31. Grönroos, C. Value-driven relational marketing: From products to resources and competencies. J. Mark. Manag. 1997, 13, 407–419. [Google Scholar] [CrossRef]
  32. Erlandsson, E. The impact of industrial context on procurement, management and development of harvesting services: A comparison of two Swedish forest owners associations. Forests 2013, 4, 1171–1198. [Google Scholar] [CrossRef]
  33. Nollet, J.; Ponce, S.; Campbell, M. About “strategy” and “strategies” in supply management. J. Purch. Suppl Manag. 2005, 11, 129–140. [Google Scholar] [CrossRef]
  34. Cousins, P.D. The alignment of appropriate firm and supply strategies for competitive advantage. Int. J. Oper. Prod. Manag. 2005, 25, 403–428. [Google Scholar] [CrossRef]
  35. Tangen, S. Performance measurement: From philosophy to practice. Int. J. Prod. Perform. Manag. 2004, 53, 726–737. [Google Scholar] [CrossRef]
  36. Drolet, S.; LeBel, L. Forest harvesting entrepreneurs, perception of their business status and its influence on performance evaluation. For. Policy Econ. 2010, 12, 287–298. [Google Scholar] [CrossRef]
  37. Zsidisin, G.A. Managerial perceptions of supply risk. J. Suppl Chain Manag. 2003, 39, 14–25. [Google Scholar] [CrossRef]
  38. Chopra, S.; Meindl, P. Supply Chain Management: Strategy, Planning, and Operation, 5th ed.; Pearson: London, UK, 2013. [Google Scholar]
  39. Häggström, C.; Kawasaki, A.; Lidestav, G. Profiles of forestry contractors and development of the forestry-contracting sector in Sweden. Scand. J. For. Res. 2013, 28, 395–404. [Google Scholar] [CrossRef]
  40. Anderson, E.W.; Fornell, C.; Lehmann, D.R. Customer satisfaction, market share, and profitability: Findings from Sweden. J. Mark. 1994, 58, 53–66. [Google Scholar] [CrossRef]
  41. Lindström, J. Kartläggning av Ruttplaneringsprocesser för Rundvirkestransportörer (Mapping of the Vehicle Routing Processes in Timber Transport). Master’s Thesis, Arbetsrapport 285. Swedish University of Agricultural Sciences, Uppsala, Sweden. (In Swedish with a summary in English).
  42. Yang, C.-C. The refined Kano’s model and its application. Total Qual. Manag. 2005, 16, 1127–1137. [Google Scholar] [CrossRef]
  43. Häggström, C.; Lindroos, O. Human, technology, organization and environment—A human factors perspective on performance in forest harvesting. Int. J. For. Eng. 2016, 27, 67–78. [Google Scholar] [CrossRef]
  44. Rametsteiner, E.; Weiss, G. Innovation and innovation policy in forestry: Linking innovation process with systems models. For. Policy Econ. 2006, 8, 691–703. [Google Scholar] [CrossRef]
  45. Štěrbová, M.; Loučanová, E.; Paluš, H.; L’ubomír, I.; Šálka, J. Innovation strategy in Slovak forest contractor firms—A SWOT analysis. Forests 2016, 7, 118. [Google Scholar] [CrossRef]
  46. Podsakoff, P.M.; Organ, D.W. Self-reports in organizational research: Problems and prospects. J. Manag. 1986, 12, 531–544. [Google Scholar] [CrossRef]
  47. Mathiowetz, N.A.; Duncan, G.J. Out of work, out of mind: Response errors in retrospective reports of unemployment. J. Bus. Econ. Stat. 1988, 6, 221–229. [Google Scholar]
Figure 1. Customer–contractor alignment from two different perspectives for 55 responding contractors. Filled (black) symbols represent contractors that still worked for the customer, whereas unfilled symbols represent contractors that ceased to work for the customer. Group A (squares, and circled by solid line) include low perceived alignment by contractor, and Group B (diamonds, and circled by a dotted line) include low performing contractors from the client’s perspective.
Forests 08 00360 g001
Figure 2. Net profit margin and customer-perceived value index in the first period (ca. 2006–2009). Filled (black) symbols represent contractors that still worked for the customer, whereas unfilled symbols represent contractors that ceased to work for the customer.
Forests 08 00360 g002
Table 1. Schematic view of the measures of customer-perceived value as used in this study.
Name of Measure in This StudyAssociated Generic Attribute [31]Associated Sub-Attributes [26]Type of DataMethod of Calculation
Core solutionCore solutionLog quality
Thinning quality
Environmental considerations
Survey of customer perceptionsMean of sub-attribute scores
Additional servicesAdditional servicesFlexibility
Delivery performance
Management
Collaboration
Survey of customer perceptionsMean of sub-attribute scores
Operational efficiencyPriceHarvester productivity
Harvester utilization rate
Forwarder productivity
Forwarder utilization rate
Machine follow-up dataEquation (1)
(see below)
Relationship costsRelationship costsDaily communication
Business relationship
Survey of customer perceptionsMean of sub-attribute scores
Table 2. Contractors’ perceptions of their customer in 2009 (1 = completely disagree, 10 = completely agree). n= 55 for all items. SD = standard deviation and Q = quartile.
ItemMeanSDMinQ1MedianQ3Max
1.
The company was the preferred client of my services.
7.22.31.06.08.08.010.0
2.
My preferred way of working was compatible with the company’s way of working.
7.12.02.06.07.08.010.0
3.
My values were compatible with the company’s values.
6.82.11.06.07.08.010.0
4.
To have the company as a client helped me fulfill my business objectives.
6.42.51.05.07.08.010.0
5.
had a good business relationship with the company.
7.52.51.07.08.09.010.0
Alignment index 10.01.0−3.2−0.640.210.722.0
1 Standardized mean of standardized item values (mean value = 0, SD = 1).
Table 3. Statistics for customer-perceived value for the period 2007–2009. n = 74 for all attributes.
AttributeMeanSDMinQ1MedianQ3Max
Core solution 17.31.24.76.57.38.010.0
Additional services 16.51.42.95.86.67.78.8
Relationship costs 17.41.31.36.77.58.210.0
Operational efficiency 2 0.750.190.400.630.730.831.33
CPV Index 301.0−2.6−0.510.0380.712.0
1 Measured on a 1–10 Likert scale. 2 Index as described in Equation (1). 3 Standardized mean of standardized attribute values (mean value = 0, SD = 1). CPV: customer-perceived value of harvesting services.
Table 4. Relation between relationship status and customer–contractor alignment; customer-perceived value of harvesting services; and contractor profitability.
VariableStill Employed (n = 52)Dissolved Relationship
Total (n = 22)Bankruptcy or Liquidation (n = 12)Other Reasons (n = 10)
Alignment index 10.23 A−0.64 B−0.43−0.89
CPV index0.23 A−0.45 B−0.42−0.49
Average net profit margin
Fiscal years 2007–20090.05 A−0.03 B−0.050.00
Fiscal years 2011–20130.05 A0.05 B-0.05
1 Deviating number of respondents: fifty-five in total; forty-four still employed, three in bankruptcy or liquidated, and eight who quit for other reasons. Note: Within rows, different superscript letters (A and B) indicate significant (p < 0.05) differences (one-way ANOVA) between still employed contractors and those who no longer worked for the customer. Group differences between the still employed contractors and the two sub-groups according to the reason for the ending of the customer–contractor relationship were not analyzed because of limited sizes of the sub-groups.
Table 5. Binary logistic regression models with relationship status as dependent variable (continued relationship = 1; terminated relationship = 0, with a continued relationship as reference event).
ModelVariableParameter EstimateStandard errorWaldp-ValueOdds RatioDeviance p-Value
aFull model-----0.865
Intercept1.5110.4063.72<0.001--
Additional services1.2700.4602.760.0063.56-
Net profit margin1.0860.4432.450.0142.96-
Core solution−0.9130.456−2.000.0450.40-
Alignment index0.5970.3671.630.1041.82-
b 1Full model-----0.992
Intercept2.4450.6094.01<0.001--
Additional services1.7290.7112.430.0155.63-
Core solution−1.4940.685−2.180.0290.22-
Alignment index0.7330.4291.710.0872.08-
1 Model developed on a subset of the data for which n = 62 contractors who were still in business after the second study period.
Table 6. Contractors’ profitability for each studied period.
Average Net Profit Margin (%)
PeriodnMeanSDMinQ1MedianQ3Max
1 (fiscal years 2007–2009)7438−21−12723
2 (fiscal years 2011–2013)6255−8 13821
Table 7. Pearson’s correlations between the numerical variables in the study.
VariableAlignment Index 1Net Profit Margin, Period 1Net Profit Margin, Period 2 2
Net profit margin, period 10.16--
Net profit margin, period 2 20.0270.45 *-
CPV index0.130.32 *0.29 *
 Core solution−0.13−0.010.04
 Additional services0.190.33 *0.26 *
 Operational efficiency0.30 *0.34 *0.32 *
 Business relationship0.000.26 *0.19
p = 0.05–0.1, * p < 0.05. Note: n = 74, except for 1 where n = 55 respondents and 2 where n = 62 surviving firms.
Table 8. Models explaining observed variation in contractor net profit margin.
PeriodModelVariableParameter EstimateStandard Errorp-ValueR2-adjRMSE
1A 1Full model--0.0050.1180.0720
Intercept0.02560.0080.003--
CPV index 0.02340.0090.011--
Alignment index0.01420.0090.102--
B 2Full model--0.0030.1250.0717
Intercept0.02590.0080.003--
Operational efficiency0.02250.0090.011--
Relationship costs0.01470.0090.093--
2C 1Full model--0.0020.1330.0501
Intercept0.03280.008<0.01--
Profit margin period 10.31730.0990.002--
D 3Full model--0.0020.3440.0444
Intercept0.01820.0080.027--
Profit margin period 10.56740.108<0.001--
1 Full dataset. 2 Full dataset, CPV index replaced with its attributes. 3 Subset of the data comprising 52 contractors who continued to work for the customer. R2-adj = adjusted level of explained variance; RMSE = root mean square error.

