1. Introduction
Global warming is considered to be one of the most significant factors that has caused the greatest changes of ecosystems in high altitudes and latitudes during the last century [
1]. The alpine treeline ecotone is the transitional zone from the timberline to the tree species limit, where the timberline is the upper delimitation of the closed forest and the tree species line is the uppermost location of seedlings or saplings [
2,
3]. As the natural boundary of high-altitude ecosystems, the alpine treeline ecotone is widely assumed as the early-warning monitor of climate change for its sensitivity to climate change [
4]. The treeline is the upper altitudinal limit at which upright trees reach two meters in height [
5,
6,
7]. Given the importance of environmental factors in controlling the position of the treeline and affecting tree recruitment, the alpine treeline ecotone is thought to be vulnerable to climate change, showing changes in density dynamics, recruitment patterns, and treeline positions [
5,
8,
9,
10,
11].
Treeline studies have used three general approaches to assess treeline position: long-term monitoring of the permanent plots, remote sensing, and mainly aerial photographs and stand structure/treeline reconstruction by using tree-rings [
12,
13,
14]. One of the main factors that controls treeline ecotones is the climate, and in particular, the sustained increasing temperature [
10]. The prevailing perspective is that the changes of summer temperatures strongly affect the treeline position during the vegetation period [
15], although several studies also indicated the importance of winter temperatures [
16]. However, the expansion of trees to higher elevations is not universal. In an extensive assessment of 166 treeline studies globally, treelines were found to be advancing at 52% of these sites since 1900s, stable at 46%, and retreating at 2% [
13]. While treelines in the Scandes and Central Himalayas have risen 200 m and 300 m in recent decades, respectively, there has not been significant treeline advance in the Barun Valley, the Alps, or Alaska [
2,
16,
17,
18]. The variability of treeline response to temperature indicates that temperature may not be the dominant factor controlling the treeline position in some regions. Temperature can interact with other factors such as precipitation, plant-plant interactions, wind exposure, topography, snow cover, and land-use changes [
9,
18,
19,
20,
21].
In fact, treeline advance is proven to be the result of the establishment of young individuals in treeless areas or even beyond the present treeline rather than the growth of mature trees [
22,
23]. Spatial and temporal patterns of tree populations may play a significant role in treeline dynamics [
24,
25]. In several study regions, the amount of recent young trees has increased or is increasing in the lower and middle areas of the ecotone, revealing a rising population density rather than treeline advance [
7,
26]. Contrarily, in other areas, new establishment has led to the infilling of existing trees and possible treeline upslope movement, apparently reflecting an amelioration of the environment in the treeless areas with wind exposure, ice particle abrasion, and thin snow cover [
13,
20]. Trees, once established in the treeless areas within the treeline ecotone or beyond the present treeline, may serve as seed sources and change the microclimate [
27,
28]. However, this is not necessarily related to the advance of the treeline position, which is probably a much more complex process and would take several decades or even centuries [
22].
The alpine treeline at the Tibetan Plateau (TP) in China is the highest treeline in the world and is considered to be especially sensitive to global climate change [
14]. The treeline here is frequently situated above 4000 m above sea level (a.s.l.) [
29]. Changing treeline ecotones, with both population dynamics and treeline location, have been reported mainly for the central, northern, and southern TP during recent decades [
2,
14,
18,
30]. However, the TP climate is under the combined and competitive influence of South Asian and East Asian Monsoons as well as the mid-latitude westerlies. The observed climate data in the eastern margin and other region of the TP exhibited different characteristics and trends [
31]. Therefore, there is a need for more field-based data to understand the treeline ecotone dynamics in the eastern margin of the TP, where the related study is lacking. Moreover, the treeline dynamics vary with the area-specific climate and slope exposure [
18,
32,
33,
34]. A study focusing on multiple aspects will be able to interpret the slope exposure effects on the alpine treeline ecotone.
To understand the population dynamics and the cumulative climate-change effects on the alpine treeline ecotone in the eastern margin of the TP, we selected various sites on the north-facing and south-facing slopes. The density, recruitment pattern, and treeline dynamics of the treeline forming species
Larix potaninii var.
macrocarpa [
35] were analyzed to address the following research questions: (i) What are the treeline ecotone dynamics in the eastern margin of the TP, including density, recruitment, and treeline position? Are there any differences between the two different slopes? (ii) What are the roles of two primary drivers, temperature and precipitation, in treeline ecotone dynamics? Are there any other factors, such as slope exposure and snowpack, limiting the tree regeneration and treeline movements?
2. Materials and Methods
2.1. Study Area and Site Selection
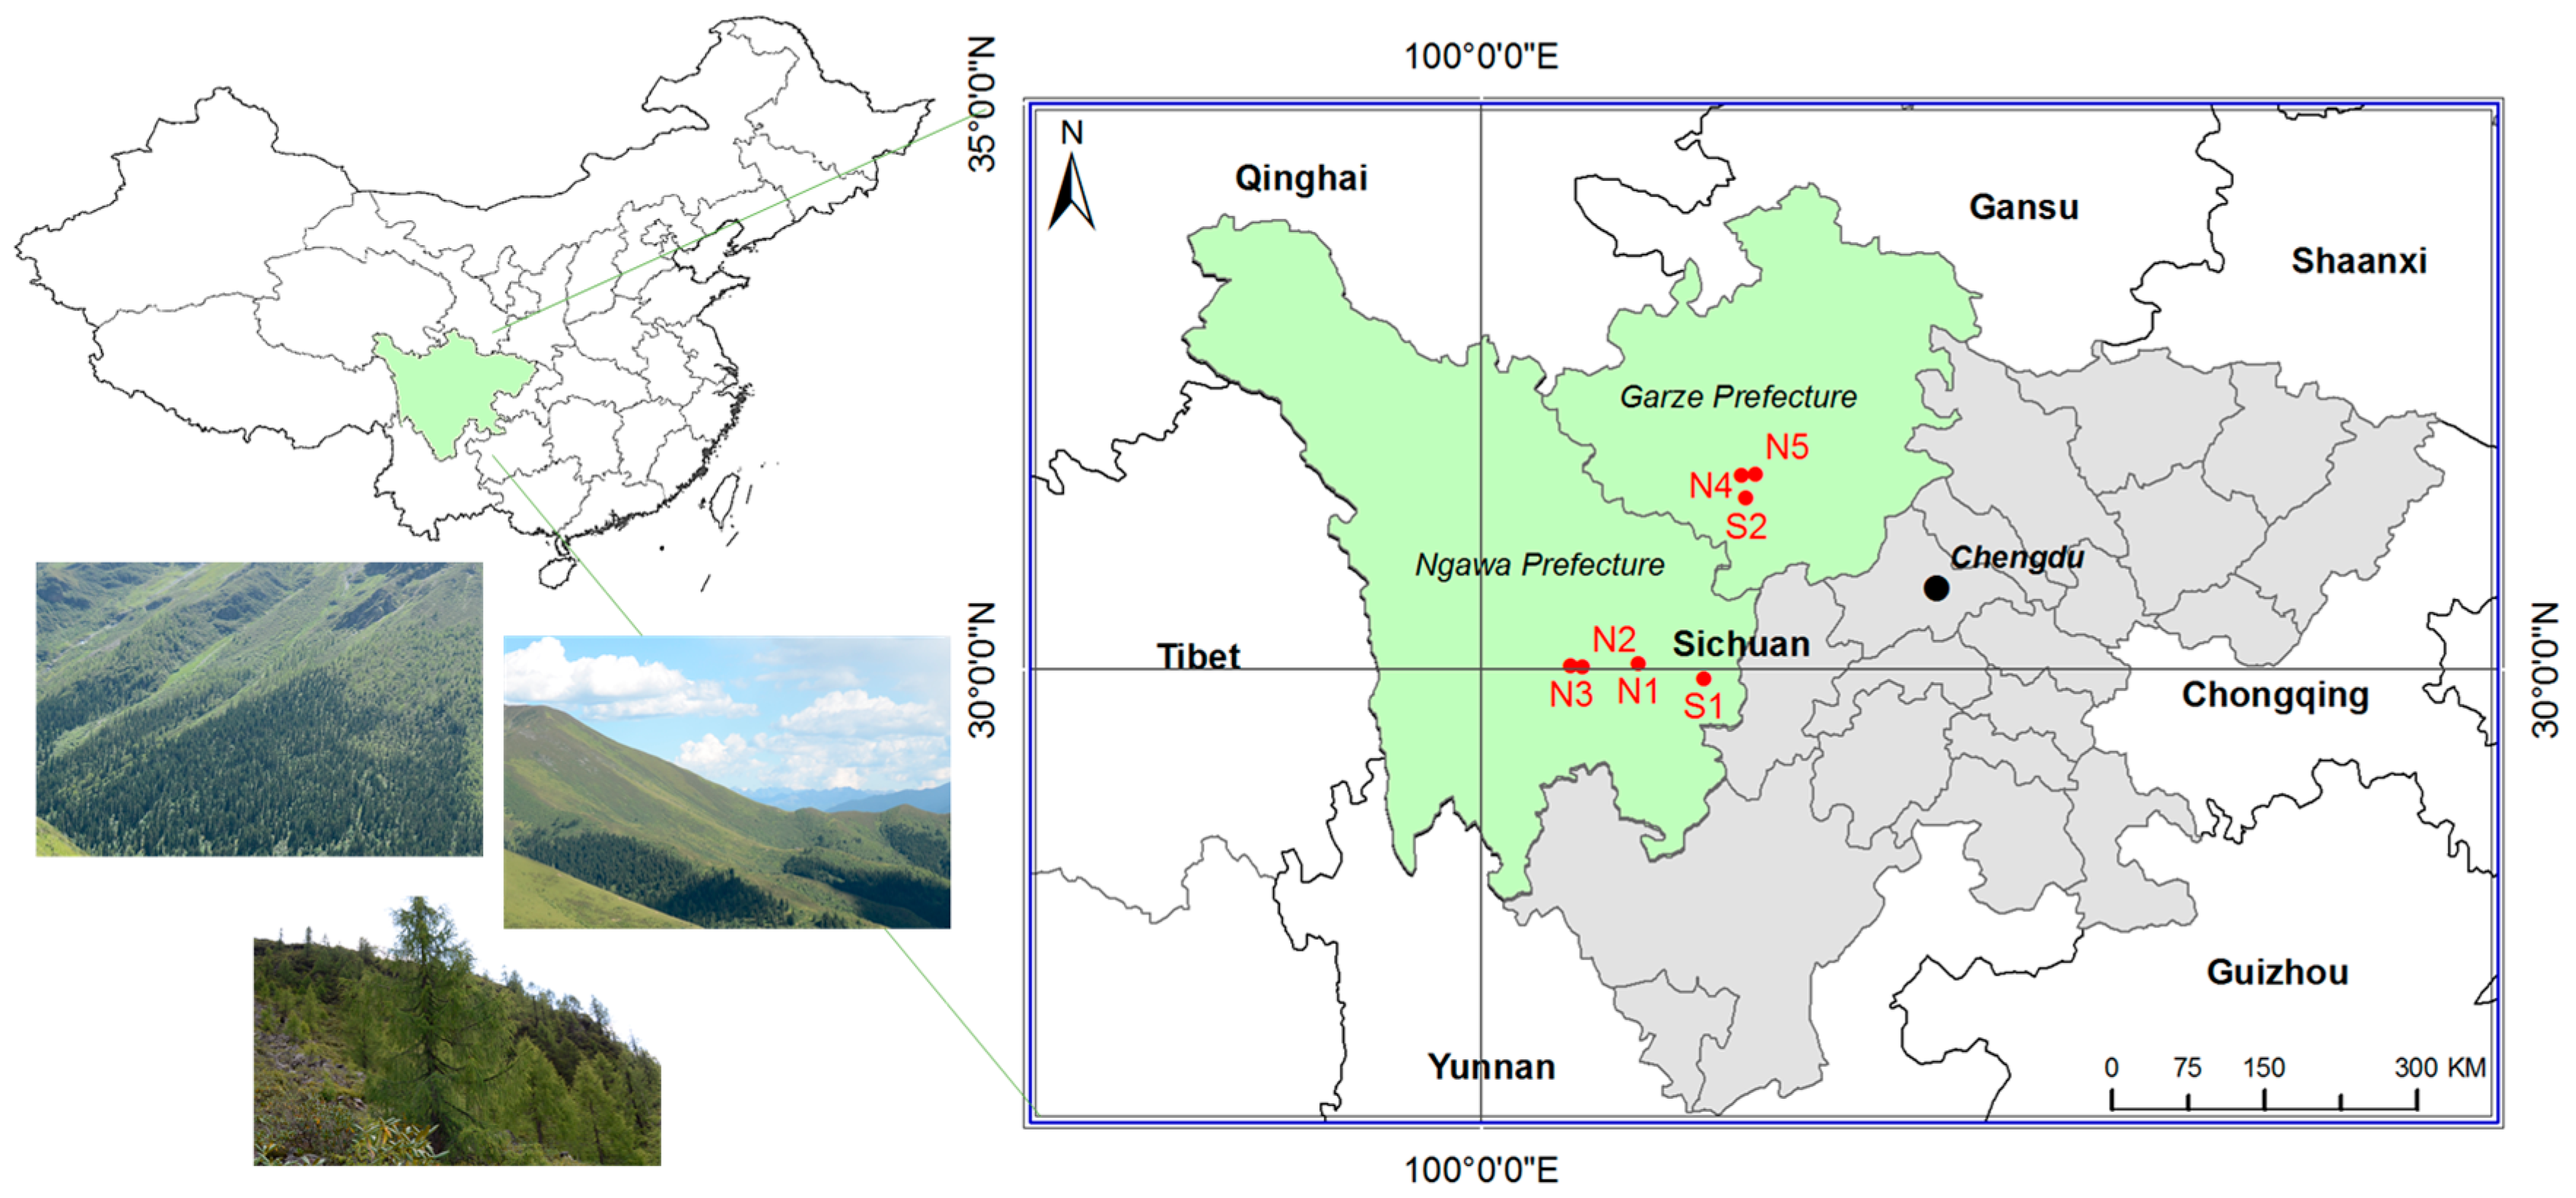
The study was carried out in the alpine natural forest in Sichuan Province, China, which is on the eastern margin of the Tibetan Plateau (101°40′–102°50′ E, 29°50′–30°50′ N) (
Figure 1). At the treeline ecotone, the soil is brown coniferous forest soil with an average pH value of 4.9. Along the altitudinal gradient, the floristic composition of the treeline ecotone here is co-dominated by
Larix potaninii var.
macrocarpa,
Abies forrestii, and
A. squamata, whereas, from 3800 to 4000 m a.s.l., pure forest of
Larix is prevalent.
Larix belongs to the genus
Larix within family Pinaceae, and is a prominent component of subalpine forests [
35]. In addition, the forest understory is dominated by shrubs like
Sorbus rehderiana,
Ribes tenue,
Lonicera szechuanica, and
Acanthopanax giraldii. No grasses for yak grazing exist. Thus, the
Larix treeline in Western Sichuan Province is highly representative of natural treelines on the eastern margin of the TP.
Field investigation was conducted in from August to November 2015. Altogether, seven sites were selected in the alpine treeline ecotone in the Ngawa Tibetan and Qiang Autonomous Prefecture and the Garzê Tibetan Autonomous Prefecture, respectively (
Figure 1,
Table 1): five sites on north-facing slopes (sites N1, N2, N3, N4, N5) and two on south-facing slopes (sites S1, S2). All of the sites had continuous forest distribution and had not been disturbed by humans or animals. At each site, rectangular plots with three or four replicates were established on a topographically uniform area. For each site, the point (x, y) = (0, 0) was located at the bottom left corner. The width of the horizontal side (x-axis) ranged from 15 to 40 m and the vertical side (y-axis) of each site was from the forestline to the tree species limit to cover the entire treeline ecotone.
2.2. Climate Data
The eastern margin of the TP is characterized by a semi-humid climate with wet summers and dry winters, with most precipitation falling between June and September [
14,
31]. Five nearby meteorological stations from samplings sites are mainly located in the regional county (
Table A1), and Kangding station stopped recording the data in 1982. Thus, the data from these meteorological station are not precise enough for our high-elevation mountain studies [
2,
18]. To give an overview of the recent climate trend in the seven sampling sites, we presented gridded monthly temperature and precipitation data (Climate Research Unit (CRU) 3.23 at 0.5° spatial resolutions,
http://www.cru.uea.ac.uk/data/) [
2,
36]. As the sampling sites N2 and N3, N4 and N5 were quite near to each other (the distance between N2 and N3, N4 and N5 was 1.7 km and 3.3 km, respectively), we used the same climate data for each of them. In total, five series of climate data were collected. The correlation between climate data from the CRU and regional meteorological station during the period of 1971-2014 were statistically significant in our research as well as in other studies (
Table A2) [
37].
According to the CRU climate data during the period of 1971–2014 [
36], the mean annual temperature of this study area was about 6.2 °C, with a seven-month cold season (from the previous October to the present April, in which the monthly average temperature is below 10 °C). January (mean temperature of −2.7 °C) and July (13.5 °C) were the coldest and warmest months, respectively. The annual total precipitation was 731 mm; January (1.3 mm) and August (226.5 mm) were the two months with the least and most monthly average precipitation, respectively.
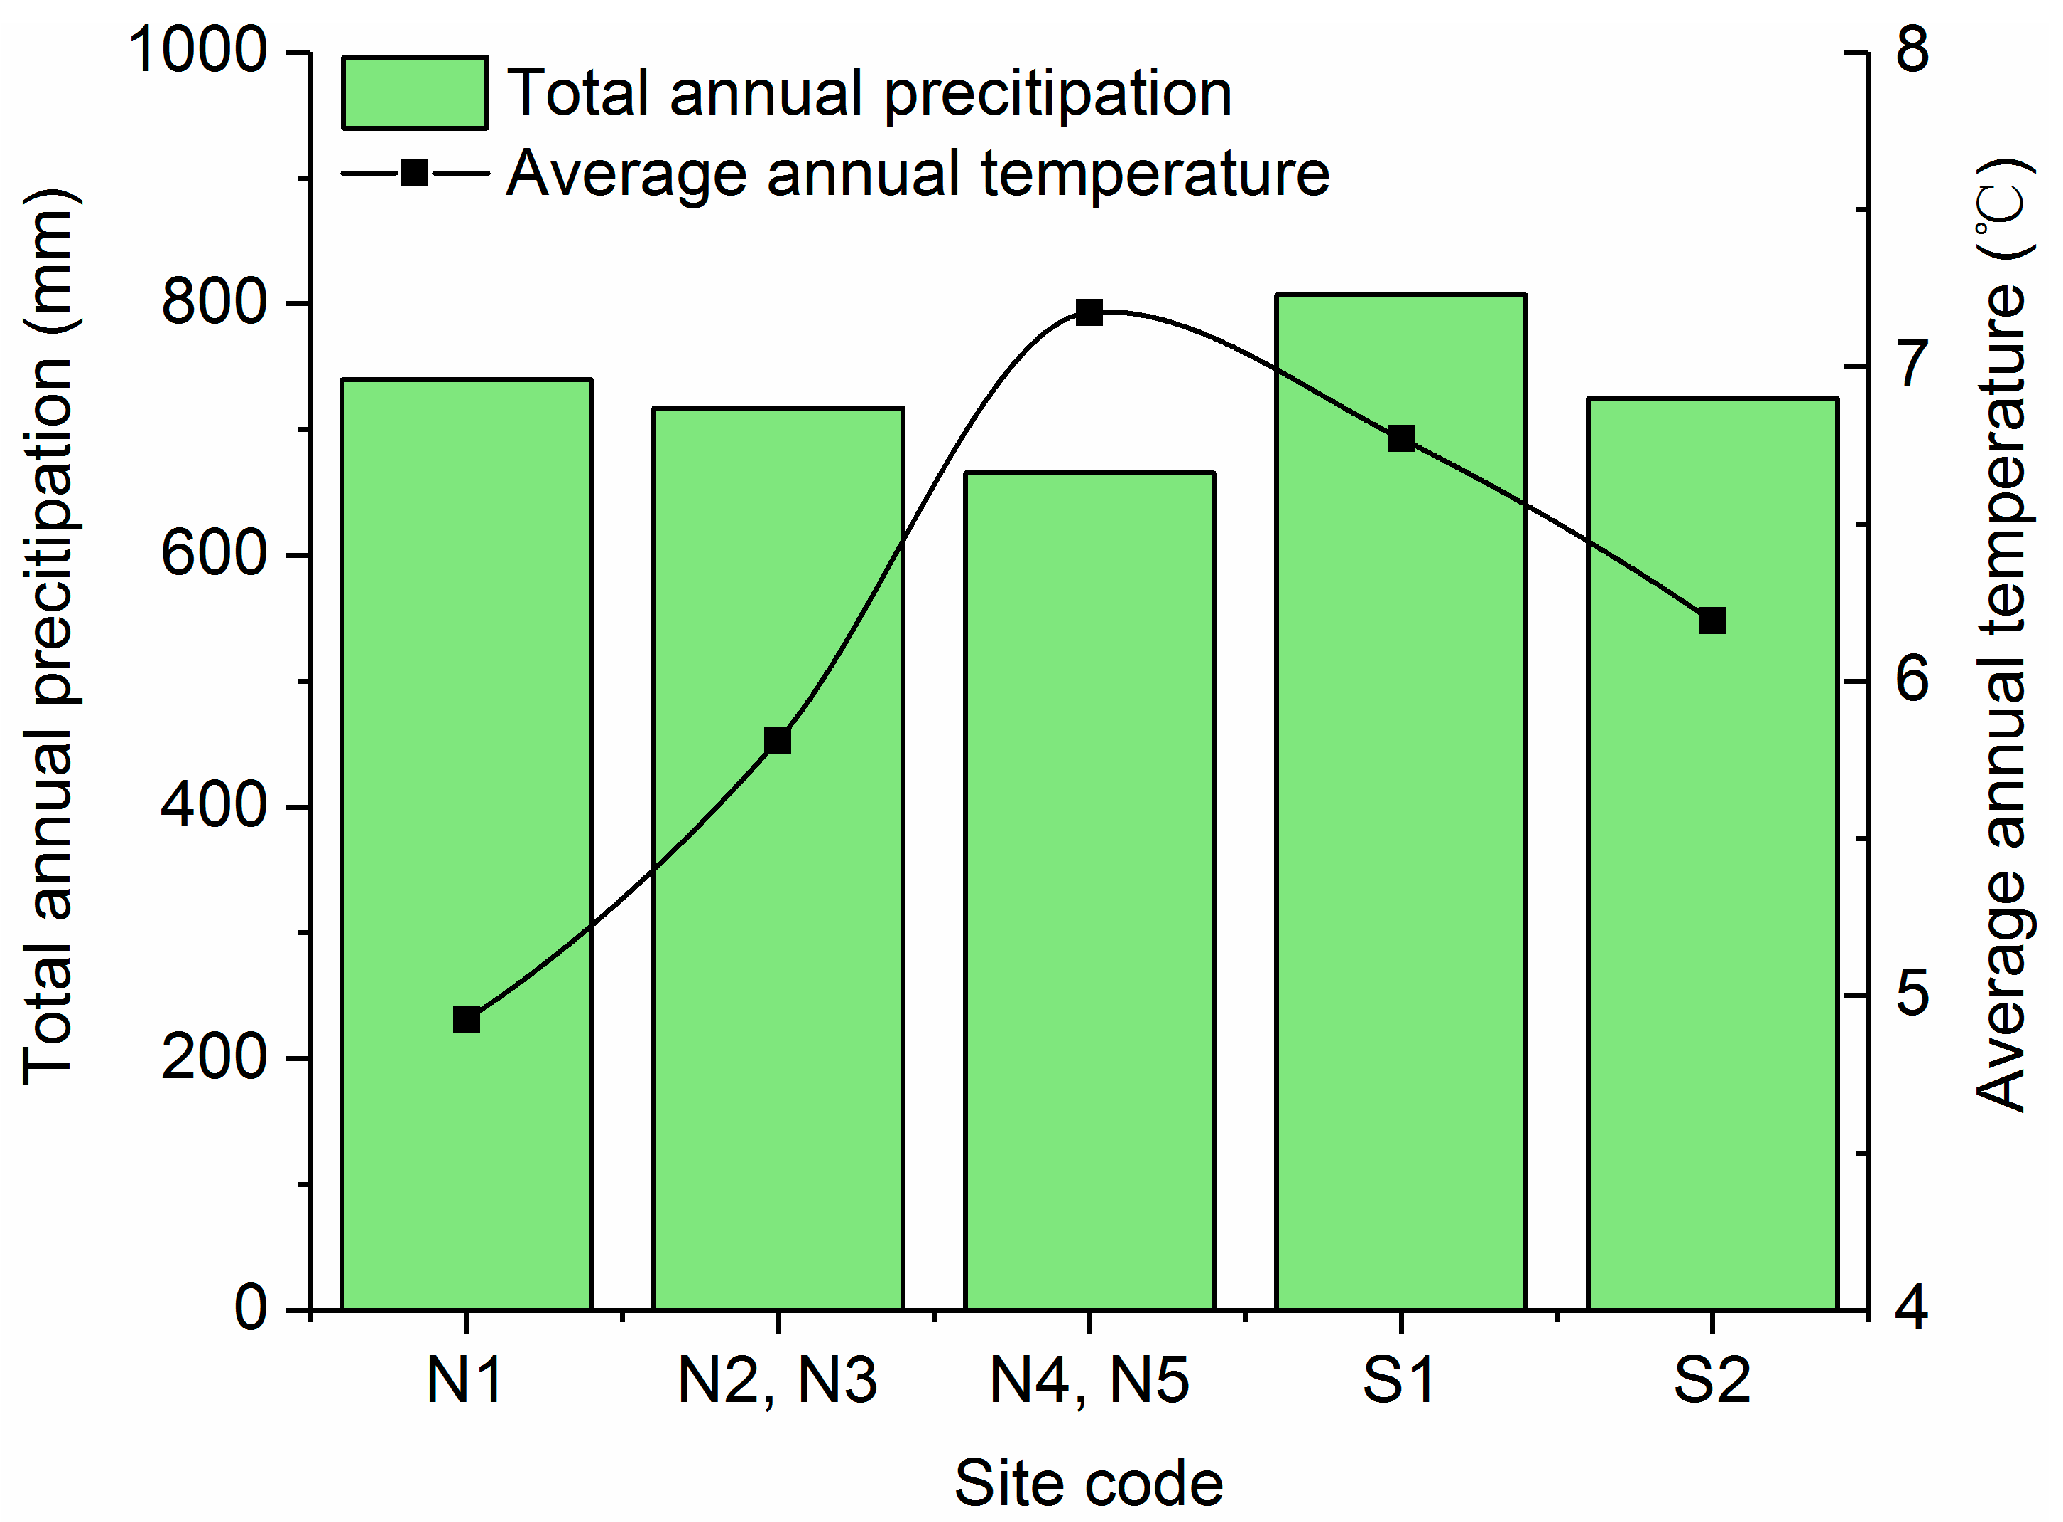
Sites N4 and N5 receive the highest annual average temperature (7.2 °C) with the lowest annual rainfall (666 mm) (
Figure 2). Site S1 receives the highest annual rainfall (807 mm) with an annual average temperature of 6.8 °C. As shown in
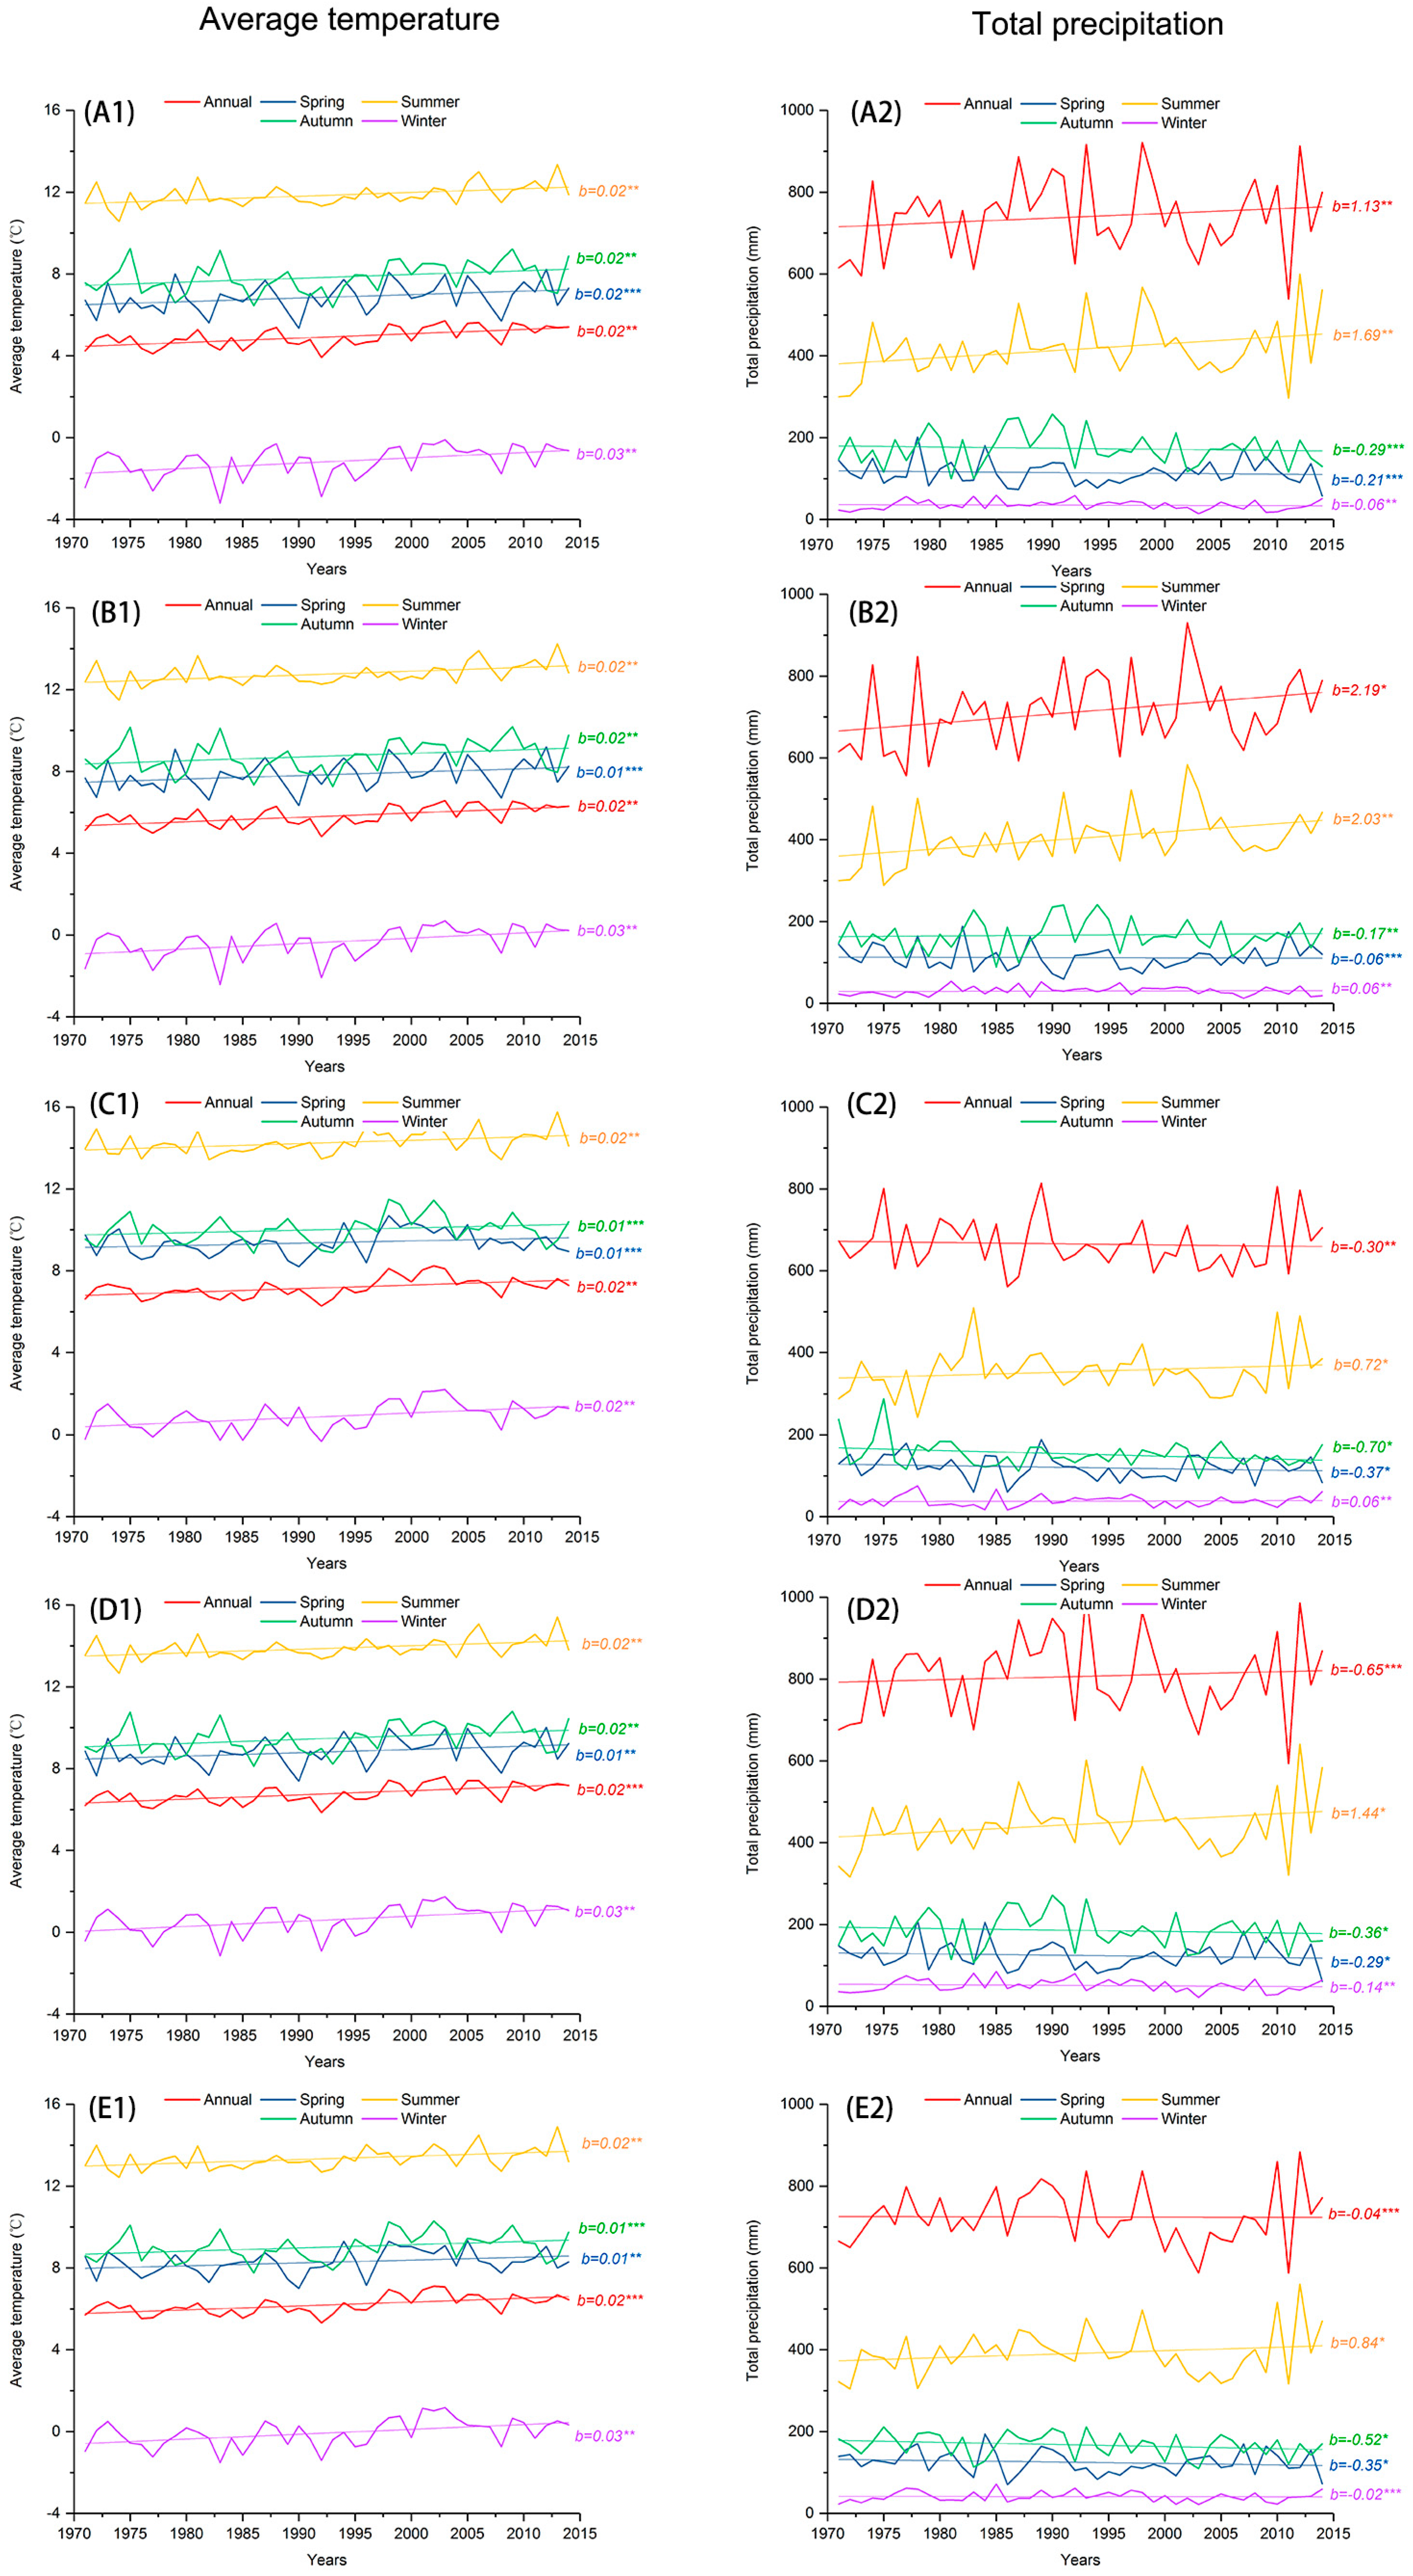
Figure 3, in each site the gridded average annual temperature shows a significant increasing trend since 1990, a trend that is mainly driven by increases in winter temperature (November–March). Average temperature at each site also shows weak increasing trends in spring (April–May), summer (June–August), and autumn (September–October). Total annual precipitation at sites N1, N2, and N3 shows significant increasing trends over time, but showing a slight decreasing trend at sites N4, N5, S1, and S2. Precipitation in summer shows a significant increasing trend in each site.
2.3. Field Investigation and Tree-Age Estimation
In each site, the point (x, y) = (0, 0) in each plot was located with GPS (Trimble Juno 3, Trimble Inc., Westminster, CO, USA) and all
Larix individuals were located by recording the relative coordination to the (0, 0) corner. All trees (height
2 m), saplings (height 0.5–2 m), and seedlings (height
0.5 m) [
18,
38] were sampled for height and diameter at breast height (DBH, 1.3 m). For those too young to measure DBH, diameters at base (about 5 cm from ground) were measured instead [
11]. In total, 195
Larix individuals in seven sites were measured. Other information such as the crown width of
Larix individuals and the living conditions of plant communities were also recorded.
In order to construct the age structure of
Larix individuals, several approaches were applied, including the dendrochronological procedure. At each site, tree-ring cores (for most trees) perpendicular to the slope line were extracted at DBH with an increment borer, ensuring that each core reached the pith of the tree [
39,
40]. Cores of poor quality or which could not be cross-dated were discarded [
30]. Tree cores were prepared for further analyses by following standard dendrochronological procedures [
30,
40,
41,
42]. Cores were mounted, air dried, and polished with progressively finer sandpaper for visual cross-dating [
41]. The age of cored samples was then determined by ring counts using a stereomicroscope [
2]. For the small individuals (seedlings and saplings) from which could not be taken, the ages were determined by counting the number of branch nodes on the main stems [
2,
7]. This method, however, could underestimate the true age [
38], thus an age-height regression method was carried out to determine the time to reach DBH in order to remove any age error. Age-height correlation and regression analyses showed statistically significant relationships between the tree age and the height of
Larix trees (north-facing slopes:
y = 8.48 exp(0.27
x),
R2 = 0.72,
p < 0.01; south-facing slopes:
y = 12.94 exp(0.11
x),
R2 = 0.54,
p < 0.01;
x is for tree age and
y is for height).
Larix takes almost 12 years to reach DBH (coring-height age). Dates of tree establishment were then calculated based on tree age at the time of sampling (August–November 2015) and by adding the appropriate age to the coring-height correction.
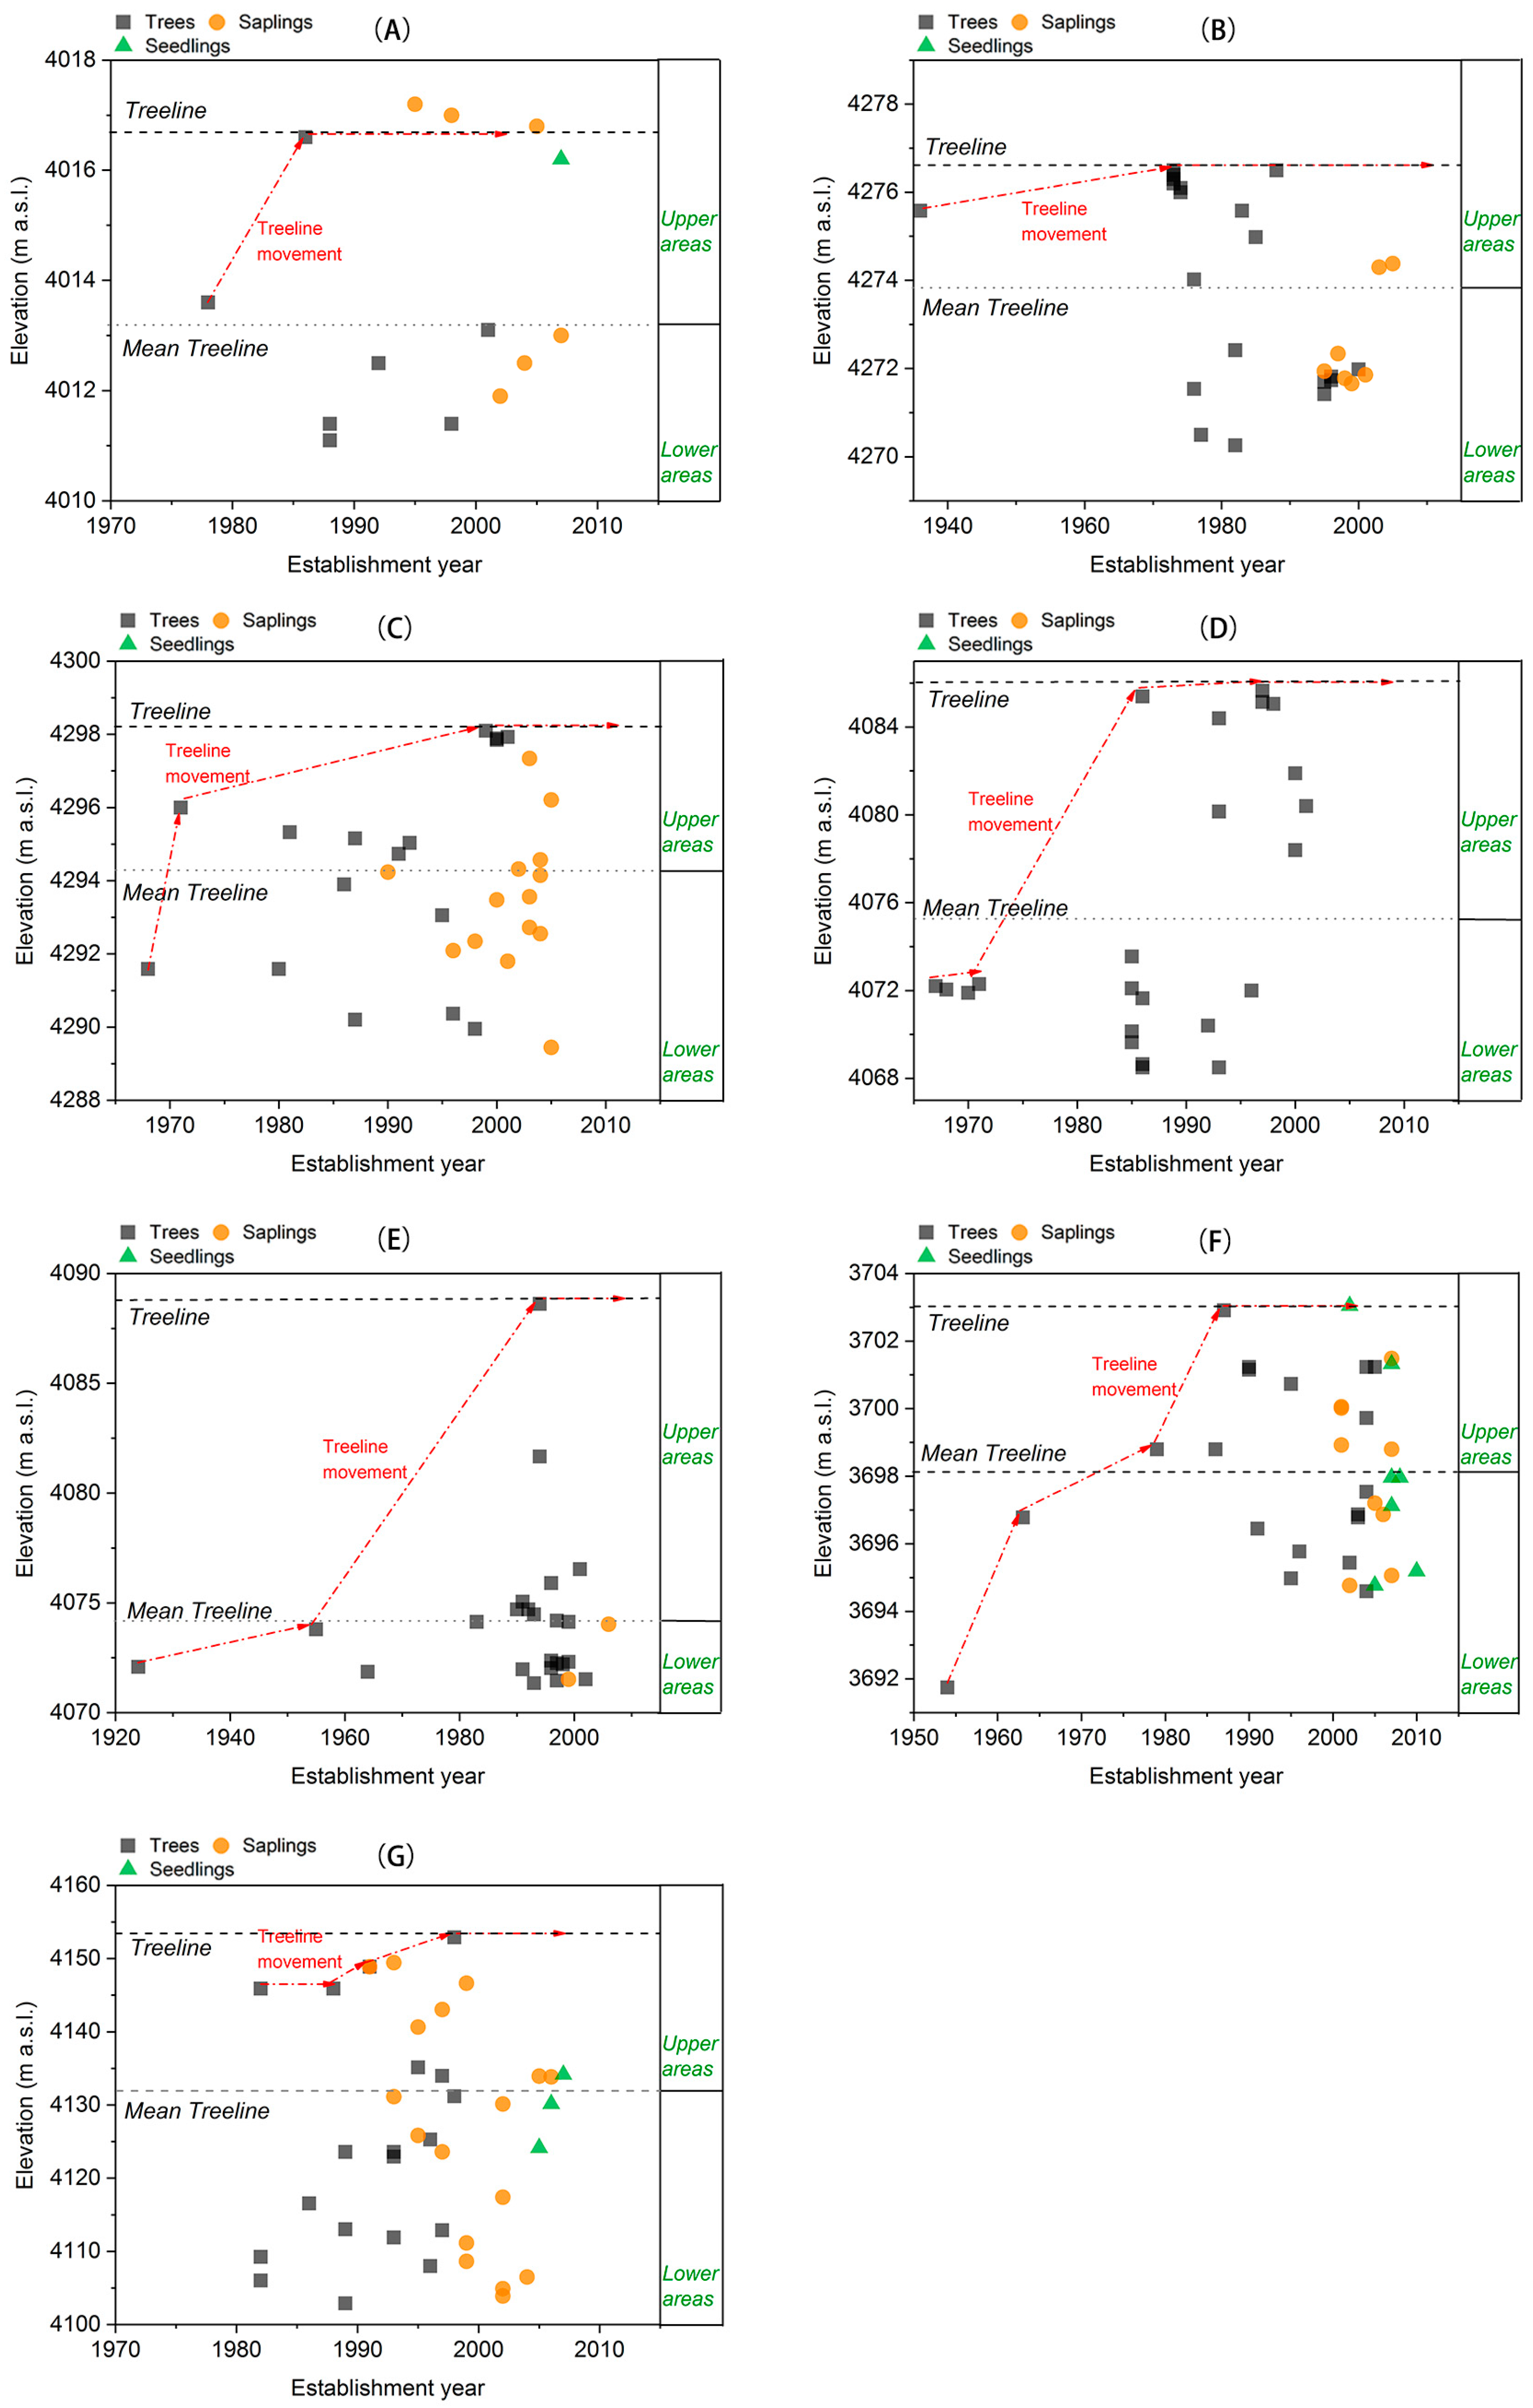
2.4. Treeline Dynamics
The elevation and establishment year of all individuals including trees, saplings, and seedlings within the sampling sites were analyzed. The position of treelines in the past and present were identified by the presence of the uppermost upright tree with a minimum height of 2 m [
14]. Treeline dynamics were then evaluated by comparing the elevation of the past treelines with the present one [
2]. In addition, mean treeline was defined as the average elevation of the treeline trees (upright height >2 m) [
18]. Here, the areas below and above the mean treeline in the sampling sites were termed the ‘lower areas’ and ‘upper areas’, respectively.
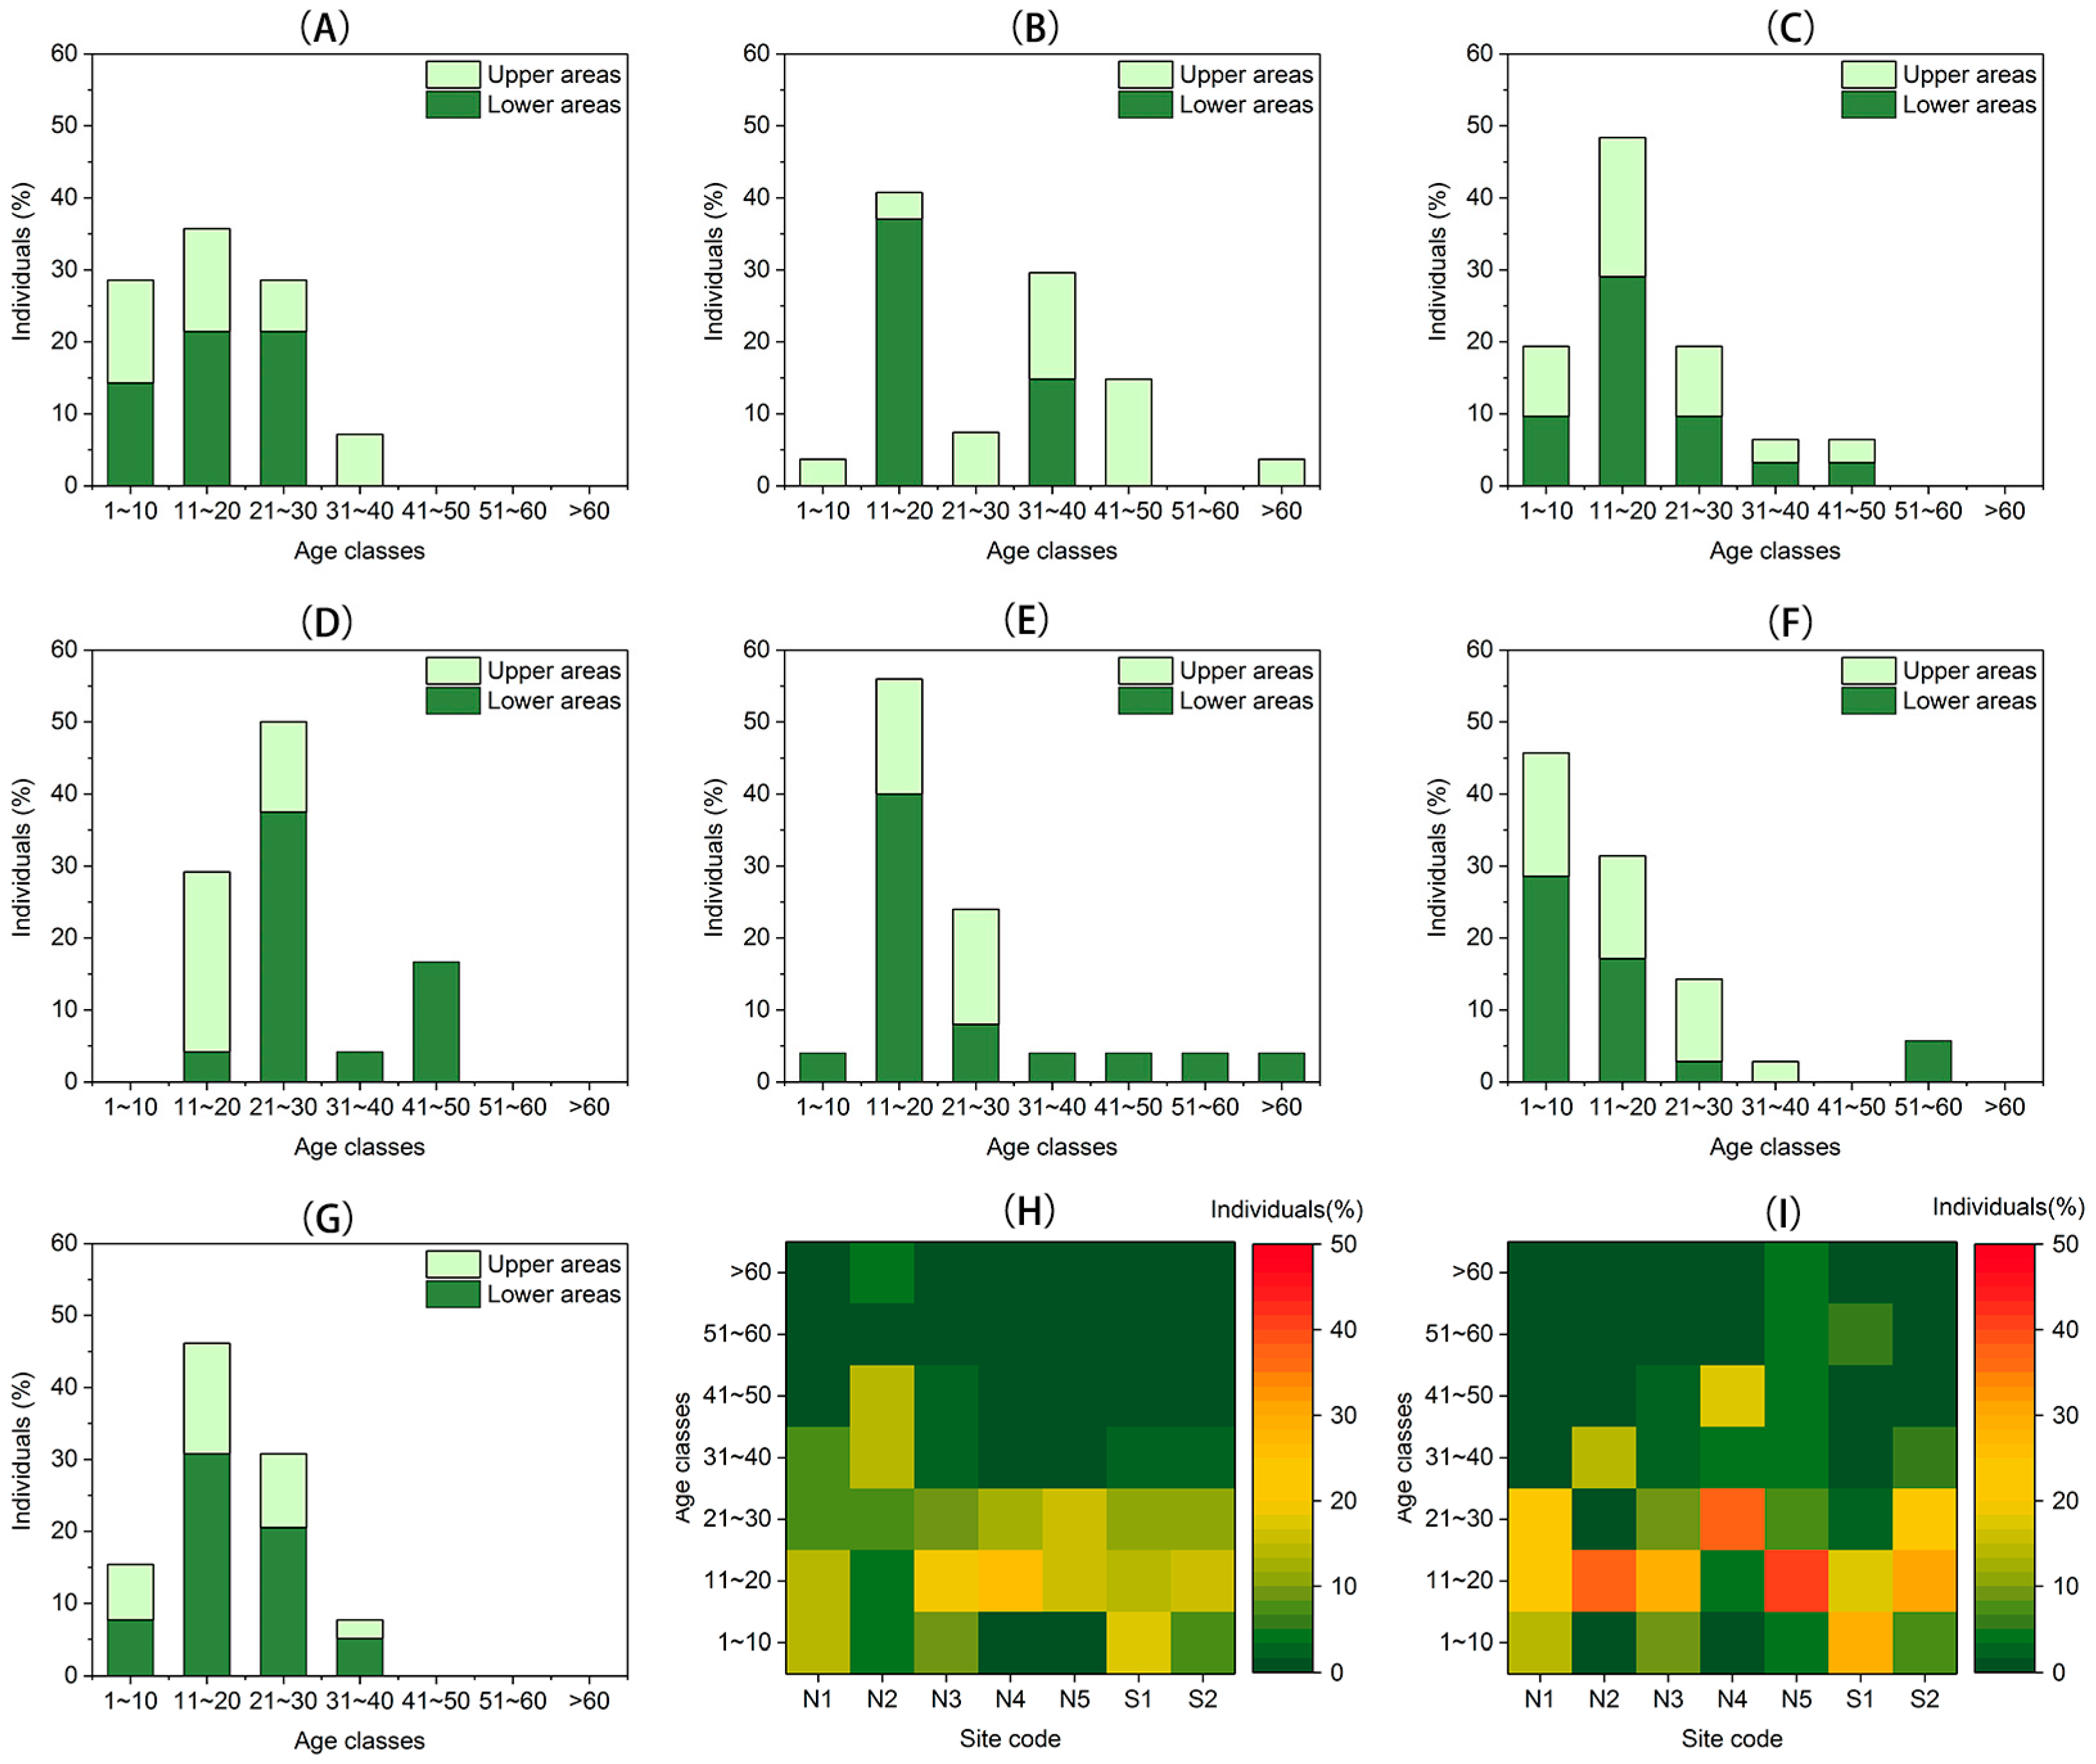
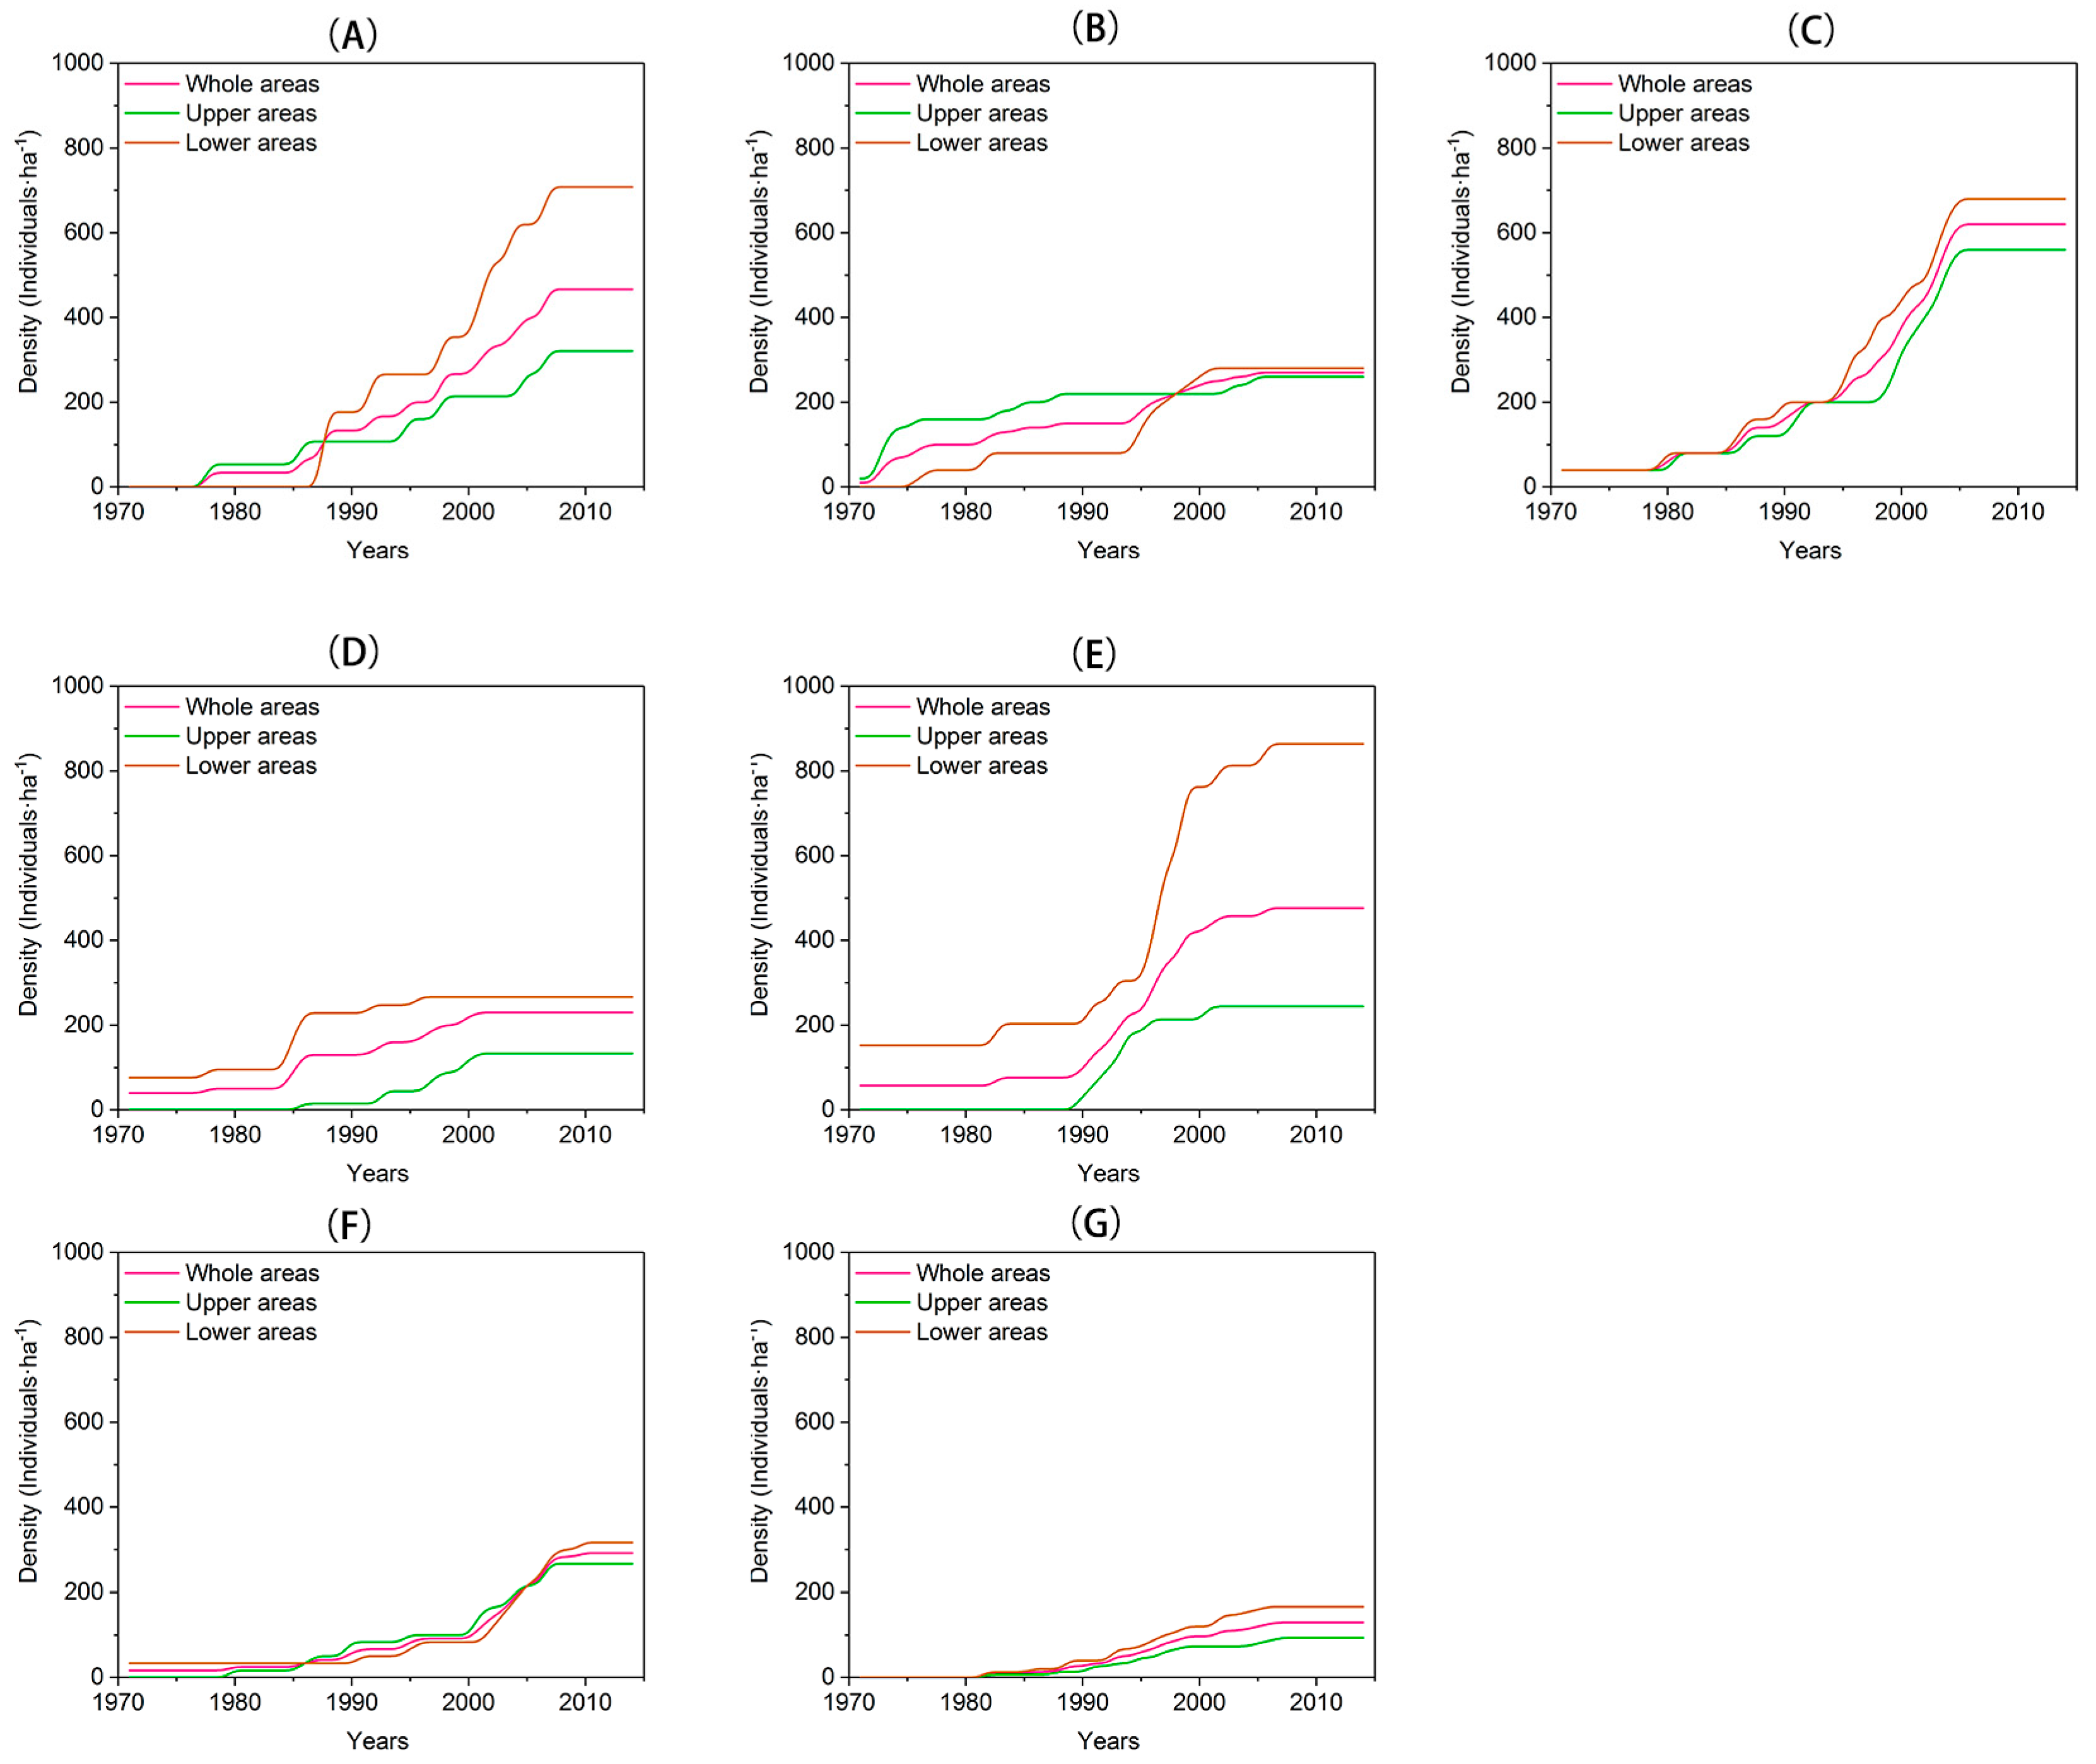
2.5. Recruitment and Density Dynamics
Recruitment and density dynamics of Larix at different elevations (the upper areas; the lower areas) within each site were determined on the timescale from 1971 to 2014. The recruitment dynamics of Larix were reconstructed using the age structure of the community for each site, and the age structure was constructed according to the tree age using 10-year age classes. Stand density was defined as the total numbers of individuals divided by the area (ha−1).
To detect the regeneration-climate relationship and identify the critical factor in influencing tree species’ population dynamics, Pearson correlation analyses were applied on the population density dynamics and monthly meteorological data, using the bivariate correlation functions in SPSS (version 21.0; SPSS Inc., Chicago, IL, USA). These monthly meteorological data included the total monthly precipitation and monthly average temperature from the previous October to the current September during the period of 1971–2014.
2.6. Spatial Distribution Pattern
The spatial distribution pattern could show the history of interactions among individuals [
43]. A spatial distribution pattern is expected to have three types: random, uniform (over-dispersed), and aggregated (clustered) [
44]. The individuals of a species are defined to be at random if the position of each individual plant is independent of that of all the others. Uniform populations are those in which the plants are more evenly spaced than they normally would be due to competition for soil nutrients or shading effects. Aggregated populations are those in which there is a tendency for individuals of the species to occur in clumps [
43]. Each sampling was divided into small sampling plots (1 × 1 m) for further spatial analysis. Spatial patterns of
Larix with different age classes in each sampling site were examined over a 20-year interval on the timescale from 1971 to 2014. Additionally, indices at different elevations (the upper areas; the lower areas) within the sampling site were also compared. The detection of spatial distribution pattern was implemented by using the following quadrat-base indices [
45].
Index of dispersion (DI): Index of dispersion = Variance/mean (), DI 1 for more uniform, DI 1 for random, DI 1 for more aggregated.
Lloyd’s mean crowding (m*): Loyd’s mean crowding ), for more uniform for random, for more aggregated.
Green’s index (Cx): ), Cx 0 for more uniform, Cx 0 for random, Cx 0 for more aggregated.
Clump intensity index (PI) ), PI for more random, PI of a lower value for more aggregated.
5. Conclusions
Treeline ecotone dynamics including treeline position, population density, and tree recruitment of Larix on the south- and north-facing slopes in the alpine treeline ecotone in the eastern margin of the TP were examined. On both south- and north-facing slopes, the treelines did not show a significant advancement in the past four decades. The population was dominated by young individuals, which tend to be established in the lower areas on these two different slopes. Larix, here, also tend to be clustered, especially in the upper areas. However, population density increased dramatically only on north-facing slopes. Larix, here, suffer from a stressful environment, but the warmer winter due to climate warming could facilitate the vertical growth of seedlings and saplings. Aggregated spatial patterns also provide a positive feedback in ameliorating the harsh environment. The slope-climate-moisture interactions have a pronounced impact on tree recruitment. Snow-limited tree establishment on the north-facing slopes and moisture-limited tree establishment on the south-facing slopes underscore the importance of considering both climatic drivers and non-climatic drivers, such as slope exposure effects, to understand the treeline ecotone dynamics.


