Article

How Time since Forest Fire Affects Stand Structure, Soil Physical-Chemical Properties and Soil CO2 Efflux in Hemiboreal Scots Pine Forest Fire Chronosequence?

1
Institute of Forestry and Rural Engineering, Estonian University of Life Sciences, Tartu 51014, Estonia
2
Department of Forest Sciences, University of Helsinki, Helsinki FI-00014, Finland
3
Department of Environmental and Biological Sciences, University of Eastern Finland, Kuopio FI-70211, Finland
*
Author to whom correspondence should be addressed.
Forests 2016, 7(9), 201; https://doi.org/10.3390/f7090201
Submission received: 7 July 2016 / Revised: 31 August 2016 / Accepted: 6 September 2016 / Published: 12 September 2016

Abstract

:
We compared the changes in aboveground biomass and initial recovery of C pools and CO2 efflux following fire disturbances in Scots pine (Pinus sylvesteris L.) stands with different time since stand-replacing fire. The study areas are located in hemiboreal vegetation zone, in north-western Estonia, in Vihterpalu. Six areas where the last fire occurred in the year 1837, 1940, 1951, 1982, 1997, and 2008 were chosen for the study. Our results show that forest fire has a substantial effect on the C content in the top soil layer, but not in the mineral soil layers. Soil respiration showed a chronological response to the time since the forest fire and the values were lowest in the area where the fire was in the year 2008. The respiration values also followed seasonal pattern being highest in August and lowest in May and November. The CO2 effluxes were lowest on the newly burned area through the entire growing season. There was also a positive correlation between soil temperature and soil respiration values in our study areas.

1. Introduction

Disturbances are an important factor influencing forest structure formation, composition and forest functioning [1,2]. Forest fires and the long-term recovery from them are important for regional carbon (C) storage because C lost in fires makes a substantial difference to regional C budgets [3]. Boreal forests are a crucial part of the climate system since they contain about 60% of the C (703 billion tons) bound in global forest biomes [4]. It is expected, that the average temperature increase predicted for the future climate will be most pronounced in the boreal region and the fire frequency, intensity and severity in boreal forests will increase as a result of prolonged drought periods [5].
Wildfires strongly influence boreal forest structure and function as they can cause losses of 15%–35% of the above-ground biomass and 37%–70% of the ground layer due to combustion [6,7]. Since both high severity (stand replacing) and intermediate severity fires are common in Eurasia [4,8], it is important to understand how these ecosystems respond to the different disturbances. In the short term, increases in disturbance will lead to a net release of C and thus contribute to global warming, but the amount of C released is also linked to the age distribution of the forests. Thus, an integrated approach studying C accumulation and energy fluxes (CO2 effluxes) across a fire chronosequence is needed to understand the role of boreal forests in global warming [9].
Soils play a major role in sequestering atmospheric CO2 and in emitting trace gases (e.g., CO2, CH4, and N2O) that are absorbing solar radiation and enhance the global warming [10]. About half of the C, which enters the ecosystem through photosynthesis, is allocated belowground [11,12]. The turnover of soil organic matter (SOM) in boreal region is slow, with a turnover time of several decades [13]. During the fire, SOM, mostly C, is released from the forest biomass rapidly to the atmosphere through combustion and simultaneously, mineralized nitrogen (N) is released in the soil favoring the re-establishment of vegetation during the first years of succession [14]. Fires directly affect the C cycle via CO2 emissions from biomass combustion and indirectly via long-term changes in ecosystem C dynamics through forest recovery and succession [15].
In this study, we characterize the responses of soil CO2 efflux and soil C content to a forest fire. The changes occurring in the soil C dynamics were assessed along a fire chronosequence in hemiboreal Scots pine (Pinus sylvestris L.) stands of similar soil type and climatic conditions. We hypothesized that the changes in post-fire ecosystems affect C content and CO2 emissions from forest soils across a fire chronosequence. One of the aims of this study was also to investigate the changes in post-fire soil temperatures and soil moisture content and how these factors are affecting the soil CO2 emissions. We assumed that the recovery of C stocks in soil and CO2 emissions is associated with the recovery of aboveground plant biomass. We expect that our chronosequence study approach will bring new quantitative information on changes in soil C dynamics after forest fires and during the forest succession in the hemiboreal forest zone, which may be useful for global C-cycle modelers.

2. Materials and Methods

2.1. Study Sites

The study area (fire chronosequence) is located in hemiboreal vegetation zone, in north-western Estonia, in Vihterpalu and Nõva [2]. The area is flat with no elevation differences and covered with pure Scots pine (Pinus sylvestris L.) stands on sandy soils, regenerated at a different time since forest fires. The areas belong to the Calluna and Vaccinium uliginosum site types (Table 1) [16]. The average annual temperature in the area is +5.2 °C. The coldest month is February, with an average temperature of −5.7 °C, and the warmest month is July, with an average temperature of +16.4 °C [2].
Six areas (with extensive fires 200 ha and more) have been chosen for the study: fire in 1837, 1940, 1951, 1982, 1997, and 2008. All the study areas are located within 145 km2. The total area of the forest fire in 2008 (59°11′ N 23°46′ E) was about 800 ha and it started at the end of May. The forest stands selected for the current study were 70 years old at the time fire occurred [2]. In August 1997 (59°12′ N 23°49′ E) about 700 ha of forest were burned and the forest stands selected for the current study were 45 years old when the fire occurred. The fire in 1982 (59°12′ N 23°48′ E) occurred in May and about 200 ha of forest were burned and the forest stands selected for the study were 30 years old at that time. A huge fire occurred in 1951 (59°14′ N 23°49′ E), when more than 2000 ha of forest were burned, and the forest stands selected for the study were about 35–40 years old at that time. The total area of the forest fire in 1940 (59°10′ N 23°42′ E) was more than 200 ha and a forest fire of similar size occurred in 1837 (although the exact area of the forest fire in 1837 (59°13′ N 23°36′ E) is unknown). All areas had been exposed to stand replacing fires where all (or most) of the stand was destroyed by fire. The time since last fire was first chosen from old inventory data, and later fire occurrence dates were confirmed by taking increment cores at each selected stand. In all areas, three sample plots were established (all together 18 sample plots), that were randomly located in the study areas and the distance between sample plots was at least 100 m. Although the normal practice in Estonia following large-scale disturbances in managed forests is to intervene immediately and clear the stand regardless of whether it will be regenerated naturally or planted [2], we tried to locate our sample plots in areas where the material was not removed after disturbance, thus no management actions (also no planting after disturbance) were carried out.
To characterize the stands, circular sample plots with a radius of 11.28 m (400 m2) were established in all areas of fire chronosequence. Basic tree characteristics were measured for tree biomass calculations (diameter at breast height, tree height, crown length, crown diameter) and for characterizing the stand (stand age, the number of trees per ha, time since last fire) (Table 1). Tree ages were determined from increment cores taken from sample trees and analyzed with WinDENDRO (Regent Instruments Canada Inc., Quebec, Canada). For tree biomass calculations the formulas of Repola [17] and Repola [18] were used. Also, all dead wood (all material longer than 1.3 m and with a diameter of at least 10 cm) was measured in all sample plots for dead wood biomass calculations.
In every sample plot there were two 0.5 × 0.5 m ground vegetation squares for species composition and recovery measurements and two 0.2 × 0.2 squares for ground vegetation biomass measurements. Ground vegetation was classified into mosses, lichens and shrubs/grasses and oven dried at 60 °C until constant mass was reached.

2.2. Soil C Content and CO2 Efflux

The soil was classified as a gleyic podzol [19], with loamy sand. Its profile (O–E–BHF–BCg–Cg) consists of the organic (O) horizon (material in different decomposition stages) (1–15 cm), discontinuous bleached sandy podzolic (E) horizon of varying thickness (2–14 cm), iron-illuvial loamy sand (BHF) horizon with an average thickness of 14 cm and with a gradual transition towards an unevenly colored (from grey to yellowish brown color) sandy parent material.
Soil respiration was measured manually from all sample plots (measuring interval of two weeks). Manual chamber measurements were performed on 5 collars (transect north—south orientated and the distance between collars was 5 m) in each sample plot (all together 90 collars) from May till October, to determine the CO2 efflux from soil to atmosphere with diffusion gradient method [20]. The collars (diameter 0.22 m, height 0.05 m) were placed at 0.02 m depth in the organic soil layer above the rooting zone to avoid damage to roots. The collars were sealed with sand placed around the collars to reduce the air leakage from below the collar. The vegetation inside the chamber was not damaged during the measurements. For CO2 efflux measurements the portable chamber (0.24 m height and 0.22 m in diameter) made of plexiglass and covered with non-transparent plastic was used. All chamber measurements were carried out during the daylight. The CO2 concentration was recorded during a 5 min chamber deployment time with a diffusion type CO2 probe (GMP343, Vaisala Oyj, Vantaa, Finland) and air humidity and temperature inside the chamber with relative humidity and temperature sensor (HM70, Vaisala Oyj, Vantaa, Finland). The CO2 fluxes were calculated based on the change in the CO2 concentration (F) in the chamber headspace in time as follows:
F = Δ ( V c C i ) Δ t
were Vc is the volume of the chamber, Ci is the CO2 concentration inside the chamber and t is the time.
Simultaneously with soil CO2 efflux measurements also soil temperature and soil moisture content (TRIME-PICO 64, IMKO GmbH, Ettlingen, Germany) were measured.
One iButton temperature sensor was placed in each sample plot to register soil temperature changes over the year.
To characterize the soil C and N content 5 soil cores (0.5 m long and 0.05 m in diameter) were taken from each sample plot. The soil cores were divided according to morphological soil horizons to litter and humus layers, mineral layers to eluvial and illuvial horizons, and sieved. All visible roots were separated (bigger roots by sieving the soil through a 2-mm sieve and smaller roots by picking) for root biomass calculations. The roots were identified as tree roots and ground vegetation (mainly dwarf shrubs and grasses) roots and rhizomes based on morphology and color [13]. The soil pH of different horizons was determined with glass electrode in 35 mL soil suspension, consisting of 10 mL of the soil sample and 25 mL of demineralised water, which had been left overnight to stand after mixing. The soil C and N content were determined with an elemental analyzer (vario MAX CN Elementaranalysator, Elementar Analysensysteme GmbH, Hanau, Germany) after oven-drying the samples at 105 °C for 24 h.

2.3. Statistical Analyses

Data was checked for normality using the Shapiro-Wilk test and a logarithmic transformation was made for the recorded CO2 fluxes to approximate the residual distribution of this variable to the normal distribution. Mixed models (PROC MIXED) was used to test the different factor effects behind CO2 fluxes from the soil. CO2 flux was treated as dependent variables in these models, while age since the last fire disturbance was treated as fixed continuous variable, plot as random factor. A Tukey’s HSD test was used for comparison of differences within factors. All calculations and statistical analyses used the plot as the experimental unit and a significance level of p < 0.05. All the statistical analyses were performed with SAS version 9.3 (SAS Institute Inc., Cary, NC, USA).

3. Results

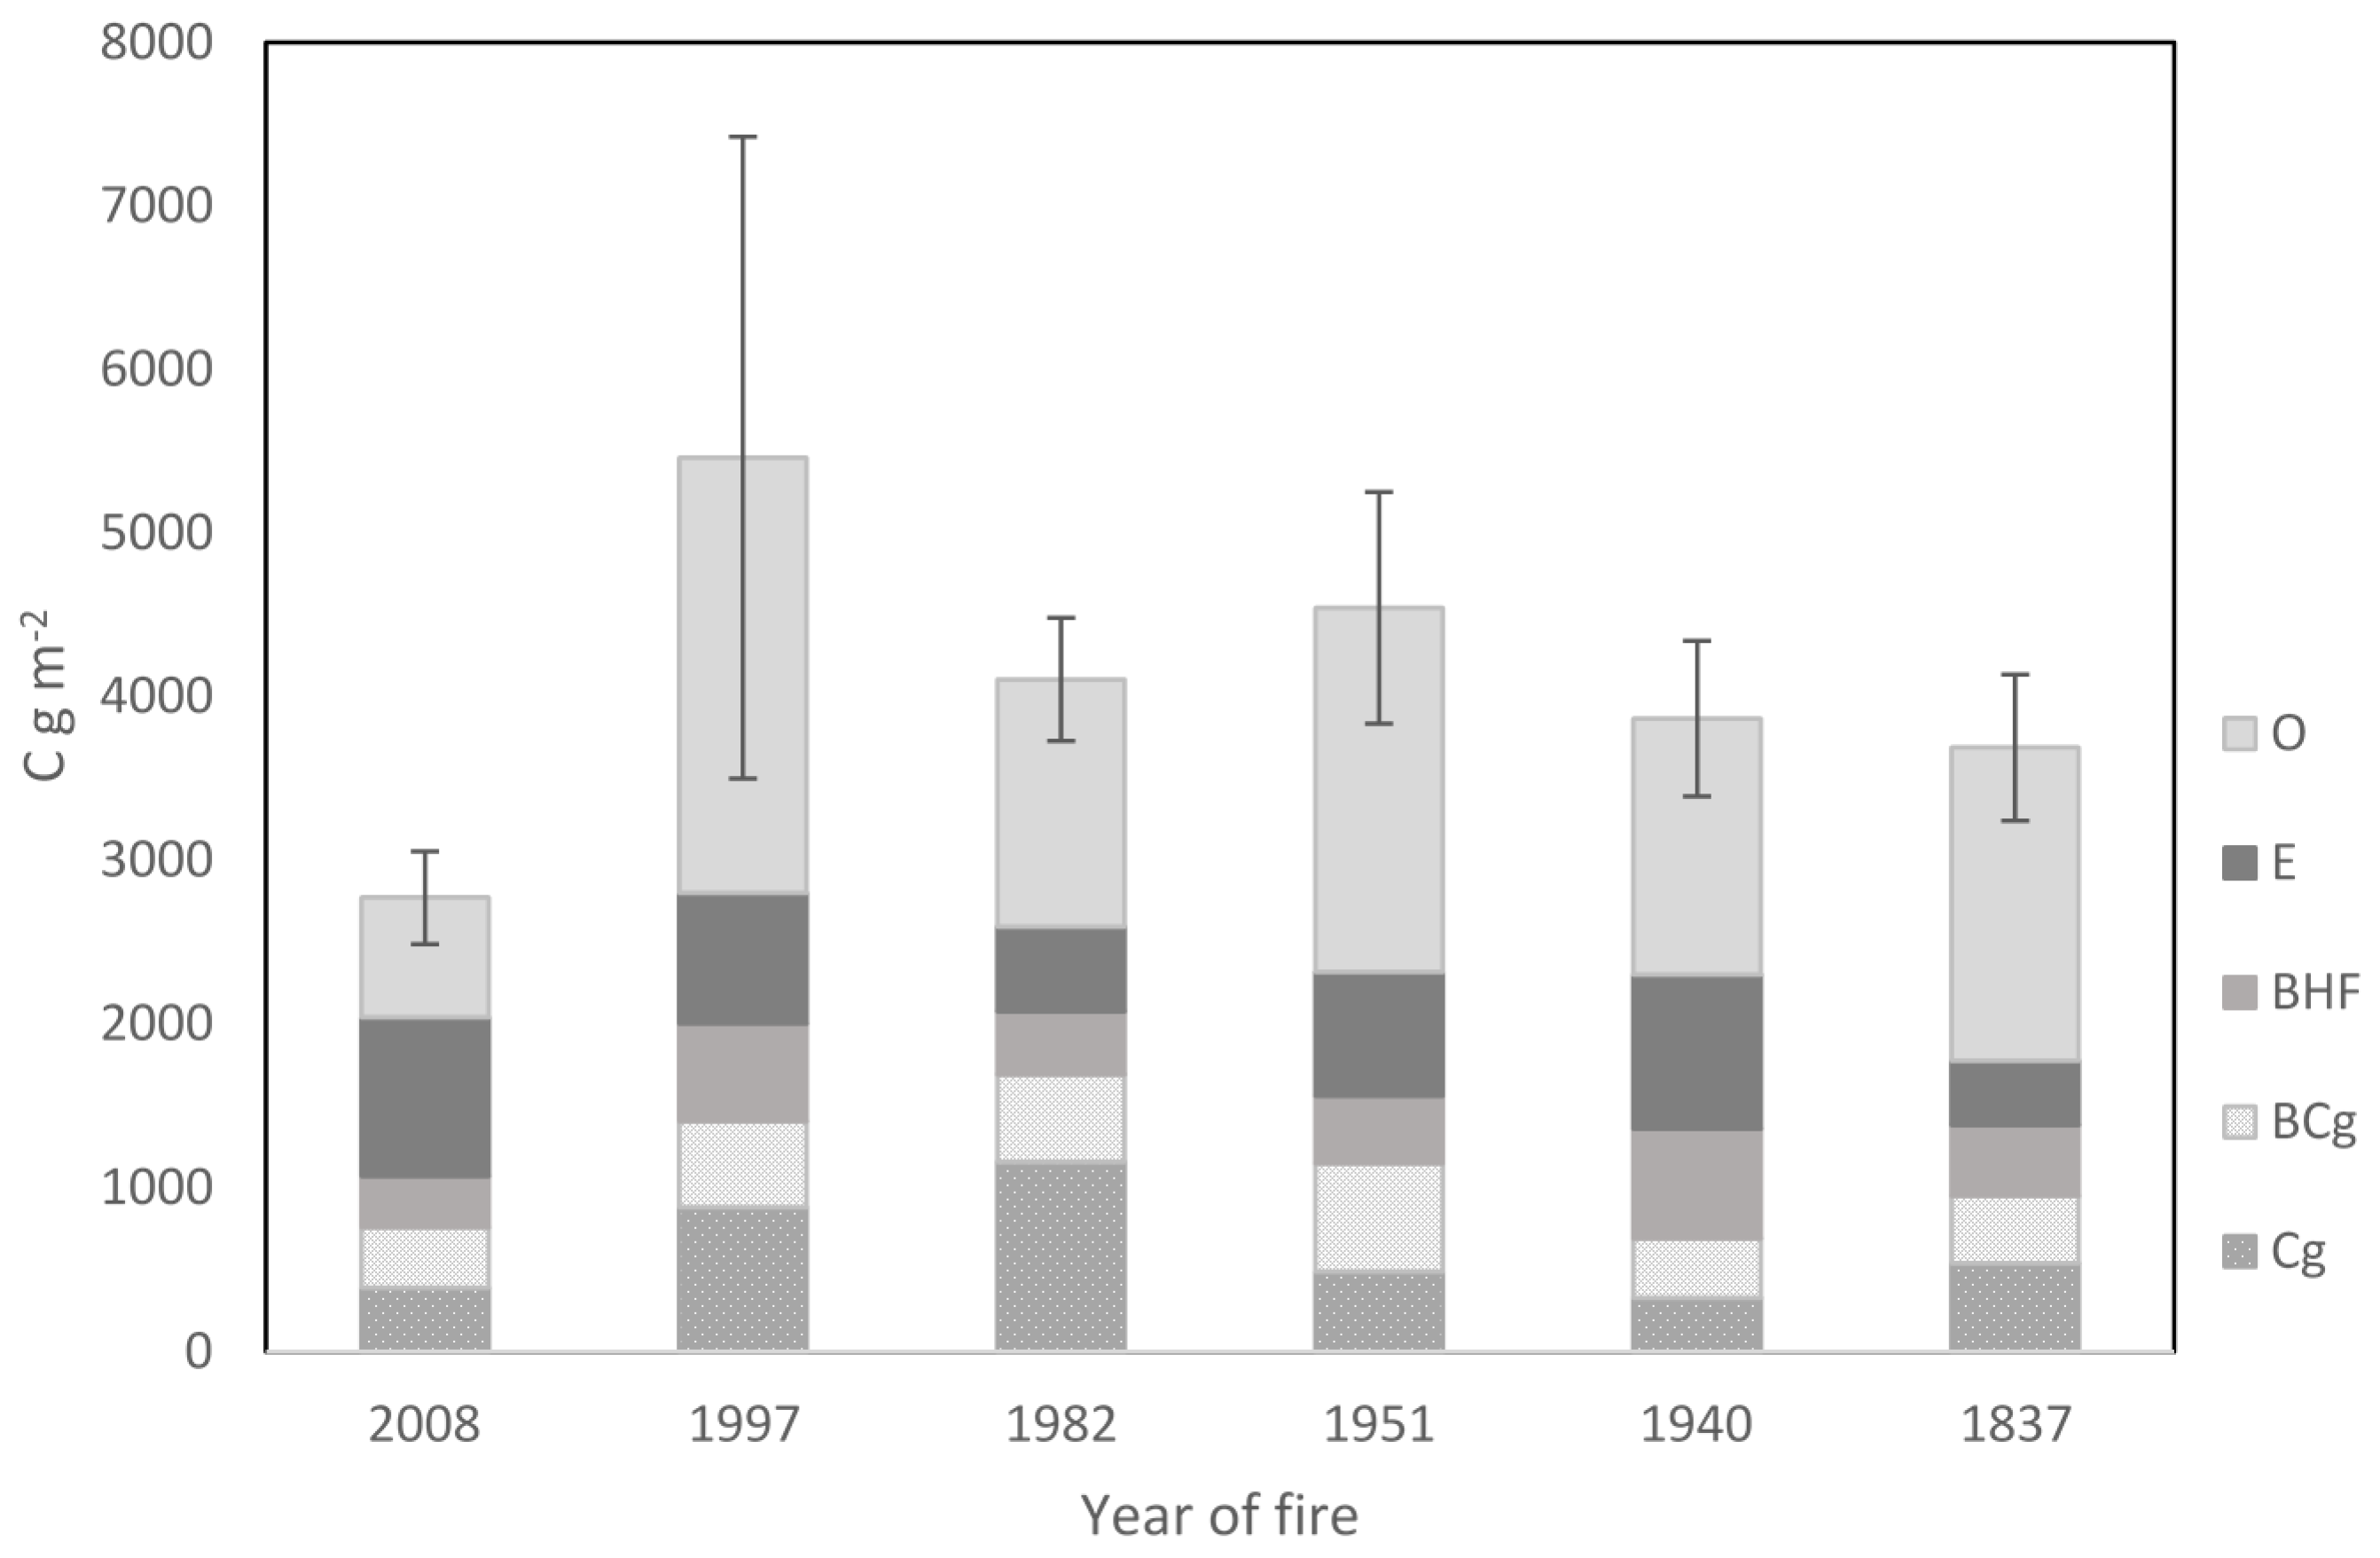
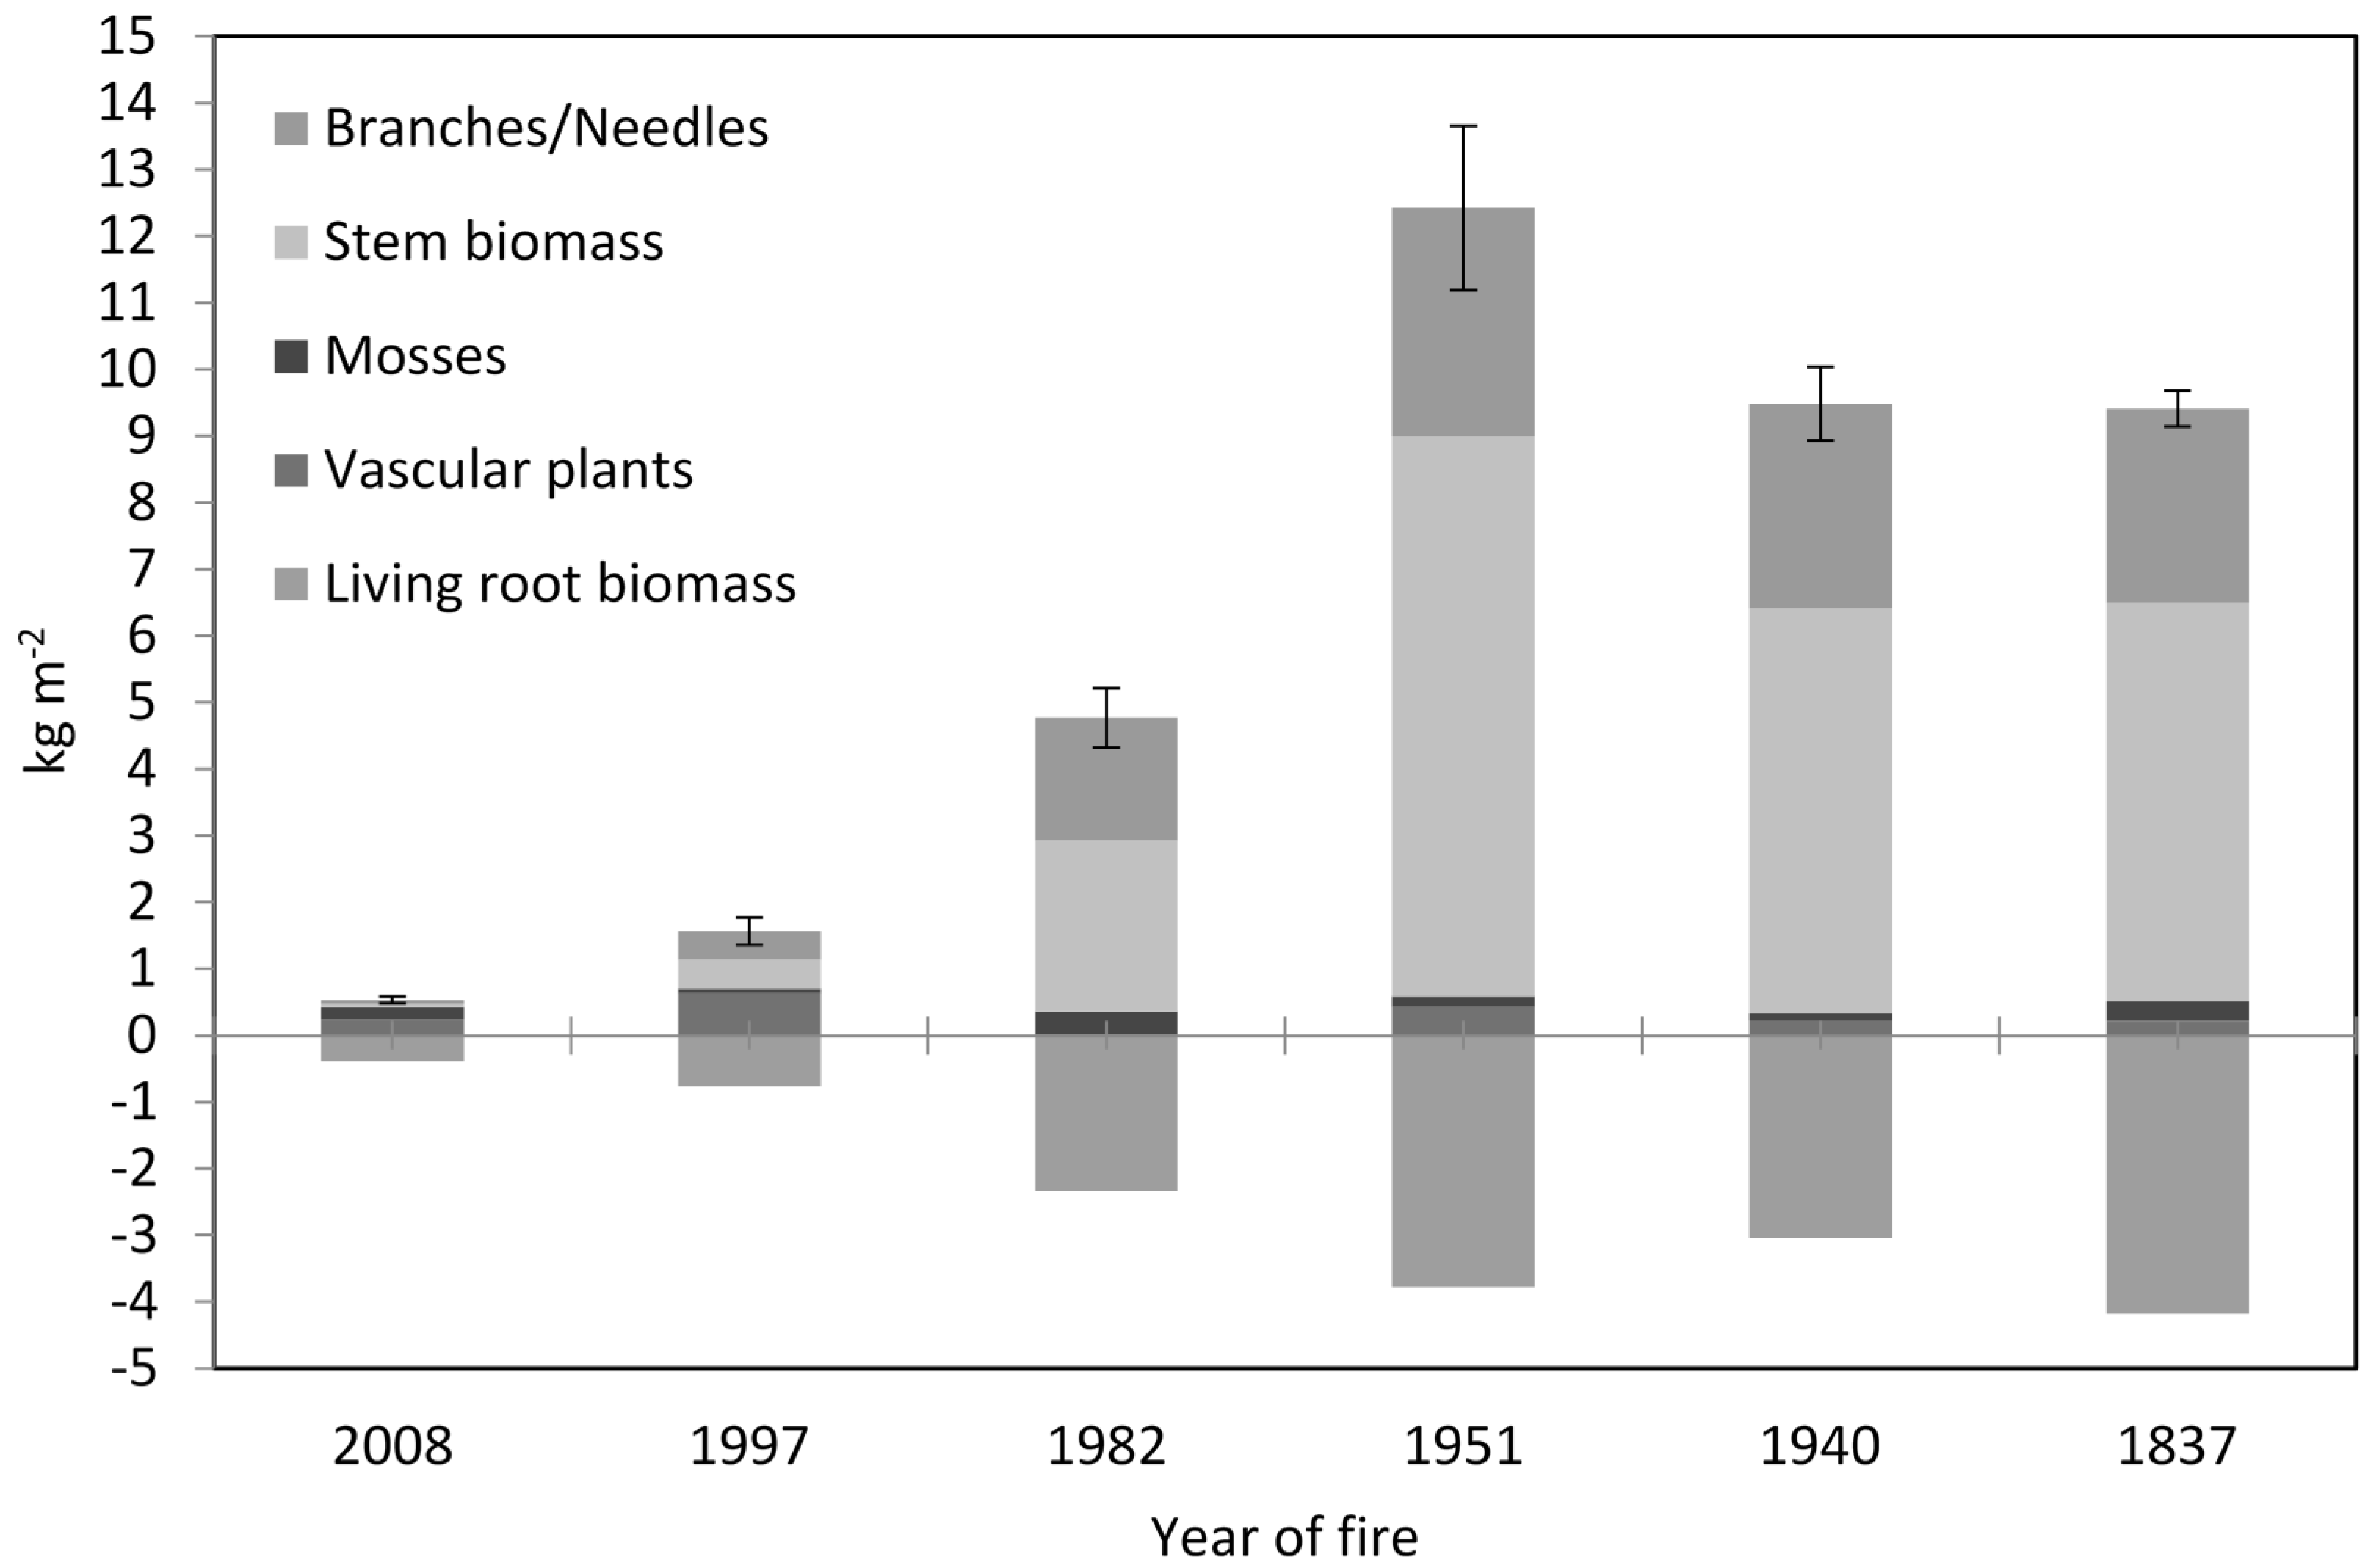
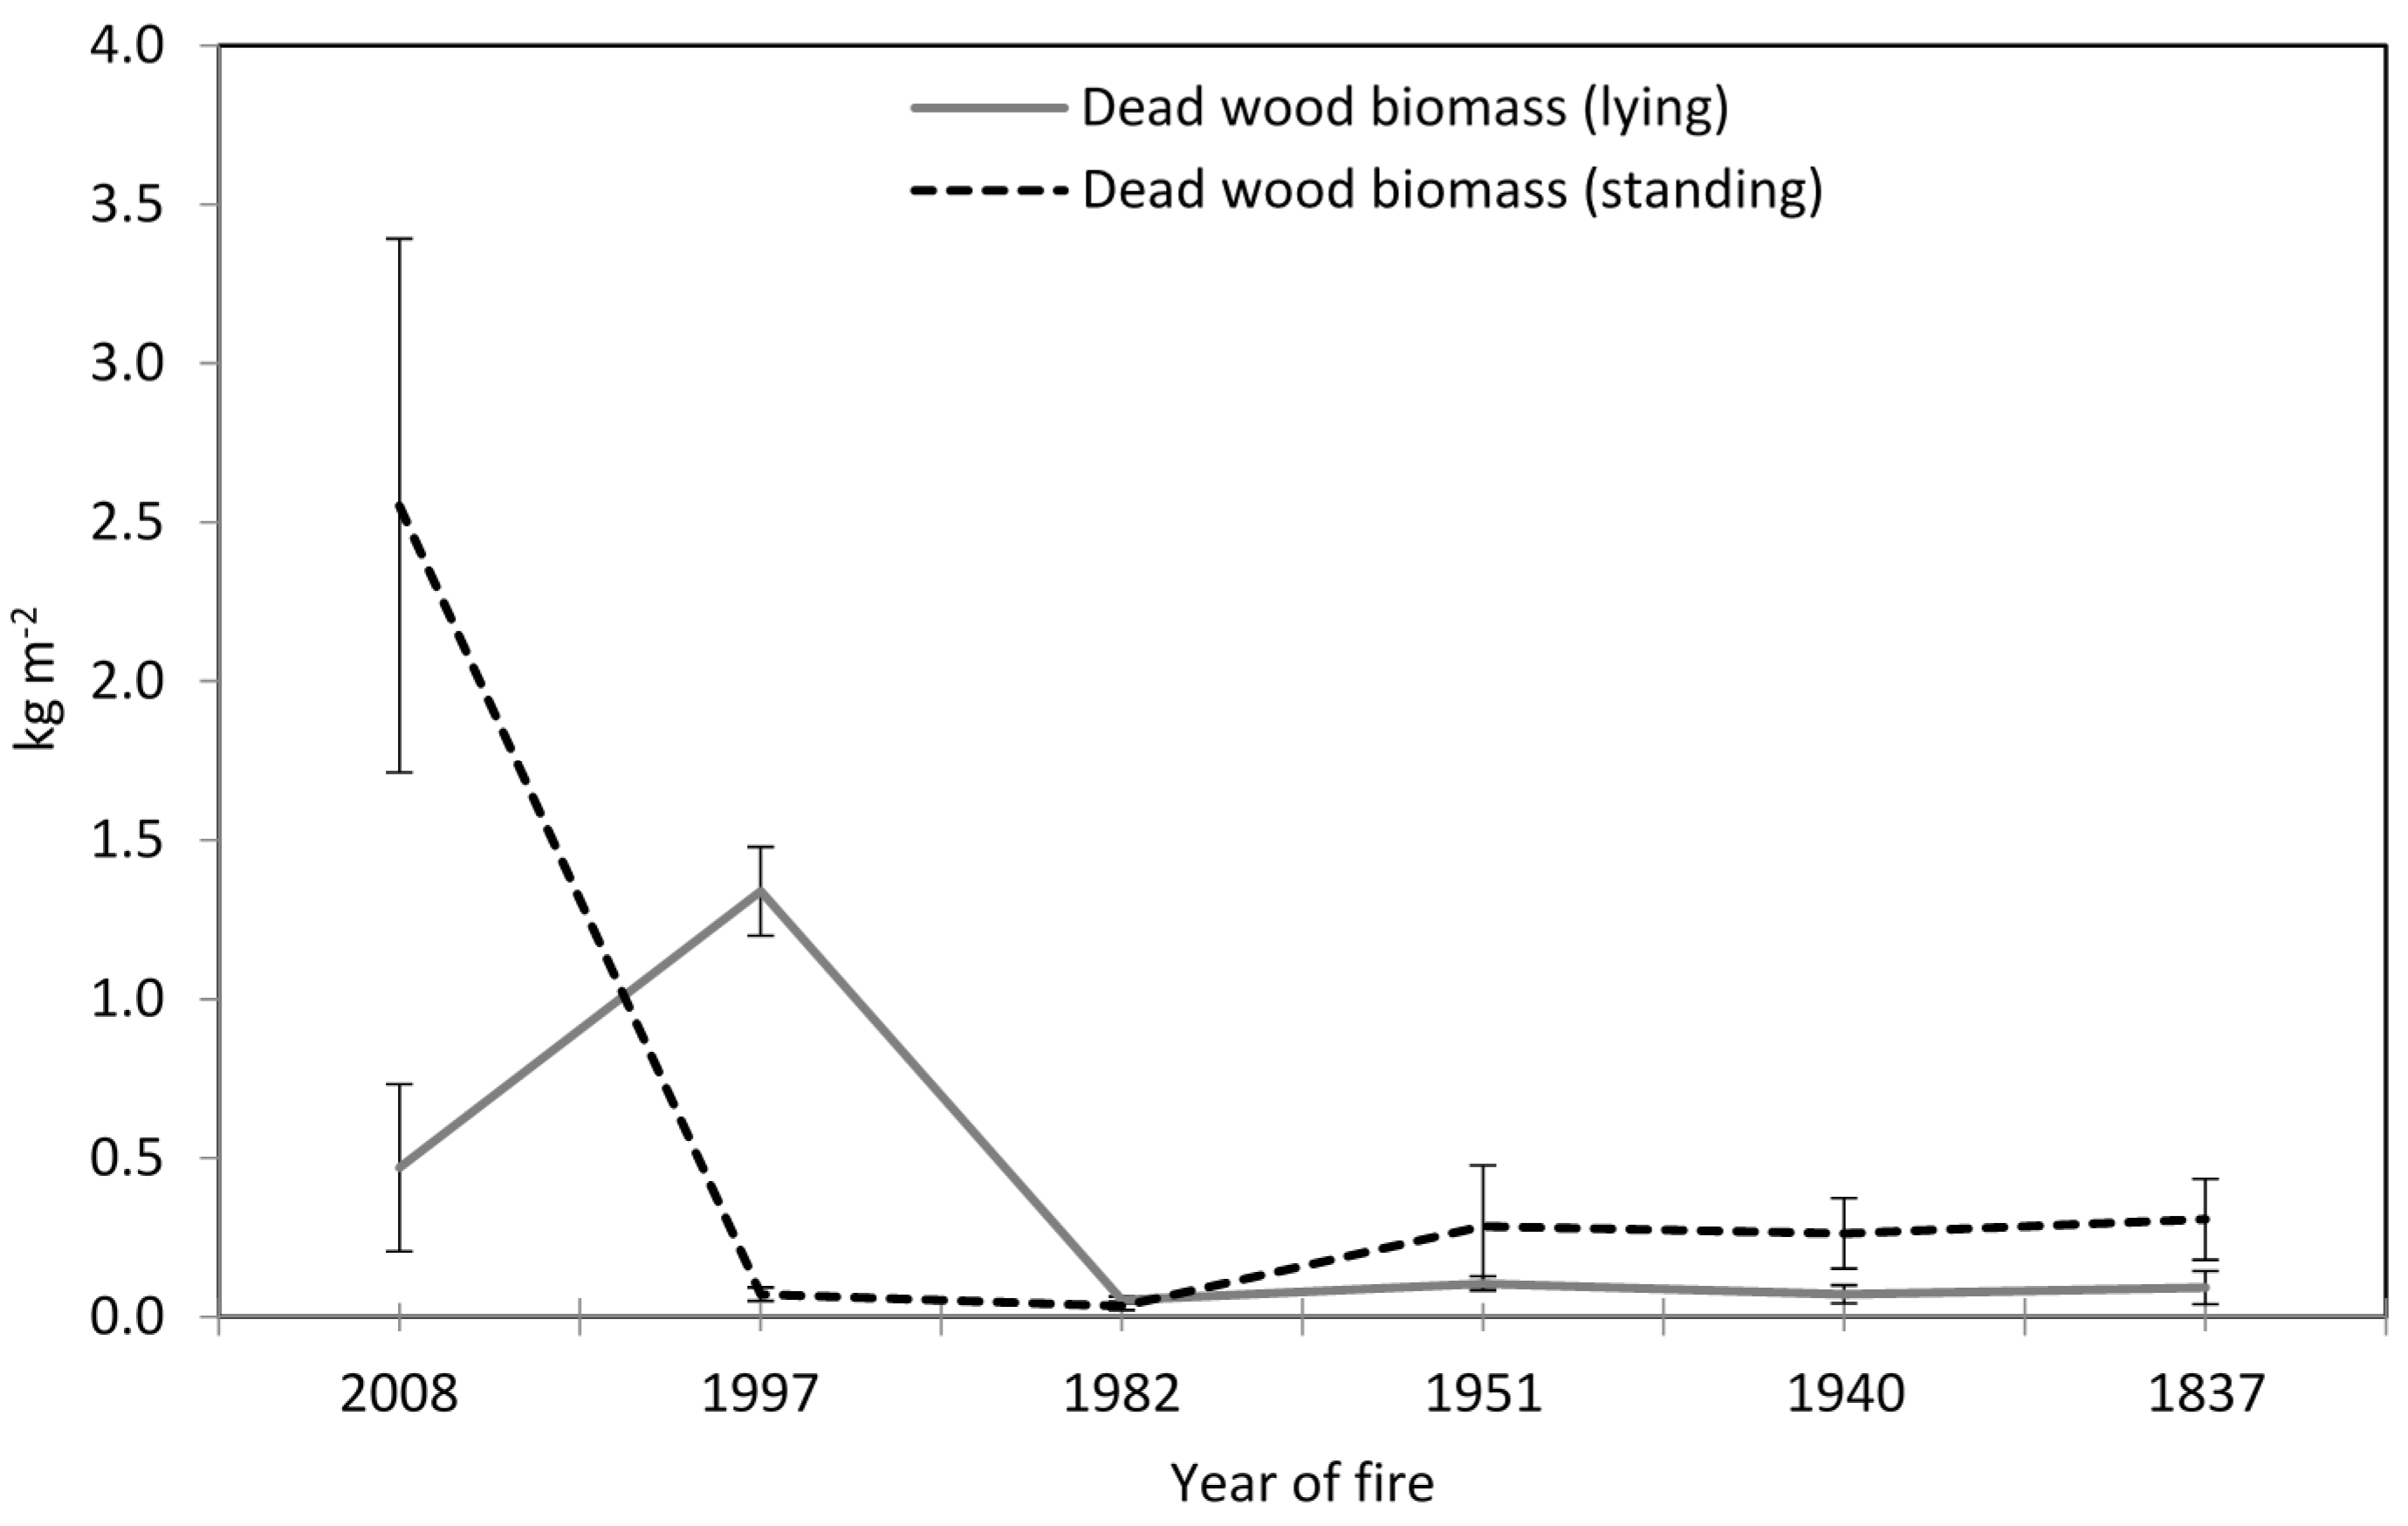
3.1. Soil Physical-Chemical Properties and Above- and Belowground Biomasses

Soil pH was not significantly different between areas with different time since fire. Soil pH in mineral soil was similar in all areas, ranging between 4.3 and 4.7 (Table 1). Soil pH in humus layer was slightly higher in areas where the fire occurred in 2008, 1997 and 1982 compared to other areas (Table 1), but the differences between the areas were not statistically significant (p > 0.05). The average thickness of the O-horizon (3.3 cm) was significantly lower (p < 0.05) in the area where the fire occurred in 2008 compared to other areas (Table 1). The thickest O-horizon was in the area where fire occurred in 1951 (Table 1). The thicknesses of the other horizons within the taken samples were not statistically different between the areas, and they ranged between 5.5 and 20.8 cm (Table 1). There was a significant difference (p < 0.05) between the areas when growing season temperatures (May–October) were used. The average soil temperatures in the area where the fire occurred in 2008 were 13.4°C (Table 1), while on the other areas the average soil temperatures stayed around 11 °C (Table 1). The daily average soil temperatures in the area where the fire occurred in 2008 were clearly higher from the middle of the May until the end of August (Figure 1). In September and October, there was no clear difference between the areas.
The living tree biomass, as well as the biomass of the ground vegetation and root biomass, increased during the post-fire succession (Figure 2). The total aboveground biomass (including tree and ground vegetation biomass) was smallest at the youngest fire area (0.53 kg m−2), increased through post-fire succession and reached the maximum in the areas where the fire occurred in 1951 (12.43 kg·m−2) (Figure 2). Same tendency was observed also with living root biomass (including tree and ground vegetation root biomass) being smallest at the youngest fire area (0.39 kg·m−2) and highest (4.18 kg·m−2) in the oldest fire area (Figure 2).
In the area where the fire occurred in 2008, there was a lot of standing dead wood biomass (Figure 3), meaning that seven years after the fire most of the trees that died during fire disturbance were still standing. In the area where the fire occurred in 1997 (18 years after fire) there was almost no standing dead trees in the area and there was the highest amount of lying dead wood (Figure 3). The amount of dead wood in the study areas stabilized around 65 years after the fire (Figure 3).
Total soil C stock was significantly lower (p < 0.05) in the area where the fire occurred in 2008 compared to other areas (Figure 4). The difference in soil total C stocks originated from the top layer (O-horizon), as the C stock in the O-horizon was much lower (only 729.2 g·C·m−2) in the most recently burned area (Figure 4).

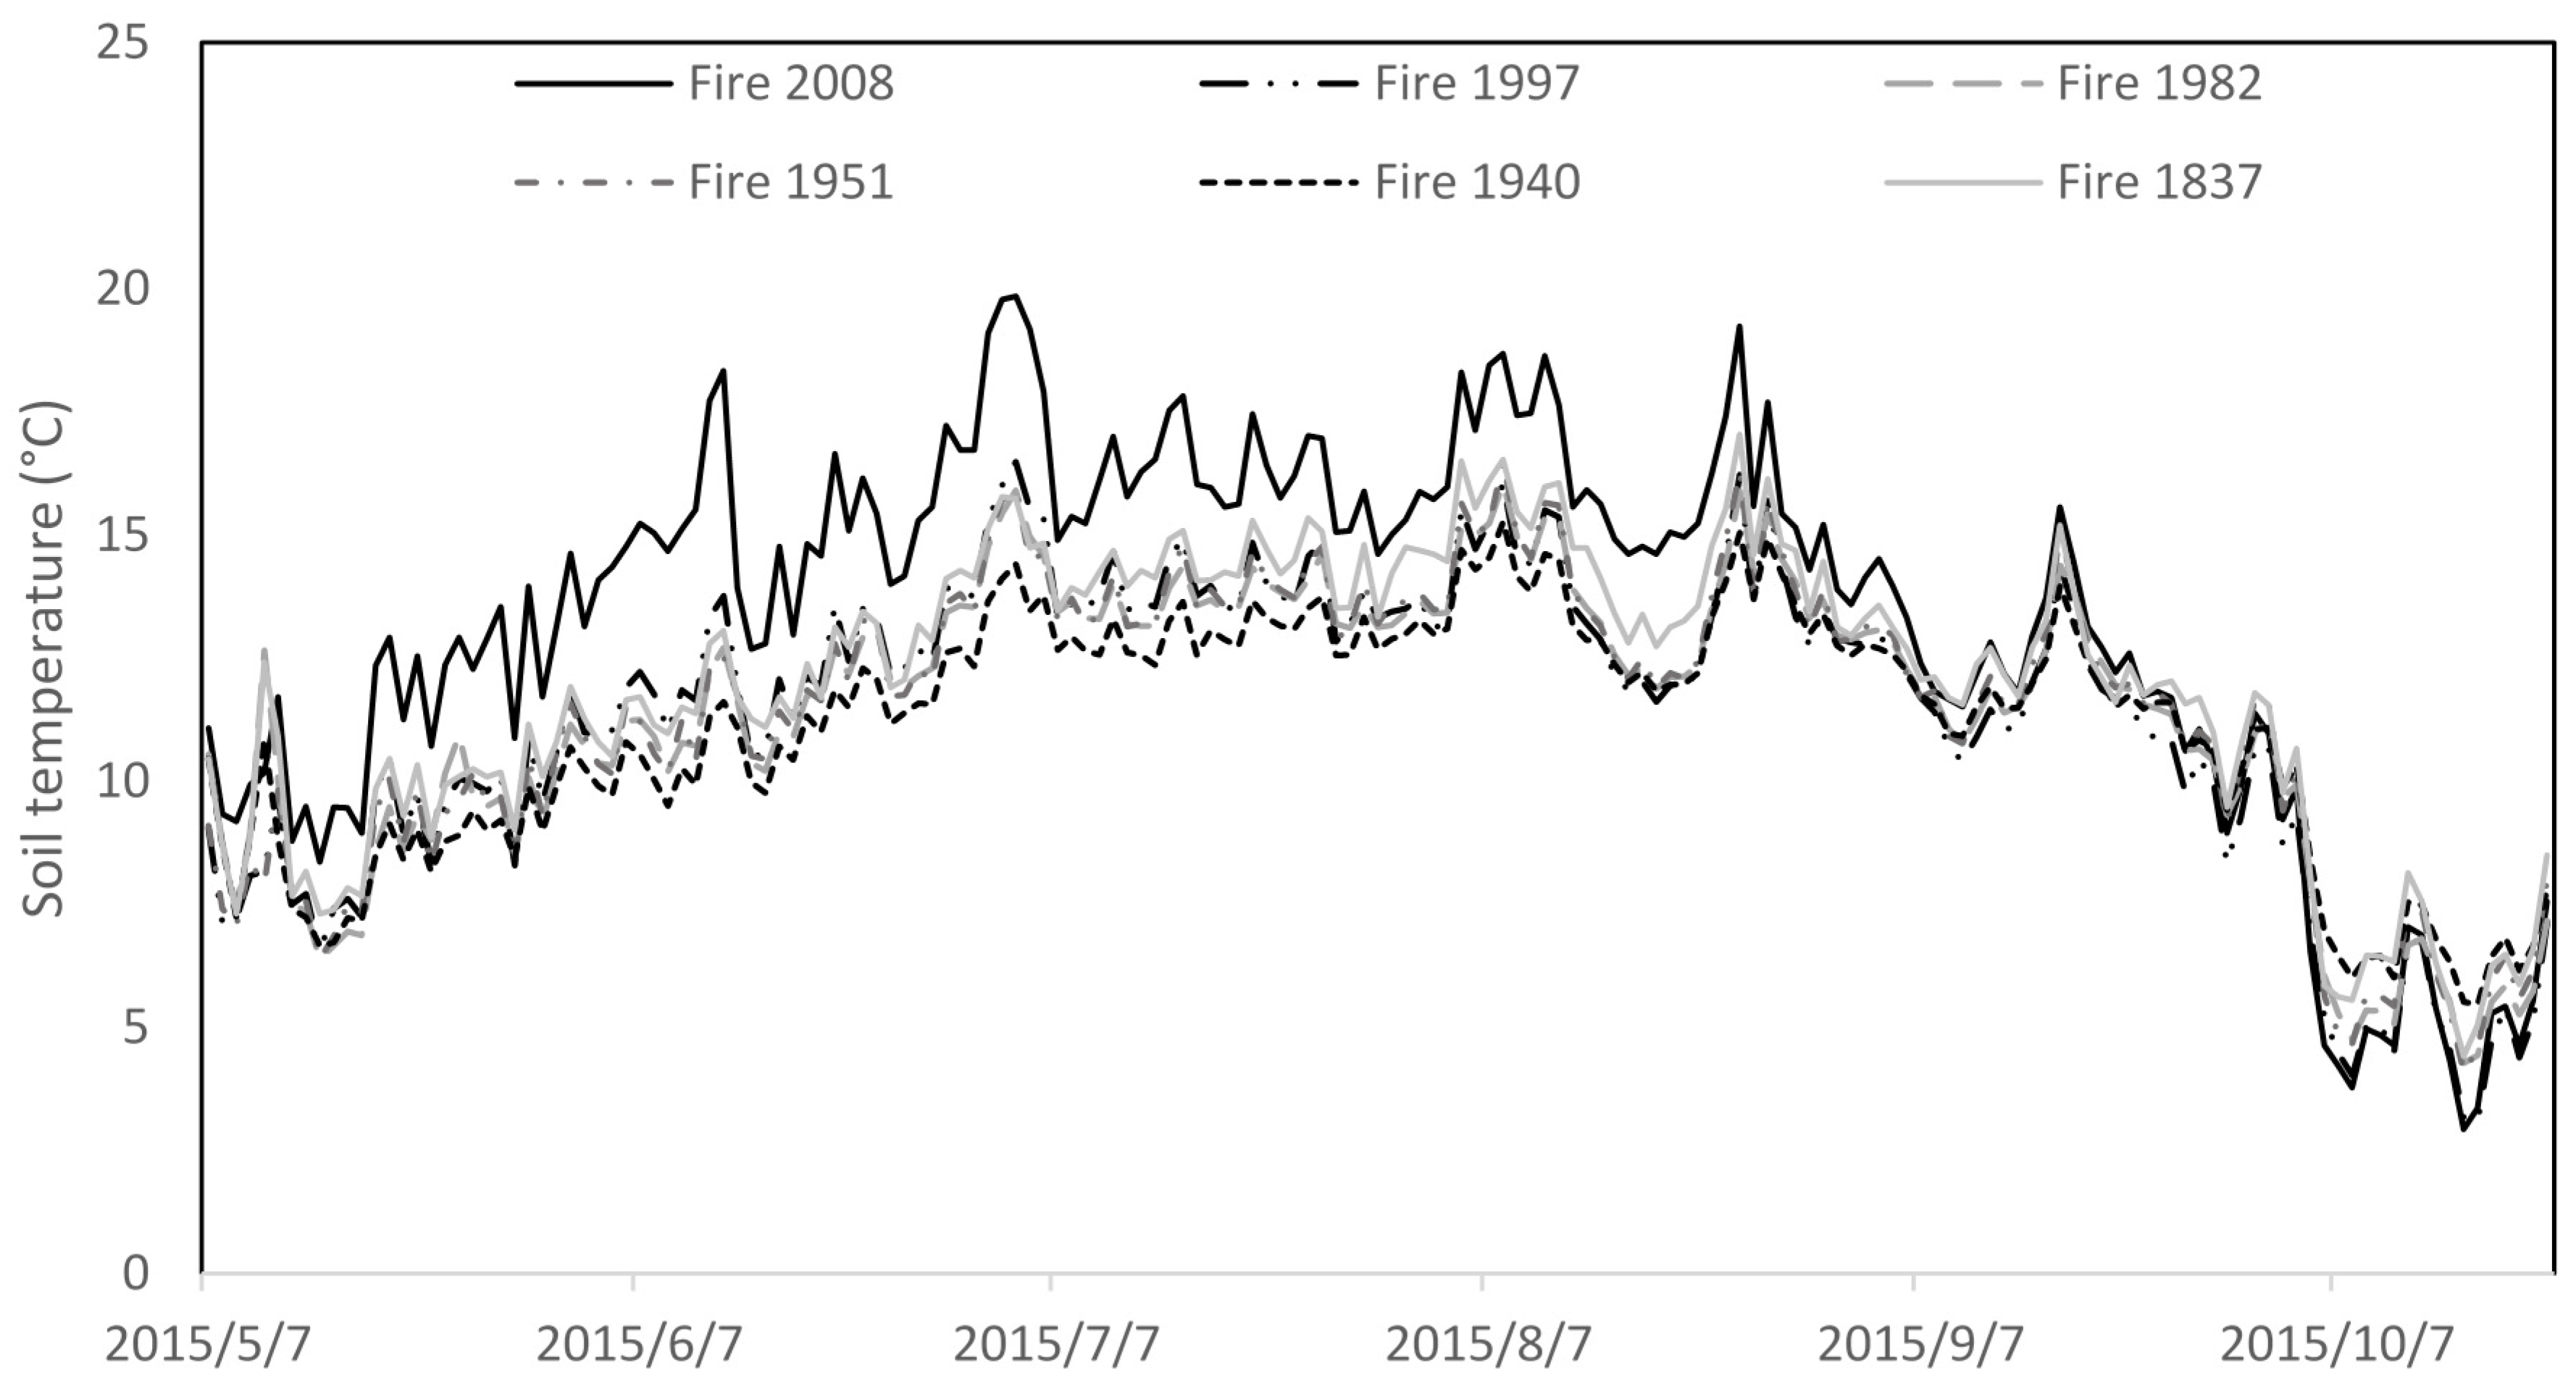
3.2. Soil CO2 Efflux

The results of this study revealed that factors affecting the soil CO2 effluxes from post-fire areas were time since fire, soil temperature, time of measurement (month) and root biomass (Table 2). Factors like soil water content, soil C and N content and ground vegetation biomass had no effect on soil CO2 efflux (Table 2). The post-fire soil CO2 efflux increased with time since the fire in our study (Figure 5). The CO2 efflux was lowest (p < 0.05) in the area where the fire occurred in 2008 (0.0747 mg CO2 m−2·s−1) and was already stable (compared to other older areas) in the area where the fire occurred in 1997 (0.1295 mg CO2 m−2·s−1), thus 18 years after the fire disturbance (Figure 5). There was also a clear correlation between soil CO2 efflux and soil temperature in the studied fire areas(R = 0.44, p < 0.05). When each year of the chronosequence was analyzed separately we found highest correlation between soil CO2 efflux and soil temperature in the most recently burned area (R = 0.95, p < 0.05) and lowest in the area where the fire occurred in 1982 (R = 0.59, p < 0.05). In all other areas the correlation between soil CO2 efflux and soil temperature were in the range 0.82–0.91.

4. Discussion

This study focused on stand-replacing fires in hemiboreal coniferous forests that affect C cycling and storage over large spatial scales and long time periods. Although more than 70% of the fires in Eurasia are surface fires [7], indicating that intermediate-severity fires are dominant in the area, the stand-replacing fires can also occur [4,8,21]. Fire intensity (intensity of humus reduction) is considered to be one of the most important fire-related characteristics [22], and it affects the pattern of the above- and belowground biomass recovery, community dynamics and soil processes [23].
Our results show a clear reduction of soil C stocks after the fire in the organic layer (O-horizon) on top of the soil, but fire effects were much smaller in the mineral soil. The C stocks of top soil layer had significantly lower amounts of C in the area where the last fire occurred 7 years ago in a year 2008, and the C pool started to increase significantly already 18 years after the fire in the area where fire occurred in 1997. Similarly, other studies have found that although the soil C pool in boreal forests is highly variable, the overall trend in the increase of C pool exists with increasing time since the fire [24,25]. The recovery of C pools in our study was most significant between 7 and 18 years after the fire. This is an important finding concerning the recovery of the C pool over the entire rotation period. If the fire frequency would increase from the current boreal average of approximately 100 years) between fire events, it could substantially reduce the long-term average soil C pool in the boreal forest zone [26,27]. However, these modeling studies, e.g., by Liski et al. [27] do not take into account the slow changes in soil respiration described here, and therefore overestimate the C losses experienced by forests [13].
Traditional approaches assume that the decomposition of SOM is either limited by the quality of SOM or by the environment [28]. The humus in podzol soils is usually covered with a poorly decomposed litter layer and the degree of decomposition of humus increases with depth. Fires burn most of the litter layer and often also the upper part of the humus layer. The SOM in the litter layer is easily decomposable, and weight loss from the litter approaches 10%–30% per year during the first years of decomposition [29]. The contribution of the litter layer to soil respiration has been found to be about 20% [30]. Therefore, we might assume that fires would decrease SOM quality by burning the easily decomposable litter but leaving the recalcitrant humus on the site. Direct effects of fires on the SOM quality have indeed been documented [31,32]. The amount of soil respiration is also affected by the quantity of SOM, and ground fires will cause a litter pulse because many trees are killed, but their foliage is not burnt. Therefore, litter input after a ground fire will exceed the litter input of undisturbed forests.
In previous studies it has been found that the soil CO2 efflux is lower in recently burned areas and higher in the areas where more time has elapsed since the last fire [13,33,34,35]. Similarly, this study revealed that soil respiration was lowest in the area where the last fire occurred most recently in 2008. It has been found that it may take 3–10 years for post-fire soil CO2 efflux recovery [36,37], and the main factors affecting it are the vegetation type, vegetation coverage and post-fire biomass recovery [38,39], which contribute to the formation of new SOM. However, in our study somewhat longer recovery period was observed. Therefore, it can be assumed that in the 2008 fire area SOM has not recovered and since the main soil CO2 efflux occurs mainly in the upper soil layers (O-horizon) the soil CO2 efflux is lower. The main reason why the SOM has not recovered was the original site and fire severity. Pine forests in our study areas are growing on sandy soils where the organic layer of soil was thin. With stand replacing fire almost all the organic soil layer was burned and it is difficult for tree regeneration and ground vegetation to establish on pure sand. In some areas it was also noticed some movement of the sand (when the sand was exposed after fire), thus it is understandable that seven years after fire disturbance ground vegetation coverage, that is the most important source for new SOM establishment, was not completely recovered. In addition, also the root respiration (other important component of the soil CO2 efflux) is lower as the vegetation has not fully recovered. In spring and summer, during active root growth, root respiration can account for 62% of the total soil CO2 efflux, and in the autumn the proportion may be only 16% [40]. Thus, the soil CO2 efflux may also be elevated due to the increase in root respiration, which in turn is caused by raise in soil temperature.
The importance of soil temperature and soil humidity on soil CO2 efflux has been reported in several studies [33,41,42,43]. As temperature raises the loss of soil organic C increases and thus the soil CO2 efflux increases [44,45,46]. In our study we also found that soil temperature affects the soil CO2 efflux, while soil water content had no effect. The average soil temperature was highest in the 2008 fire area, although the soil CO2 efflux was lowest in that area. It has been suggested that after fire the soil CO2 efflux is lower because the vegetation is killed by fire and SOM is either damaged or destroyed [33]. Furthermore, the soil temperature rises since the sun warms the post-fire vegetation-free and darker ground (sand mixed with ash and unburned residues) more. As a result of very high temperatures the soil CO2 efflux decreases as enzymes and microbes are deactivated [45]. Stand condition after the disturbance plays also an important role [47], because tree crowns are missing or have been damaged and it does not prevent the transmission of solar radiation on the ground [31,33]. Dead trees provide shelter from wind, which reduces evaporation that often inhibit conifer regeneration and may also act as seed catchers [2,48]. In contrast, old stand with a sparse cover of living trees allows wind to increase the evaporation. In our study there was a lot of standing dead trees in the area where the last fire occurred 7 years ago, while in the area where the last fire occurred 18 years ago there was almost no standing dead trees and there was the highest amount of lying dead wood. It is quite likely that in the 2008 fire area due to the small above- and belowground biomass the soil CO2 efflux was lower even with the highest average soil temperature and CO2 efflux was already stable in the 1997 fire area where the above- and belowground biomass was already recovered.

5. Conclusions

Overall, our results showed that forest fire has a substantial effect on the soil C content in the top soil layer, but not in the mineral soil layers. Soil respiration values in our study showed a chronological response to the time since the forest fire and the values were lowest in recently burned areas. The soil respiration values also followed a seasonal pattern being highest in August and lowest in May and November and there was a positive correlation between soil temperature and soil respiration values in our study areas. We also found that soil respiration follows logistic function: the recovery process happens within 10–20 years after fire and shows raising tendency.

Acknowledgments

This study was supported by the Estonian Environmental Investment Centre, the Institutional Research Funding (IUT21-4) of the Estonian Ministry of Education and Research, the Estonian Research Council (grant PUT715) and by the Academy of Finland (Projects No. 294600, 307222, 286685).

Author Contributions

K.K., M.M., K.J., F.B. and J.P. conceived and designed the experiment; K.K., M.M., A.O., K.P., K.J., F.B. and J.P. performed the experiments; K.K., A.O., and E.K. analyzed the data; all authors contributed in writing the paper.

Conflicts of Interest

The authors declare no conflict of interest.

References

  1. Franklin, J.F.; Spies, T.A.; Pelt, R.V.; Carey, A.B.; Thornburgh, D.A.; Berg, D.R.; Lindenmayer, D.B.; Harmon, M.E.; Keeton, W.S.; Shaw, D.C.; et al. Disturbances and structural development of natural forest ecosystems with silvicultural implications, using Douglas-fir forests as an example. For. Ecol. Manag. 2002, 155, 399–423. [Google Scholar] [CrossRef]
  2. Parro, K.; Metslaid, M.; Renel, G.; Sims, A.; Stanturf, J.A.; Jõgiste, K.; Köster, K. Impact of postfire management on forest regeneration in a managed hemiboreal forest, Estonia. Can. J. For. Res. 2015, 45, 1192–1197. [Google Scholar] [CrossRef]
  3. Kashian, D.M.; Romme, W.H.; Tinker, D.B.; Turner, M.G.; Ryan, M.G. Carbon storage on landscapes with stand-replacing fires. BioScience 2006, 56, 598–606. [Google Scholar] [CrossRef]
  4. Bond-Lamberty, B.; Gower, S.T.; Wang, C.; Cyr, P.; Veldhuis, H. Nitrogen dynamics of a boreal black spruce wildfire chronosequence. Biogeochemistry 2006, 81, 1–16. [Google Scholar] [CrossRef]
  5. Kuzyakov, Y. Priming effects: Interactions between living and dead organic matter. Soil Biol. Biochem. 2010, 42, 1363–1371. [Google Scholar] [CrossRef]
  6. Yarie, J.; Billings, S. Carbon balance of the taiga forest within Alaska: Present and future. Can. J. For. Res. 2002, 32, 757–767. [Google Scholar] [CrossRef]
  7. Shorohova, E.; Kuuluvainen, T.; Kangur, A.; Jõgiste, K. Natural stand structures, disturbance regimes and successional dynamics in the Eurasian boreal forests: A review with special reference to Russian studies. Ann. For. Sci. 2009, 66, 201p1–201p20. [Google Scholar] [CrossRef]
  8. Conard, S.G.; Sukhinin, A.I.; Stocks, B.J.; Cahoon, D.R.; Davidenko, E.P.; Ivanova, G.A. Determining Effects of Area Burned and Fire Severity on Carbon Cycling and Emissions in Siberia. Clim. Chang. 2002, 55, 197–211. [Google Scholar] [CrossRef]
  9. Goetz, S.J.; Mack, M.C.; Gurney, K.R.; Randerson, J.T.; Houghton, R.A. Ecosystem responses to recent climate change and fire disturbance at northern high latitudes: Observations and model results contrasting northern Eurasia and North America. Environ. Res. Lett. 2007, 2, 1–9. [Google Scholar] [CrossRef]
  10. Batjes, N.H. Total carbon and nitrogen in the soils of the world. Eur. J. Soil Sci. 1996, 47, 151–163. [Google Scholar] [CrossRef]
  11. Högberg, P.; Read, D.J. Towards a more plant physiological perspective on soil ecology. Trends Ecol. Evol. 2006, 21, 548–554. [Google Scholar] [CrossRef] [PubMed]
  12. Pumpanen, J.; Heinonsalo, J.; Rasilo, T.; Hurme, K.-R.; Ilvesniemi, H. Carbon balance and allocation of assimilated CO2 in Scots pine, Norway spruce, and Silver birch seedlings determined with gas exchange measurements and 14C pulse labelling. Trees 2009, 23, 611–621. [Google Scholar] [CrossRef]
  13. Köster, K.; Berninger, F.; Lindén, A.; Köster, E.; Pumpanen, J. Recovery in fungal biomass is related to decrease in soil organic matter turnover time in a boreal fire chronosequence. Geoderma 2014, 235–236, 74–82. [Google Scholar] [CrossRef]
  14. Wan, S.; Hui, D.; Luo, Y. Fire effects on nitrogen pools and dynamics in terrestrial ecosystems: A meta-analysis. Ecol. Appl. 2001, 11, 1349–1365. [Google Scholar] [CrossRef]
  15. Goulden, M.L.; McMillan, A.M.S.; Winston, G.C.; Rocha, A.V.; Manies, K.L.; Harden, J.W.; Bond-Lamberty, B.P. Patterns of NPP, GPP, respiration, and NEP during boreal forest succession. Glob. Chang. Biol. 2011, 17, 855–871. [Google Scholar] [CrossRef]
  16. Parro, K.; Köster, K.; Jõgiste, K.; Vodde, F. Vegetation dynamics in a fire damaged forest area: The response of major ground vegetation species. Balt. For. 2009, 15, 206–215. [Google Scholar]
  17. Repola, J. Biomass equations for birch in Finland. Silva Fenn. 2008, 42, 605–624. [Google Scholar] [CrossRef]
  18. Repola, J. Biomass equations for Scots pine and Norway spruce in Finland. Silva Fenn. 2009, 43, 625–647. [Google Scholar] [CrossRef]
  19. Food and Agriculture Organization of the United Nations (FAO). World Reference Base for Soil Resources 2014. International Soil Classification System for Naming Soils and Creating Legends for Soil Maps; FAO: Rome, Italy, 2014. [Google Scholar]
  20. Beck, T.; Joergensen, R.G.; Kandeler, E.; Makeschin, F.; Nuss, E.; Oberholzer, H.R.; Scheu, S. An inter-laboratory comparison of ten different ways of measuring soil microbial biomass C. Soil Biol. Biochem. 1997, 29, 1023–1032. [Google Scholar] [CrossRef]
  21. Gromtsev, A. Natural disturbance dynamics in the boreal forests of European Russia: A review. Silva Fenn. 2002, 36, 41–55. [Google Scholar] [CrossRef]
  22. Schimmel, J.; Granström, A. Fire severity and vegetation response in the boreal Swedish forest. Ecology 1996, 77, 1436–1450. [Google Scholar] [CrossRef]
  23. Ruokolainen, L.; Salo, K. The effect of fire intensity on vegetation succession on a sub-xeric heath during ten years after wildfire. Ann. Bot. Fenn. 2009, 46, 30–42. [Google Scholar] [CrossRef]
  24. Pregitzer, K.S.; Euskirchen, E.S. Carbon cycling and storage in world forests: Biome patterns related to forest age. Glob. Chang. Biol. 2004, 10, 2052–2077. [Google Scholar] [CrossRef]
  25. Bormann, B.T.; Homann, P.S.; Darbyshire, R.L.; Morrissette, B.A. Intense forest wildfire sharply reduces mineral soil C and N: The first direct evidence. Can. J. For. Res. 2008, 38, 2771–2783. [Google Scholar] [CrossRef]
  26. Metsaranta, J.M.; Kurz, W.A.; Neilson, E.T.; Stinson, G. Implications of future disturbance regimes on the carbon balance of Canada’s managed forest (2010–2100). Tellus B 2010, 62, 719–728. [Google Scholar] [CrossRef]
  27. Liski, J.; Ilvesniemi, H.; Mäkelä, A.; Starr, M. Model analysis of the effects of soil age, fires and harvesting on the carbon storage of boreal forest soils. Eur. J. Soil Sci. 1998, 49, 407–416. [Google Scholar] [CrossRef]
  28. Jenkinson, D.S.; Adams, D.E.; Wild, A. Model estimates of CO2 emissions from soil in response to global warming. Nature 1991, 351, 304–306. [Google Scholar] [CrossRef]
  29. Berg, B.; Berg, M.P.; Bottner, P.; Box, E.; Breymeyer, A.; Calvo de Anta, R.; Couteaux, M.; Escudero, A.; Gallardo, A.; Kratz, W.; et al. Litter mass loss rates in pine forests of Europe and Eastern United States: Some relationships with climate and litter quality. Biogeochemistry 1993, 20, 127–159. [Google Scholar] [CrossRef]
  30. Berryman, E.M.; Marshall, J.D.; Kavanagh, K. Decoupling litter respiration from whole-soil respiration along an elevation gradient in a Rocky Mountain mixed-conifer forest. Can. J. For. Res. 2014, 44, 432–440. [Google Scholar] [CrossRef]
  31. Certini, G. Effects of fire on properties of forest soils: A review. Oecologia 2005, 143, 1–10. [Google Scholar] [CrossRef] [PubMed]
  32. Certini, G.; Nocentini, C.; Knicker, H.; Arfaioli, P.; Rumpel, C. Wildfire effects on soil organic matter quantity and quality in two fire-prone Mediterranean pine forests. Geoderma 2011, 167–168, 148–155. [Google Scholar] [CrossRef]
  33. Luo, Y.; Zhou, X. Soil Respiration and the Environment; Elsevier: New York, NY, USA, 2006; p. 320. [Google Scholar]
  34. Czimczik, C.I.; Trumbore, S.E.; Carbone, M.S.; Winston, G.C. Changing sources of soil respiration with time since fire in a boreal forest. Glob. Chang. Biol. 2006, 12, 957–971. [Google Scholar] [CrossRef]
  35. Köster, K.; Berninger, F.; Heinonsalo, J.; Lindén, A.; Köster, E.; Ilvesniemi, H.; Pumpanen, J. The long-term impact of low-intensity surface fires on litter decomposition and enzyme activities in boreal coniferous forests. Int. J. Wildland Fire 2016, 25, 213–223. [Google Scholar] [CrossRef]
  36. Kulmala, L.; Aaltonen, H.; Berninger, F.; Kieloaho, A.-J.; Levula, J.; Bäck, J.; Hari, P.; Kolari, P.; Korhonen, J.F.J.; Kulmala, M.; et al. Changes in biogeochemistry and carbon fluxes in a boreal forest after the clear-cutting and partial burning of slash. Agric. For. Meteorol. 2014, 188, 33–44. [Google Scholar] [CrossRef]
  37. Köster, E.; Köster, K.; Berninger, F.; Pumpanen, J. Carbon dioxide, methane and nitrous oxide fluxes from podzols of a fire chronosequence in the boreal forests in Värriö, Finnish Lapland. Geoderma Reg. 2015, 5, 181–187. [Google Scholar] [CrossRef]
  38. Raich, J.W.; Tufekcioglu, A. Vegetation and soil respiration: Correlation and controls. Biogeochemistry 2000, 48, 71–90. [Google Scholar] [CrossRef]
  39. Hart, S.C.; DeLuca, T.H.; Newman, G.S.; MacKenzie, M.D.; Boyle, S.I. Post-fire vegetative dynamics as drivers of microbial community structure and function in forest soils. For. Ecol. Manag. 2005, 220, 166–184. [Google Scholar] [CrossRef]
  40. Widén, B.; Majdi, H. Soil CO2 efflux and root respiration at three sites in a mixed pine and spruce forest: Seasonal and diurnal variation. Can. J. For. Res. 2001, 31, 786–796. [Google Scholar] [CrossRef]
  41. Raich, J.W.; Schelesinger, W.H. The global carbon dioxide flux in soil respiration and its relationship to vegetation and climate. Tellus B 1992, 44, 81–99. [Google Scholar] [CrossRef]
  42. Buchmann, N. Biotic and abiotic factors controlling soil respiration rates in Picea abies stands. Soil Biol. Biochem. 2000, 32, 1625–1635. [Google Scholar] [CrossRef]
  43. Laganière, J.; Paré, D.; Bergeron, Y.; Chen, H.Y.H. The effect of boreal forest composition on soil respiration is mediated through variations in soil temperature and C quality. Soil Biol. Biochem. 2012, 53, 18–27. [Google Scholar] [CrossRef]
  44. Schlesinger, W.H.; Andrews, J.A. Soil respiration and the global carbon cycle. Biogeochemistry 2000, 48, 7–20. [Google Scholar] [CrossRef]
  45. Fang, C.; Moncrieff, J.B. The dependence of soil CO2 efflux on temperature. Soil Biol. Biochem. 2001, 33, 155–165. [Google Scholar] [CrossRef]
  46. Köster, K.; Püttsepp, Ü.; Pumpanen, J. Comparsion of soil CO2 flux between uncleared and cleared windthrow areas in Estonia and Latvia. For. Ecol. Manag. 2011, 262, 65–70. [Google Scholar] [CrossRef]
  47. Köster, K.; Voolma, K.; Jõgiste, K.; Metslaid, M.; Laarmann, D. Assessment of tree mortality after windthrow using photo-derived data. Ann. Bot. Fenn. 2009, 46, 291–298. [Google Scholar] [CrossRef]
  48. Moser, B.; Temperli, C.; Schneiter, G.; Wohlgemuth, T. Potential shift in tree species composition after interaction of fire and drought in the Central Alps. Eur. J. For. Res. 2010, 129, 625–633. [Google Scholar] [CrossRef]
Figure 1. Daily average soil temperatures (24 h average, °C) during the measurement period in a fire chronosequence.
Forests 07 00201 g001
Figure 2. Average aboveground (branches/needles, tree stems, mosses and vascular plants) and belowground biomass (kg·m−2) in a fire chronosequence.
Forests 07 00201 g002
Figure 3. Average standing and lying dead wood biomass (kg·m−2) in a fire chronosequence.
Forests 07 00201 g003
Figure 4. Average soil C content (C·g·m−2) in different horizons (O-/E-/BHF-/BCg-/Cg-horizon) in a fire chronosequence.
Forests 07 00201 g004
Figure 5. The average soil CO2 efflux (mg CO2 m−2·s−1) in a fire chronosequence.
Forests 07 00201 g005
Table 1. Stand and soil characteristics of the study areas. Pi—Scots pine, Bi—Birch. Geographical coordinate represent the location of middle sample plot in a fire chronosequence.
Study Area (Geographical Coordinate)Site TypeTree Species Composition (%)Living Trees/haD1,3 (cm)H (m)Soil TextureAverage Thickness of: O-/E-/BHF-/BCg-/Cg-Horizon in Soil (cm)Soil pH (O-/E-/Mineral Horizons)Average Soil Temperature (Growing Season) (°C)
Fire 2008 (59°11′ N 23°46′ E)Calluna/Cladina56 Pi, 44 Bi14221.91.1Loamy sand3.3/10.3/12.9/11.2/11.54.0/4.1/4.713.4
Fire 1997 (59°12′ N 23°49′ E)Calluna/Vaccinium uliginosum91 Pi, 9 Bi26833.92.9Loamy sand8.8/7.8/12.1/11.3/15.34.0/4.2/4.511.4
Fire 1982 (59°12′ N 23°48′ E)Vaccinium uliginosum100 Pi31677.25.5Loamy sand8.7/5.5/7.9/9.1/20.84.0/3.9/4.411.5
Fire 1951 (59°14′ N 23°49′ E)Calluna93 Pi, 7 Bi158312.511.1Loamy sand13.2/7.2/11.1/9.4/10.33.8/3.9/4.311.5
Fire 1940 (59°10′ N 23°42′ E)Calluna100 Pi311710.49.4Loamy sand9.4/10.4/11.7/10.1/10.23.6/3.7/4.611.1
Fire 1837 (59°13′ N 23°36′ E)Calluna/Cladina100 Pi55821.813.4Loamy sand8.9/9.9/12.6/10.7/17.53.7/4.0/4.511.4
Table 2. Analysis of logarithmically transformed soil CO2 efflux: ANOVA type 3 test results for factors.
FactorComplex Modelp-Value
NDFDDFF
Time since fire (year of fire)5924116.99<0.001
Time of measurement (month)692431.60<0.001
Soil water content19240.870.3508
Soil temperature1924141.89<0.001
Soil C content19240.140.8929
Soil N content19243.360.0672
Ground vegetation biomass19243.390.0701
Root biomass (tree and ground vegetation roots)192419.23<0.001
Note: NDF = numerator degrees of freedom for the F-test; DDF = denominator degrees of freedom; F = value of the F-statistics; p-value tests the null hypothesis ‘‘Factor has no effect on CO2 efflux”.

