Article

Functional Diversity of Small and Large Trees along Secondary Succession in a Tropical Dry Forest

by
Lucía Sanaphre-Villanueva
1,
Juan Manuel Dupuy
1,*,
José Luis Andrade
1,
Casandra Reyes-García
1,
Horacio Paz
2 and
Paula C. Jackson
3
1
Unidad de Recursos Naturales, Centro de Investigación Científica de Yucatán (CICY), Mérida C.P. 97205, Yucatán, Mexico
2
Instituto de Investigaciones en Ecosistemas y Sustentabilidad, Universidad Nacional Autónoma de México, Morelia C.P. 58190, Michoacán, Mexico
3
Department of Ecology, Evolution, and Organismal Biology, Kennesaw State University, Kennesaw, GA 30144, USA
*
Author to whom correspondence should be addressed.
Forests 2016, 7(8), 163; https://doi.org/10.3390/f7080163
Submission received: 7 May 2016 / Revised: 1 July 2016 / Accepted: 16 July 2016 / Published: 30 July 2016

Abstract

:
Functional Diversity is considered an important driver of community assembly in environmental and successional gradients. To understand tree assembly processes in a semideciduous tropical forest, we analyzed the variation of Functional Richness (FRic), Functional Divergence (FDiv), and Functional Evenness (FEve) of small vs. large trees in relation to fallow age after slash-and-burn agriculture and topographical position (flat sites vs. hills). FRic of small trees was lower than null model predicted values across the successional gradient, and decreased unexpectedly in older successional ages. FRic of large trees was higher than null model predictions early in succession and lower in late-successional stands on hills. Dominant species were more similar (low FDiv) in early and intermediate successional stands for small trees, and on hills for large trees, suggesting that species that are best adapted to harsh conditions share similar traits. We also found evidence of competitive exclusion among similar species (high FEve) for small trees in early successional stands. Overall, our results indicate that community assembly of small trees is strongly affected by the changing biotic and abiotic conditions along the successional and topographical gradient. For large trees, hills may represent the most stressful conditions in this landscape.

Graphical Abstract

1. Introduction

Tropical dry forests (TDF), characterized by a dry period of several months, a mean annual rainfall between 400 and 1700 mm, and a ratio of rainfall to potential evapotranspiration greater than unity, is one of the most extensive ecosystems in the tropics [1,2]. However, because the severe dry season facilitates vegetation removal with fire and the suppression of pests and weeds [2,3,4] it is also one of the ecosystems most threatened by land conversion. This land use change has produced a mosaic of tropical dry forest patches of different successional ages, which may offer an opportunity to further our understanding of assembly patterns and processes during secondary succession in this human-modified system [5].
Young successional forest stands are dry, sunny, and hot, because early plant communities have small stature and offer little cover, have small basal area and a small leaf area index [6,7,8,9,10]. The increase in plant density, height, above-ground biomass and leaf area index modifies the environment over time into one that is relatively cooler and moister at later successional stages [11,12]. Although an increasing number of studies have analyzed the recovery of species richness, and the change of structural and functional traits during secondary succession in TDF, only few have measured some of the environmental gradients involved [11,12,13]. In particular, soil water availability [11] and air temperature [14] have been described among the main filters limiting plant establishment and growth of species associated with young plots. Light may also play a role in community assembly [9,11], although to a lesser extent than in wet forests, because tropical dry forests are less stratified, possess short statured trees and have a patchy distribution of canopy that can allow higher light availability in the understory [2].
As a consequence of the harsh environmental conditions at the beginning of succession, a reduced number of species with functional traits associated with maximizing photo-protection and heat dissipation dominate (i.e., the TDF pioneer guild) [8,9,15]. These species are characterized by conservative traits associated with high water stress tolerance and slow growth [11,16]. As the environment changes, pioneers decline and other species with acquisitive traits associated with fast growth can establish and compete for resources (i.e., the TDF mature forest guild) [11,16]. These changes from conservative to acquisitive strategies suggest that abiotic filtering is an important process in community assembly early in TDF succession, whereas the relative importance of competitive exclusion appears to increase at later successional stages [17].
In addition to succession, another source of variation in forests is topography, which covaries with multiple environmental factors [18,19]. Several studies in TDF have shown that soil water availability is lower on slopes and hilltops compared to valleys [19,20]. Environmental variation associated with topographic position may result in shifts in TDF plant species composition that are analogous to those observed along secondary succession. Thus, environmental filtering can be expected to select species with conservative traits on slopes and hilltops, while some species having acquisitive traits may competitively exclude other species in valleys. Moreover, the effects of environmental filtering and competition along succession and across topographic positions may be size dependent, since plant function (e.g., water transport capacity or light harvest), plant responses to the environment, and plant-plant interactions (e.g., competition or facilitation) are also size dependent [21].
The distribution of functional traits in a community [22,23], and the magnitude of their differences among species, or functional diversity [24] can shed light on the relative influence of environmental filtering [25] and competition [26]. Assessment of functional organization of communities requires a multifaceted approach, and several functional diversity indices have been proposed as indicators of the processes that govern community assembly [27,28,29]. Here, we consider three functional diversity indices: (1) Functional Richness (FRic), which measures the functional trait space occupied by species based on their position on trait axes, independently of their abundance; (2) Functional Evenness (FEve), which reflects the regularity in the distribution of species abundances, or the regularity in their pairwise functional dissimilarities; and (3) Functional Divergence (FDiv), which measures functional distance among the most abundant species [28]. Since environmental filtering is expected to reduce the range of successful strategies among coexisting species [30,31], and FRic can be considered as a multivariate range of functional traits; low values of FRic can be interpreted as the result of environmental filtering [32]. FEve gauges how thoroughly the resources available are being exploited by the community [29], and increases when the strategies of co-occurring species are evenly distributed in relation to resource use, which can be interpreted as an indication of niche partitioning by competitive exclusion [33]. Finally, FDiv measures how species abundances are spread along functional axes, and is low when the most dominant species have low functional trait differentiation, which occurs when environmental filters favor a narrow range of functional traits [28]. Conversely, high FDiv may be an indication of an increase in competitive interactions [27,28], since competition may set a limit to the similarity of coexisting species [34].
The aim of this study was to use a trait-based approach to assess how environmental filtering and competition influence the assembly of large and small-sized tree communities during succession, and if this influence differs in flat areas and on hills of a tropical semideciduous forest. Specifically, we aimed to answer the following questions: (1) How do different functional diversity components (FRic, FDiv and FEve) vary along secondary succession after slash and burn agriculture, and between flat areas and hills? (2) Do functional diversity responses to successional age and topographic position differ between large- and small-sized trees? We hypothesize that abiotic conditions early in succession and on hills may represent strong filters allowing the establishment of mostly stress tolerant slow-growing species that conserve resources for longer periods of time [15]. Conversely, later in succession and in flat areas, where water availability is relatively less limiting, acquisitive faster-growing plants with low water use efficiencies and high photosynthetic rates may dominate, and competitively exclude other species [9]. Therefore, we predict (1) lower FRic in early successional ages and on hills, reflecting stronger environmental filtering under these conditions compared to later successional ages and flat areas. We also expect; (2) lower FRic values for small than for large trees, because the strongest filters to species establishment are known to occur at early life stages when plants are smaller [35]; (3) We predict that FEve and FDiv would be higher at intermediate- and late-successional ages, reflecting increasing competition, as the number of individuals and/or their size increase with successional age; Finally, (4) we predict that, compared to large trees, small trees will show higher FEve and FDiv values due to asymmetric competition for limiting resources, especially at intermediate and late-successional ages and in flat areas, where they can be suppressed by large canopy trees [21].

2. Materials and Methods

2.1. Study Site

The study area covers a 352-km2 landscape of semi-deciduous tropical forest (50%–75% of trees shed their leaves during the dry season) in the central part of the Yucatan Peninsula, Mexico (20°01′07″N to 20°09′36″N latitude, and 89°35′59″W to 89°23′31″W longitude). The region is characterized by a warm sub humid climate—AW1 according to the modified Köppen system [36]—with summer rains and a marked dry season from November to April. Mean annual temperature is 26 °C and mean annual precipitation ranges between 1000 and 1200 mm [37]. The landscape consists of valleys or flat areas with relatively deep (40–100 cm) clayey Luvisols and Cambisols and low limestone hills (elevations between 60 and 190 m asl) with shallow (5–20 cm) rocky Lithosols and Rendzines [38,39]. Soil depth is greater in flat areas than on slopes [39] whereas soil fertility shows the opposite pattern [40]. The predominant land use has been traditional slash and burn agriculture, in which all trees are cut to grow corn, squash and beans for one or two years, followed by a fallow period; this system has been practiced by the Mayan people throughout the studied landscape for over 2000 years [41]. Consequently the vegetation is a shifting mosaic of different successional ages.

2.2. Species Selection

As part of a study relating forest structure and diversity to landscape patterns of habitat types based on a supervised classification of satellite imagery [42], in the summer of 2008 and 2009 twenty three 1 km2 landscape units were selected that encompassed the range of landscape conditions of disturbance and fragmentation of the area. At each unit, 12 sampling sites were established spanning four vegetation classes that could be differentiated using remote sensing: (1) 3 to 8 years of secondary succession; (2) 9 to 15 years; (3) >15 years on flat areas and (4) >15 years on hills –three sites per vegetation class where possible, depending on the availability of stands of each class in each landscape unit. Stand age was determined from interviews with local residents who lived in the area for at least 40 years and owned or worked on the land. Mayan farmers have a keen empirical knowledge of forest succession, and their own detailed system of classifying and distinguishing several successional stages based on their knowledge of the local disturbance regime, and the presence and size of certain species, which makes their determination of forest stand age reliable [43]. In total, there were 276 plots consisting of two concentric circular areas, one of 200 m2 where all tress with a diameter at breast height (DBH; 1.3 m height) >5 cm were measured, and the other one of 50 m2 where all plants of tree species with DBH between 1 and 5 cm were measured (for a detailed description of sampling and vegetation characterization see Reference [44]). From this inventory, and considering only plants with DBH > 5 cm, we calculated for each vegetation class the importance value (I.V.) of each species as:
I.V. = (relative basal area + relative density + relative frequency)/3 × 100
For trait sampling we selected a total of 45 tree species (out of a total of 120) that constituted at least 80% of the cumulative I.V. in each vegetation class. However, for this study, we categorized sites into different successional-age classes, based on a previous study in the Yucatan Peninsula, which found that abandoned agricultural fields reached a tree species composition indistinguishable from that of mature forests after about 25 years of succession [45]: (1) 3 to 10 years old (early-successional); (2) 11 to 25 years old (intermediate); (3) 26 to 70 years old (late-successional). For the last two categories, we distinguished between plots on flat sites and on hills. No sites were sampled in early-successional forest stands on hills because such stands are rare in our study area, since local farmers generally prefer flat areas for slash and burn agriculture. Since the environment that plants experience and competitive interactions are influenced by plant size, and to maximize the detection of size-dependent signals of assembly processes, we restricted our analysis to data from individuals with 1 to 2.5 cm in DBH (hereafter called small trees), and individuals with DBH > 5 cm (hereafter called large trees). These groups differed significantly in height (Mann Whitney, p < 0.0001, Table S1). The group of small trees corresponds mostly to the sapling or juvenile ontogenetic phase, while the group of large trees comprises adult trees and some juveniles.
For large trees, the selected species represent 90.95% ± 9.48% (mean ± standard deviation) of the total richness per plot [46], whereas for small trees they represent 83.81% ± 11.87% (Table S2). To explore the potential effect of unrepresentative samples, we performed a second analysis for small trees including only those plots with at least 80% of species (159 plots), and obtained qualitatively similar results, so we present results from all plots (236 for small trees and 264 for large trees excluding all plots with less than 3 species, which is the minimum size required to calculate the functional indices).

2.3. Functional Traits

Regardless of vegetation class, during the rainy months (August–November) of 2011 and 2012 we obtained samples from at least 5 individuals per species (15 individuals per species on average, 664 individuals in total). We collected 3 to 5 young, healthy, and completely expanded leaves from sun-exposed branches of each individual. Fresh weight of each leaf was determined to 0.001 g using a digital scale (Mettler Toledo PB4002-S/FACT, OH, USA), and each leaf was digitized using a flatbed scanner, oven-dried at ~60 °C for three days, and weighed again. Petiole length and minimal photosynthetic unit (leaf or leaflet area as an average of ten leaflets) were measured with the software ImageJ 1.47b [47]. Specific leaf area (leaf area/dry matter) and leaf dry matter content (leaf dry mass/leaf fresh mass) were calculated using standard methods [48].
Wood specific gravity was obtained from 4 individuals per species regardless of vegetation class (average DBH was 16.4 cm). A sample was taken from cortex to pith at 1.3 m height using a 5 mm diameter core borer, and samples were cut every centimeter for a more accurate calculation [49]. Green volume was measured using the water displacement method. Samples were oven dried at 100 °C and weighed on an analytical scale (Ohaus Adventurer AP 2140, Parsippany, NJ, USA). Dry weight of each sample was divided over its green volume to obtain wood specific gravity. A weighted average per sampled tree was calculated weighing each core section by the cross-sectional area of the corresponding trunk [49,50].
In addition, we obtained the following traits from field specimens, from a parataxonomist and from the literature: Leaf compoundness (0 = simple, 1 = compound); leaf pulvination (0 = absent, 1 = present); leaf pubescence (0 = absent, 1 = present), dispersal syndrome (0 = abiotic, 1 = biotic); plant exudates (0 = absent, 1 = present), plant spininess (0 = absent, 1 = present) and leaf deciduousness (0 = evergreen, 1 = deciduous). The functional role of all traits is shown in Table 1.

2.4. Statistical Analyses

2.4.1. Functional Indices

Functional Richness (FRic) is the volume delimited by the smallest convex hull drawn around the species positioned on trait axes according to their trait values [32]. Functional Divergence (FDiv) is the functional distance among the most abundant species [20,21]. Functional Evenness (FEve) is the degree to which the biomass of a community is distributed in niche space [29] (see Table 2 for details).
Before calculating functional indices, we applied a log10 transformation to those traits that departed from normality (minimal photosynthetic unit and petiole length) as recommended by Swenson [52]. Because all traits considered were numeric, we standardized trait values and obtained Euclidean distances among species from a species x traits matrix. FEve was calculated using this distance matrix. The calculation of the convex hull for FRic and FDiv requires more points (species) than dimensions (traits). Since this was not always the case for every plot, we used principal coordinate analysis (PCoA) with a correction for negative eigenvalues [53], and used PCoA axes as traits, to reduce their number [54]. The number of PCoA axes used as traits (T) was:
T = Smin − 1
where Smin is the number of species in the community with the fewest species. This entails a reduction in dimensionality, and a concomitant loss of information, which was quantified via the R2-like ratio in PCoA [54].
The three diversity measures were calculated separately for large trees (plants > 5 cm DBH) and small trees (DBH between 1 and 2.5 cm). All diversity indices were based on the number of selected species per plot, which was tightly correlated with the total number of species per plot (Pearson correlation 0.97, p < 0.0001). We calculated functional richness (FRic) [32] and functional divergence (FDiv) [28] with FD package [55], and FEve [29] with function FeveR in R software [56].
To evaluate how functional components vary as a function of secondary succession, we performed linear or logarithmic regressions with successional age. We selected as the best model the one with the highest R2. When the difference was less than 1%, we selected the linear model.

2.4.2. Null Models

To account for variation in species richness among plots and vegetation classes, and to assess if functional indices obtained per plot differed from random, we constructed null models (by shuffling species names on the trait data matrix) and re-calculated functional components 999 times. These null models maintained the observed patterns of trait co-variance, and changed only the trait matrix, keeping the number of species and their abundance in each plot. To assess if the observed FRic, FDiv and FEve differed significantly from random variation among plots of different successional age and topographical position, we used the two-tailed Wilcoxon signed-ranks test per vegetation class to test our empirical data against the expectation from the null model. To assess the direction of the deviation of observed values from those expected by chance, while accounting for variation in species richness among vegetation categories, we calculated for each plot (i) the standardized effect size (SES) as:
SESi = (observed value in plot i − mean of null model in plot i)/standard deviation of null model in plot i
where positive values indicate an observed value higher than the average expected value and negative values indicate an observed value lower than the average expected value [52]. We compared the average SES of each functional index among vegetation classes using ANOVA and Tukey’s post hoc test.

3. Results

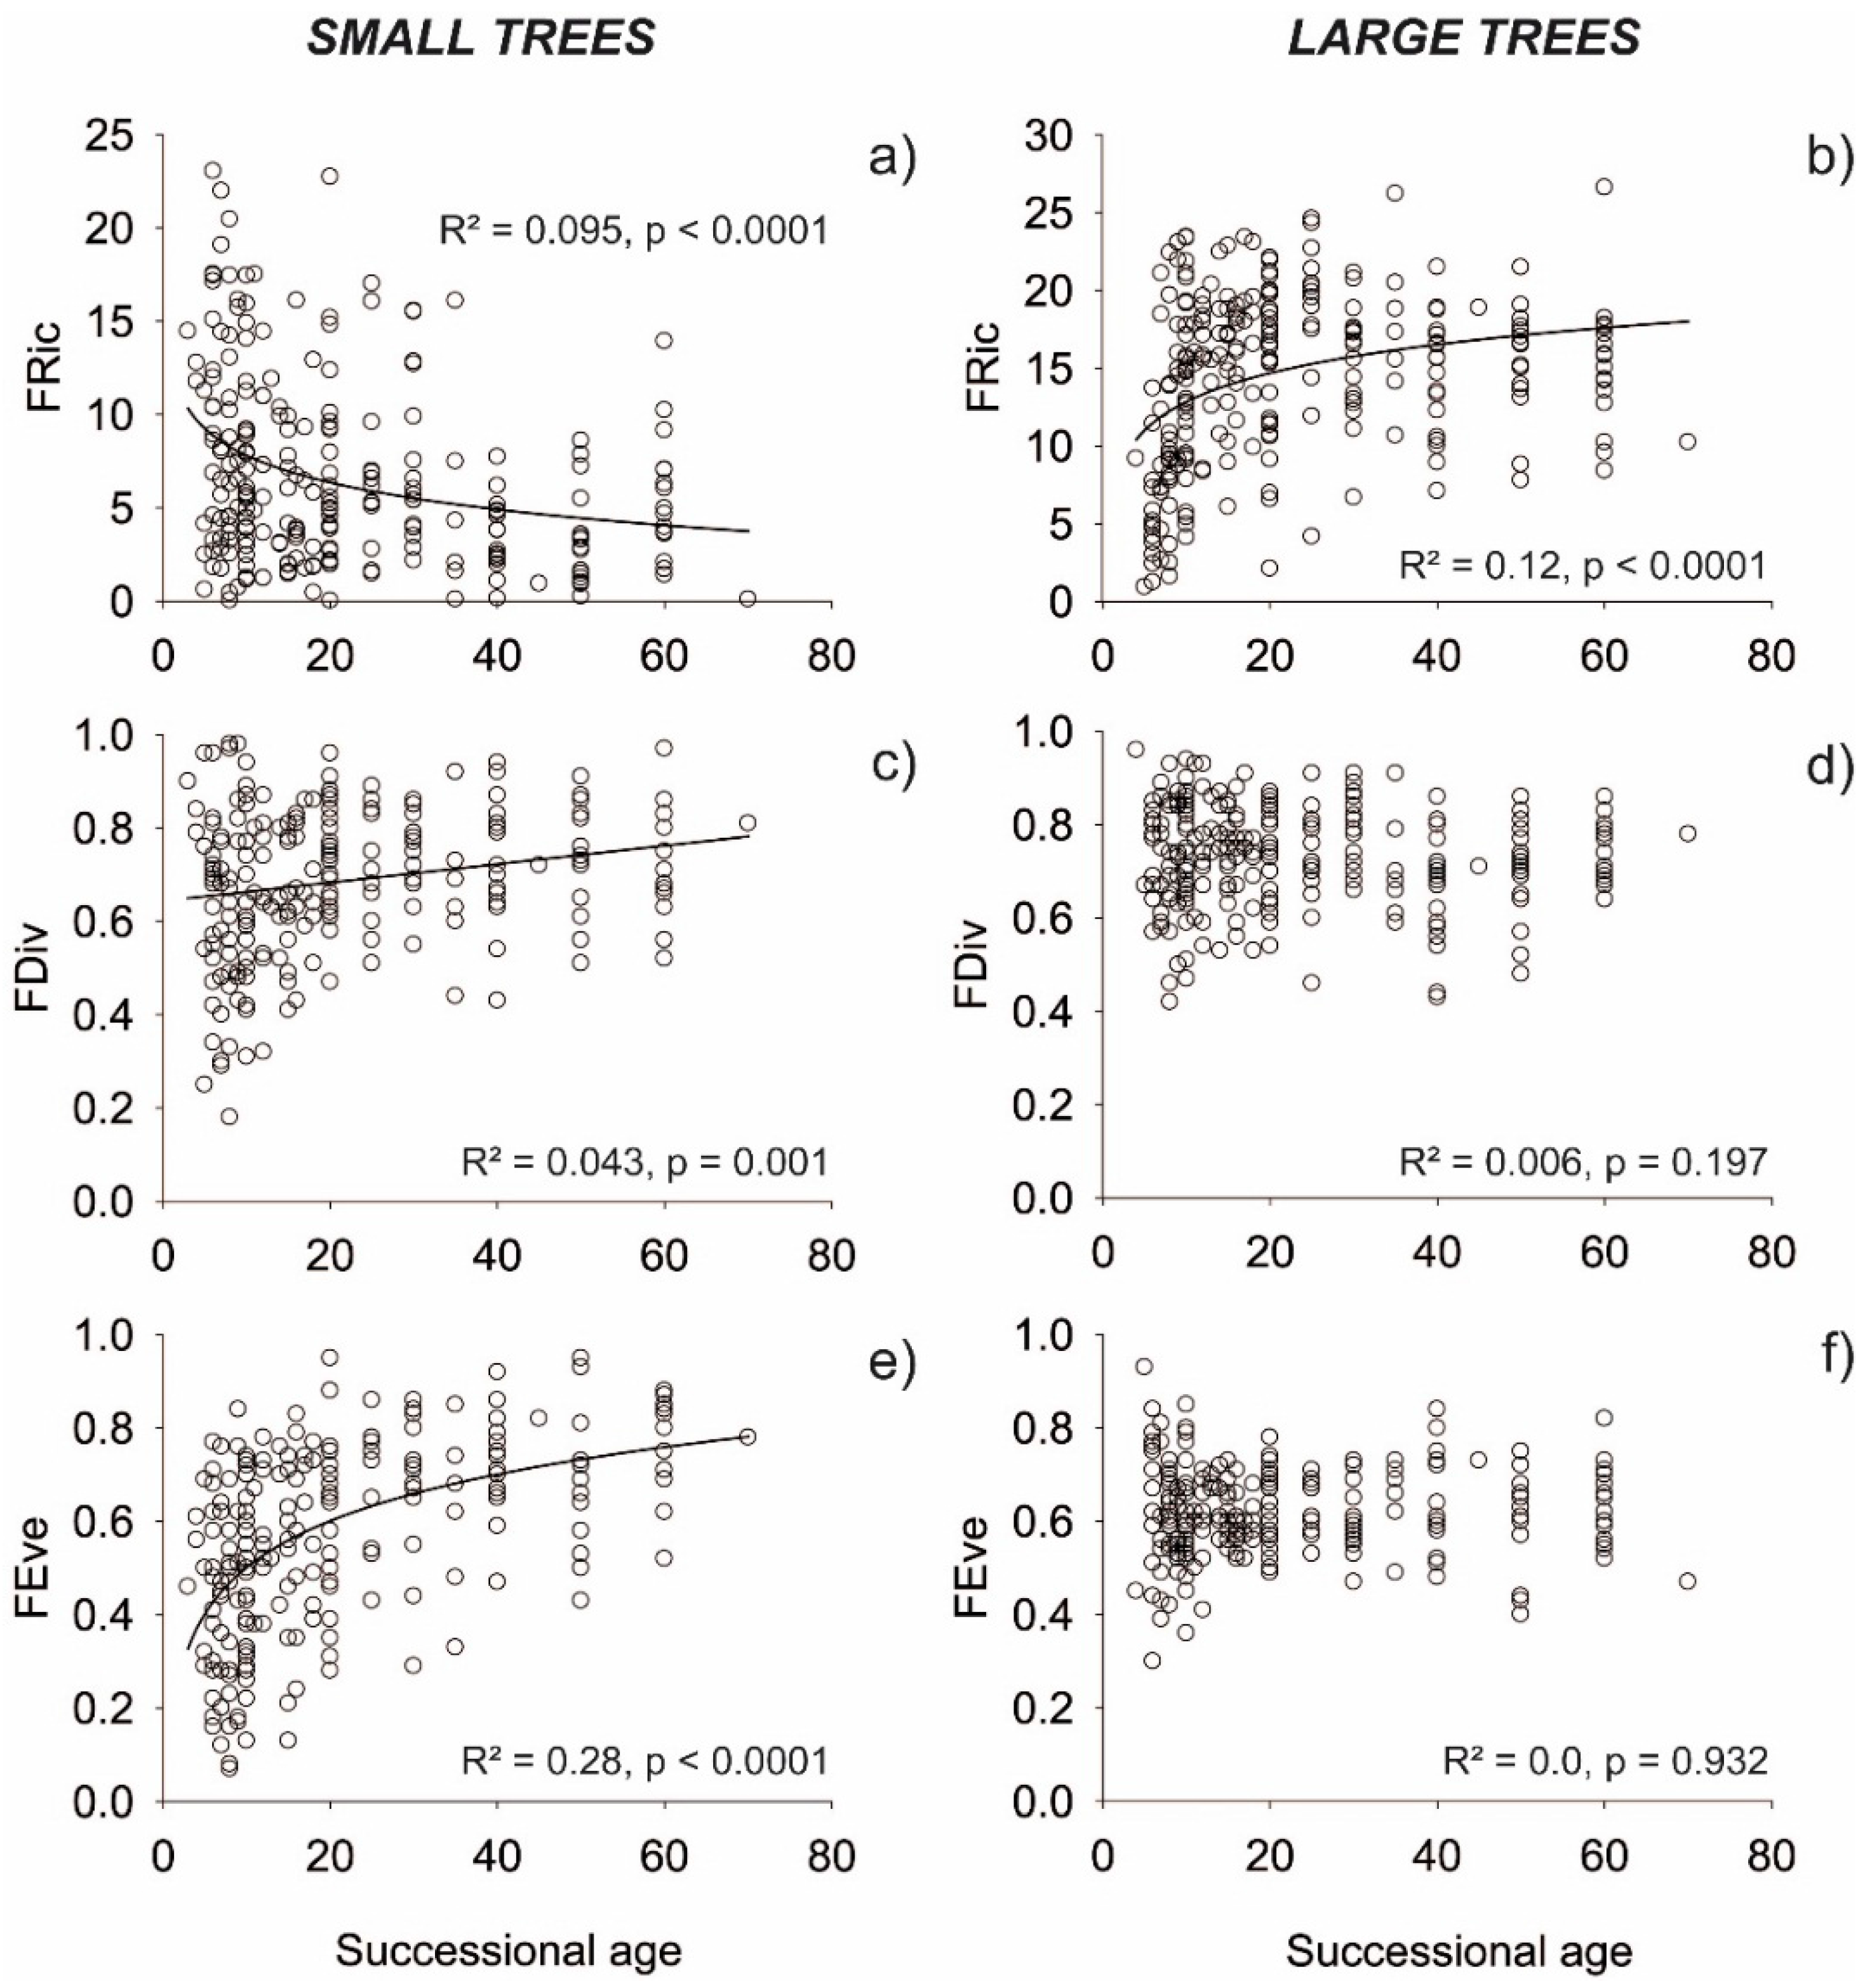
3.1. Functional Indices
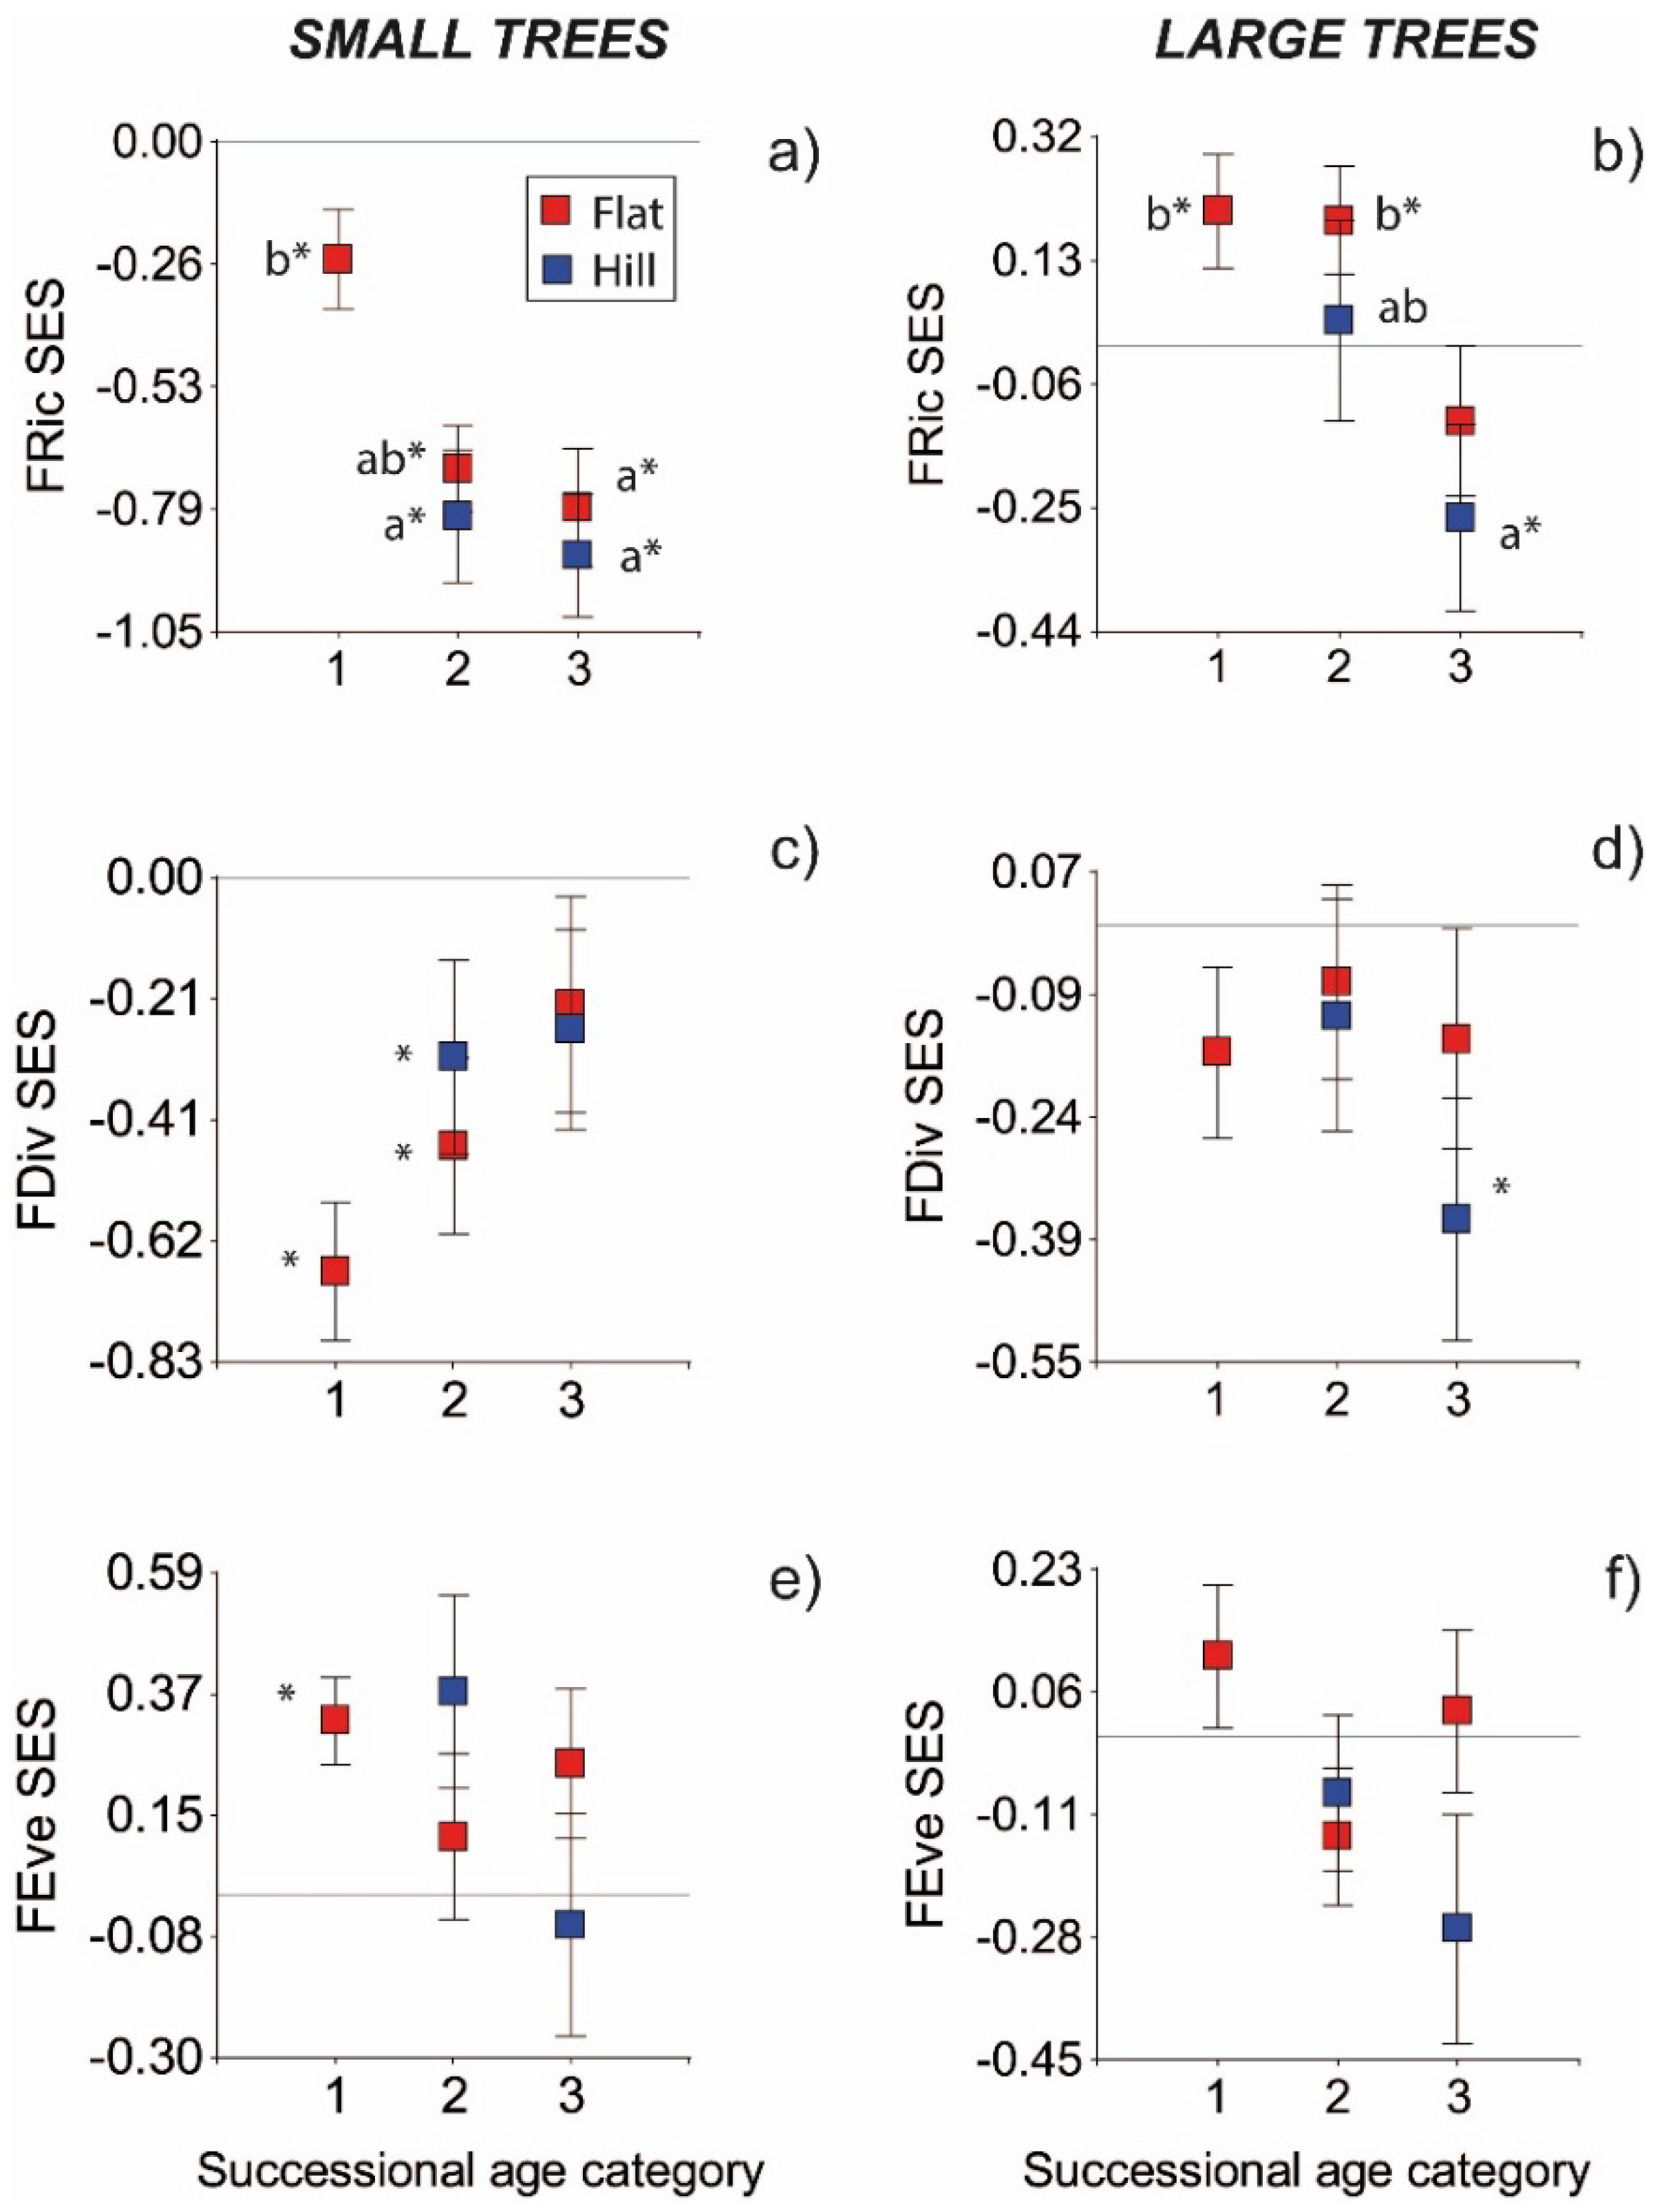
Principal Coordinates Analysis (PCoA) accounted for over half of the variation in functional traits of both small and large trees (54.3%). Successional age generally explained a low percentage of variation of functional indices for small trees (4%–28%) and of FRic for large trees (12%). Functional richness (FRic) of small trees decreased logarithmically with fallow time, while for large trees FRic increased logarithmically with successional age and saturated at older ages (Figure 1a,b). For small trees FDiv increased linearly, while FEve increased logarithmically with successional age, whereas for large trees neither index showed any association with successional age (Figure 1c–f).

3.2. Null Models

For small trees, we found that FRic differed significantly from null model expected values in all successional ages and topographic positions, while FDiv differed from the null model only in successional ages 1 and 2 and FEve only in age 1 (Table 3). For small trees mean FRic and FDiv that differed from null model expected values (indicated by asterisks in Figure 2) were consistently lower than expected by chance (i.e., negative values), while mean FEve that differed from null model was higher than expected by chance (positive) (Figure 2a,c,e). Additionally, mean FRic SES of intermediate and late successional classes were significantly lower compared to the early successional class (ANOVA, F4,231 = 5.77, p = 0.0002) (Figure 2a). SES values of FDiv and FEve did not differ among successional age/topographic classes (F4,231 = 1.77, p = 0.135 and F4,231 = 1.31, p = 0.268 respectively).
For large trees, mean FRic differed significantly from null model values in early and intermediate successional classes on flat sites, and in the late successional class on hills (Table 3, Figure 2b). Mean FDiv only differed significantly from null model values in the late successional class on hills (Table 3, Figure 2d), while mean FEve did not differ from null model values in any successional/topographic class (Figure 2f). Mean FRic SES values that differed from null model (indicated by asterisks in Figure 2b) were higher than expected by chance at early and intermediate age classes, but lower than expected by chance in the late successional class on hills (and differed significantly among classes, ANOVA, F4,258 = 3.26, p = 0.013, Figure 2b). Mean FDiv SES values were significantly lower than expected by chance (Figure 2d) only in the late successional class on hills (Figure 2d).

4. Discussion

We found that variation in functional diversity of trees in the tropical dry forest studied was influenced by successional age and topographic position, and that patterns of functional variation differed between small (DBH 1–2.5 cm) and large trees (DBH > 5 cm), depending on the functional component considered. Examining SES values and their departure from null models (Figure 2), our results generally do not support our first prediction that FRic would be lower early in succession and on hills than in late successional forests and in flat areas. This prediction was based on previous findings in tropical dry forests showing that, (1) compared to late-successional forests, early successional stages experience higher irradiance, and warmer and drier conditions, [12,13]; and (2) hill tops and slopes have lower water availability than flat areas [18,19,20]. We found evidence of environmental filtering only for large trees in late-successional forests on hills (Figure 2b), probably due to the effect of lower soil water availability [18,19,20]. However, our results also suggest a thorough use of resources by large trees in early successional and intermediate forests (3 to 25 years old) on flat sites, reflecting maximum variation in ecological strategies and positive FRic values (Figure 2b), probably due to the coexistence of pioneers, generalists and (resprouts of) old-growth forest specialists. Moreover, small trees face unfavorable conditions (negative FRic SES values) in the complete successional/topographical gradient, and a stronger signal of environmental filtering at intermediate and late successional ages (Figure 2a). We believe that this successional trend may have resulted from two possibilities.
(1)
Relatively higher FRic values early in succession may reflect the coexistence of acquisitive and conservative species that show different constellations of functional traits in young stands. Pioneers (which represent the conservative strategy in dry forests) may establish from seeds of nearby forests (since slash-and-burn agriculture may destroy the seed bank) [57], whereas more acquisitive shade-tolerant species may avoid unfavorable conditions for seed establishment by getting established mainly from resprouts [58]. The subsequent reduction in FRic over succession may result from environmental filtering associated with lower light and air evaporative demand, which would decrease the success of the conservative species [14].
(2)
Alternatively, modern coexistence theory states that functional convergence results not only form environmental filtering, but also from competitive exclusion based on hierarchical competitive abilities among species [59,60]. The Functional Richness index may thus reflect the combined effect of both environmental filtering and competitive processes [60]. In line with this, early in succession negative FRic values of small trees may reflect the effect of environmental filters (high irradiance load, air temperature and evaporative demand), whereas at latter successional ages the lower FRic values may reflect the elimination of poor competitors [60]. Competitive hierarchy of species can be determined by multiple factors, but in a dry forests it may be defined mostly by water availability, which is the most limiting resource [2]. Previous studies of microenvironment in tropical dry forests have shown that soil water content increases with successional age, as radiation load and air evaporative demand decrease with canopy development [11,12,13]. However, other studies have found a steady and sometimes marked increase in fine root biomass along succession [61,62], but see [63], and a decrease in soil water potential [12]. Theoretically, the increasing importance of soil drying by transpiration as canopy closes and forests mature [64] could be a sign of stronger competitive processes, if plants pre-empt water supply from coming in contact with other species (which may be considered as a filter), or if they reduce soil water potential to low levels [65]. The effect of below-ground competition on soil water availability has been poorly quantified [65]. The relative importance of soil drying by evaporation vs. transpiration during dry forests succession, and its effects on tree community assembly need further investigation.
In agreement with our second prediction, FRic SES values were consistently lower for small trees than for large trees (see values of y axes in Figure 2a,b). The latter result also agrees with previous findings showing that the strongest filters to species establishment occur at early life stages when plants are smaller [35], although our small tree category corresponds to saplings and juveniles, which are not the most sensitive ontogenetic stage (i.e., seedlings). Differences in tree size may represent differences both in microenvironments and in competitive abilities, with smaller plants being most susceptible to both. Larger individuals are better equipped to cope with competitors and fluctuating unfavorable conditions, such as dry spells, through a more developed root system, enabling them to forage in larger areas and to store more water and nutrients, as well as a bigger trunk allowing them to store more water and to harvest more light [66]. Alternatively, differences in FRic between small and large trees can arise from temporal fluctuations in environmental conditions suitable for reproduction and recruitment of species (i.e., the storage effect [67]). Favorable conditions could produce a strong recruitment that results in a cohort of reproductive large trees [67]. Under unfavorable conditions, many small trees could be filtered out (reducing their FRic), whereas large trees may be able to survive for many years and reproduce when more favorable conditions occur. In other words, lower FRic for small trees than for large ones would be expected under the storage effect, because large trees may comprise a larger number of cohorts. Resprouting capacity, which is generalized among the species studied (LSV pers. obs.) likely also plays a role [58].
Contrary to our third prediction (that competitive processes would be more important at intermediate and latter successional ages), FDiv showed partial evidence of environmental filtering (negative values, see Table 2) instead of competition. Negative FDiv values suggest a scarce functional differentiation of dominant species. Small trees showed negative FDiv SES values in early and intermediate successional forests suggesting that the small-sized trees capable of establishing and becoming dominant at these successional stages may share similar traits, probably associated with avoiding water loss, such as pinnate, deciduous, leaves [15]. Large trees showed negative FDiv in late successional stages on hills, suggesting that environmental filtering may reduce the functional strategies present in this environment, which is also in line with the negative values of FRic found there.
In agreement with our fourth prediction, we found signs of competition only for small trees –in early successional ages. Positive FEve SES values in the youngest successional class (Figure 2e) suggest that species with functional strategies that survive the filters disperse evenly in relation to resource use, which can be interpreted as niche partitioning by competitive exclusion. Environmental filtering is usually conceived aside of competitive processes; nonetheless both factors interact dynamically to drive community patterns [59]. Moreover, although neither FEve nor FDiv departed from null model predictions in late successional ages (contrary to our third prediction), hierarchical competitive ability (reflected by low FRic values especially at late successional ages) cannot de discarded [60].
Finally, our results, especially those of FDiv and FEve, should be taken with caution, since competition in tropical dry forests is expected to be strongest for below-ground resources (water and nutrients), which are most limiting, yet we did not consider any below-ground functional traits in this study. Further studies are needed to assess the relative importance of above-ground (light availability, air temperature) vs. below-ground (water, nutrients) resources on assembly of tree communities in tropical dry forests.

5. Conclusions

Our results clearly show that assembly patterns differ between plants of different sizes. While small-sized trees showed evidence of environmental filtering and/or competition at all successional ages and topographical positions, large-sized trees showed evidence of these assembly processes only in late successional forests on hills, indicating that the former represent a more susceptible phase of development, and that small-sized tree communities are strongly affected by the changing biotic and abiotic conditions along the successional and topographical gradient. For larger plants, late successional forests on hills represent the most stressful conditions in this landscape. Moreover, small trees showed the strongest environmental filtering (lowest functional richness) in late successional forest stands, although the few studies in tropical dry forests that have analyzed microenvironmental differences during succession suggest that the most stressful conditions (hot and dry environment) occur during the early stages of succession. Our results suggest that the functional richness index may actually reflect the combined effect of both environmental filtering and hierarchical competitive ability. Future research should test this and the possibility that relatively high soil drying by transpiration in late successional forest stands may exert a stronger effect on tree community assembly than relatively low evaporative demand.

Supplementary Materials

The following are available online at www.mdpi.com/1999-4907/7/8/163/s1, Table S1: Mean canopy and tree height per successional age category; Table S2: Total species richness and percentage of species included per plot; Table S3: Observed and null model values of Functional Indices and Standardized Effect Sizes per plot; Table S4: Abundance of small trees; Table S5: Abundance of large trees; Table S6: Standardized functional traits.

Acknowledgments

We thank the communities of Xkobenhaltún, Xul and Yaxhachén for allowing us to work in their lands. James Callaghan and Kaxil Kiuic A.C. provided logistic support. We are grateful to Filogonio May-Pat, Roberth Armando Us Santamaría and Luis Simá Gómez for their help with fieldwork, and to Santos Uc Uc for his help with species identification and fieldwork. We thank two anonymous reviewers for their insightful comments that greatly improved this paper. Financial support was provided by FOMIX-Yucatán (YUC-2008-C06-108863); LSV also acknowledges CONACYT, Mexico, for the grant awarded (169510).

Author Contributions

L.S.V. conceived, designed and performed the sampling, processed and analyzed the data, discussed results and wrote the paper; J.M.D. conceived and designed the sampling, discussed results and wrote the paper; J.L.A., C.R.G., H.P. and P.C.J. discussed results and reviewed drafts of the paper.

Conflicts of Interest

The authors declare no conflict of interest. The founding sponsors had no role in the design of the study; in the collection, analyses, or interpretation of data; in the writing of the manuscript, and in the decision to publish the results.

Abbreviations

The following abbreviations are used in this manuscript:
DOAJDirectory of open access journals
PCoAPrincipal Coordinate Analysis
FRicFunctional Richness
FDivFunctional Divergence
FEveFunctional Evenness
SESStandard Effect Size

References

  1. Gerhardt, K.; Hytteborn, H. Natural dynamics and regeneration methods in tropical dry forests—An introduction. J. Veg. Sci. 1992, 3, 361–364. [Google Scholar]
  2. Murphy, P.G.; Lugo, A.E. Ecology of tropical dry forest. Annu. Rev. Ecol. Syst. 1986, 17, 67–88. [Google Scholar]
  3. Sanchez-Azofeifa, G.A.; Quesada, M.; Rodriguez, J.P.; Nassar, J.M.; Stoner, K.E.; Castillo, A.; Garvin, T.; Zent, E.L.; Calvo-Alvarado, J.C.; Kalacska, M.E.R.; et al. Research Priorities for Neotropical Dry Forests. Biotropica 2005, 37, 477–485. [Google Scholar]
  4. Miles, L.; Newton, A.C.; DeFries, R.S.; Ravilious, C.; May, I.; Blyth, S.; Kapos, V.; Gordon, J.E. A global overview of the conservation status of tropical dry forests. J. Biogeogr. 2006, 33, 491–505. [Google Scholar]
  5. Quesada, M.; Sanchez-Azofeifa, G.A.; Alvarez-Añorve, M.; Stoner, K.E.; Avila-Cabadilla, L.; Calvo-Alvarado, J.; Castillo, A.; Espírito-Santo, M.M.; Fagundes, M.; Fernandes, G.W.; et al. Succession and management of tropical dry forests in the Americas: Review and new perspectives. For. Ecol. Manag. 2009, 258, 1014–1024. [Google Scholar]
  6. Kennard, D.K. Secondary forest succession in a tropical dry forest: Patterns of development across a 50-year chronosequence in lowland Bolivia. J. Trop. Ecol. 2002, 18, 53–66. [Google Scholar]
  7. Madeira, B.G.; Espírito-Santo, M.M.; Neto, S.D.; Nunes, Y.R.F.; Arturo Sánchez Azofeifa, G.; Wilson Fernandes, G.; Quesada, M. Changes in tree and liana communities along a successional gradient in a tropical dry forest in south-eastern Brazil. Plant Ecol. 2009, 201, 291–304. [Google Scholar]
  8. Lebrija-Trejos, E.; Meave, J.A.; Poorter, L.; Pérez-García, E.A.; Bongers, F. Pathways, mechanisms and predictability of vegetation change during tropical dry forest succession. Perspect. Plant Ecol. Evol. Syst. 2010, 12, 267–275. [Google Scholar]
  9. Alvarez-Añorve, M.Y.; Quesada, M.; Sanchez-Azofeifa, G.A.; Avila-Cabadilla, L.D.; Gamon, J.A. Functional regeneration and spectral reflectance of trees during succession in a highly diverse tropical dry forest ecosystem. Am. J. Bot. 2012, 99, 816–826. [Google Scholar]
  10. Williams-Linera, G.; Alvarez-Aquino, C.; Hernández-Ascención, E.; Toledo, M. Early successional sites and the recovery of vegetation structure and tree species of the tropical dry forest in Veracruz, Mexico. New For. 2011, 42, 131–148. [Google Scholar]
  11. Buzzard, V.; Hulshof, C.M.; Birt, T.; Violle, C.; Enquist, B.J. Re-growing a tropical dry forest: Functional plant trait composition and community assembly during succession. Funct. Ecol. 2015. [Google Scholar] [CrossRef]
  12. Lebrija-Trejos, E.; Pérez-García, E.A.; Meave, J.A.; Poorter, L.; Bongers, F. Environmental changes during secondary succession in a tropical dry forest in Mexico. J. Trop. Ecol. 2011, 27, 477–489. [Google Scholar]
  13. Pineda-García, F.; Paz, H.; Meinzer, F.C. Drought resistance in early and late secondary successional species from a tropical dry forest: The interplay between xylem resistance to embolism, sapwood water storage and leaf shedding. Plant Cell Environ. 2013, 36, 405–418. [Google Scholar]
  14. Lebrija-Trejos, E.; Pérez-García, E.A.; Meave, J.A.; Bongers, F.; Poorter, L. Functional traits and environmental filtering drive community assembly in a species-rich tropical system. Ecology 2010, 91, 386–398. [Google Scholar]
  15. Lohbeck, M.; Poorter, L.; Lebrija-Trejos, E.; Martínez-Ramos, M.; Meave, J.A.; Paz, H.; Pérez-García, E.A.; Romero-Pérez, I.E.; Tauro, A.; Bongers, F. Successional changes in functional composition contrast for dry and wet tropical forest. Ecology 2013, 94, 1211–1216. [Google Scholar]
  16. Lohbeck, M.; Lebrija-Trejos, E.; Martínez-Ramos, M.; Meave, J.A.; Poorter, L.; Bongers, F. Functional trait strategies of trees in dry and wet tropical forests are similar but differ in their consequences for succession. PLoS ONE 2015, 10, e0123741. [Google Scholar] [CrossRef]
  17. Purschke, O.; Schmid, B.C.; Sykes, M.T.; Poschlod, P.; Michalski, S.G.; Durka, W.; Kühn, I.; Winter, M.; Prentice, H.C. Contrasting changes in taxonomic, phylogenetic and functional diversity during a long-term succession: Insights into assembly processes. J. Ecol. 2013, 101, 857–866. [Google Scholar]
  18. Becker, P.; Rabenold, P.E.; Idol, J.R.; Smith, A.P. Water potential gradients for gaps and slopes in a Panamanian tropical moist forest’s dry season. J. Trop. Ecol. 1988, 4, 173–184. [Google Scholar]
  19. Gallardo-Cruz, J.A.; Pérez-García, E.A.; Meave, J.A. β-Diversity and vegetation structure as influenced by slope aspect and altitude in a seasonally dry tropical landscape. Landsc. Ecol. 2009, 24, 473–482. [Google Scholar]
  20. Markesteijn, L.; Iraipi, J.; Bongers, F.; Poorter, L. Seasonal variation in soil and plant water potentials in a Bolivian tropical moist and dry forest. J. Trop. Ecol. 2010, 26, 497–508. [Google Scholar]
  21. Schwinning, S.; Weiner, J. Mechanisms Determining the Degree of Size Asymmetry in Competition among Plants. Oecologia 1998, 113, 447–455. [Google Scholar]
  22. Cavender-Bares, J.; Kitajima, K.; Bazzaz, F.A. Multiple trait associations in relation to habitat differentiation among 17 Floridian oak species. Ecol. Monogr. 2004, 74, 635–662. [Google Scholar]
  23. Mason, N.W.H.; Lanoiselée, C.; Mouillot, D.; Wilson, J.B.; Argillier, C. Does niche overlap control relative abundance in French lacustrine fish communities? A new method incorporating functional traits. J. Anim. Ecol. 2008, 77, 661–669. [Google Scholar]
  24. Mouchet, M.A.; Villéger, S.; Mason, N.W.H.; Mouillot, D. Functional diversity measures: An overview of their redundancy and their ability to discriminate community assembly rules. Funct. Ecol. 2010, 24, 867–876. [Google Scholar]
  25. Weiher, E.; Keddy, P.A. Assembly Rules, Null Models, and Trait Dispersion: New Questions from Old Patterns. Oikos 1995, 74, 159–164. [Google Scholar]
  26. Tilman, D. The importance of the mechanisms of interspecific competition. Am. Nat. 1987, 129, 769–774. [Google Scholar]
  27. Mason, N.W.; Mouillot, D.; Lee, W.G.; Wilson, J.B. Functional richness, functional evenness and functional divergence: The primary components of functional diversity. Oikos 2005, 111, 112–118. [Google Scholar]
  28. Villéger, S.; Mason, N.W.; Mouillot, D. New multidimensional functional diversity indices for a multifaceted framework in functional ecology. Ecology 2008, 89, 2290–2301. [Google Scholar]
  29. Ricotta, C.; Bacaro, G.; Moretti, M. A New Measure of Functional Evenness and Some of Its Properties. PLoS ONE 2014, 9, e104060. [Google Scholar] [CrossRef]
  30. Keddy, P.A. Assembly and response rules: Two goals for predictive community ecology. J. Veg. Sci. 1992, 3, 157–164. [Google Scholar]
  31. Weiher, E.; Clarke, G.D.P.; Keddy, P.A. Community Assembly Rules, Morphological Dispersion, and the Coexistence of Plant Species. Oikos 1998, 81, 309–322. [Google Scholar]
  32. Cornwell, W.K.; Schwilk, D.W.; Ackerly, D.D. A trait-based test for habitat filtering: Convex hull volume. Ecology 2006, 87, 1465–1471. [Google Scholar]
  33. Kraft, N.J.B.; Valencia, R.; Ackerly, D.D. Functional Traits and Niche-Based Tree Community Assembly in an Amazonian Forest. Science 2008, 322, 580–582. [Google Scholar]
  34. Macarthur, R.; Levins, R. The Limiting Similarity, Convergence, and Divergence of Coexisting Species. Am. Nat. 1967, 101, 377–385. [Google Scholar]
  35. Grubb, P.J. The maintenance of species-richness in plant communities: The importance of the regeneration niche. Biol. Rev. 1977, 52, 107–145. [Google Scholar]
  36. García, E. Modificaciones al Sistema de Clasificación Climática de Köppen (para Adaptarlo a las Condiciones de la República Mexicana); Instituto de Geografía Universidad Nacional Autónoma de México: Mexico DF, Mexico, 1981. [Google Scholar]
  37. Orellana, R.; Islebe, G.A.; González-Iturbe, J.A. Presente, pasado y futuro de los climas de la Península de Yucatán. In Naturaleza y Sociedad en el Área Maya; Colunga-García Marín, P., Larqué Saavedra, A., Eds.; Academia Mexicana de Ciencias, Centro de Investigación Científica de Yucatán: Mérida, Yucatán, Mexico, 2003; pp. 37–52. [Google Scholar]
  38. Flores, J.S.; Espejel, I. Tipos de Vegetación de la Península de Yucatán; Flores, J.S., Ed.; Etnoflora Yucatanense, Universidad Autónoma de Yucatán: Mérida, Yucatán, Mexico, 1994. [Google Scholar]
  39. Bautista-Zúñiga, F.; Batllori-Sampedro, E.; Ortiz-Pérez, M.A.; Palacio-Aponte, G.; Castillo-González, M. Geoformas, agua y suelo en la Península de Yucatán. In Naturaleza y sociedad en el área maya: Pasado, Presente y Futuro; Colunga, P., Larque, A., Eds.; Academia Mexicana de Ciencias y Centro de Investigación Científica de Yucatán: Mérida, Yucatán, Mexico, 2003; pp. 21–35. [Google Scholar]
  40. Dupuy, J.M.; Hernández-Stefanoni, J.L.; Hernández-Juárez, R.A.; Tetetla-Rangel, E.; López-Martínez, J.O.; Leyequién-Abarca, E.; Tun-Dzul, F.J.; May-Pat, F. Patterns and Correlates of Tropical Dry Forest Structure and Composition in a Highly Replicated Chronosequence in Yucatan, Mexico. Biotropica 2012, 44, 151–162. [Google Scholar]
  41. Rico-Gray, V.; García-Franco, J.G. The Maya and the vegetation of the Yucatan Peninsula. J. Ethnobiol. 1991, 11, 135–142. [Google Scholar]
  42. Hernández-Stefanoni, J.L.; Dupuy, J.M. Effects of landscape patterns on species density and abundance of trees in a tropical subdeciduous forest of the Yucatan Peninsula. For. Ecol. Manag. 2008, 255, 3797–3805. [Google Scholar]
  43. Hernández-Stefanoni, J.L.; Pineda, J.B.; Valdes-Valadez, G. Comparing the Use of Indigenous Knowledge with Classification and Ordination Techniques for Assessing the Species Composition and Structure of Vegetation in a Tropical Forest. Environ. Manag. 2006, 37, 686–702. [Google Scholar]
  44. Hernández-Stefanoni, J.L.; Dupuy, J.M.; Tun-Dzul, F.; May-Pat, F. Influence of landscape structure and stand age on species density and biomass of a tropical dry forest across spatial scales. Landsc. Ecol. 2011, 26, 355–370. [Google Scholar]
  45. Turner, B.L., II; Villar, S.C.; Foster, D.; Geoghegan, J.; Keys, E.; Klepeis, P.; Lawrence, D.; Mendoza, P.M.; Manson, S.; Ogneva-Himmelberger, Y. Others Deforestation in the southern Yucatán peninsular region: An integrative approach. For. Ecol. Manag. 2001, 154, 353–370. [Google Scholar]
  46. Pakeman, R.J.; Quested, H.M. Sampling plant functional traits: What proportion of the species need to be measured? Appl. Veg. Sci. 2007, 10, 91–96. [Google Scholar]
  47. Rasband, W.S. ImageJ; National Institutes of Health: Bethesda, MD, USA, 2014. [Google Scholar]
  48. Cornelissen, J.H.C.; Lavorel, S.; Garnier, E.; Díaz, S.; Buchmann, N.; Gurvich, D.E.; Reich, P.B.; ter Steege, H.; Morgan, H.D.; van der Heijden, M.G.A.; et al. A handbook of protocols for standardised and easy measurement of plant functional traits worldwide. Aust. J. Bot. 2003, 51, 335–380. [Google Scholar]
  49. Williamson, G.B.; Wiemann, M.C. Measuring wood specific gravity...Correctly. Am. J. Bot. 2010, 97, 519–524. [Google Scholar]
  50. Muller-Landau, H.C. Interspecific and inter-site variation in wood specific gravity of tropical trees. Biotropica 2004, 36, 20–32. [Google Scholar]
  51. Grime, J.P. Trait convergence and trait divergence in herbaceous plant communities: Mechanisms and consequences. J. Veg. Sci. 2006, 17, 255–260. [Google Scholar]
  52. Swenson, N.G. Functional and Phylogenetic Ecology in R; Springer: New York, NY, USA, 2014. [Google Scholar]
  53. Cailliez, F. The analytical solution of the additive constant problem. Psychometrika 1983, 48, 305–308. [Google Scholar]
  54. Laliberté, E.; Legendre, P. A distance-based framework for measuring functional diversity from multiple traits. Ecology 2010, 91, 299–305. [Google Scholar]
  55. Laliberté, E.; Legendre, P.; Shipley, B. FD: Measuring functional diversity from multiple traits, and other tools for functional ecology. Available online: https://cran.r-project.org/web/packages/FD/FD.pdf (accessed on 27 July 2016).
  56. R Development Core Team. R: A language and Environment for Statistical Computing; R Foundation for Statistical Computing: Viena, Austria, 2015. [Google Scholar]
  57. Dalling, J.W.; Denslow, J.S. Soil seed bank composition along a forest chronosequence in seasonally moist tropical forest, Panama. J. Veg. Sci. 1998, 9, 669–678. [Google Scholar]
  58. Kammesheidt, L. Forest recovery by root suckers and above-ground sprouts after slash-and-burn agriculture, fire and logging in Paraguay and Venezuela. J. Trop. Ecol. 1999, 15, 143–157. [Google Scholar]
  59. Kraft, N.J.B.; Adler, P.B.; Godoy, O.; James, E.C.; Fuller, S.; Levine, J.M. Community assembly, coexistence and the environmental filtering metaphor. Funct. Ecol. 2015, 29, 592–599. [Google Scholar]
  60. Mayfield, M.M.; Levine, J.M. Opposing effects of competitive exclusion on the phylogenetic structure of communities: Phylogeny and coexistence. Ecol. Lett. 2010, 13, 1085–1093. [Google Scholar]
  61. Vargas, R.; Allen, M.F.; Allen, E.B. Biomass and carbon accumulation in a fire chronosequence of a seasonally dry tropical forest. Glob. Chang. Biol. 2008, 14, 109–124. [Google Scholar]
  62. Deans, J.D.; Moran, J.; Grace, J. Biomass relationships for tree species in regenerating semi-deciduous tropical moist forest in Cameroon. For. Ecol. Manag. 1996, 88, 215–225. [Google Scholar]
  63. Powers, J.S.; Peréz-Aviles, D. Edaphic factors are a more important control on surface fine roots than stand age in secondary tropical dry forests. Biotropica 2013, 45, 1–9. [Google Scholar]
  64. Marthews, T.R.; Burslem, D.F.R.P.; Paton, S.R.; Yangüez, F.; Mullins, C.E. Soil drying in a tropical forest: Three distinct environments controlled by gap size. Ecol. Model. 2008, 216, 369–384. [Google Scholar]
  65. Craine, J.M.; Dybzinski, R. Mechanisms of plant competition for nutrients, water and light. Funct. Ecol. 2013, 27, 833–840. [Google Scholar]
  66. Niinemets, Ü. Responses of forest trees to single and multiple environmental stresses from seedlings to mature plants: Past stress history, stress interactions, tolerance and acclimation. For. Ecol. Manag. 2010, 260, 1623–1639. [Google Scholar]
  67. Warner, R.R.; Chesson, P.L. Coexistence mediated by recruitment fluctuations: A field guide to the storage effect. Am. Nat. 1985, 125, 769–787. [Google Scholar]
Figure 1. Variation of functional diversity components in relation to successional age. (a) Functional Richness (FRic) of small trees; (b) Functional Richness of large trees; (c) Functional Divergence (FDiv) of small trees; (d) Functional Divergence of large trees; (e) Functional Evenness (FEve) of small trees; (f) Functional Evenness of large trees. Regression coefficients and significance values are shown.
Forests 07 00163 g001
Figure 2. Mean Standardized Effect Size (SES) of observed functional diversity components (and standard error) in relation to null model randomizations by successional age category. (a) FRic SES of small trees; (b) FRic SES of large trees; (c) FDiv SES of small trees; (d) FDiv SES of large trees; (e) FEve SES of small trees; (f) FEve SES of large trees. Means with different letters are significantly different (p < 0.05). Horizontal lines indicate mean Standardized Effect Size (SES) equal to zero (the mean of 999 randomizations). Successional age category and number of plots for small/large trees: 1 Flat (3 to 10 years) = 85/83; 2 Flat (11 to 25 years) = 52/66; 2 Hill (11 to 25 years) = 29/30; 3 Flat (26 to 70 years) = 39/52; 3 Hill (26 to 60 years) = 31/32. Asterisks denote mean FRic, FDiv or FEve (not SES) values that differ significantly from null models (see Table 3).
Forests 07 00163 g002
Table 1. Functional traits employed in this study and their functional role.
Plant TraitFunctional Role
Minimal photosyntethic unitLeaf cooling
Leaf petioleLight capture efficiency
Leaf dry matter contentLeaf cost, leaf life span, herbivory defense
Specific leaf areaGrowth rate, photosynthetic rate
Leaf compoundnessLeaf cooling
Leaf deciduousnessDrought avoidance
Leaf pulvinationMinimization of photo-damage and water loss by transpiration
Leaf pubescenceHerbivory defense
Wood specific gravityGrowth rate, hydraulic conductivity and safety, mechanical resistance
Plant exudatesHerbivory defense
Plant spininessHerbivory defense
Dispersal syndromeBiotic interactions, dispersal
Table 2. Functional diversity measures employed in this study and their ecological interpretation.
Functional ComponentFormulaEcological Interpretation
Positive Values 1Negative Values 1
Richness (FRic) [28,32]Quickhull algorithm. Volume of the minimal convex hull, which includes all the species considered in the community.Favorable conditions that allow multiple combinations of traits and a more thorough use of the resources available [28,32].Environmental filtering favoring a narrow range of functional traits [28,32].
Divergence (FDiv) (abundance-weighted) [28] F D i v = Δ d + d G ¯ Δ | d | + d G ¯
where Δ d is the sum of abundance-weighted deviances from the center of gravity; Δ | d | is the absolute abundance-weighted deviances from the center of gravity, and d G ¯ is the mean distance of the S species to the center of gravity.
The most abundant species have extreme functional trait values, reflecting either niche partitioning by competitive exclusion, or local environmental heterogeneity favoring different ecological strategies [27].Environmental filtering favoring a narrow range of functional traits, resulting in little functional differentiation among dominant species [28].
Evenness (FEve)(Abundance-weighted) [29]The average community uniqueness U is the expected dissimilarity between one individual of species i chosen at random from a given community and all other j species in the community:
U = j i N p i × U i = i N p i j i N p j 1 p i d i j
where dij is the functional dissimilarity between species i and j; p is the relative abundance of species i or j, and U+ is the weighted dissimilarity between species i and all other species in the community.
Functional evenness is the regularity in the distribution of single species contributions to U. With the relative contribution of species i to U ( π i ), the regularity in the distributions of π i is calculated with the index of Bulla:
E u = i N min { π i , 1 N }
An even dispersion of the strategies of co-occurring species in relation to resource use, it can be interpreted as an indication of niche partitioning by competitive exclusion [33].Environmental filters favoring one or few strategies, so the species that survive are functionally more similar than expected by chance [24,51].
1 Compared to a null model of random assembly of species.
Table 3. Wilcoxon signed-rank tests evaluating differences between mean null model and mean expected values (Z) of large and small trees for each functional index and successional age/topographic class.
Successional Age/Topographic ClassFunctional IndexZpZp
Large TreesSmall Trees
1 FlatFRic1.96590.049−3.1480.002
2 Flat 2.41790.016−5.1550.000
2 Hill 0.0514ns 1−4.0540.000
3 Flat −0.7012ns−4.5770.000
3 Hill −1.98210.046−4.2530.000
1 FlatFDiv−0.7991ns−4.8000.000
2 Flat −0.2076ns−2.9140.004
2 Hill 0.0103ns−2.0650.037
3 Flat −0.4007ns−1.200ns
3 Hill −2.07560.037−1.215ns
1 FlatFEve0.5085ns2.7760.006
2 Flat −1.4597ns1.239ns
2 Hill −1.1210ns1.784ns
3 Flat −0.3916ns1.730ns
3 Hill −1.4959ns0.137ns
1 ns = not significant (p > 0.05). Sample sizes (n) per age/topographic class: 1 Flat = 83, 2 Flat = 66, 2 Hill = 30, 3 Flat = 52, 3 Hill = 32.

