
Simulating Water-Use Efficiency of Piceacrassi folia Forest under Representative Concentration Pathway Scenarios in the Qilian Mountains of Northwest China

Abstract
:
1. Introduction
2. Materials and Methods
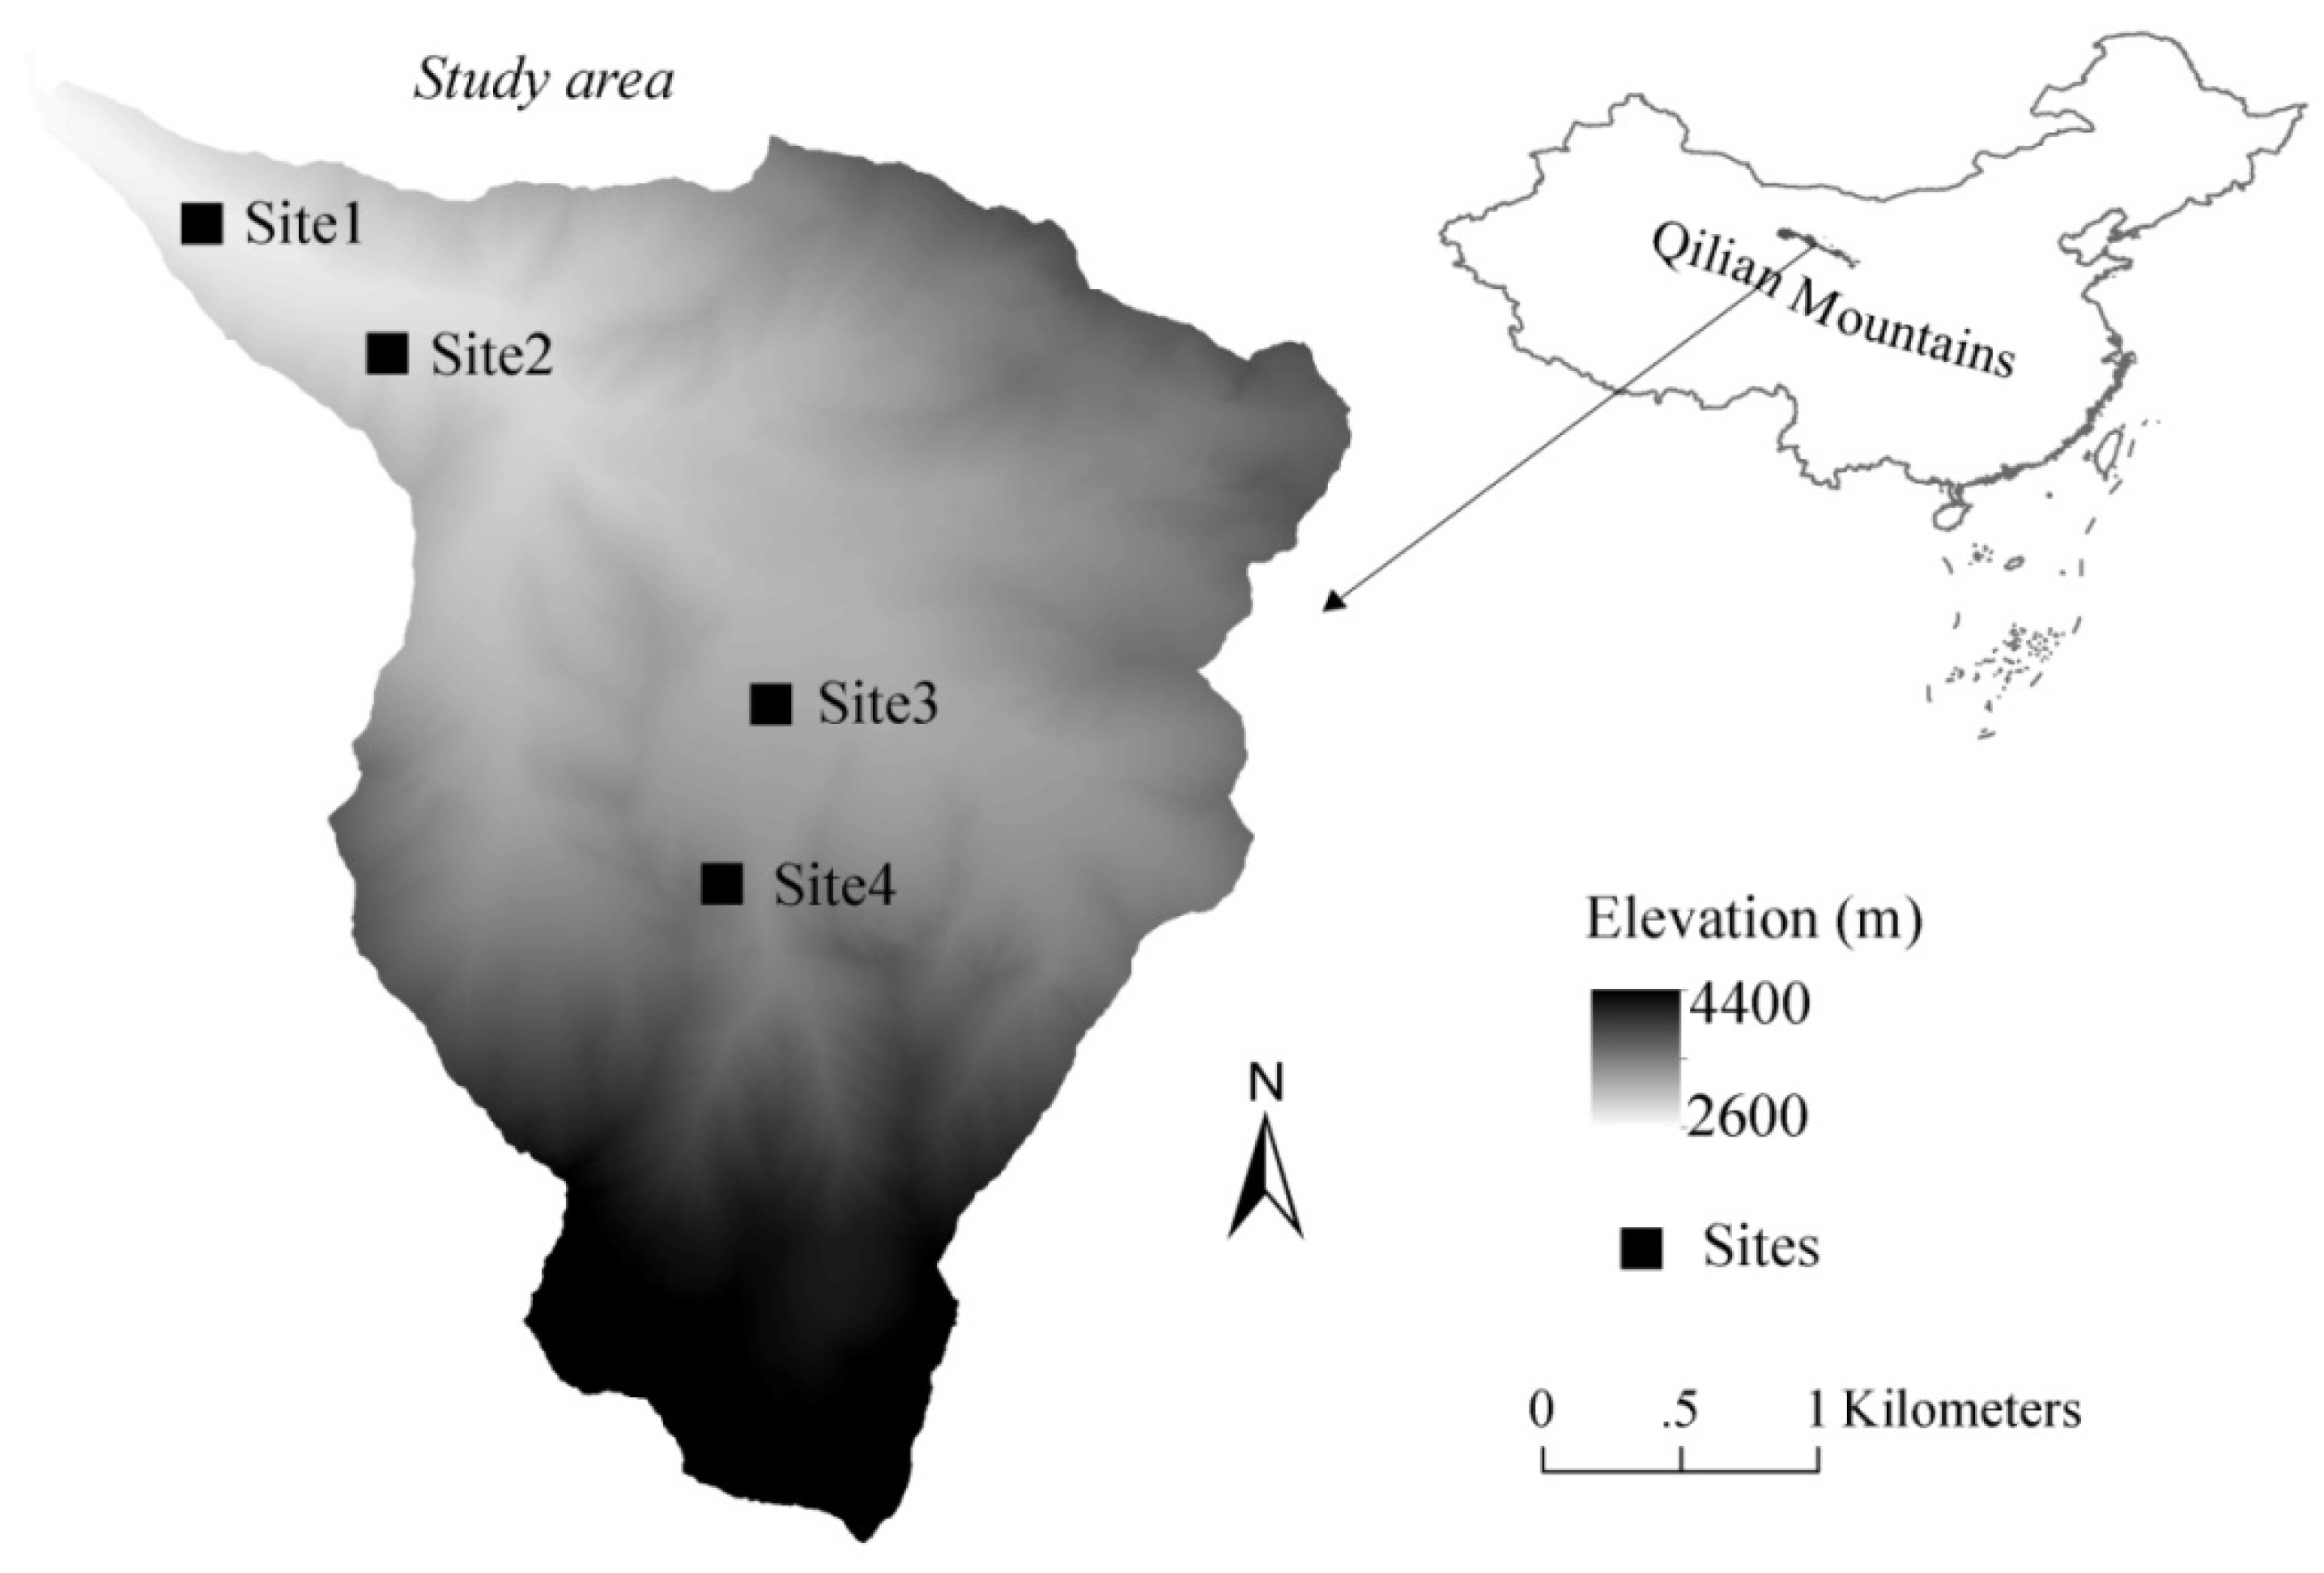
2.1. Study Sites
2.2. Data Collection
2.3. Field-Based Estimation of Annual NPP
2.4. Calculation of Daily Transpiration
2.5. Model Description
2.6. Model Parameterization
2.7. Climate and CO2 Scenarios
2.8. Model Simulation
3. Results
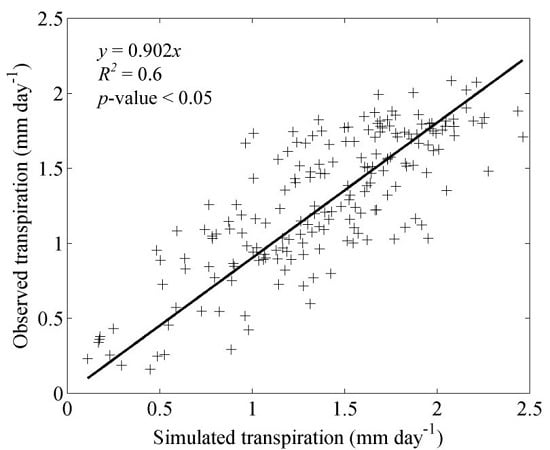
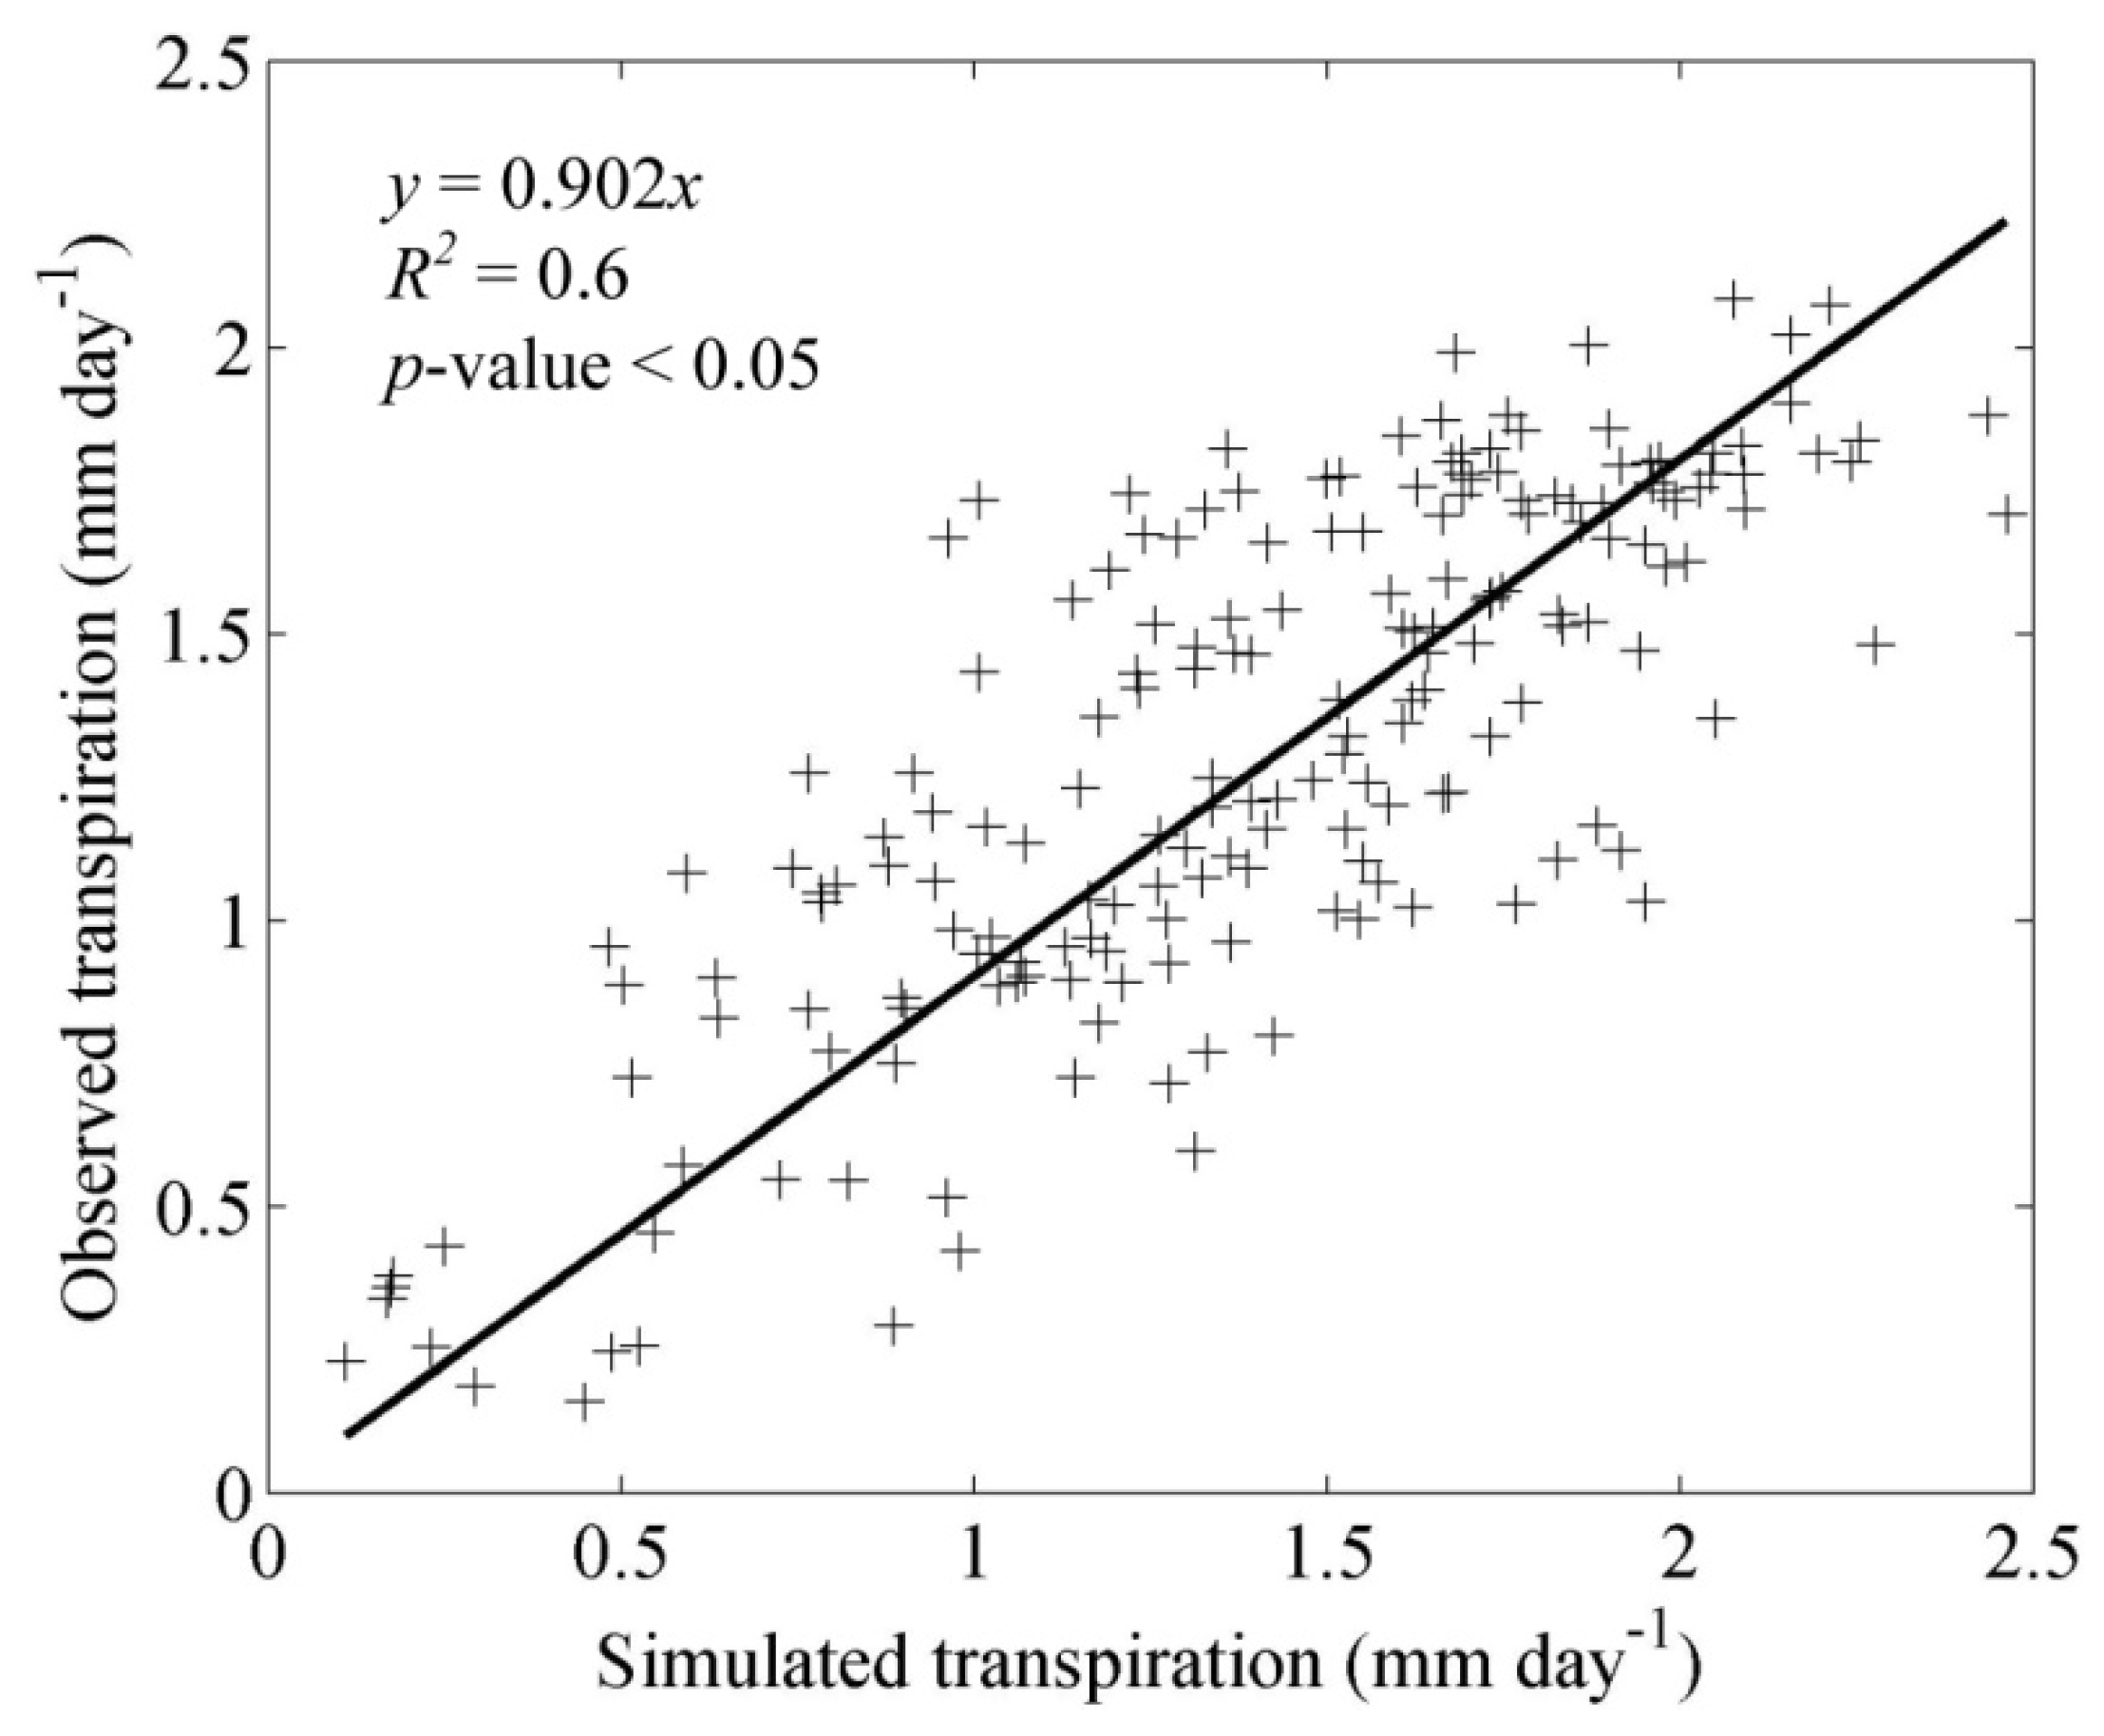
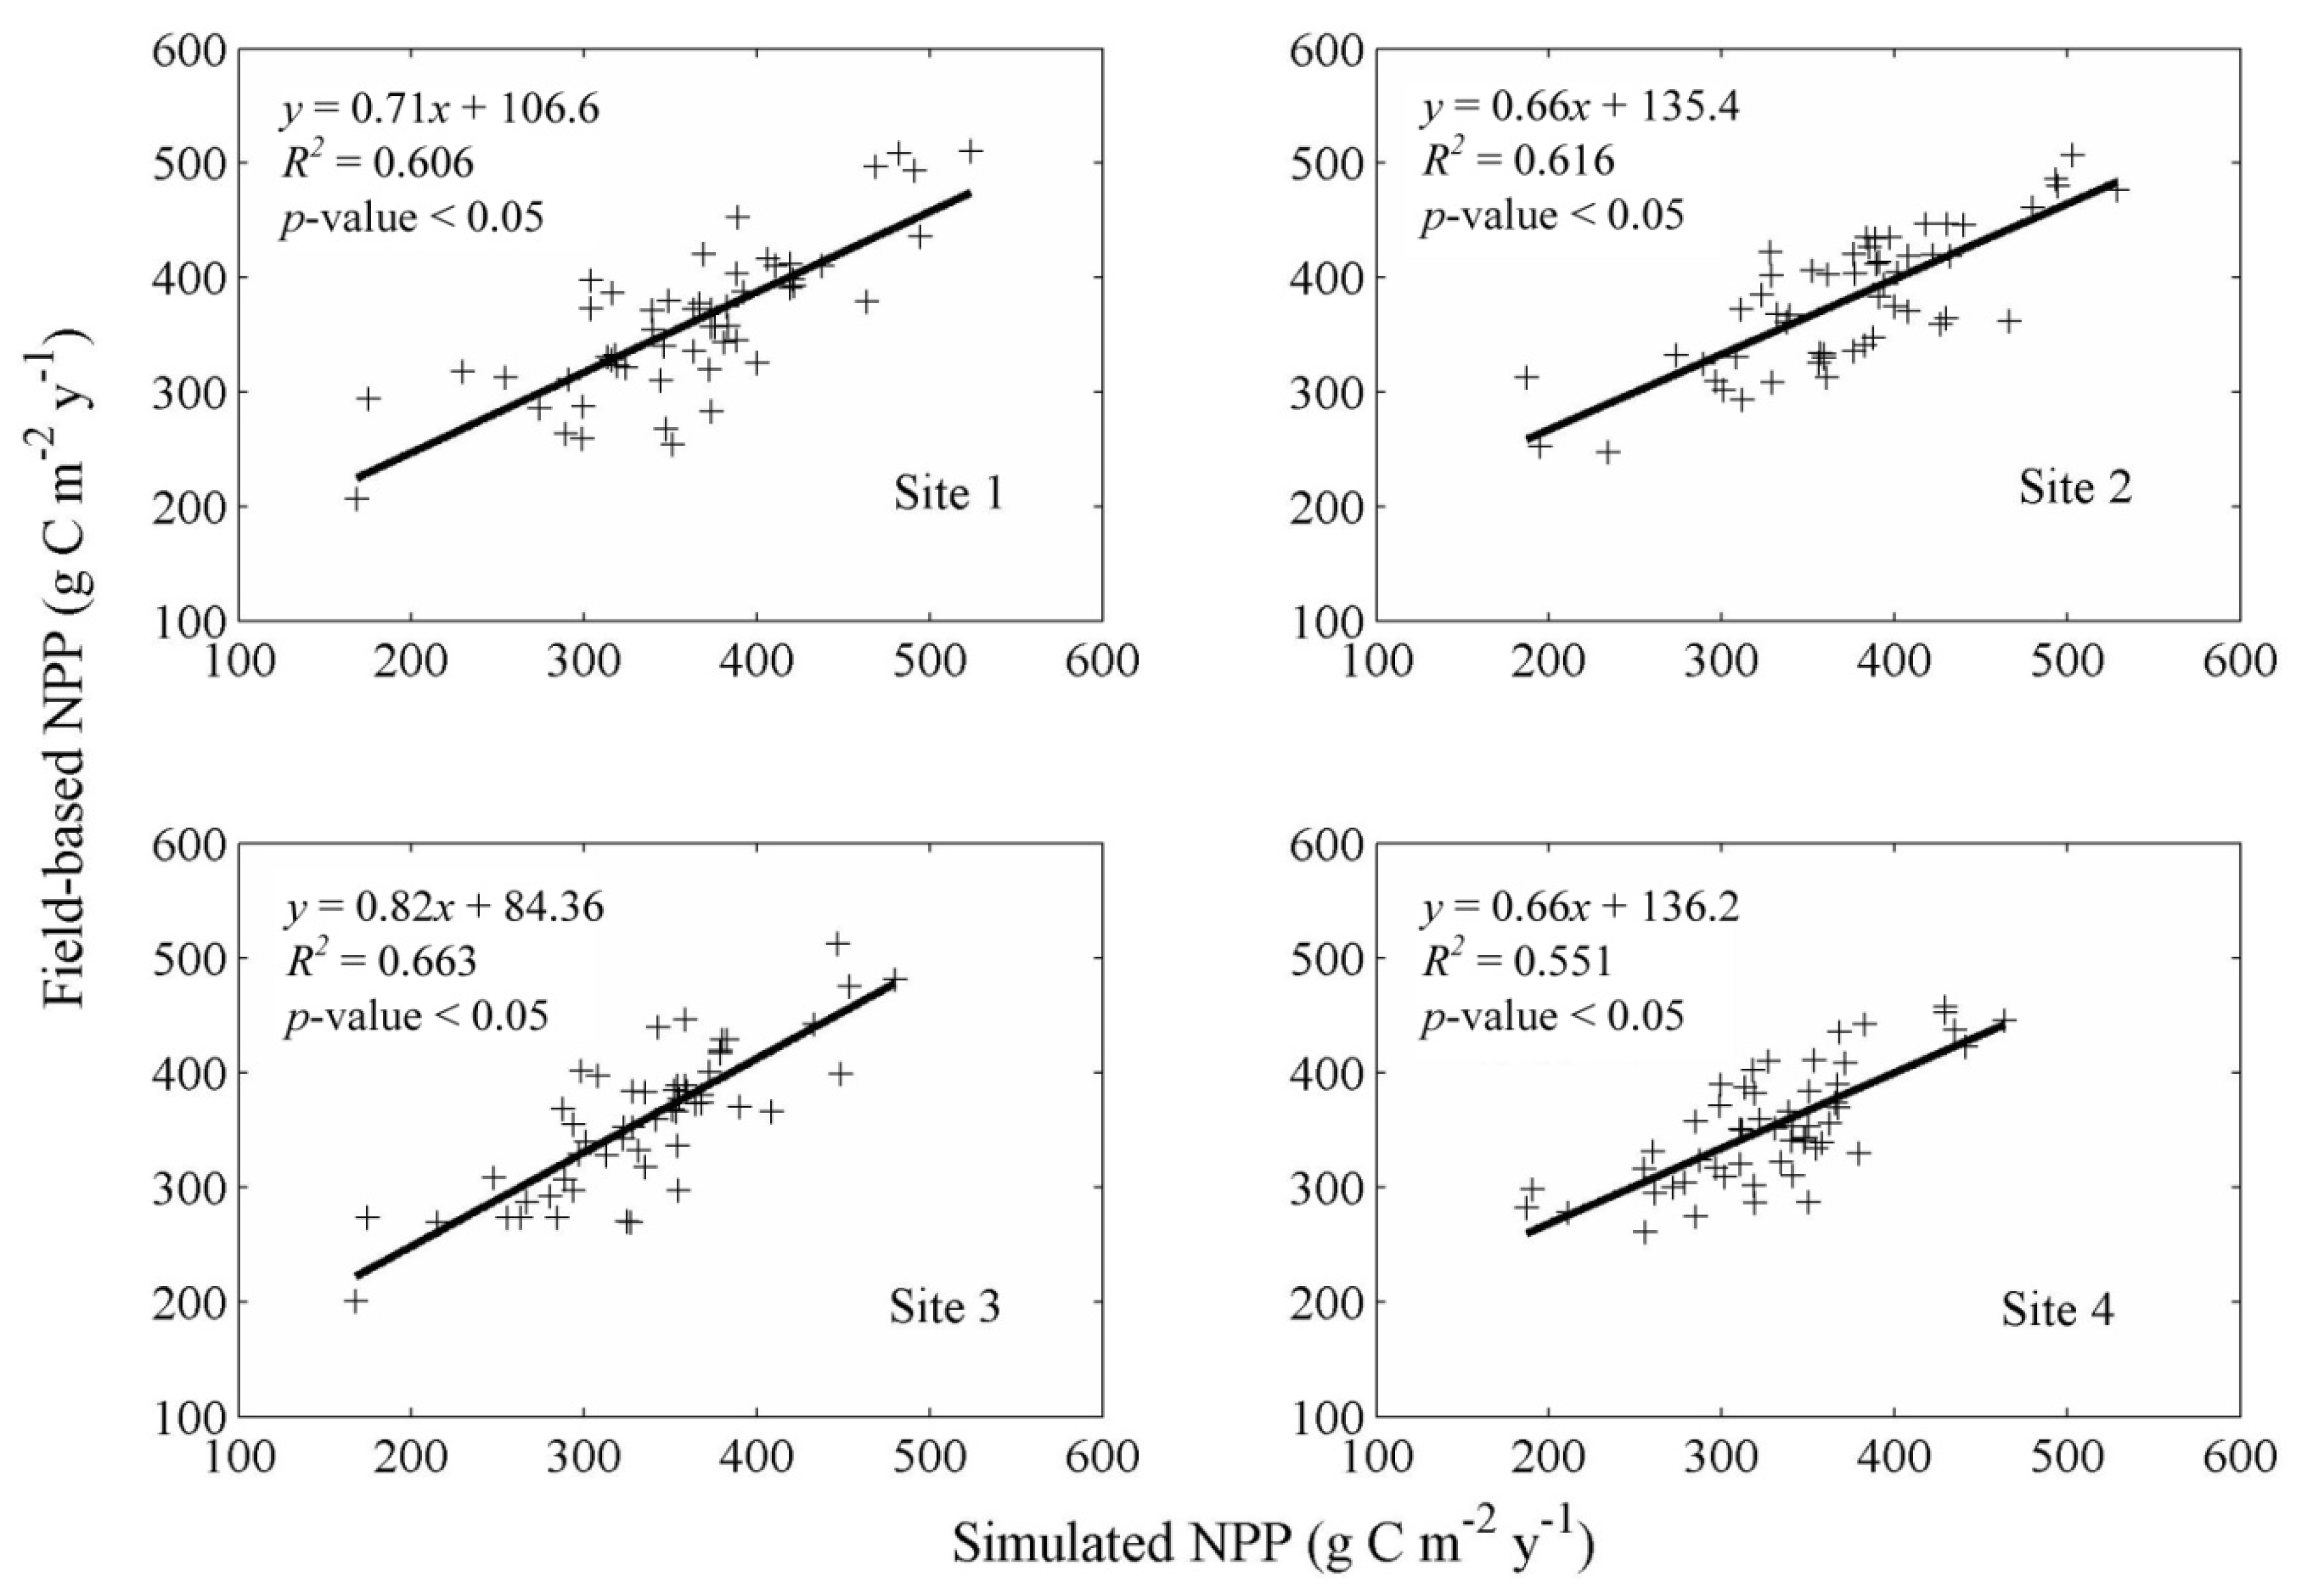
3.1. Model Validation
3.2. Responses of NPP, Transpiration, and WUE to RCP Scenarios
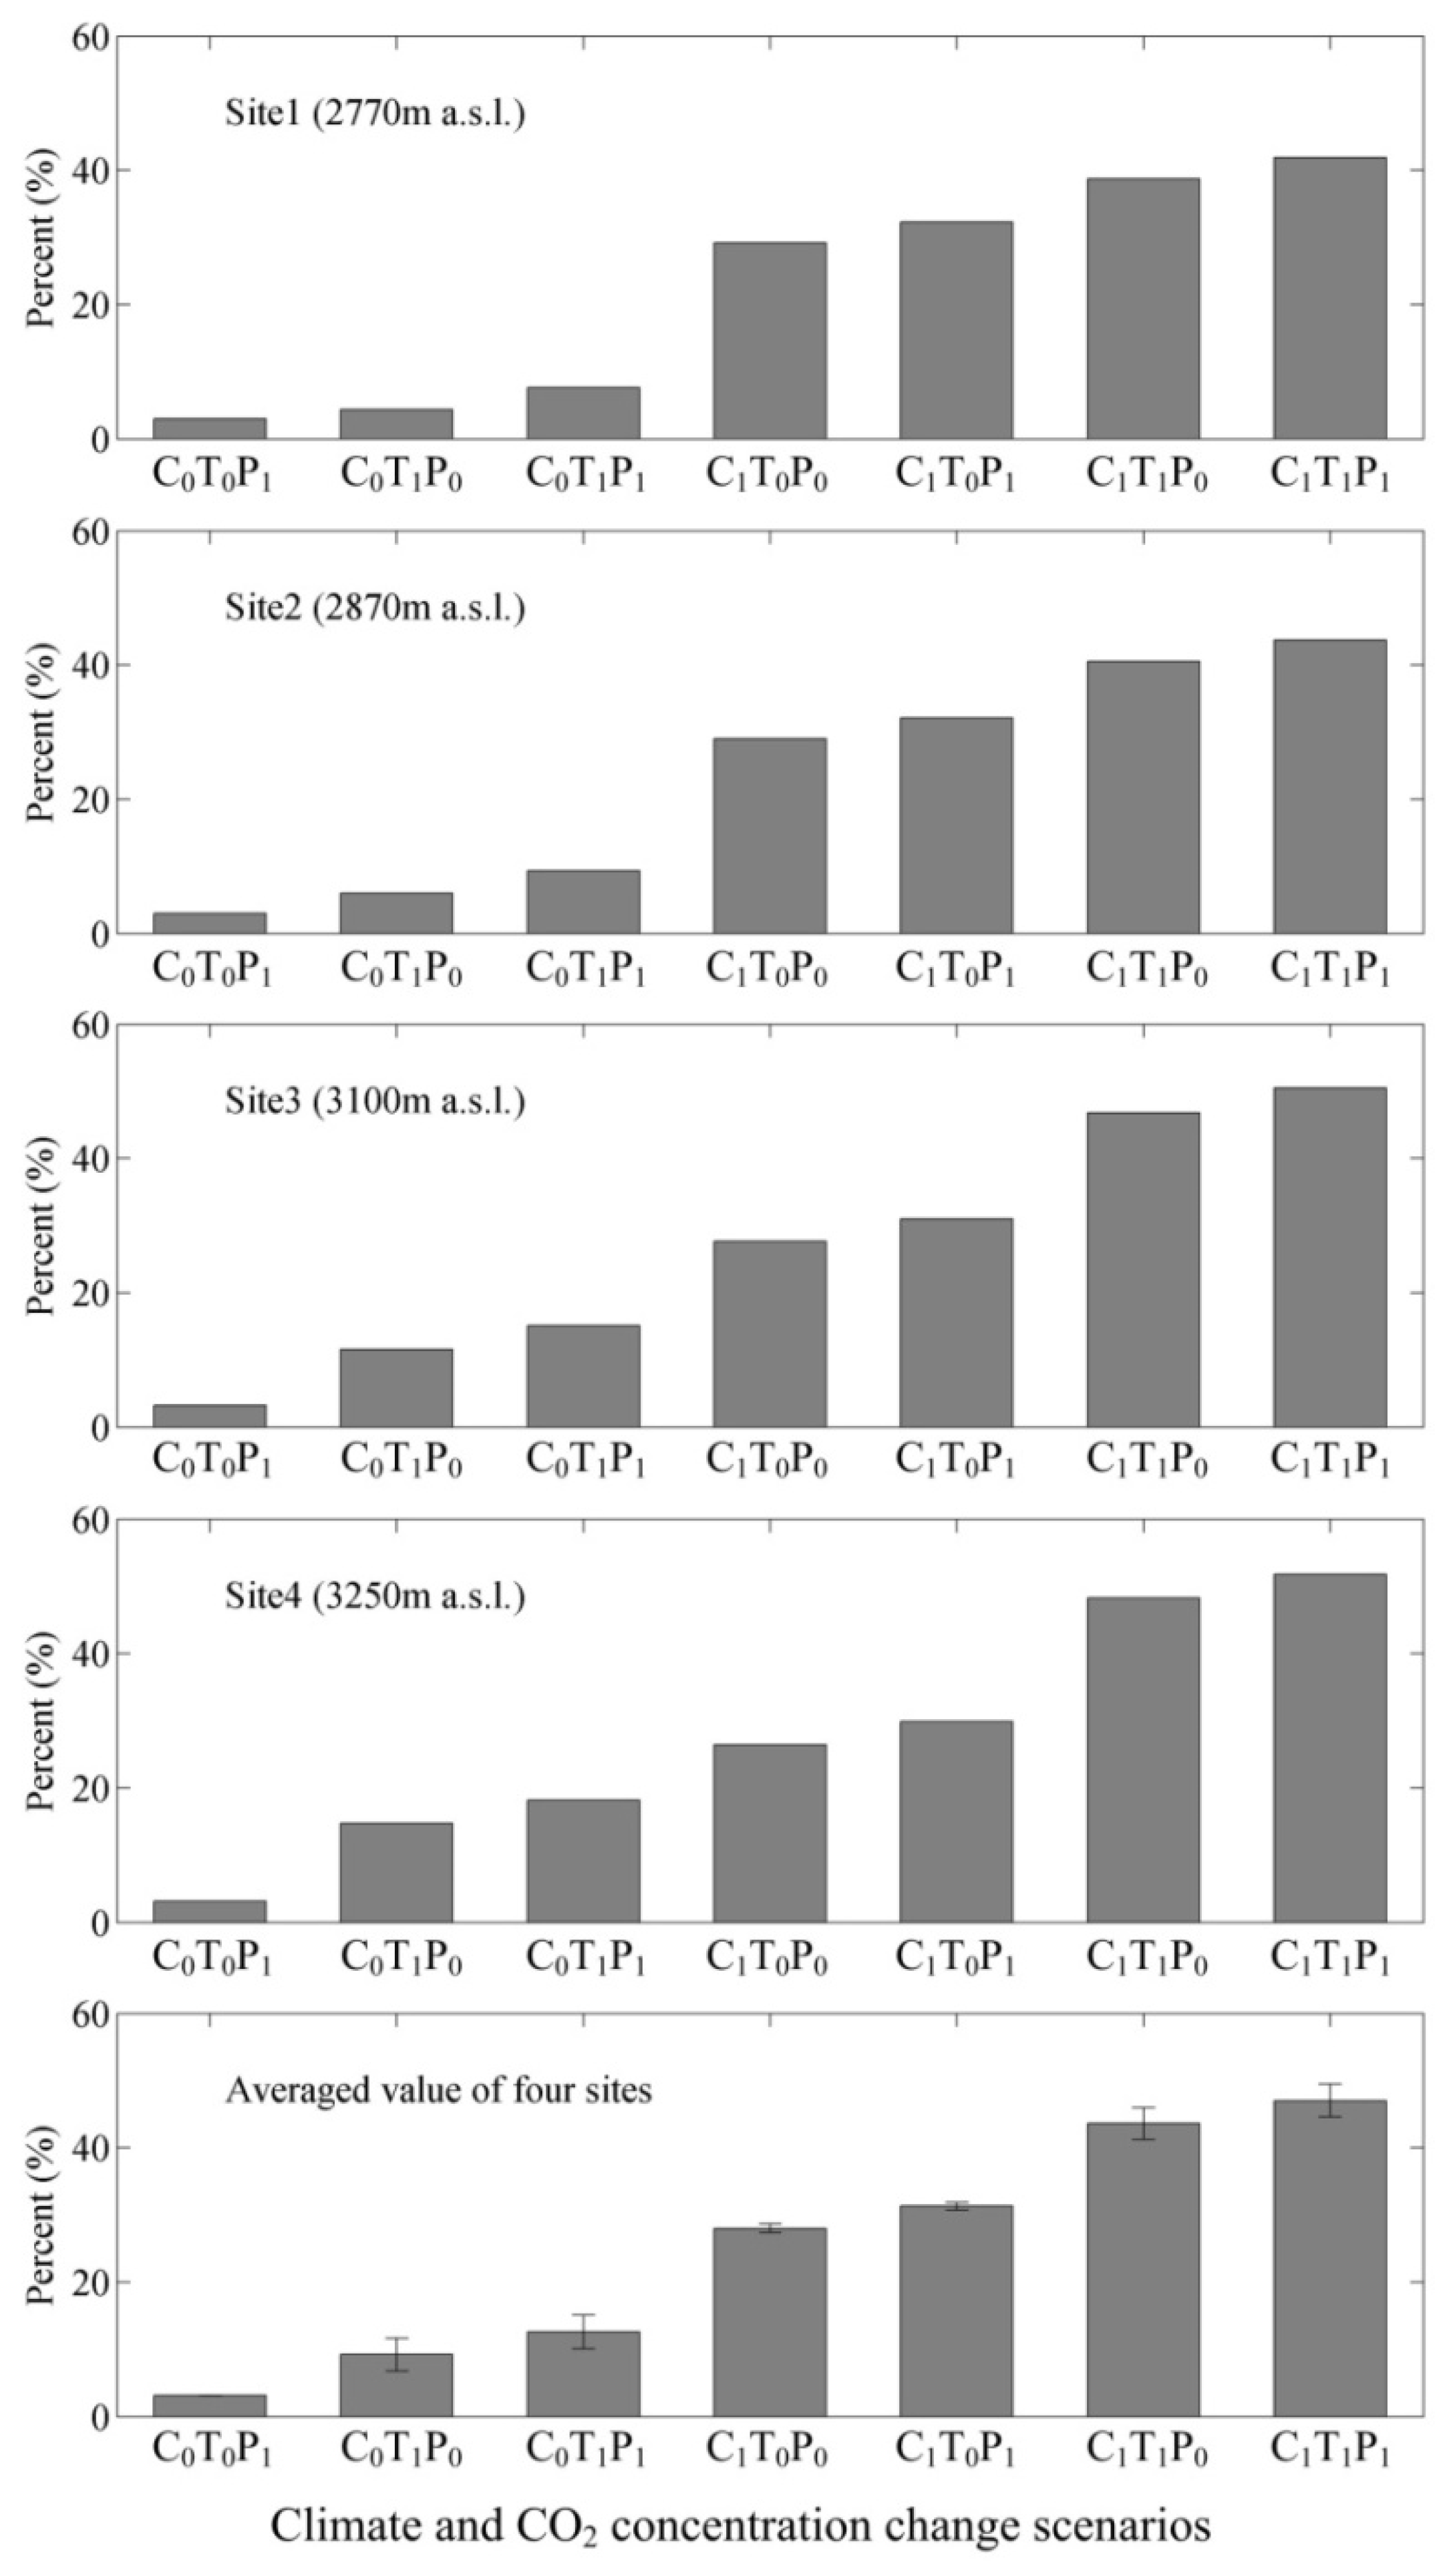
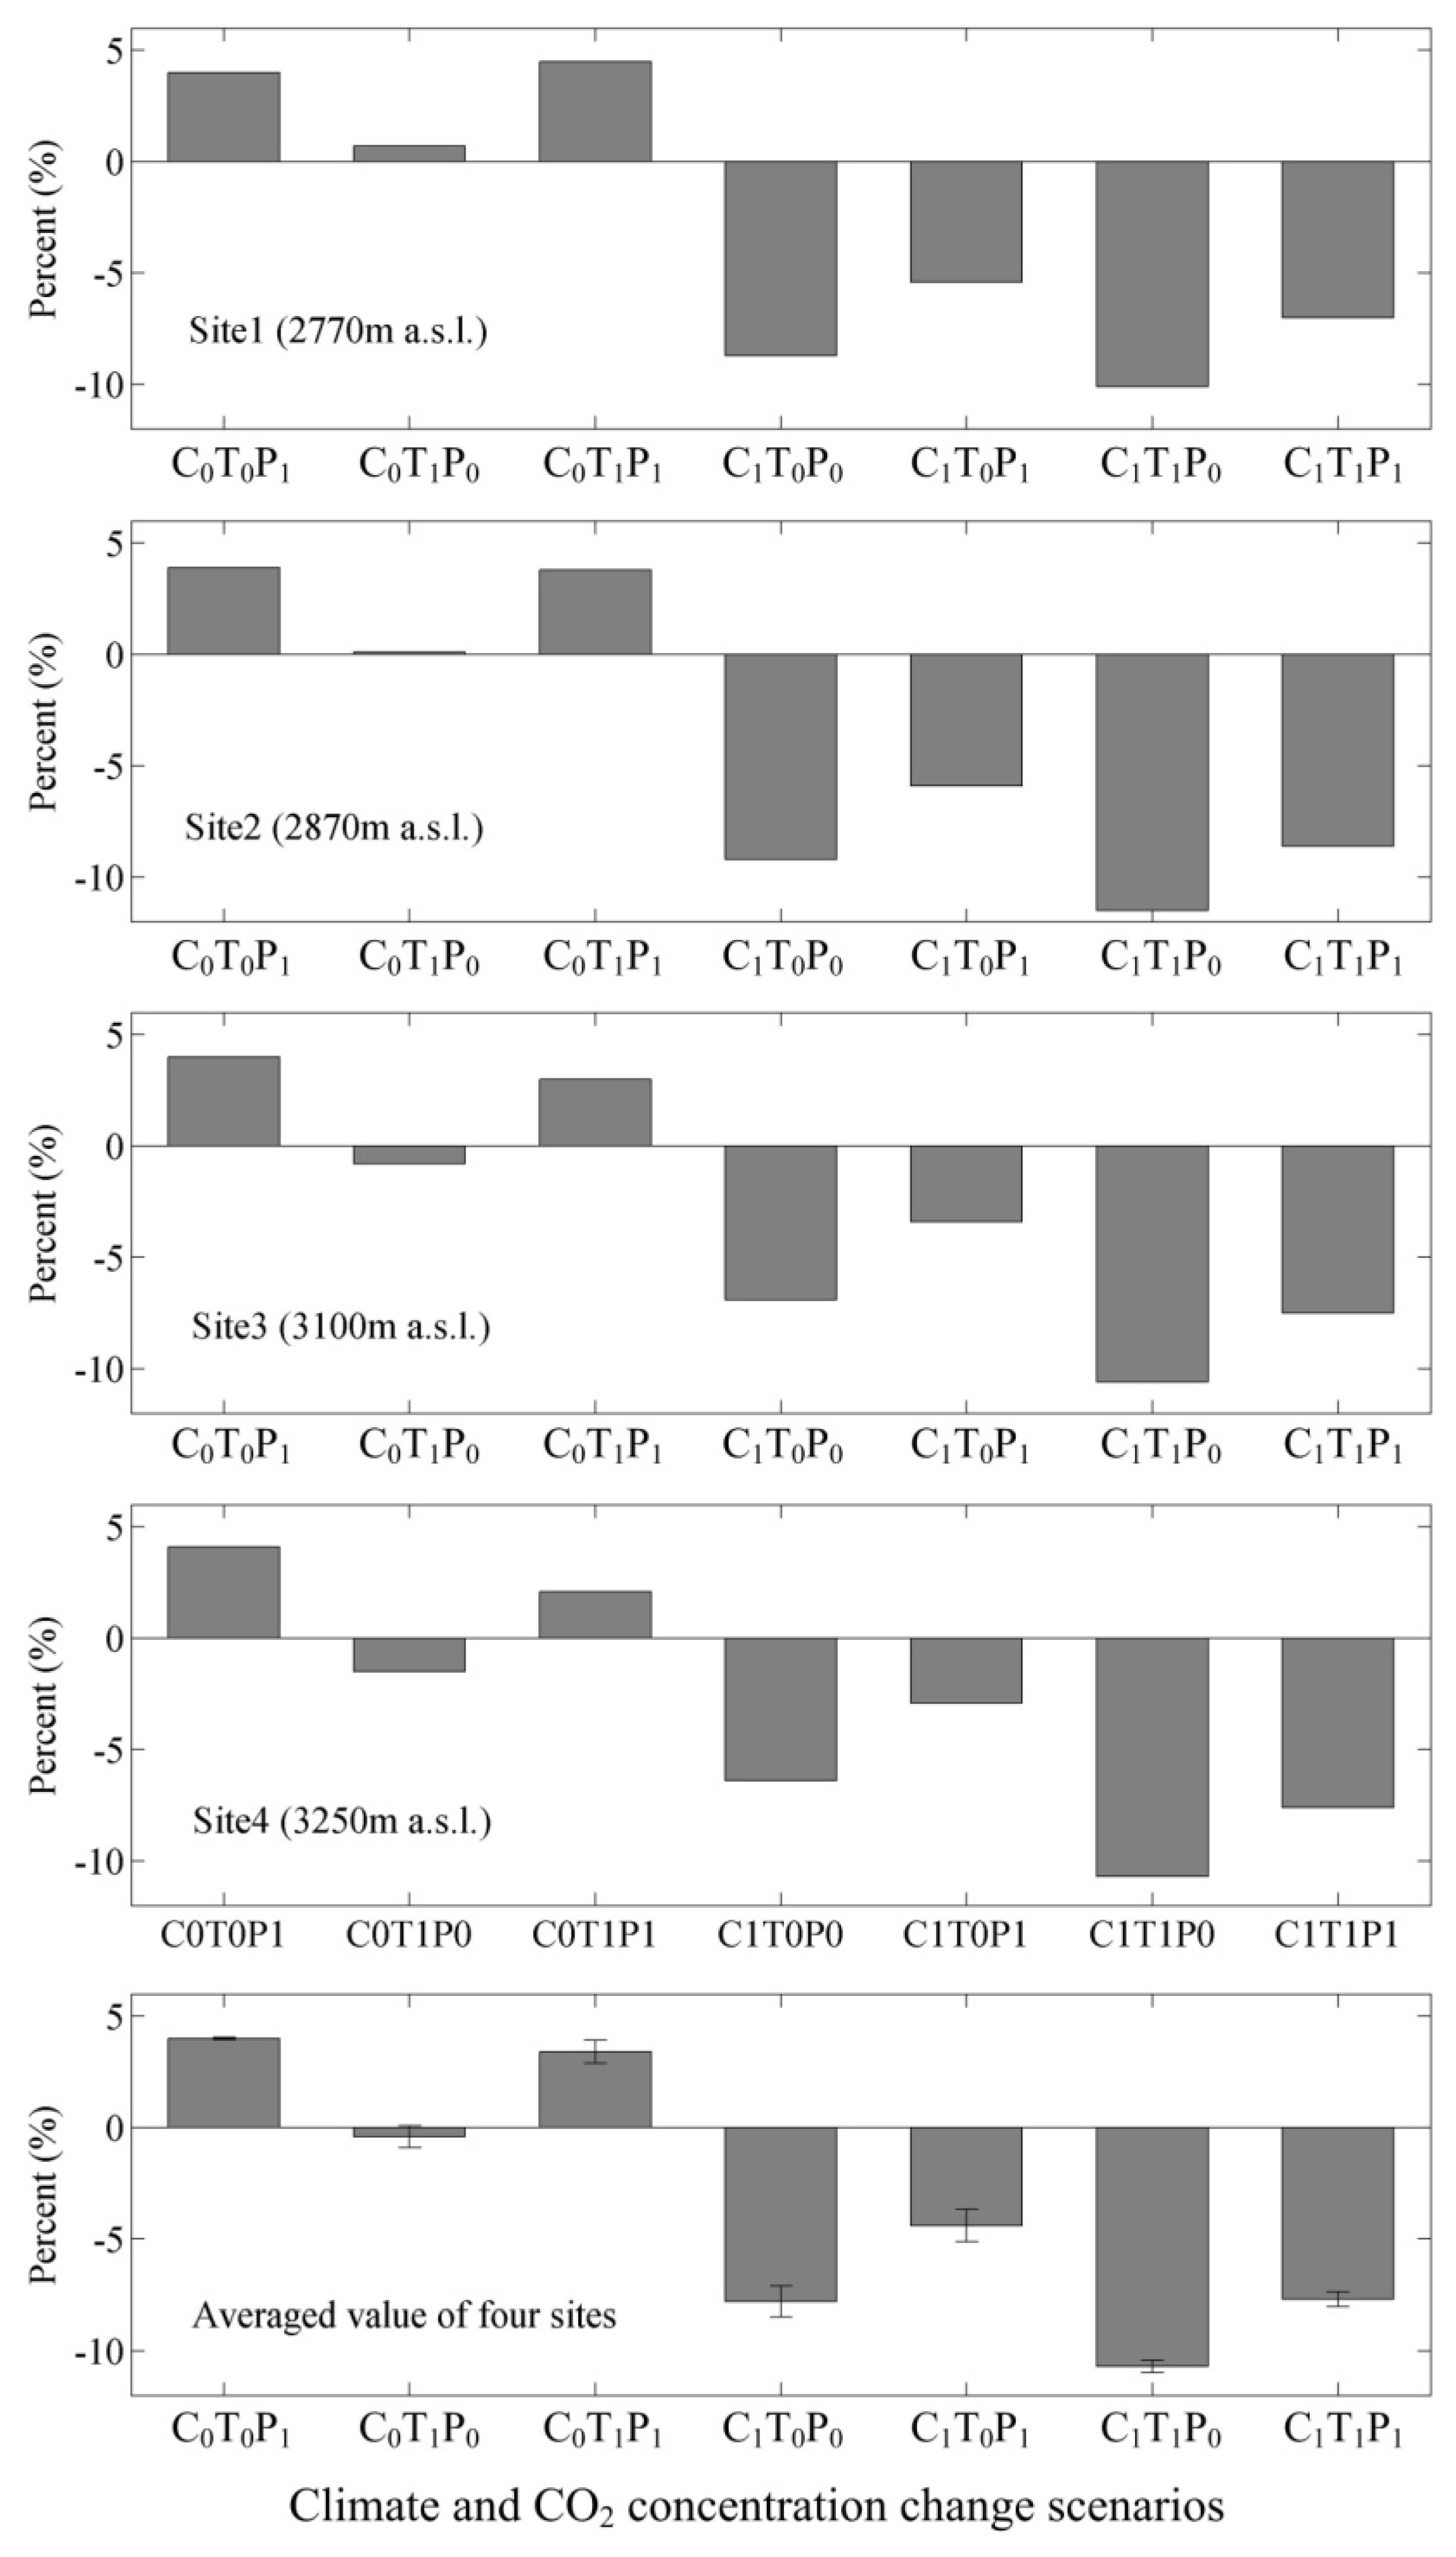
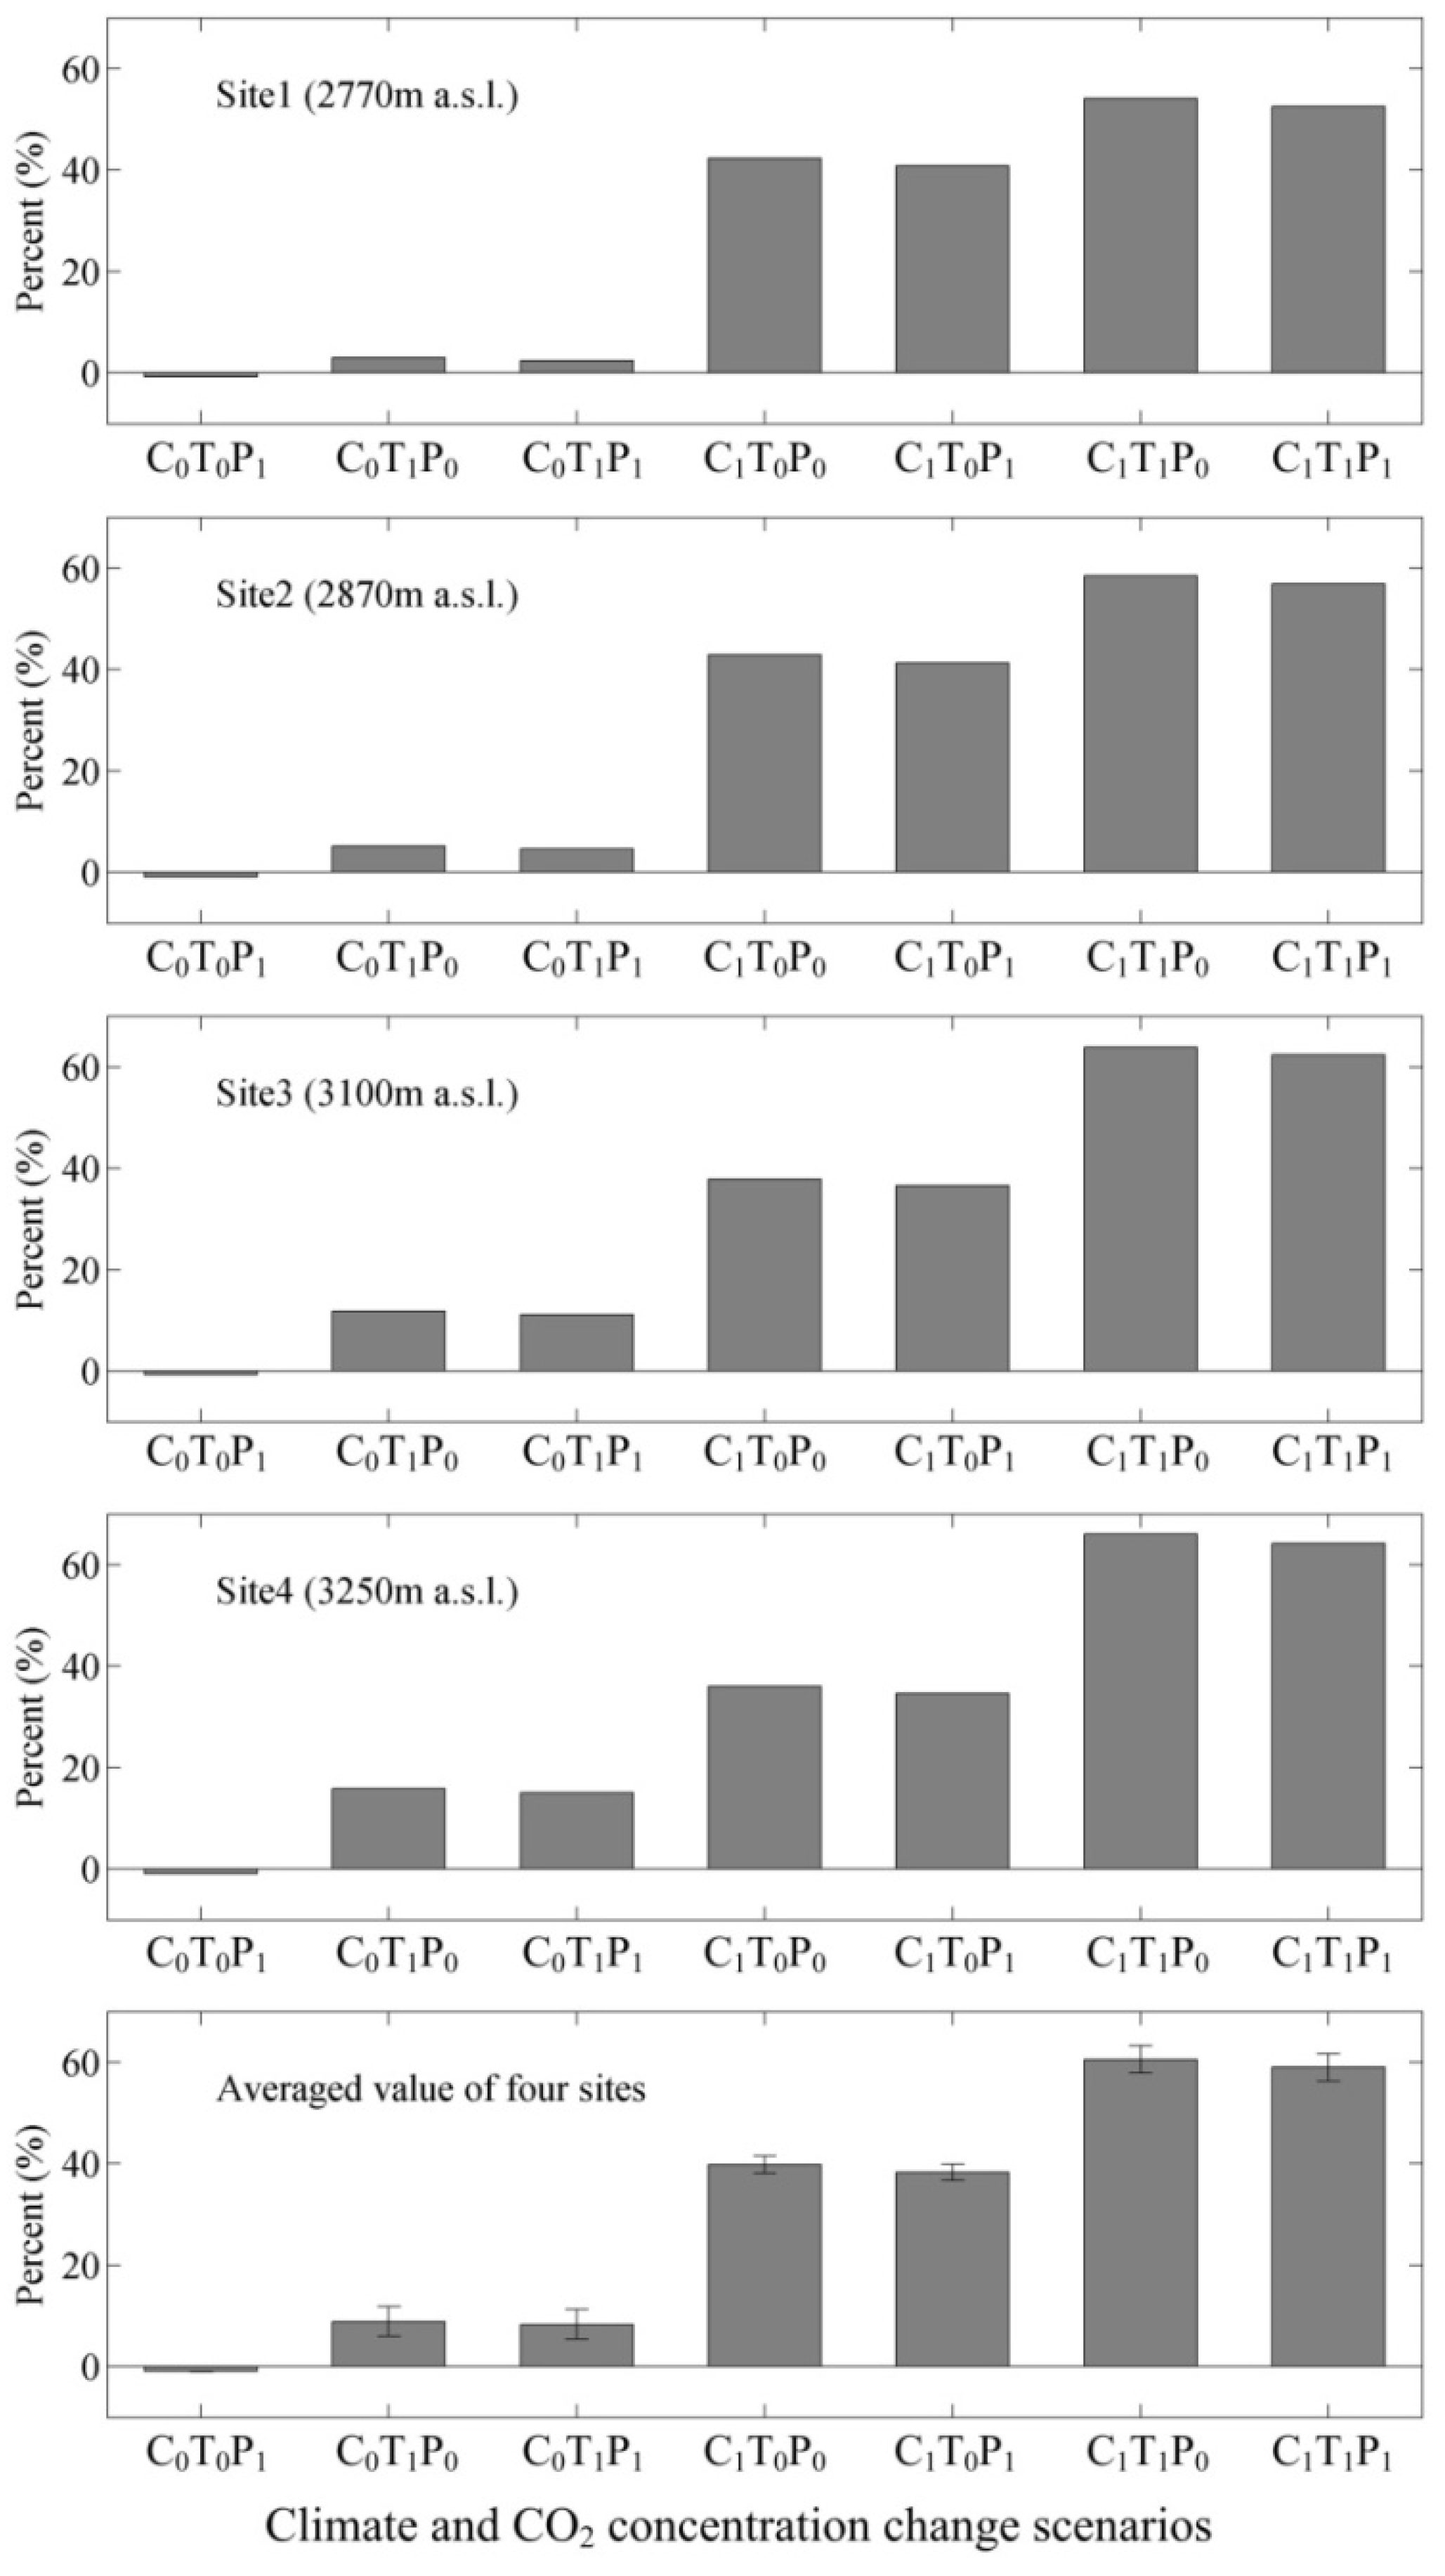
3.3. Responses of NPP, Transpiration, and WUE to Changes in Climate and Atmospheric CO2 Concentrations
4. Discussion
4.1. Model Validation
4.2. WUE Variations under RCP Scenarios
4.3. Climate Change Versus WUE Variations
4.4. Atmospheric CO2 Concentration Changes versus WUE Variations
4.5. Climate and CO2 Concentration Changes versus WUE Variations
5. Conclusions
Acknowledgments
Author Contributions
Conflicts of Interest
Appendix A

| Sites | a | b | R2 | p-Value |
|---|---|---|---|---|
| Site1 | 0.962 | 0.910 | 0.902 | <0.001 |
| Site2 | 1.139 | 0.849 | 0.943 | <0.001 |
| Site3 | 1.119 | 0.853 | 0.896 | <0.001 |
| Site4 | 0.698 | 0.937 | 0.921 | <0.001 |
Appendix B
| No. | Parameter Description | Value | Unit a |
|---|---|---|---|
| 1 | Transfer growth period as a fraction of growing season | 0.3 | DIM |
| 2 | Litterfall as a fraction of growing season | 0.3 | DIM |
| 3 | Annual leaf and fine root turnover fraction | 0.25 | year−1 |
| 4 | Annual live wood turnover fraction | 0.7 | year−1 |
| 5 | Annual whole-plant mortality fraction | 0.005 | year−1 |
| 6 | Annual fire mortality fraction | 0.005 | year−1 |
| 7 | (Allocation) new fine root C: new leaf C | 1.0 | ratio |
| 8 | (Allocation) new stem C: new leaf C | 2.2 | ratio |
| 9 | (Allocation) new live wood C: new total wood C | 0.1 | ratio |
| 10 | (Allocation) new root C: new stem C | 0.3 | ratio |
| 11 | (Allocation) current growth proportion | 0.5 | DIM |
| 12 | C:N of leaves | 40.2 | kg C/kg N |
| 13 | C:N of leaf litter, after retranslocation | 94.6 | kg C/kg N |
| 14 | C:N of fine roots | 43.5 | kg C/kg N |
| 15 | C:N of live wood | 60.0 | kg C/kg N |
| 16 | C:N of dead wood | 720.0 | kg C/kg N |
| 17 | Leaf litter labile proportion | 0.32 | DIM |
| 18 | Leaf litter cellulose proportion | 0.44 | DIM |
| 19 | Leaf litter lignin proportion | 0.24 | DIM |
| 20 | Fine root labile proportion | 0.3 | DIM |
| 21 | Fine root cellulose proportion | 0.45 | DIM |
| 22 | Fine root lignin proportion | 0.25 | DIM |
| 23 | Dead wood cellulose proportion | 0.76 | DIM |
| 24 | Dead wood lignin proportion | 0.24 | DIM |
| 25 | Canopy water interception coefficient | 0.041 | 1/LAI/d |
| 26 | Canopy light extinction coefficient | 0.5 | DIM |
| 27 | All-sided to projected leaf area ratio | 2.6 | DIM |
| 28 | Canopy average specific leaf area (projected area basis) | 9.3 | m2/kg C |
| 29 | Ratio of shaded SLA: sunlit SLA | 2.0 | DIM |
| 30 | Fraction of leaf N in Rubisco | 0.04 | DIM |
| 31 | Maximum stomatal conductance (projected area basis) | 0.003 | m/s |
| 32 | Cuticular conductance (projected area basis) | 0.00001 | m/s |
| 33 | Boundary layer conductance (projected area basis) | 0.08 | m/s |
| 34 | Leaf water potential: start of conductance reduction | −0.6 | M Pa |
| 35 | Leaf water potential: complete conductance reduction | −2.3 | M Pa |
| 36 | Vapor pressure deficit: start of conductance reduction | 930.0 | Pa |
| 37 | Vapor pressure deficit: complete conductance reduction | 4100.0 | Pa |
References
- IPCC 2013. Climate Change 2013: The Physical Science Basis. In Contribution of Working Group I to the Fifth Assessment Report of the Intergovernmental Panel on Climate Change; Stocker, T.F., Qin, D., Plattner, G.-K., Tignor, M., Allen, S.K., Boschung, J., Nauels, A., Xia, Y., Bex, V., Midgley, P.M., Eds.; Cambridge University Press: Cambridge, UK; New York, NY, USA, 2013; p. 1535. [Google Scholar]
- Xu, Z.; Zhao, C.; Feng, Z.; Zhang, F.; Sher, H.; Wang, C.; Peng, H.; Wang, Y.; Zhao, Y.; Wang, Y. Estimating realized and potential carbon storage benefits from reforestation and afforestation under climate change: A case study of the Qinghai spruce forests in the Qilian Mountains, northwestern China. Mitig. Adapt. Strateg. Glob. Chang. 2013, 18, 1257–1268. [Google Scholar] [CrossRef]
- IPCC. Synthesis Report. Contribution of Working Groups I, II and III to the Fifth Assessment Report of the Intergovernmental Panel on Climate Change; Core Writing Team; Pachauri, R.K., Meyer, L.A., Eds.; IPCC: Geneva, Switzerland, 2014; p. 151. [Google Scholar]
- Grimm, N.B.; Chapin, F.S., III; Bierwagen, B.; Gonzalez, P.; Groffman, P.M.; Luo, Y.; Melton, F.; Nadelhoffer, K.; Pairis, A.; Raymond, P.A. The impacts of climate change on ecosystem structure and function. Front. Ecol. Environ. 2013, 11, 474–482. [Google Scholar] [CrossRef]
- Friend, A.D.; Lucht, W.; Rademacher, T.T.; Keribin, R.; Betts, R.; Cadule, P.; Ciais, P.; Clark, D.B.; Dankers, R.; Falloon, P.D. Carbon residence time dominates uncertainty in terrestrial vegetation responses to future climate and atmospheric CO2. Proc. Natl. Acad. Sci. USA 2014, 111, 3280–3285. [Google Scholar] [CrossRef] [PubMed]
- Dixon, R.K.; Brown, S.; Houghton, R.A.; Solomon, A.M.; Trexler, M.C.; Wisniewski, J. Carbon pools and flux of global forest ecosystems. Science 1994, 263, 185–190. [Google Scholar] [CrossRef] [PubMed]
- Su, H.; Sang, W.; Wang, Y.; Ma, K. Simulating Picea schrenkiana forest productivity under climatic changes and atmospheric CO2 increase in Tianshan Mountains, Xinjiang Autonomous Region, China. For. Ecol. Manag. 2007, 246, 273–284. [Google Scholar] [CrossRef]
- Nunes, L.; Gower, S.T.; Peckham, S.D.; Magalhães, M.; Lopes, D.; Rego, F.C. Estimation of productivity in pine and oak forests in northern Portugal using Biome-BGC. Forestry 2015, 88, 200–212. [Google Scholar] [CrossRef]
- Chiesi, M.; Moriondo, M.; Maselli, F.; Gardin, L.; Fibbi, L.; Bindi, M.; Running, S.W. Simulation of Mediterranean forest carbon pools under expected environmental scenarios. Can. J. For. Res. 2010, 40, 850–860. [Google Scholar] [CrossRef]
- Ågren, G.I.; Andersson, F.O. Terrestrial Ecosystem Ecology: Principles and Applications; University Press: Cambridge, UK, 2011. [Google Scholar]
- Bonan, G. Ecological Climatology: Concepts and Applications; Cambridge University Press: Cambridge, UK, 2015. [Google Scholar]
- Niu, S.; Xing, X.; Zhang, Z.; Xia, J.; Zhou, X.; Song, B.; Li, L.; Wan, S. Water-use efficiency in response to climate change: from leaf to ecosystem in a temperate steppe. Glob. Chang. Biol. 2011, 17, 1073–1082. [Google Scholar] [CrossRef]
- Silva, L.C.; Anand, M. Probing for the influence of atmospheric CO2 and climate change on forest ecosystems across biomes. Glob. Ecol. Biogeogr. 2013, 22, 83–92. [Google Scholar] [CrossRef]
- Battipaglia, G.; Saurer, M.; Cherubini, P.; Calfapietra, C.; McCarthy, H.R.; Norby, R.J.; Francesca Cotrufo, M. Elevated CO2 increases tree-level intrinsic water use efficiency: Insights from carbon and oxygen isotope analyses in tree rings across three forest FACE sites. New Phytol. 2013, 197, 544–554. [Google Scholar] [CrossRef] [PubMed]
- Rötzer, T.; Liao, Y.; Goergen, K.; Schüler, G.; Pretzsch, H. Modelling the impact of climate change on the productivity and water-use efficiency of a central European beech forest. Clim. Res. 2013, 58, 81–95. [Google Scholar] [CrossRef]
- Xie, J.; Chen, J.; Sun, G.; Zha, T.; Yang, B.; Chu, H.; Liu, J.; Wan, S.; Zhou, C.; Ma, H. Ten-year variability in ecosystem water use efficiency in an oak-dominated temperate forest under a warming climate. Agric. For. Meteorol. 2016, 218, 209–217. [Google Scholar] [CrossRef]
- Peng, S.Z.; Zhao, C.Y.; Xu, Z.L. Modeling stem volume growth of Qinghai spruce (Picea crassifolia Kom.) in Qilian Mountains of Northwest China. Scand. J. For. Res. 2015, 30, 449–457. [Google Scholar]
- Tian, F.; Zhao, C.; Feng, Z.-D. Simulating evapotranspiration of Qinghai spruce (Picea crassifolia) forest in the Qilian Mountains, northwestern China. J. Arid Environ. 2011, 75, 648–655. [Google Scholar] [CrossRef]
- Zhao, C.; Nan, Z.; Cheng, G.; Zhang, J.; Feng, Z. GIS-assisted modelling of the spatial distribution of Qinghai spruce (Picea crassifolia) in the Qilian Mountains, northwestern China based on biophysical parameters. Ecol. Model. 2006, 191, 487–500. [Google Scholar] [CrossRef]
- Liu, X.C. Picea Crassifolia; Lanzhou University Press: Lanzhou, China, 1992. (In Chinese) [Google Scholar]
- Wang, J.Y.; Che, K.J.; Rong, J.Z. A study on carbon balance of picea crassifolia in Qilian Mountains. J. Northwest For. Coll. 2000, 15, 9–14. (In Chinese) [Google Scholar]
- Wang, J.Y.; Che, K.J.; Fu, H.E.; Chang, X.X.; Song, C.F.; He, H.Y. Study on biomass of water conservation forest on north slope of Qilian Mountains. J. Fujian Coll. For. 1998, 18, 319–323. (In Chinese) [Google Scholar]
- Chang, X.; Zhao, W.; Liu, H.; Wei, X.; Liu, B.; He, Z. Qinghai spruce (Picea crassifolia) forest transpiration and canopy conductance in the upper Heihe River Basin of arid northwestern China. Agric. For. Meteorol. 2014, 198, 209–220. [Google Scholar] [CrossRef]
- Chang, X.; Zhao, W.; He, Z. Radial pattern of sap flow and response to microclimate and soil moisture in Qinghai spruce (Picea crassifolia) in the upper Heihe River Basin of arid northwestern China. Agric. For. Meteorol. 2014, 187, 14–21. [Google Scholar] [CrossRef]
- Wang, W.; Liu, X.; An, W.; Xu, G.; Zeng, X. Increased intrinsic water-use efficiency during a period with persistent decreased tree radial growth in northwestern China: Causes and implications. For. Ecol. Manag. 2012, 275, 14–22. [Google Scholar] [CrossRef]
- Thornton, P.; Law, B.; Gholz, H.L.; Clark, K.L.; Falge, E.; Ellsworth, D.; Goldstein, A.; Monson, R.; Hollinger, D.; Falk, M. Modeling and measuring the effects of disturbance history and climate on carbon and water budgets in evergreen needleleaf forests. Agric. For. Meteorol. 2002, 113, 185–222. [Google Scholar] [CrossRef]
- Fang, S.; Zhao, C.; Jian, S. Canopy transpiration of Pinus tabulaeformis plantation forest in the Loess Plateau region of China. Environ. Earth Sci. 2016, 75, 1–9. [Google Scholar] [CrossRef]
- Wang, Q.; Watanabe, M.; Ouyang, Z. Simulation of water and carbon fluxes using BIOME-BGC model over crops in China. Agric. For. Meteorol. 2005, 131, 209–224. [Google Scholar] [CrossRef]
- Golinkoff, J. Biome BGC version 4.2: Theoretical framework of Biome-BGC. Terradynamic Simulation Group Modeling and Monitoring Ecosystem Function at Multiple Scales. Biome-BGC, 2010. Available online: http://www.ntsg.umt.edu/project/biome-bgc (accessed on 4 September 2014).
- Peng, S.Z.; Zhao, C.Y.; Wang, X.P.; Xu, Z.L.; Liu, X.M.; Hao, H.; Yang, S.F. Mapping daily temperature and precipitation in the Qilian Mountains of northwest China. J. Mt. Sci. Engl. 2014, 11, 896–905. [Google Scholar] [CrossRef]
- Tans, D.P. Monthly Atmospheric CO2 of Mauna Loa Observatory, NOAA/ESRL. Available online: http://www.esrl.noaa.gov/gmd/ccgg/trends (accessed on 5 June 2015).
- Van Vuuren, D.P.; Den Elzen, M.G.; Lucas, P.L.; Eickhout, B.; Strengers, B.J.; van Ruijven, B.; Wonink, S.; van Houdt, R. Stabilizing greenhouse gas concentrations at low levels: An assessment of reduction strategies and costs. Clim. Chang. 2007, 81, 119–159. [Google Scholar] [CrossRef]
- Clarke, L.; Edmonds, J.; Jacoby, H.; Pitcher, H.; Reilly, J.; Richels, R. Scenarios of greenhouse gas emissions and atmospheric concentrations. In Sub-report 2.1A of Synthesis and Assessment Product 2.1 by the U.S. Climate Change Science Program and the Subcommittee on Global Change Research; US Department of Energy Publications, Department of Energy, Office of Biological & Environmental Research: Washington, DC, USA, 2007; p. 154. [Google Scholar]
- Wise, M.; Calvin, K.; Thomson, A.; Clarke, L.; Bond-Lamberty, B.; Sands, R.; Smith, S.J.; Janetos, A.; Edmonds, J. Implications of limiting CO2 concentrations for land use and energy. Science 2009, 324, 1183–1186. [Google Scholar] [CrossRef] [PubMed]
- Smith, S.J.; Wigley, T. Multi-gas forcing stabilization with Minicam. Energy J. 2006, 27, 373–391. [Google Scholar] [CrossRef]
- Fujino, J.; Nair, R.; Kainuma, M.; Masui, T.; Matsuoka, Y. Multi-gas mitigation analysis on stabilization scenarios using AIM global model. Energy J. 2006, 27, 343–353. [Google Scholar] [CrossRef]
- Hijioka, Y.; Matsuoka, Y.; Nishimoto, H.; Masui, T.; Kainuma, M. Global GHG emission scenarios under GHG concentration stabilization targets. J. Glob. Environ. Eng. 2008, 13, 97–108. [Google Scholar]
- Riahi, K.; Grübler, A.; Nakicenovic, N. Scenarios of long-term socio-economic and environmental development under climate stabilization. Tech. Forecast. Soc. Chang. 2007, 74, 887–935. [Google Scholar] [CrossRef]
- RCP Database (version 2.0). Available online: http://www.iiasa.ac.at/web-apps/tnt/RcpDb (accessed on 1 June 2015).
- Van Vuuren, D.P.; Edmonds, J.; Kainuma, M.; Riahi, K.; Thomson, A.; Hibbard, K.; Hurtt, G.C.; Kram, T.; Krey, V.; Lamarque, J.-F. The representative concentration pathways: An overview. Clim. Chang. 2011, 109, 5–31. [Google Scholar] [CrossRef]
- Xu, C.H.; Xu, Y. The projection of temperature and precipitation over China under RCP scenarios using a CMIP5 multi-model ensemble. Atmos. Ocean. Sci. Lett. 2012, 5, 527–533. [Google Scholar]
- Sang, W.; Su, H. Interannual NPP variation and trend of Picea schrenkiana forests under changing climate conditions in the Tianshan Mountains, Xinjiang, China. Ecol. Res. 2009, 24, 441–452. [Google Scholar] [CrossRef]
- Keenan, T.F.; Hollinger, D.Y.; Bohrer, G.; Dragoni, D.; Munger, J.W.; Schmid, H.P.; Richardson, A.D. Increase in forest water-use efficiency as atmospheric carbon dioxide concentrations rise. Nature 2013, 499, 324–327. [Google Scholar] [CrossRef] [PubMed]
- Keenan, T.F.; Richardson, A.D. The timing of autumn senescence is affected by the timing of spring phenology: Implications for predictive models. Glob. Chang. Biol. 2015, 21, 2634–2641. [Google Scholar] [CrossRef] [PubMed]
- Norby, R.J.; DeLucia, E.H.; Gielen, B.; Calfapietra, C.; Giardina, C.P.; King, J.S.; Ledford, J.; McCarthy, H.R.; Moore, D.J.; Ceulemans, R. Forest response to elevated CO2 is conserved across a broad range of productivity. Proc. Natl. Acad. Sci. USA 2005, 102, 18052–18056. [Google Scholar] [CrossRef] [PubMed]
- Ainsworth, E.A.; Long, S.P. What have we learned from 15 years of free-air CO2 enrichment (FACE)? A meta-analytic review of the responses of photosynthesis, canopy properties and plant production to rising CO2. New Phytol. 2005, 165, 351–372. [Google Scholar] [CrossRef] [PubMed]
- Smith, A.R.; Lukac, M.; Hood, R.; Healey, J.R.; Miglietta, F.; Godbold, D.L. Elevated CO2 enrichment induces a differential biomass response in a mixed species temperate forest plantation. New Phytol. 2013, 198, 156–168. [Google Scholar] [CrossRef] [PubMed] [Green Version]
- Hickler, T.; Smith, B.; Prentice, I.C.; MjÖFors, K.; Miller, P.; Arneth, A.; Sykes, M.T. CO2 fertilization in temperate FACE experiments not representative of boreal and tropical forests. Glob. Chang. Biol. 2008, 14, 1531–1542. [Google Scholar] [CrossRef]
- Gómez-Guerrero, A.; Silva, L.C.; Barrera-Reyes, M.; Kishchuk, B.; Velázquez-Martínez, A.; Martínez-Trinidad, T.; Plascencia-Escalante, F.O.; Horwath, W.R. Growth decline and divergent tree ring isotopic composition (δ13C and δ18O) contradict predictions of CO2 stimulation in high altitudinal forests. Glob. Chang. Biol. 2013, 19, 1748–1758. [Google Scholar] [CrossRef] [PubMed]
- Salzer, M.W.; Hughes, M.K.; Bunn, A.G.; Kipfmueller, K.F. Recent unprecedented tree-ring growth in bristlecone pine at the highest elevations and possible causes. Proc. Natl. Acad. Sci. USA 2009, 106, 20348–20353. [Google Scholar] [CrossRef] [PubMed]
- Norby, R.J.; Warren, J.M.; Iversen, C.M.; Medlyn, B.E.; McMurtrie, R.E. CO2 enhancement of forest productivity constrained by limited nitrogen availability. Proc. Natl. Acad. Sci. USA 2010, 107, 19368–19373. [Google Scholar] [CrossRef] [PubMed]
- Peñuelas, J.; Canadell, J.G.; Ogaya, R. Increased water-use efficiency during the 20th century did not translate into enhanced tree growth. Glob. Ecol. Biogeogr. 2011, 20, 597–608. [Google Scholar] [CrossRef]
- Franks, P.J.; Adams, M.A.; Amthor, J.S.; Barbour, M.M.; Berry, J.A.; Ellsworth, D.S.; Farquhar, G.D.; Ghannoum, O.; Lloyd, J.; McDowell, N. Sensitivity of plants to changing atmospheric CO2 concentration: From the geological past to the next century. New Phytol. 2013, 197, 1077–1094. [Google Scholar] [CrossRef] [PubMed]
- Hickler, T.; Vohland, K.; Feehan, J.; Miller, P.A.; Smith, B.; Costa, L.; Giesecke, T.; Fronzek, S.; Carter, T.R.; Cramer, W. Projecting the future distribution of European potential natural vegetation zones with a generalized, tree species-based dynamic vegetation model. Glob. Ecol. Biogeogr. 2012, 21, 50–63. [Google Scholar] [CrossRef]
- Smith, B.; Prentice, I.C.; Sykes, M.T. Representation of vegetation dynamics in the modelling of terrestrial ecosystems: Comparing two contrasting approaches within European climate space. Glob. Ecol. Biogeogr. 2001, 10, 621–637. [Google Scholar] [CrossRef]
- Mosier, T.M.; Hill, D.F.; Sharp, K.V. 30-Arcsecond monthly climate surfaces with global land coverage. Int. J. Climatol. 2014, 34, 2175–2188. [Google Scholar] [CrossRef]


| Sites | Elevation (m) | Density (tree/ha) | DBH (cm) | Height (m) | T a (°C) | P b (mm) | Area c (ha) |
|---|---|---|---|---|---|---|---|
| Site1 | 2770 | 1369 | 15.4 ± 0.23 | 11.6 ± 0.16 | 0.36 ± 0.1 | 408.4 ± 8.7 | 0.25 |
| Site2 | 2870 | 1340 | 12.4 ± 0.49 | 9.5 ± 0.33 | 0.10 ± 0.1 | 418.2 ± 8.9 | 0.25 |
| Site3 | 3100 | 2032 | 12.0 ± 0.31 | 9.2 ± 0.20 | −0.72 ± 0.1 | 422.5 ± 9.1 | 0.25 |
| Site4 | 3250 | 844 | 15.6 ± 0.55 | 9.3 ± 0.30 | −1.17 ± 0.1 | 430.9 ± 9.2 | 0.25 |
| Sites | Latitude (°) | Longitude (°) | Aspect (°) | Slope (°) | Soil Texture (%) | Soil Depth (m) | ||
|---|---|---|---|---|---|---|---|---|
| Sand | Silt | Clay | ||||||
| Site1 | 38.443 | 99.905 | 15 | 32 | 10.3 | 37.7 | 52.0 | 0.80 |
| Site2 | 38.438 | 99.913 | 9 | 24 | 15.6 | 44.5 | 39.9 | 0.85 |
| Site3 | 38.427 | 99.928 | 2 | 8 | 17.2 | 39.4 | 43.4 | 0.72 |
| Site4 | 38.421 | 99.926 | 22 | 27 | 15.0 | 41.8 | 43.2 | 0.64 |
| RCPs | RCP2.6 | RCP4.5 | RCP6.0 | RCP8.5 | Average for Four RCPs | |||||||||||
|---|---|---|---|---|---|---|---|---|---|---|---|---|---|---|---|---|
| Sites | T (°C) | P (%) | CO2 (ppm) | T (°C) | P (%) | CO2 (ppm) | T (°C) | P (%) | CO2 (ppm) | T (°C) | P (%) | CO2 (ppm) | T (°C) | P (%) | CO2 (ppm) | |
| Site1 | +1.6 | +2.0 | 437.5 | +2.6 | +2.0 | 524.3 | +2.7 | +2.8 | 549.8 | +4.0 | +5.1 | 677.1 | +2.73 | +3.0 | 547.2 | |
| Site2 | +1.6 | +2.3 | 437.5 | +2.6 | +2.3 | 524.3 | +2.7 | +3 | 549.8 | +4.0 | +5.3 | 677.1 | +2.73 | +3.2 | 547.2 | |
| Site3 | +1.6 | +2.4 | 437.5 | +2.6 | +2.0 | 524.3 | +2.7 | +2.7 | 549.8 | +4.0 | +5.9 | 677.1 | +2.73 | +3.2 | 547.2 | |
| Site4 | +1.6 | +2.3 | 437.5 | +2.6 | +2.0 | 524.3 | +2.7 | +2.6 | 549.8 | +4.0 | +5.9 | 677.1 | +2.73 | +3.2 | 547.2 | |
| Climatic Scenarios a | CO2 Concentration | T | P |
|---|---|---|---|
| C0T0P0 | No change | No change | No change |
| C0T0P1 | No change | No change | +3.1% |
| C0T1P0 | No change | +2.73 °C | No change |
| C0T1P1 | No change | +2.73 °C | +3.1% |
| C1T0P0 | 547.2 ppm | No change | No change |
| C1T0P1 | 547.2 ppm | No change | +3.1% |
| C1T1P0 | 547.2 ppm | +2.73 °C | No change |
| C1T1P1 | 547.2 ppm | +2.73 °C | +3.1% |
| RCPs | RCP2.6 (%) | RCP4.5 (%) | RCP6.0 (%) | RCP8.5 (%) | |
|---|---|---|---|---|---|
| Sites | |||||
| Site1 | 23.0 | 37.6 | 42.0 | 58.4 | |
| Site2 | 24.6 | 39.6 | 44.0 | 60.8 | |
| Site3 | 28.4 | 45.8 | 50.4 | 71.4 | |
| Site4 | 29.2 | 46.9 | 51.5 | 72.8 | |
| RCPs | RCP2.6 (%) | RCP4.5 (%) | RCP6.0 (%) | RCP8.5 (%) | |
|---|---|---|---|---|---|
| Sites | |||||
| Site1 | −2.5 | −6.6 | −7.0 | −9.5 | |
| Site2 | −3.1 | −7.8 | −8.4 | −11.8 | |
| Site3 | −2.2 | −7.0 | −7.4 | −9.8 | |
| Site4 | −2.8 | −7.5 | −7.8 | −9.7 | |
| RCPs | RCP2.6 (%) | RCP4.5 (%) | RCP6.0 (%) | RCP8.5 (%) | |
|---|---|---|---|---|---|
| Sites | |||||
| Site1 | 26.2 | 47.5 | 52.9 | 75.3 | |
| Site2 | 28.7 | 51.7 | 57.4 | 82.7 | |
| Site3 | 31.4 | 57.1 | 62.8 | 90.3 | |
| Site4 | 33.2 | 59.3 | 64.9 | 92.1 | |
© 2016 by the authors; licensee MDPI, Basel, Switzerland. This article is an open access article distributed under the terms and conditions of the Creative Commons Attribution (CC-BY) license (http://creativecommons.org/licenses/by/4.0/).
Share and Cite
Peng, S.; Chen, Y.; Cao, Y. Simulating Water-Use Efficiency of Piceacrassi folia Forest under Representative Concentration Pathway Scenarios in the Qilian Mountains of Northwest China. Forests 2016, 7, 140. https://doi.org/10.3390/f7070140
Peng S, Chen Y, Cao Y. Simulating Water-Use Efficiency of Piceacrassi folia Forest under Representative Concentration Pathway Scenarios in the Qilian Mountains of Northwest China. Forests. 2016; 7(7):140. https://doi.org/10.3390/f7070140
Chicago/Turabian StylePeng, Shouzhang, Yunming Chen, and Yang Cao. 2016. "Simulating Water-Use Efficiency of Piceacrassi folia Forest under Representative Concentration Pathway Scenarios in the Qilian Mountains of Northwest China" Forests 7, no. 7: 140. https://doi.org/10.3390/f7070140