1. Introduction
Urban areas and forests play an important role in the carbon (C) cycle and the global climate because they are main drivers in the increase and regulation, respectively, of atmospheric carbon dioxide (CO
2), a major greenhouse gas [
1,
2]. Cities in the developing world are often documented as sources of high levels of carbon dioxide emissions [
3]. It is also reported that without forests and their regulating ecosystem process and services,
sensu [
4], carbon dioxide concentration in the atmosphere would be about 43% higher than current concentrations [
5]. Indeed, the
International Panel for Climate Change (IPCC) has highlighted the importance of developing baseline estimates of carbon stocks in terrestrial ecosystems, which require mapping vegetation biomass distribution from the local to the global scale [
6,
7]. Precise carbon stock estimates in and around urban areas, therefore, represent key and necessary information to define carbon emission mitigation strategies and programs at the local and regional level (e.g., REDD+, [
3,
8]).
Latin America and the Caribbean regions have about 80% of their population residing in urban areas. Most periurban areas in Neotropical Latin America have historically undergone land use change [
9]. Recently this urbanization trend has increased and led to the concern of deleterious effects to the hydrology and to increased carbon emissions [
10,
11]. In particular, periurban forests in Neotropical America are providers of key ecosystem services to the highly urbanized population in the region, but they are increasingly being lost [
6,
12,
13]. Among terrestrial ecosystems, tropical forests are possibly the most important in regulating global carbon cycle. Lewis et al. [
14] estimated that tropical forests are sinks for about 40% of terrestrial carbon on Earth, and responsible for almost half of the terrestrial net primary productivity [
15]. Pan et al. [
7] calculated that tropical forests store about 475 × 10
9 Mg of carbon, highlighting the paramount role these ecosystems have in regulating climate and mitigating climate change. Thus, information is needed on how to rapidly map, monitor, and estimate carbon stocks and other ecosystem services in periurban, Neotropical forests in a rapid, cost-effective manner.
In South America, estimations of aboveground biomass (AGB), a key proxy for carbon stocks [
16], have been derived especially for lowland tropical rainforests [
17,
18,
19] and for semi-arid savannas and dry forests [
20]. One of the less studied Neotropical types of forest cover, but with a high potential contribution to the terrestrial C cycle, are early secondary forests whose development follows highly intervened forest land covers. These high Andean periurban secondary forest formations, typical of mountain areas, are present at elevation between ca. 2600 and 3200 m [
21]. This vegetation type is characterized in general terms by a closed, dense canopy and low-to-medium woody plants that develop via ecological succession after land abandonment—typically cattle, pastures, or crops. In Colombia, it is estimated that in 1995 they covered about 7% of the country’s terrestrial area [
22]. Due to the dynamics of rural land abandonment and migration to urban areas and subsequent urbanization characterizing Colombia in recent decades [
9,
23], it is very likely that Colombian secondary forests are currently following an expansion trend. More importantly, Neotropical secondary forests are still not well-characterized in terms of composition, successional dynamics, carbon cycle, and even biodiversity [
24]. In this context, the estimation of AGB and carbon in these ecosystems would represent important information to better characterize such a little studied successional forest type from the Neotropics.
Ground-based methods for forest AGB estimation are generally based on permanent plots, forest inventory, and monitoring methods that use species/family-specific or general allometric equations obtained from destructive methods and in situ dendrometric measurements (e.g., diameter at breast height (DBH), wood density, height, volume, and crown area (CA)), [
19,
25,
26,
27]. Although these approaches are common and can reach acceptable levels of accuracy, they are not adequate to map AGB distribution at regional scales in the Neotropics, because of the costs, access, and safety issues, and time necessary to perform extended field-based forest inventories.
Remote sensing, both active and passive, provide some of the most time-efficient and cost-effective approaches to derive AGB estimation at regional and national scale. Radar, optical, and LiDAR data have been extensively used to estimate AGB with a variety of methods (see [
28,
29] for comprehensive reviews). The use of optical data (visible, near-infrared) has been largely exploited for vegetation biomass estimation, due to the large amount and type of optical imagery available. Especially, sensors from the Landsat series (i.e., TM, ETM+, OLI) have been historically used to map biomass and carbon in a variety of ecosystems, for the relevance of their spectral bands, the continuity of the program, and the suitability of the 30 m spatial resolution for regional mapping (e.g., [
30,
31,
32,
33]). Several research discussed AGB modelling using Landsat imagery in tropical regions [
34,
35,
36,
37]. Most of these studies reported difficulties in modelling AGB in complex forest stands such as successional forest. Lu [
38] demonstrated that the complexity of forest vegetation results in highly variable standing stocks of AGB and an even more variable rate of AGB accumulation following a deforestation event such as the case in successional forests.
Most available optical-based methods are established based on the relationships between field-derived AGB and different vegetation indices (VI). In doing so the aim is the identification of an analytical relationship between on-the-ground AGB estimates and spectral indices sensitive to photosynthetically active radiation and scaling with amount of biomass [
39,
40,
41,
42]. A vegetation index is generally derived from the spectral reflectance of two or more bands, and proportional to the value of biophysical parameters like leaf area index (LAI), net primary productivity (NPP), and absorbed photosynthetically active radiation (APAR) [
43]. The choice of adequately performing indices (VIs) and satellite data type depends on the scale of analysis, type of ecosystem and environmental conditions, vegetation density, spectral information available, and the nature of the field information available.
In this work—due to the difficulty in AGB measurements in often inaccessible, dense Andean forests, as well as a limited spatial extent and availability of secondary forest plot data—we hypothesize that the use of very high resolution (VHR) data from commercial satellites, such as the GeoEye-1 and Pleiades-1A satellites, coupled with limited field data can be used to model AGB in complex secondary forests of the Colombian Andes. Previous work with VHR imagery includes the use of IKONOS by Thenkabail et al. [
44] to estimate AGB and carbon stock of oil palm plantations in African savannas. Zhou and colleagues [
45] exploited VIs and texture images derived from Quickbird and topographic information to derive AGB of black locust plantations in the Loess Plateau of China. Multispectral high-resolution Worldview-2 images were also used by Zhu et al. [
46] to derive AGB for mangrove ecosystems using neural networks algorithms. Pereira et al. [
47] used GeoEye-1 imagery to estimate biomass and carbon stock of coffee crops in Brazil exploiting a series of VIs.
The aim of this study is to develop an approach to model AGB and carbon stocks in complex secondary periurban Neotropical forests using very high resolution satellite imagery and limited field data from periurban early and late secondary forest monitoring plots. Specific objectives of this research are to:
- (i)
identify an exploitable relationship between VIs derived from VHR satellite imagery and AGB estimated in the field in Andean periurban secondary forests;
- (ii)
assess the effect of data processing on the performance of the biomass estimation models.
Such an approach should yield a low cost and rapid method for forest inventory and monitoring activities, and assessing the regulating ecosystem services and carbon dioxide offset potential of secondary periurban Neotropical forests in the Colombian Andes [
8,
19,
24].
3. Results
The goodness of fit and accuracy were calculated using
R2 and RMSE, for the best linear, semi-log, and log-log models of the five VIs (
Table 5). All
p-values were reported in
Table 5 so as to indicate the process used for final model selection. For four out of the five vegetation indices, model goodness increased with the implementation of additional pre-processing steps (e.g., applying atmospheric correction (Group B, C, D) on radiance (Group A) images and further apply topographic correction (Group E)). For the normalized difference greenness index (NDGI)—the only index exploiting the Green band—no evident improvement in model goodness was noticeable among the data groups. The importance of the red wavelength as a most critical band in providing vegetation biophysical information is well-supported in the literature (e.g., [
44]). Nevertheless, NDGI shows the best
R2 in the radiance and TOA data groups (A, B). Considering both
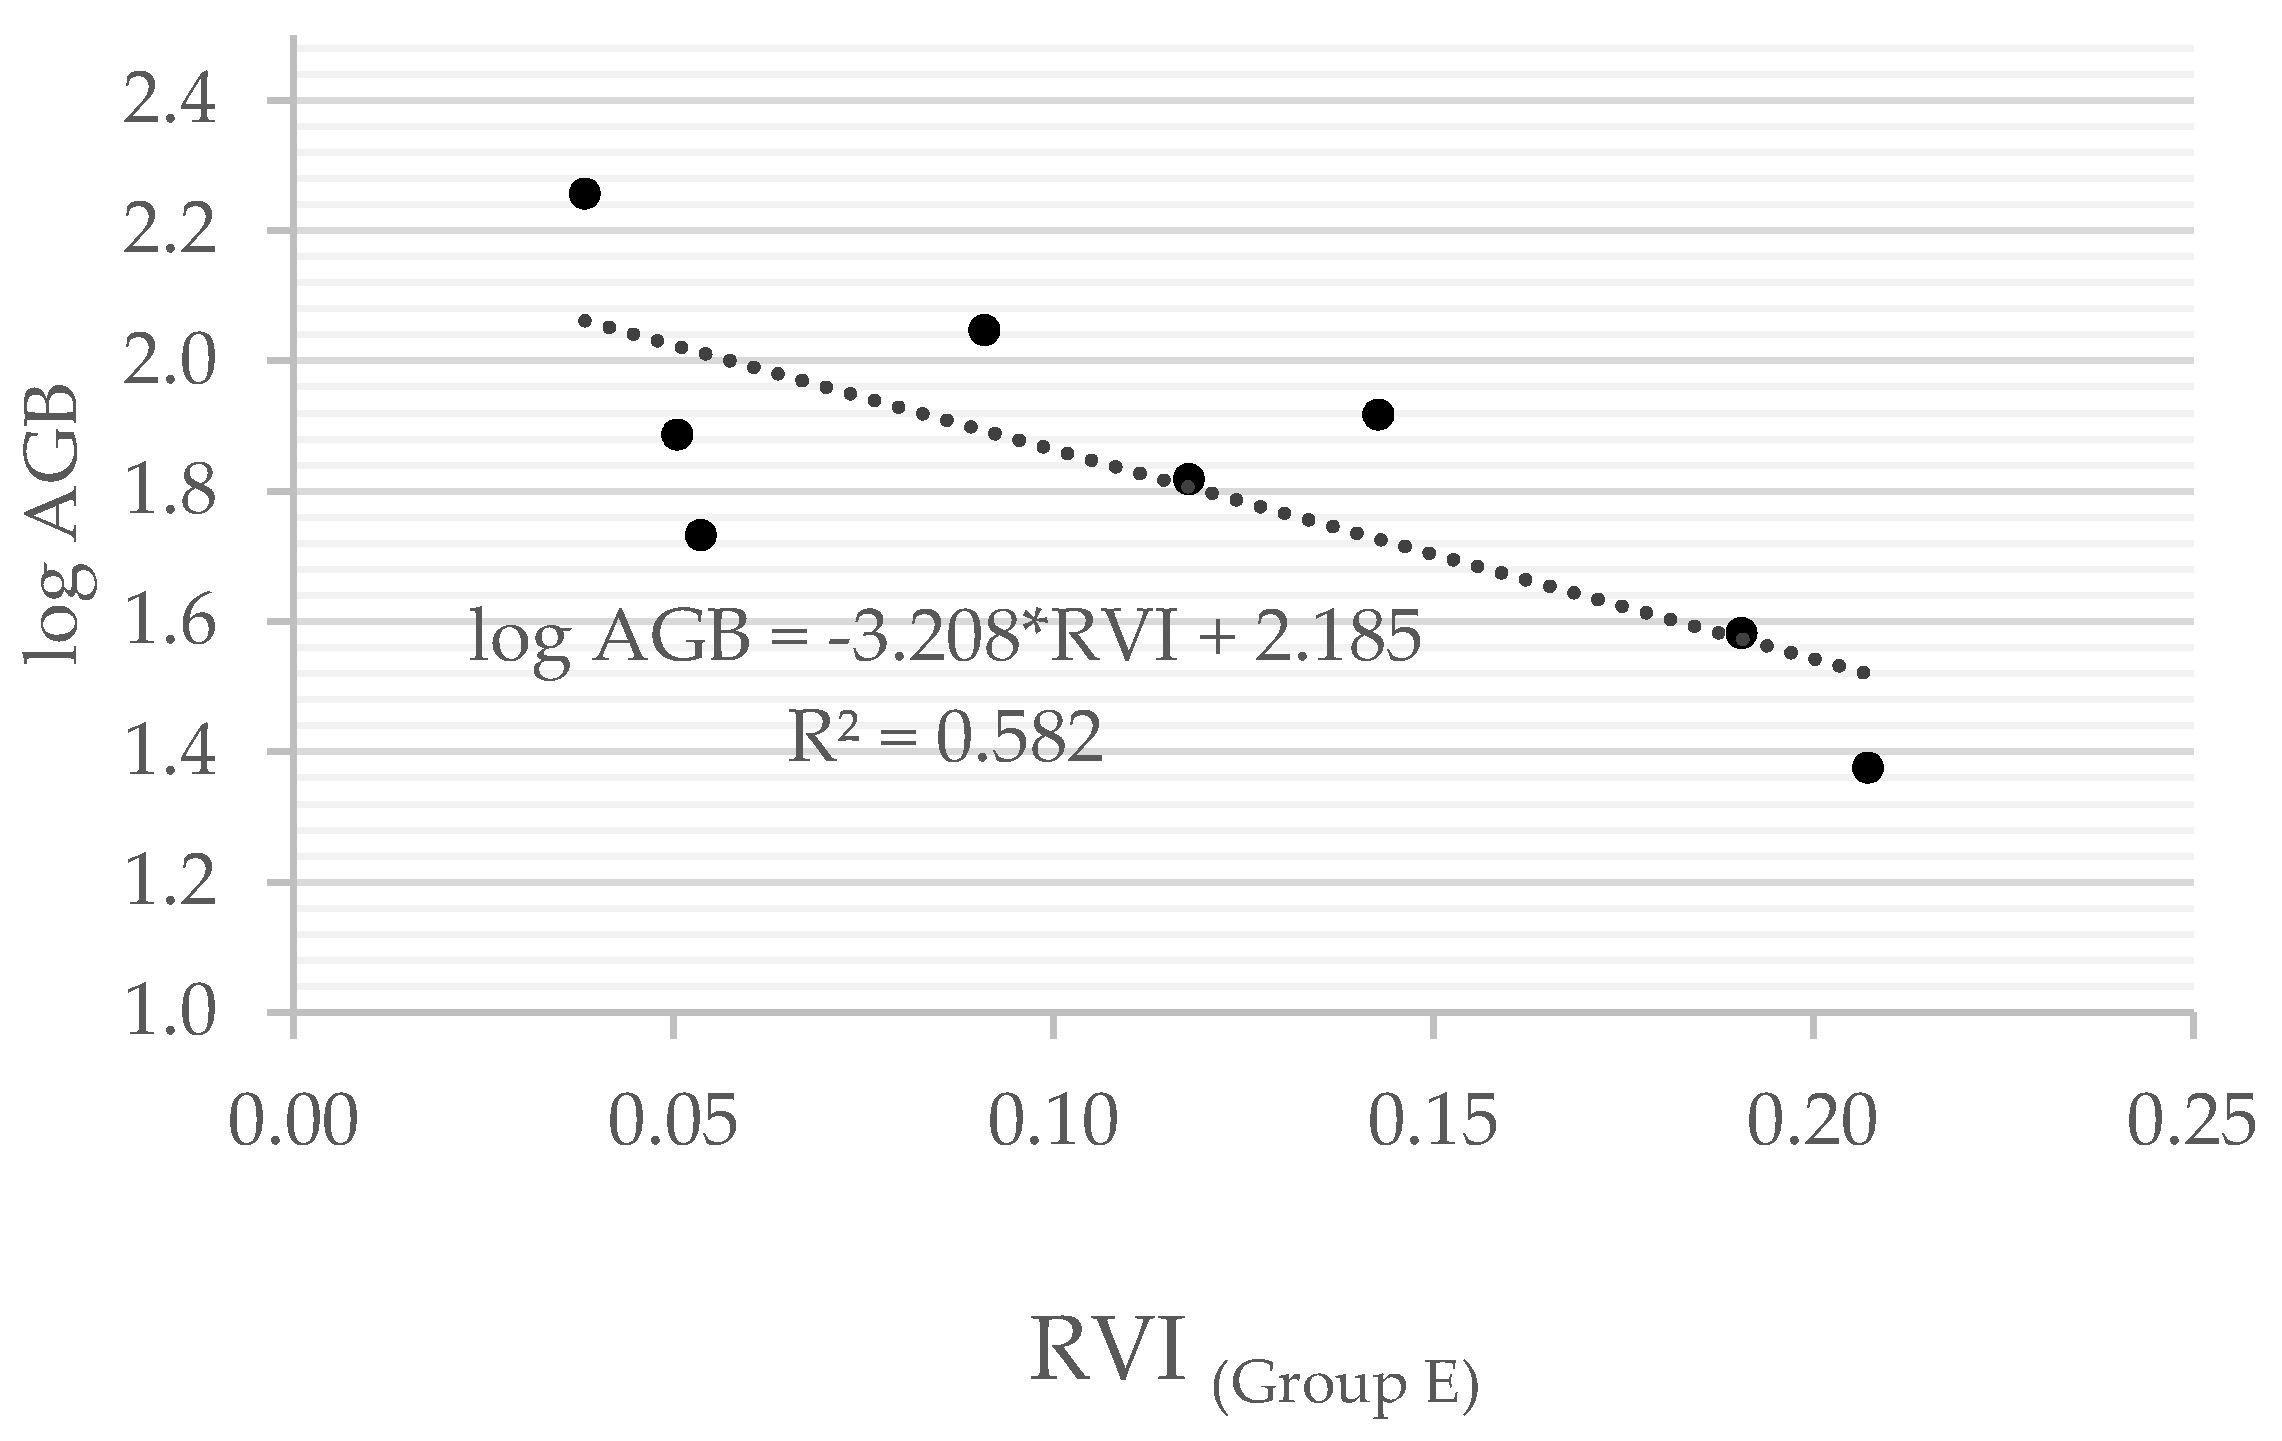
R2 and RMSE parameters, the best performing models involved the ratio vegetation index (RVI), transformed vegetation index (TVI), and NDVI indices in Group E, while the Vegetation Index Number (VIN) was the worst performing. In absolute terms, the AGB model which performed better was derived from the combination of the topographic corrected data (calculated on FLAASH atmospherically corrected images) and the ratio vegetation index (
Figure 3) in a semi-log form (
R2 = 0.582,
p = 0.028):
For the purpose of better synthesizing our results, we report AGB model equations only for the semi-log form for all indices and data processing groups (
Table 6). In general terms, we found how the synergy betweeen the atmospheric and topographic corrections notably improved model goodness of fit in the AGB estimation models.
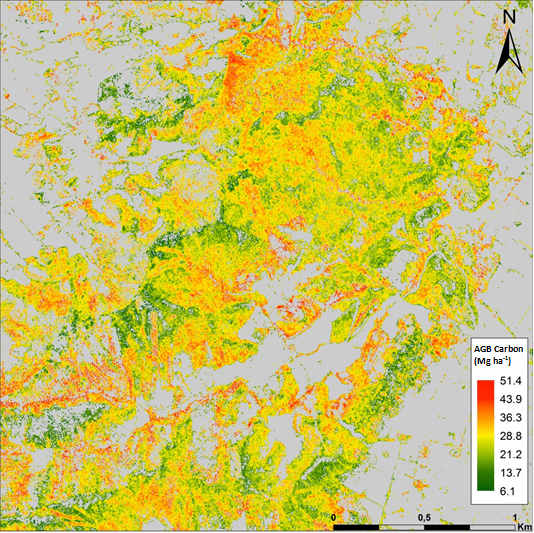
The best performing model for AGB estimation (1) was used to derive maps of aboveground carbon stocks (Mg·ha
−1) for the Tabio test area. Aboveground biomass values of secondary forests were calculated for the corresponding VHR scenes (Pleiades-1A and GeoEye-1). Using the relationship of C stocks = 0.471 × AGB from Thomas and Martin [
73], accordingly we mapped the spatial distribution of aboveground C stocks (Mg·ha
−1) (
Figure 4).
4. Discussion
The present study investigated the use of remote sensing to cost-effectively estimate AGB biomass and carbon stocks for Andean successional forests in periurban areas of Bogotá, Colombia. The AGB and carbon stock mapping estimates for a mid-successional stage secondary forest in the test area (ca. 6–51 Mg·ha
−1) were within the range reported by other studies of secondary forests in the Neotropics (e.g., [
74]). We identified significant analytical relationships between vegetation indices extracted from multiple Geoeye-1 and Pleiades-1A VHR imagery and AGB values estimated using field measurements and allometric equations. A basic underlying assumption of the modelling approach is that larger tree densities (i.e., canopy density) are associated with larger aboveground biomass estimates [
65]. Among the different preprocessing workflows used, the study confirmed the importance of the synergy between atmospheric and topographic correction when estimating biomass using satellite-based vegetation indices. At an average height of 2800 m our Andean study area is characterized by the frequent presence of dense aerosols and rugged terrain. As such, these are key factors when deriving the spectral characteristics of Andean Neotropical vegetation, and thus represent significant elements to account for when calculating vegetation indices in these environments. Also, the correction model we applied (FLAASH) has the advantage of being easily adaptable to specific types of environmental conditions, allowing for the proper mitigation of the effects of site-specific atmospheric conditions.
We tested the use of empirical atmospheric correction technique through image-to-image normalization and compared the results with the FLAASH model-based atmospheric correction and at sensor radiance results. We found that image-to-image normalization produced results comparable to the FLAASH module results. The manual selection of less-optimal dark and bright objects in each image could explain the slightly inferior results compared to the FLAASH model output results. However, we believe image-to-image normalization has the potential of providing better results in the case of the existence of variations in illumination conditions due to sparse clouds [
75], which is often the case in the Andeans plains.. More research is needed to test other statistically-based empirical atmospheric correction as well as different topographic correction models [
76,
77].
In this study we also tested the use of topographic illumination variation correction algorithm [
64]. Our results show slight improvement in the AGB model goodness of fit and RMSE when the topographic correction is applied to the images. Although spectrally normalized vegetation indices such as the NDVI are less affected by the topographic-induced illumination variations [
78,
79], we believe that robust modeling of bidirectional distribution reflection function (BDRF) should provide for a more robust approach to handle the sun-object-sensor geometry variations common in forested land covers [
80,
81]. However, modeling the BDRF requires multi-view and multi-date images, which can be hard to achieve in our study area due to the persistent cloud cover found throughout the year. We also believe that the presence of a high resolution digital elevation model could have improved the topographic correction process and possibly also the AGB model results.
Overall, the VHR imagery provided satisfactory results for AGB and carbon modelling, considering the limitations posed by the number and size of the plots (20 m × 20 m) available for this analysis. The ratio vegetation index—the simple ratio between the NIR and the RED bands [
70]—provided the best results among our AGB estimation models. It is not possible, however, to generalize about the goodness of the model relating RVI to in situ AGB, that is, if this particular index also has an optimal performance in different successional forests and environmental conditions. However, it does represent a significant relationship for high Andean secondary forest vegetation.
The study was limited by the small number of available permanent plots. Further research will involve the establishment of a larger network of regional and urban to rural gradient plots, to better take into account the heterogeneity of diverse species assemblages and their ecological successional stages, together with stochastic small-scale disturbances. Additional sources of error in our approach are also introduced by the selection of specific allometric equations for estimating AGB [
82]. Similarly, we did not account for the presence and contribution to total biomass and carbon stocks from nonarboreal vegetation, such as mosses, lianas, ferns, and epiphytes, which can contribute a considerable amount of biomass in tropical secondary forests [
83].
5. Conclusions
Secondary forests like those in this study represent a dominant land cover type, to the extent that in several tropical countries their surface area already exceeds that of mature forest cover [
84]. In addition, periurban forests that develop after land clearing or reforestation activities or, similarly, after designation as a conservation or protected area, represent key reservoirs for terrestrial biodiversity [
85,
86], as well as providing a large array of other provision, regulation, and cultural ecosystem services [
12,
24]. For these reasons, we believe the results of the present study added a relevant piece of information for the characterization of these little known successional forests.
Overall, this study’s approach and findings provide key baseline information for landscape level analyses in the Colombian Andes relating to local to regional AGB and carbon stocks estimates for little studied secondary forest types. Also, it provides a comprehensive, rapid, and cost-effective framework for AGB estimation using small field plots coupled with available VHR imagery. This approach can specifically be applied to facilitate periurban and regional mapping assessments of forest ecosystem service provision. It can also be used to better understand the effects of direct and indirect drivers of forest cover change, urbanization rates, and ecosystem service provision, as well as for forest inventory and monitoring of REDD+ (Reducing Emissions from Deforestation and forest Degradation) projects. Methods and mapping framework findings could also be exploited to develop carbon offset protocols to mitigate anthropogenic urban carbon emission from adjacent Bogotá and other cities in the Andes.


 ,
, 


