
Water, Rather than Temperature, Dominantly Impacts How Soil Fauna Affect Dissolved Carbon and Nitrogen Release from Fresh Litter during Early Litter Decomposition

 , ,
, ,
Abstract
:1. Introduction
2. Materials and Methods
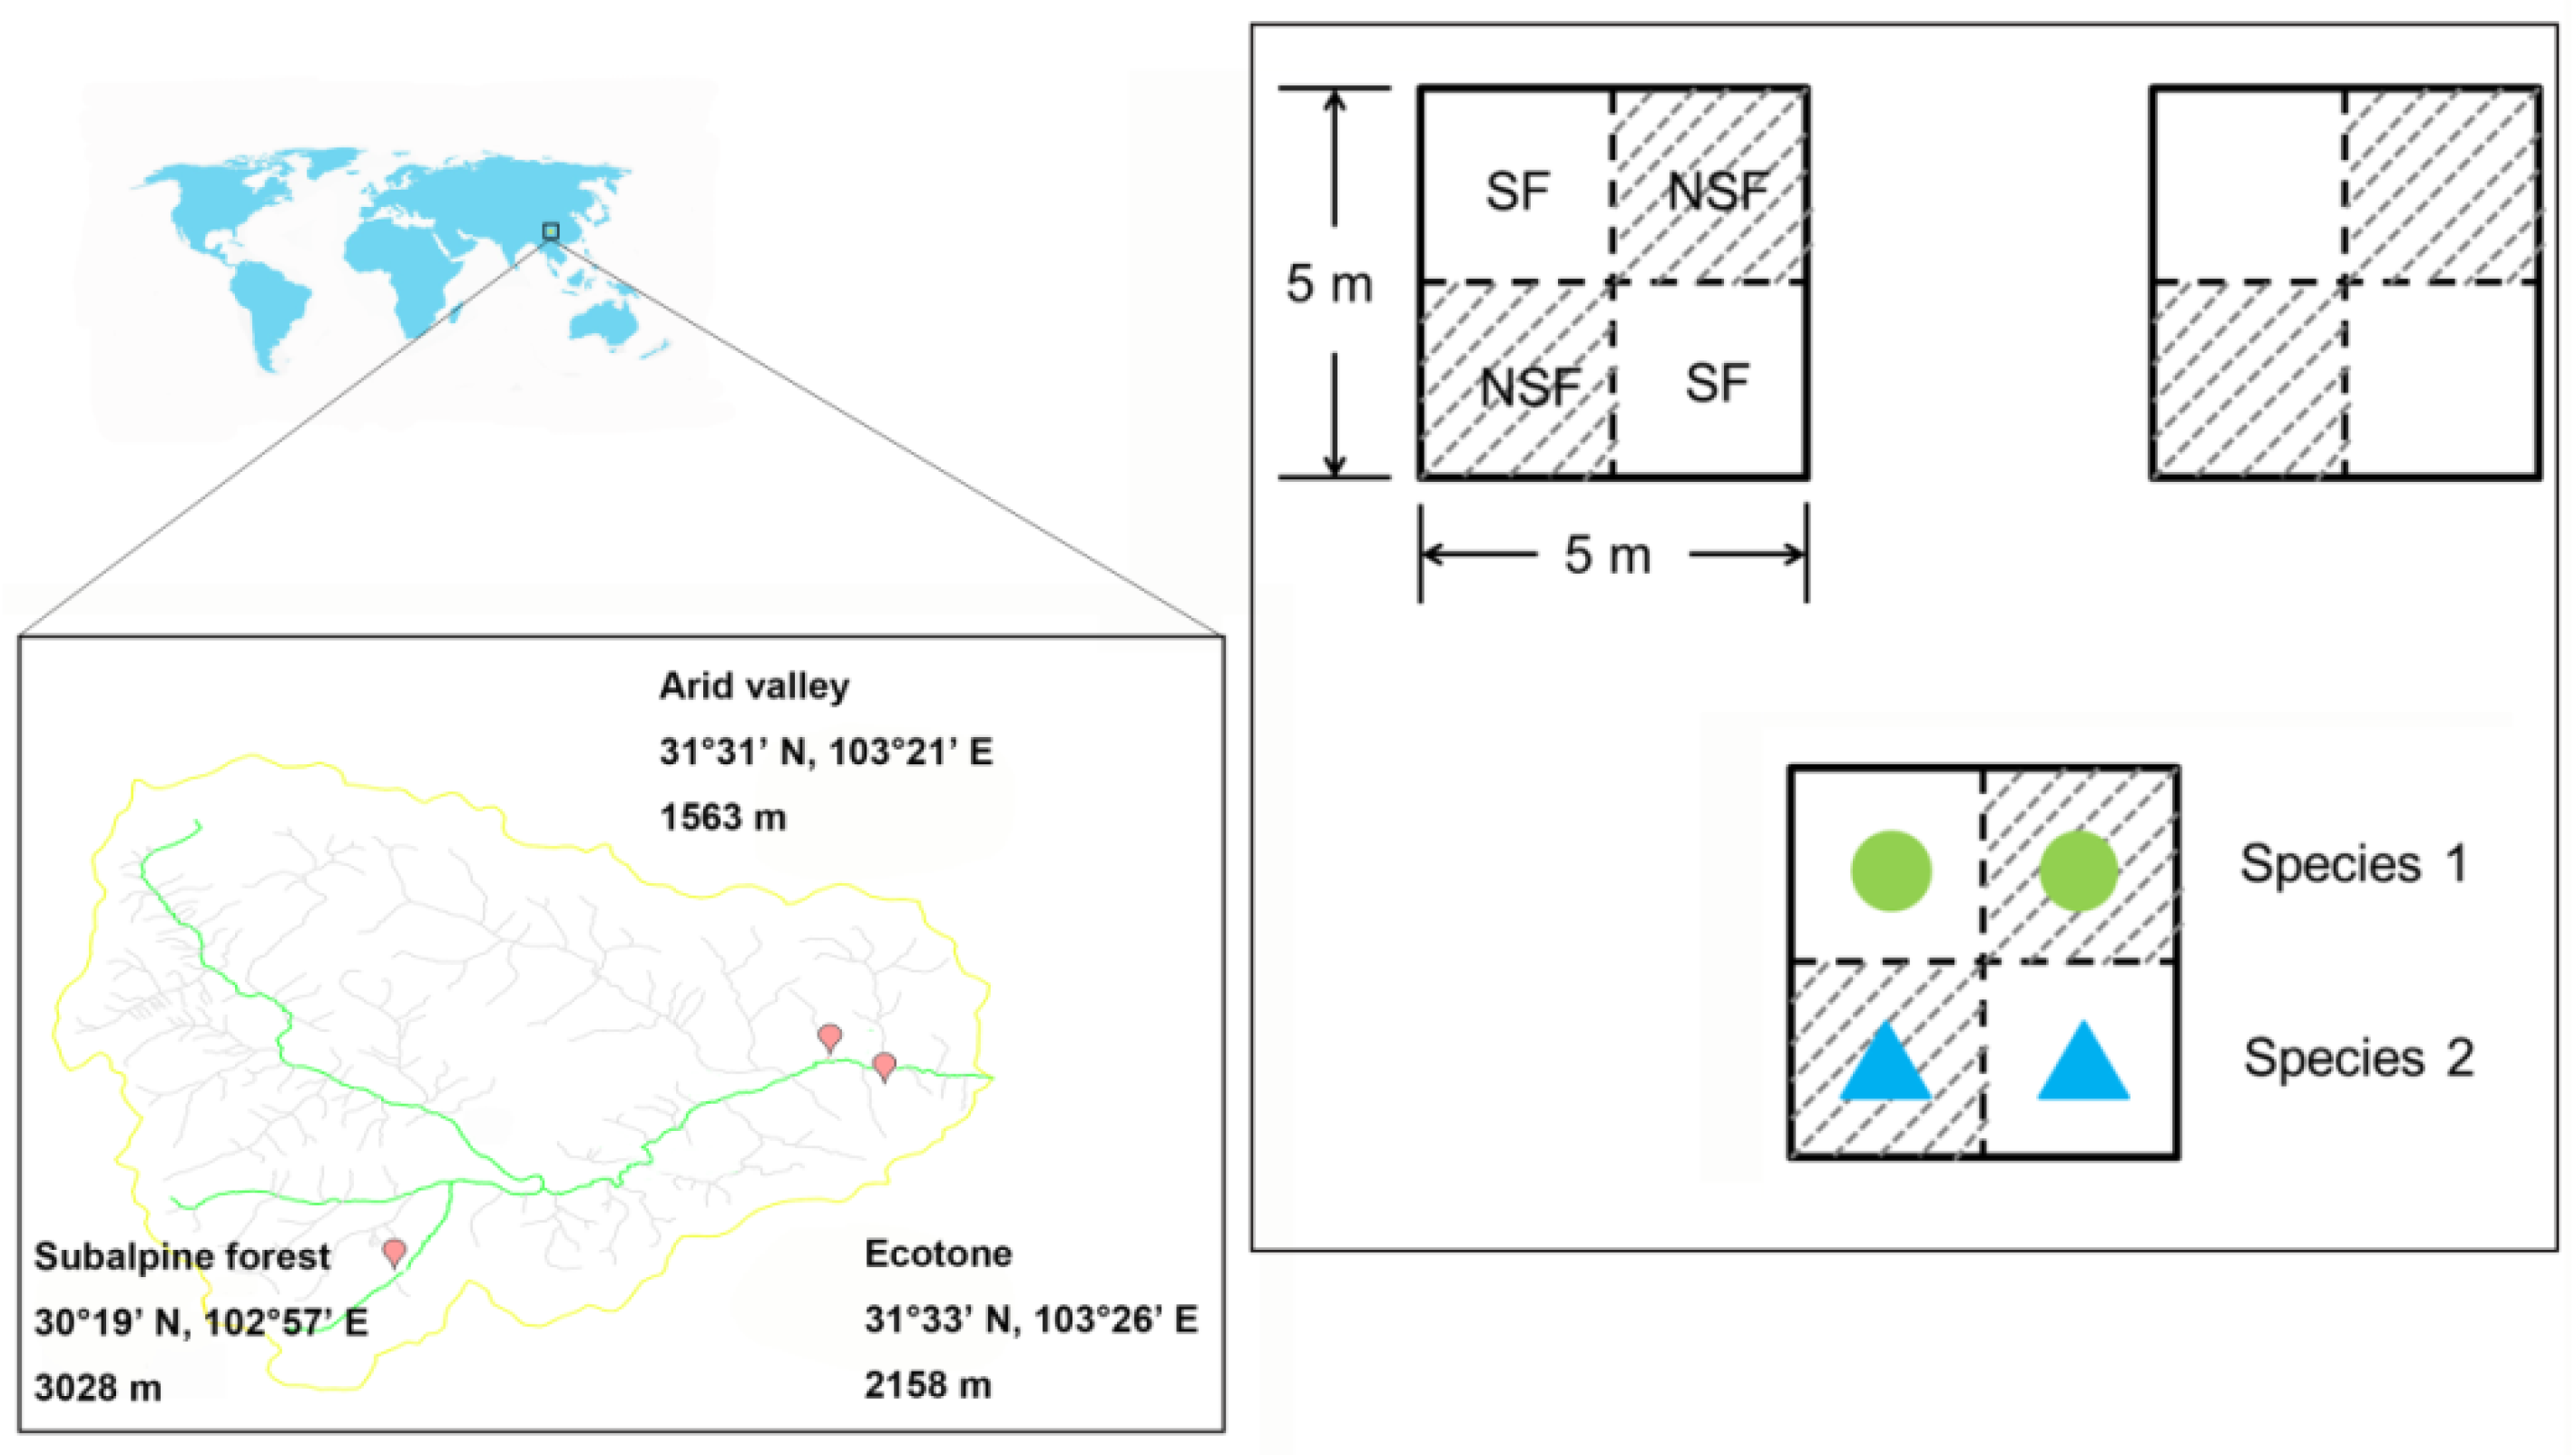
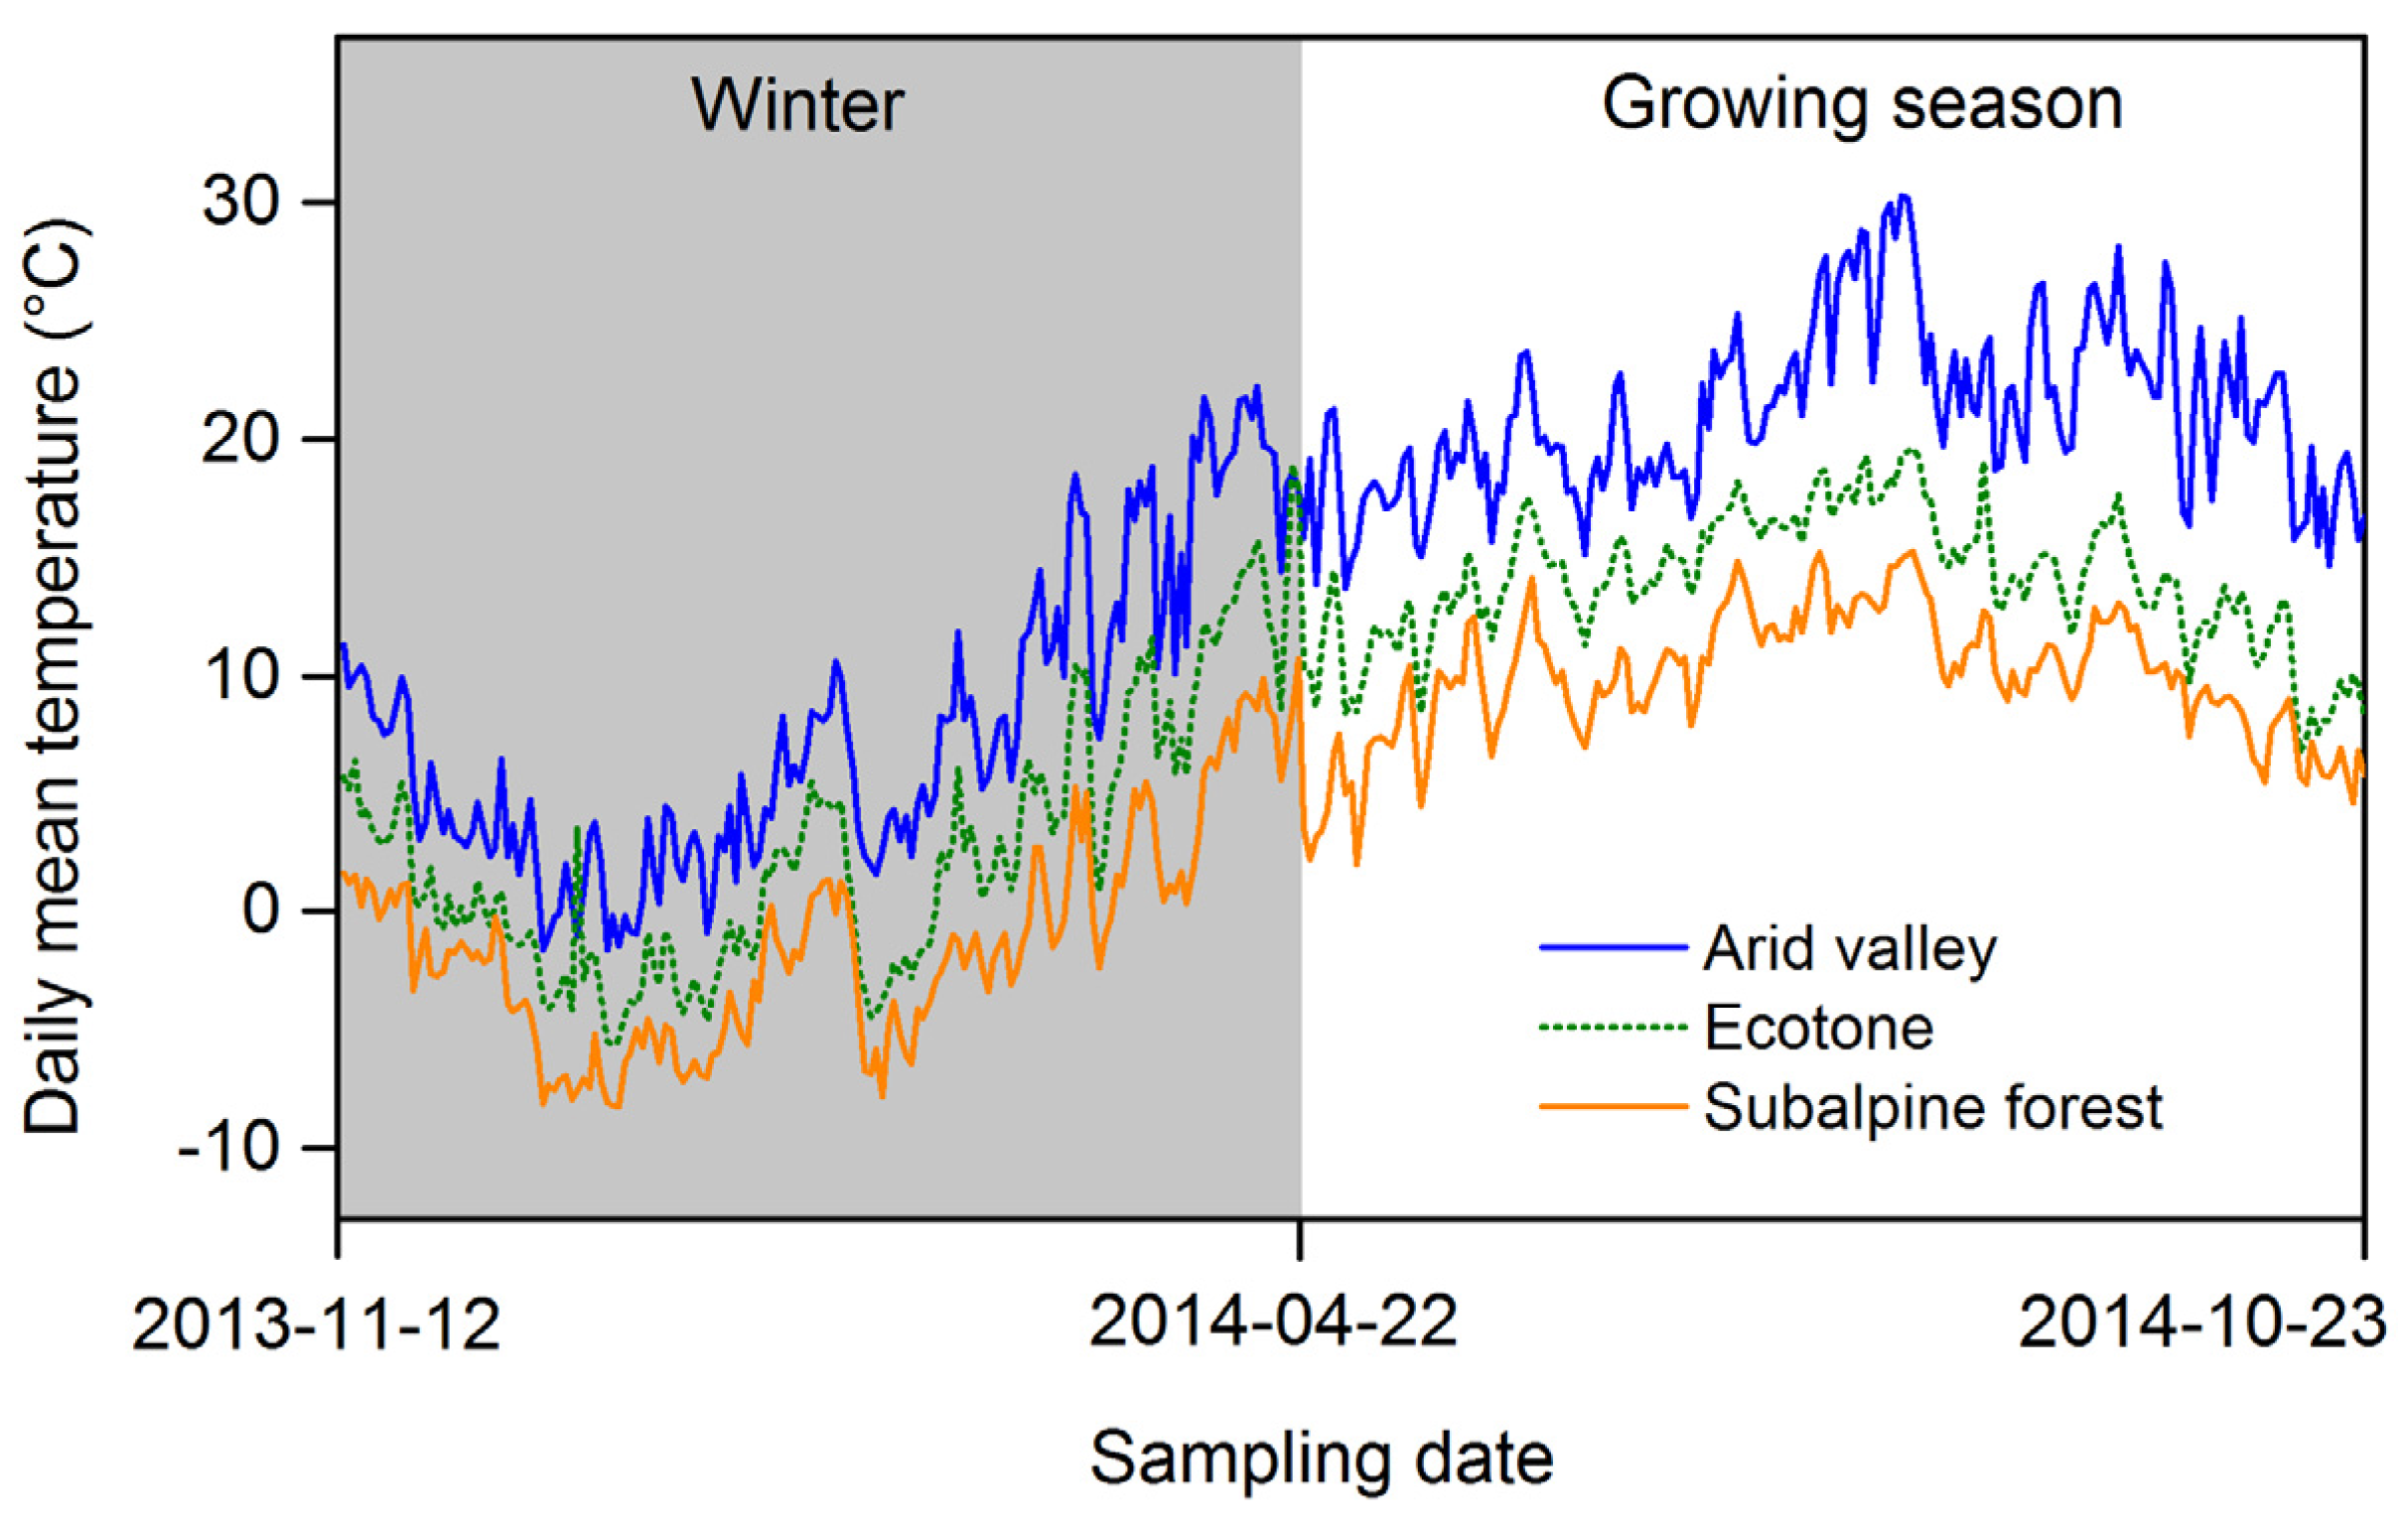
2.1. Site Description
2.2. Experimental Design
2.3. Sample Collection and Analysis
2.4. Data Calculations and Statistical Analyses
3. Results
3.1. Soil Fauna
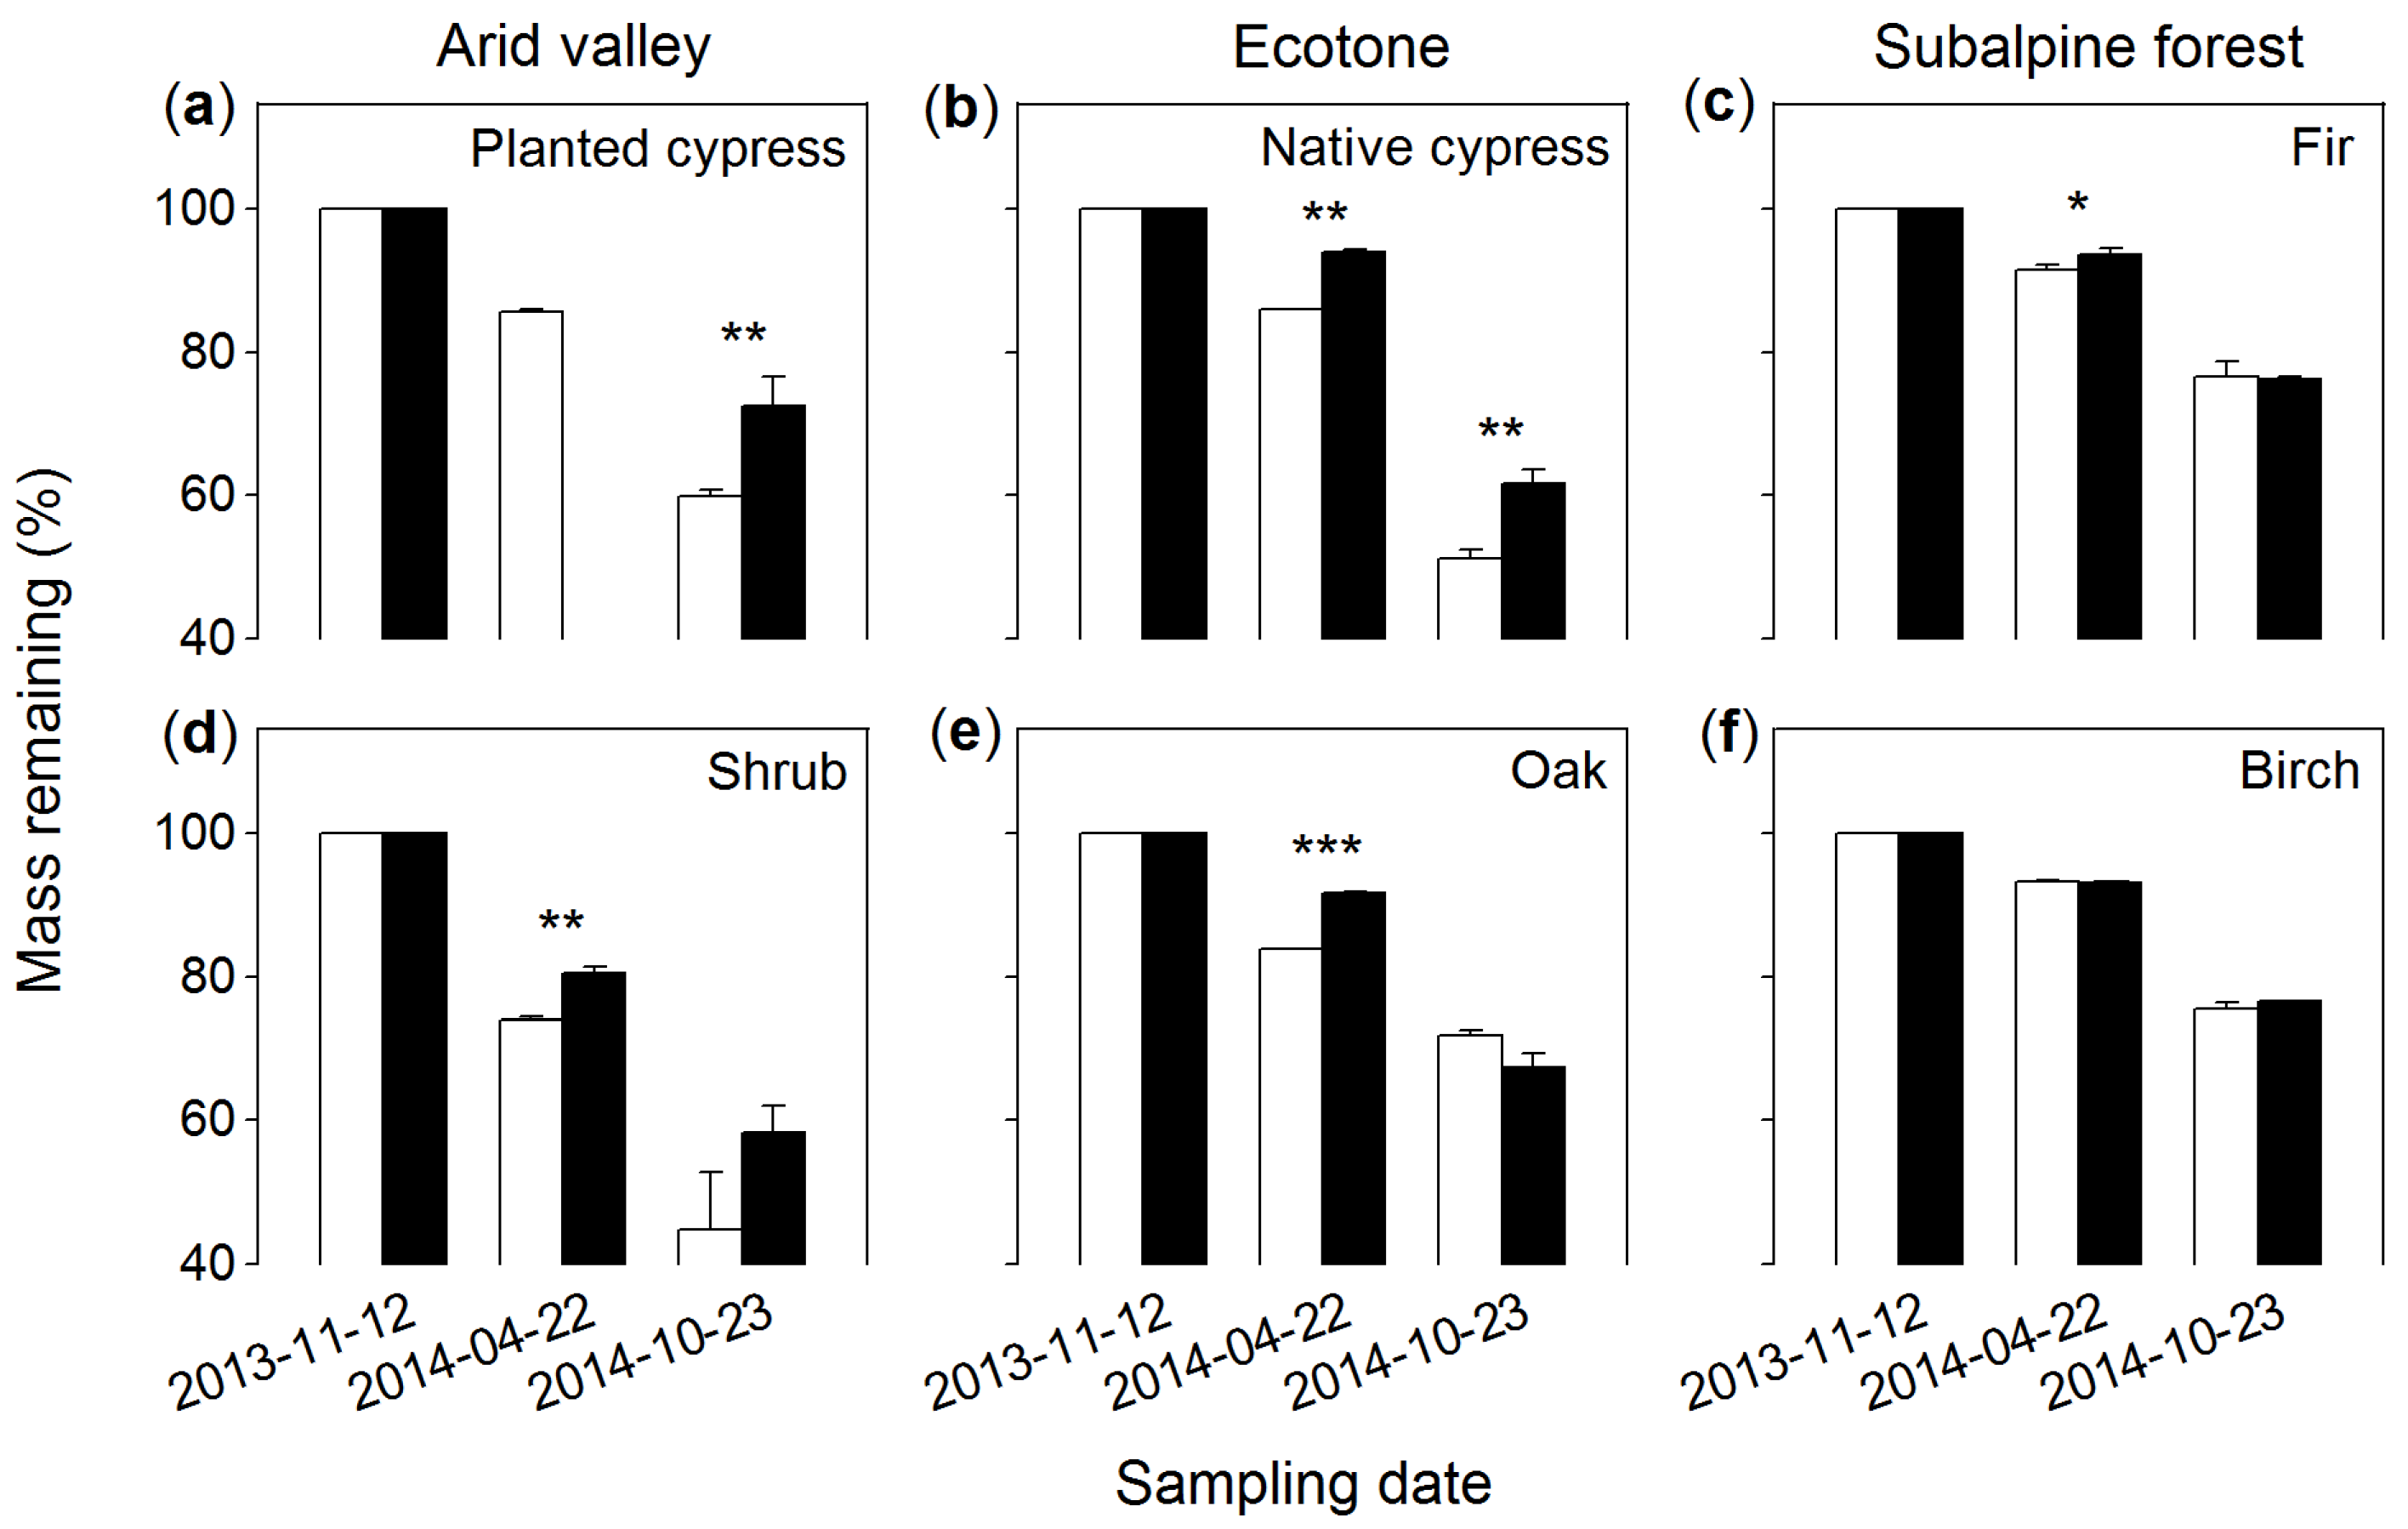
3.2. Mass Remaining
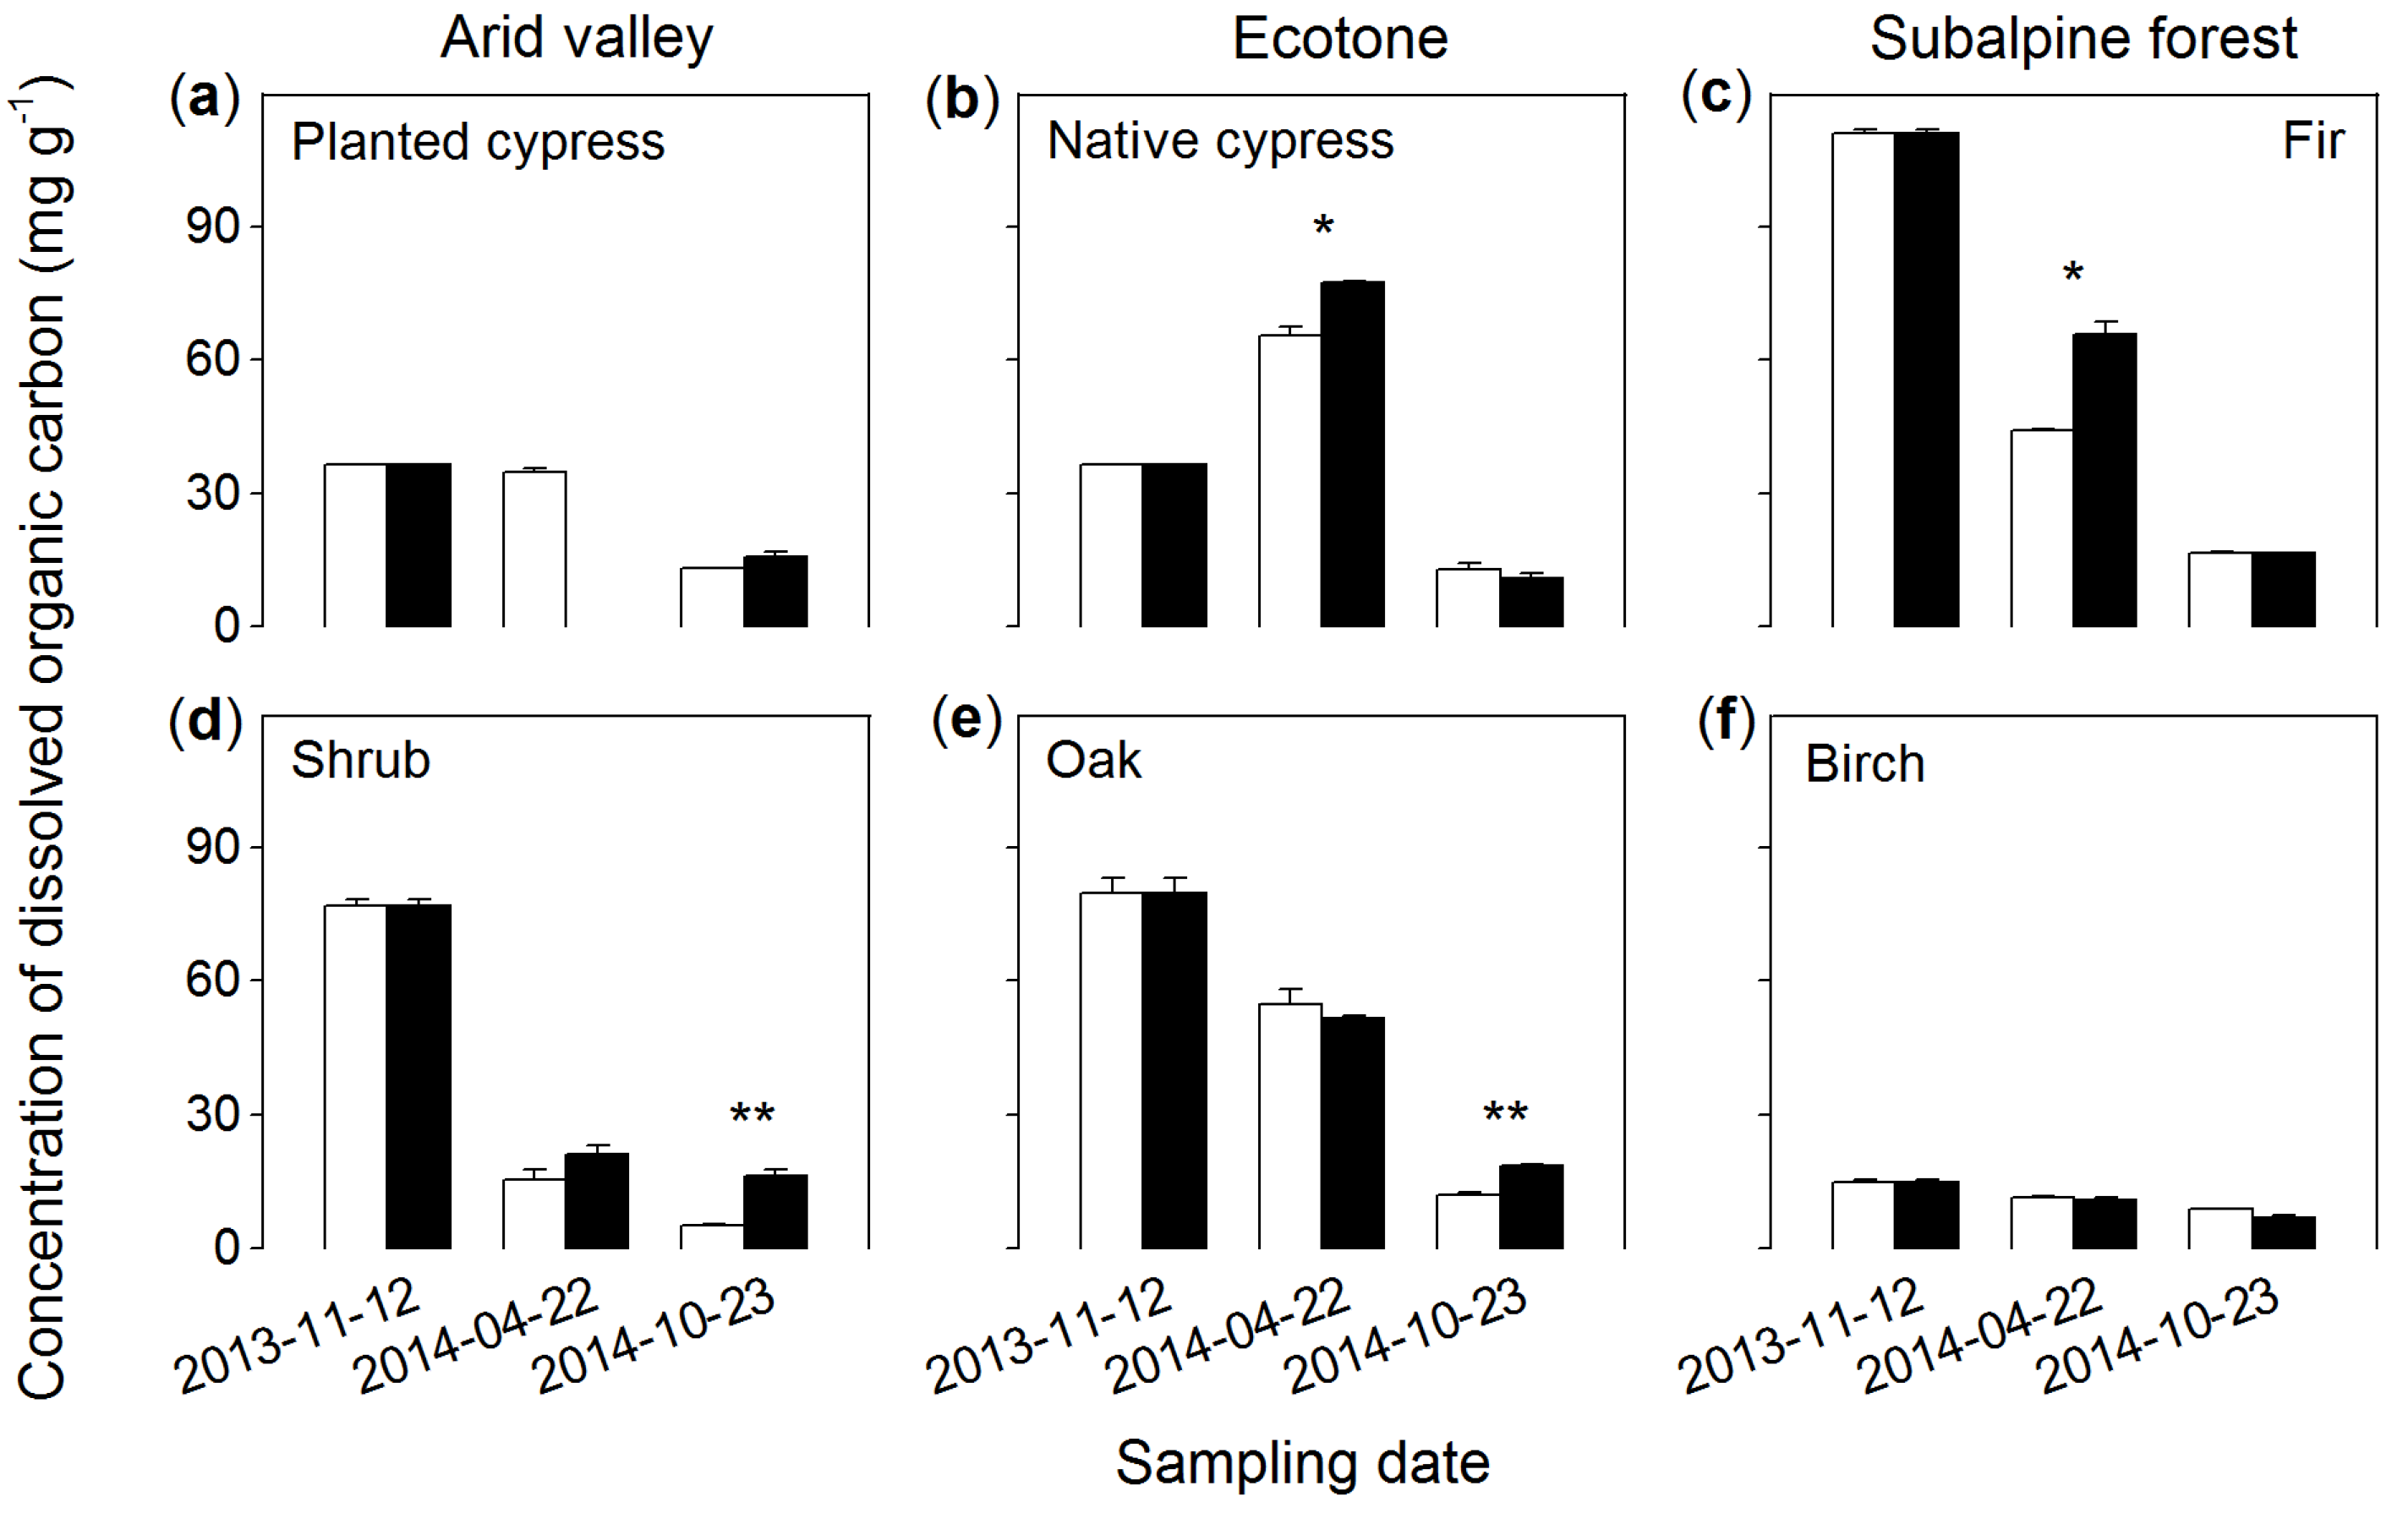
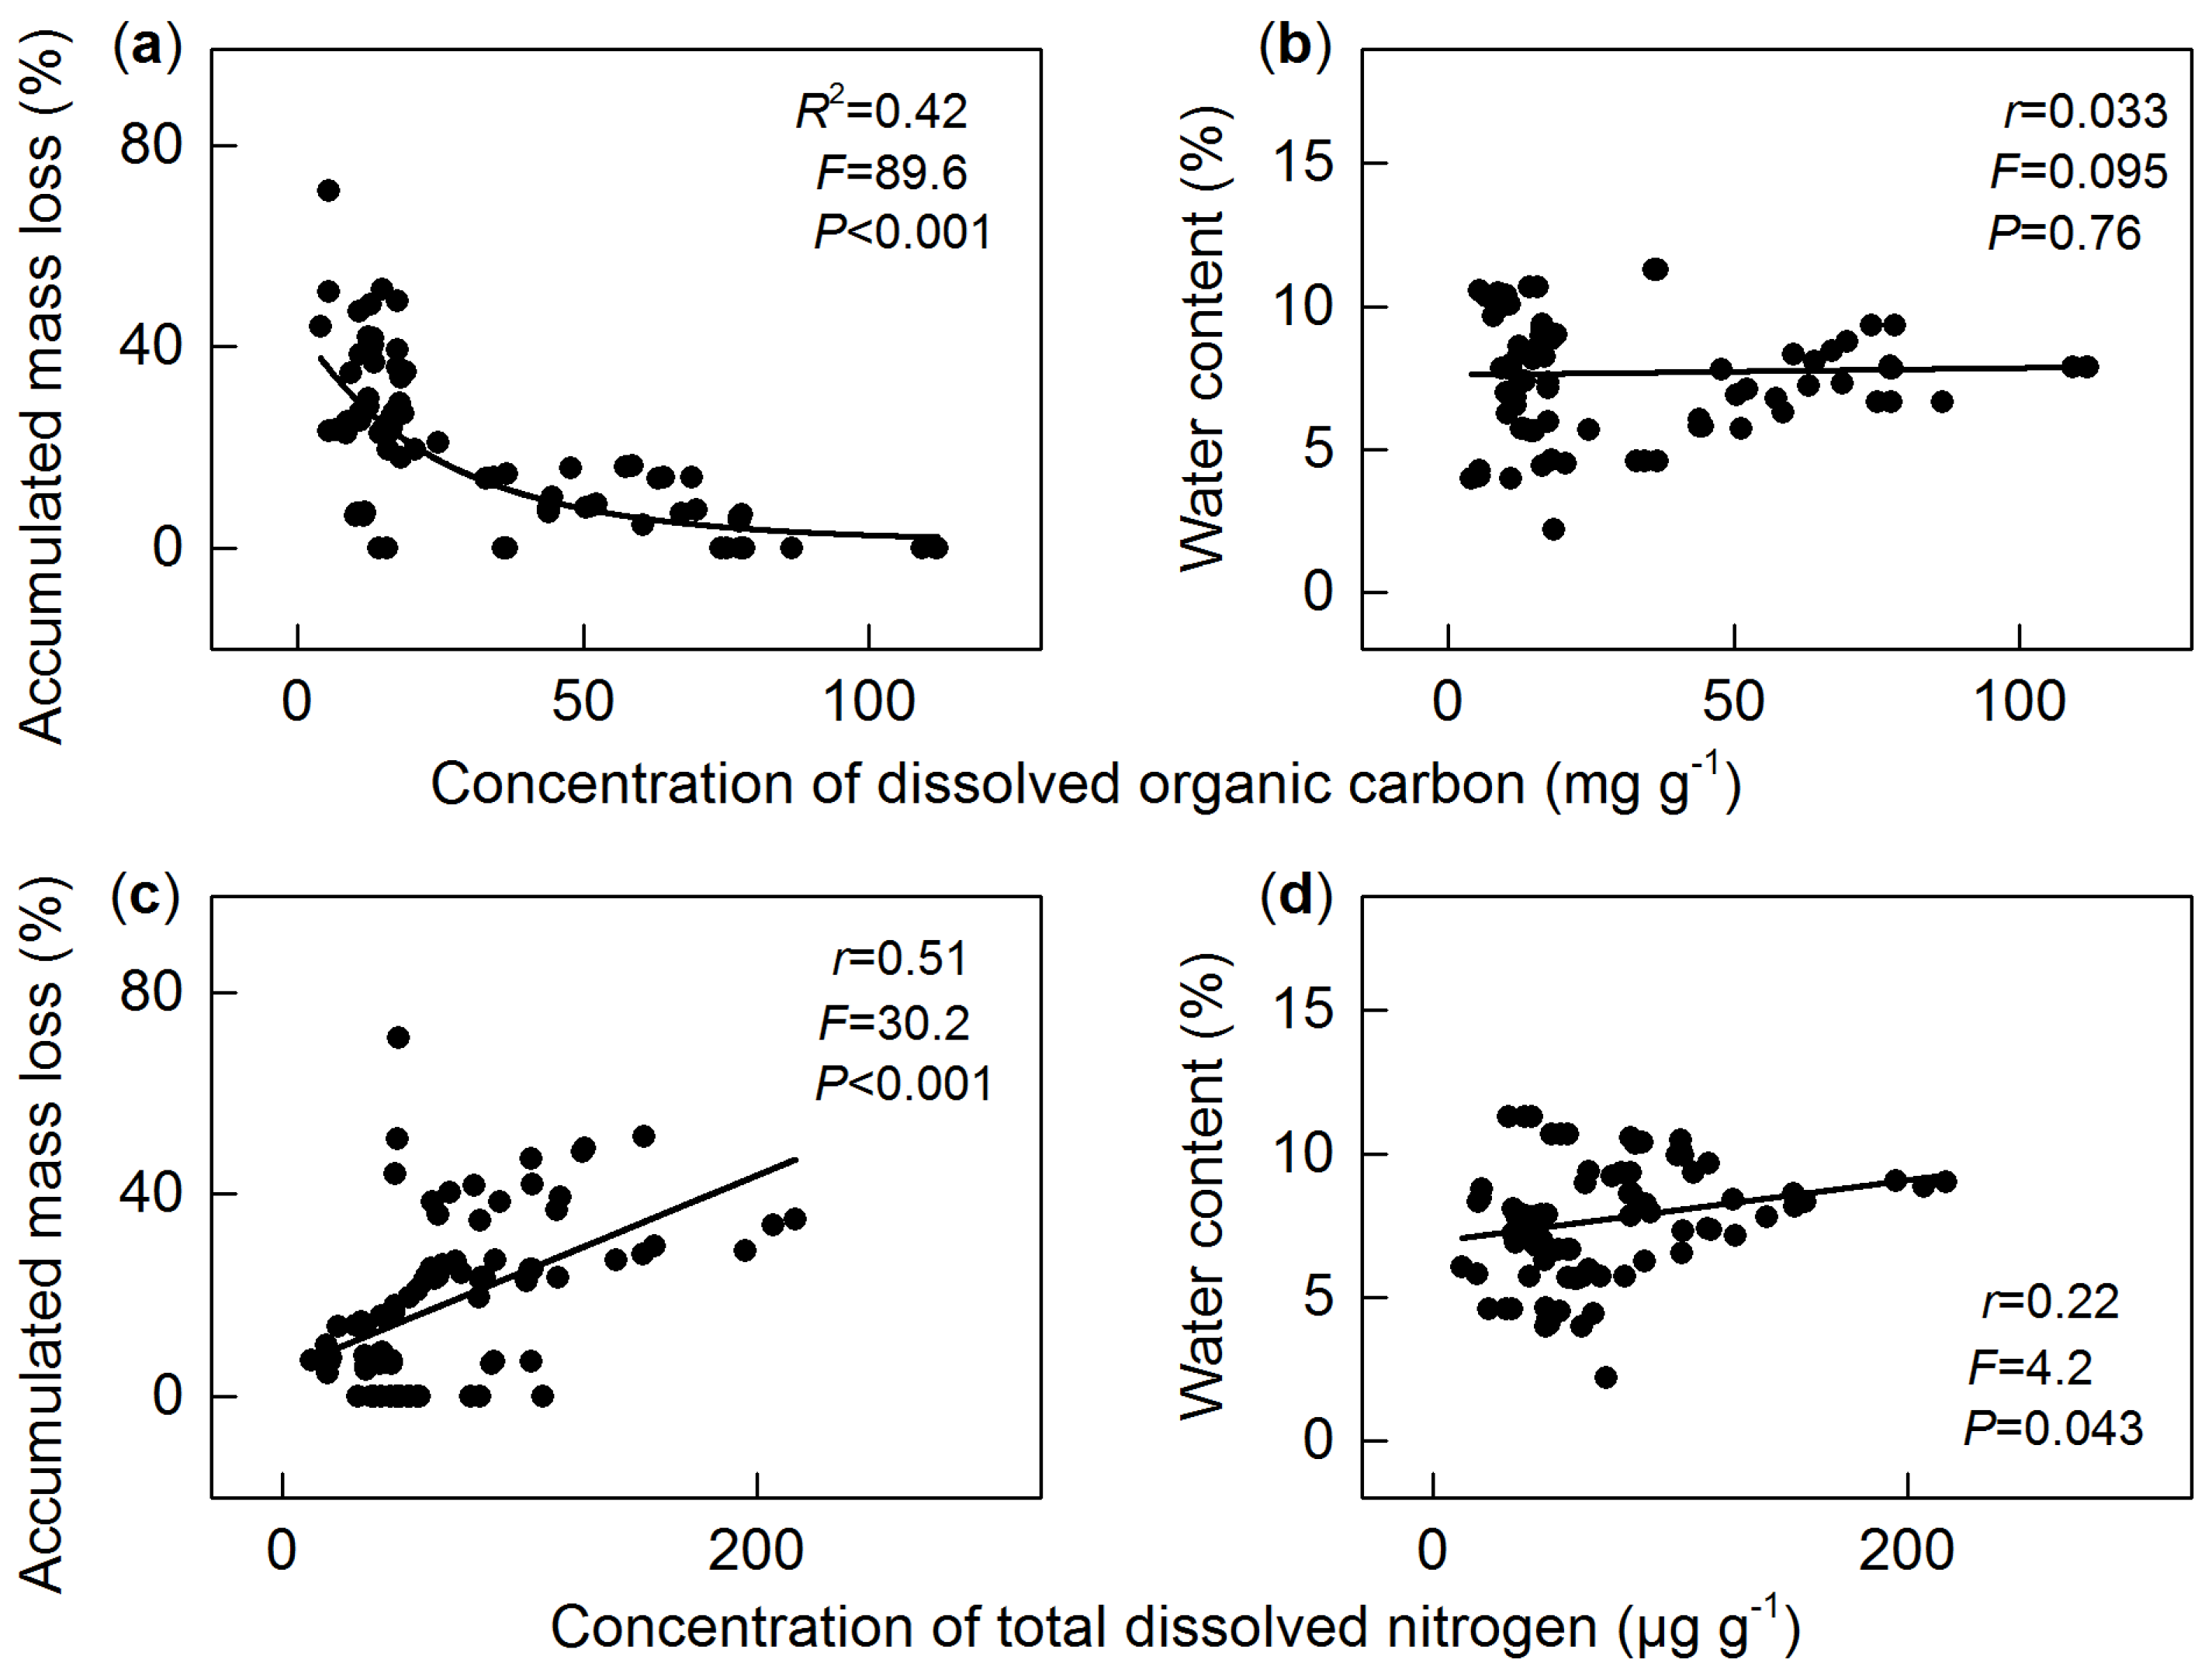
3.3. Dissolved Organic Carbon
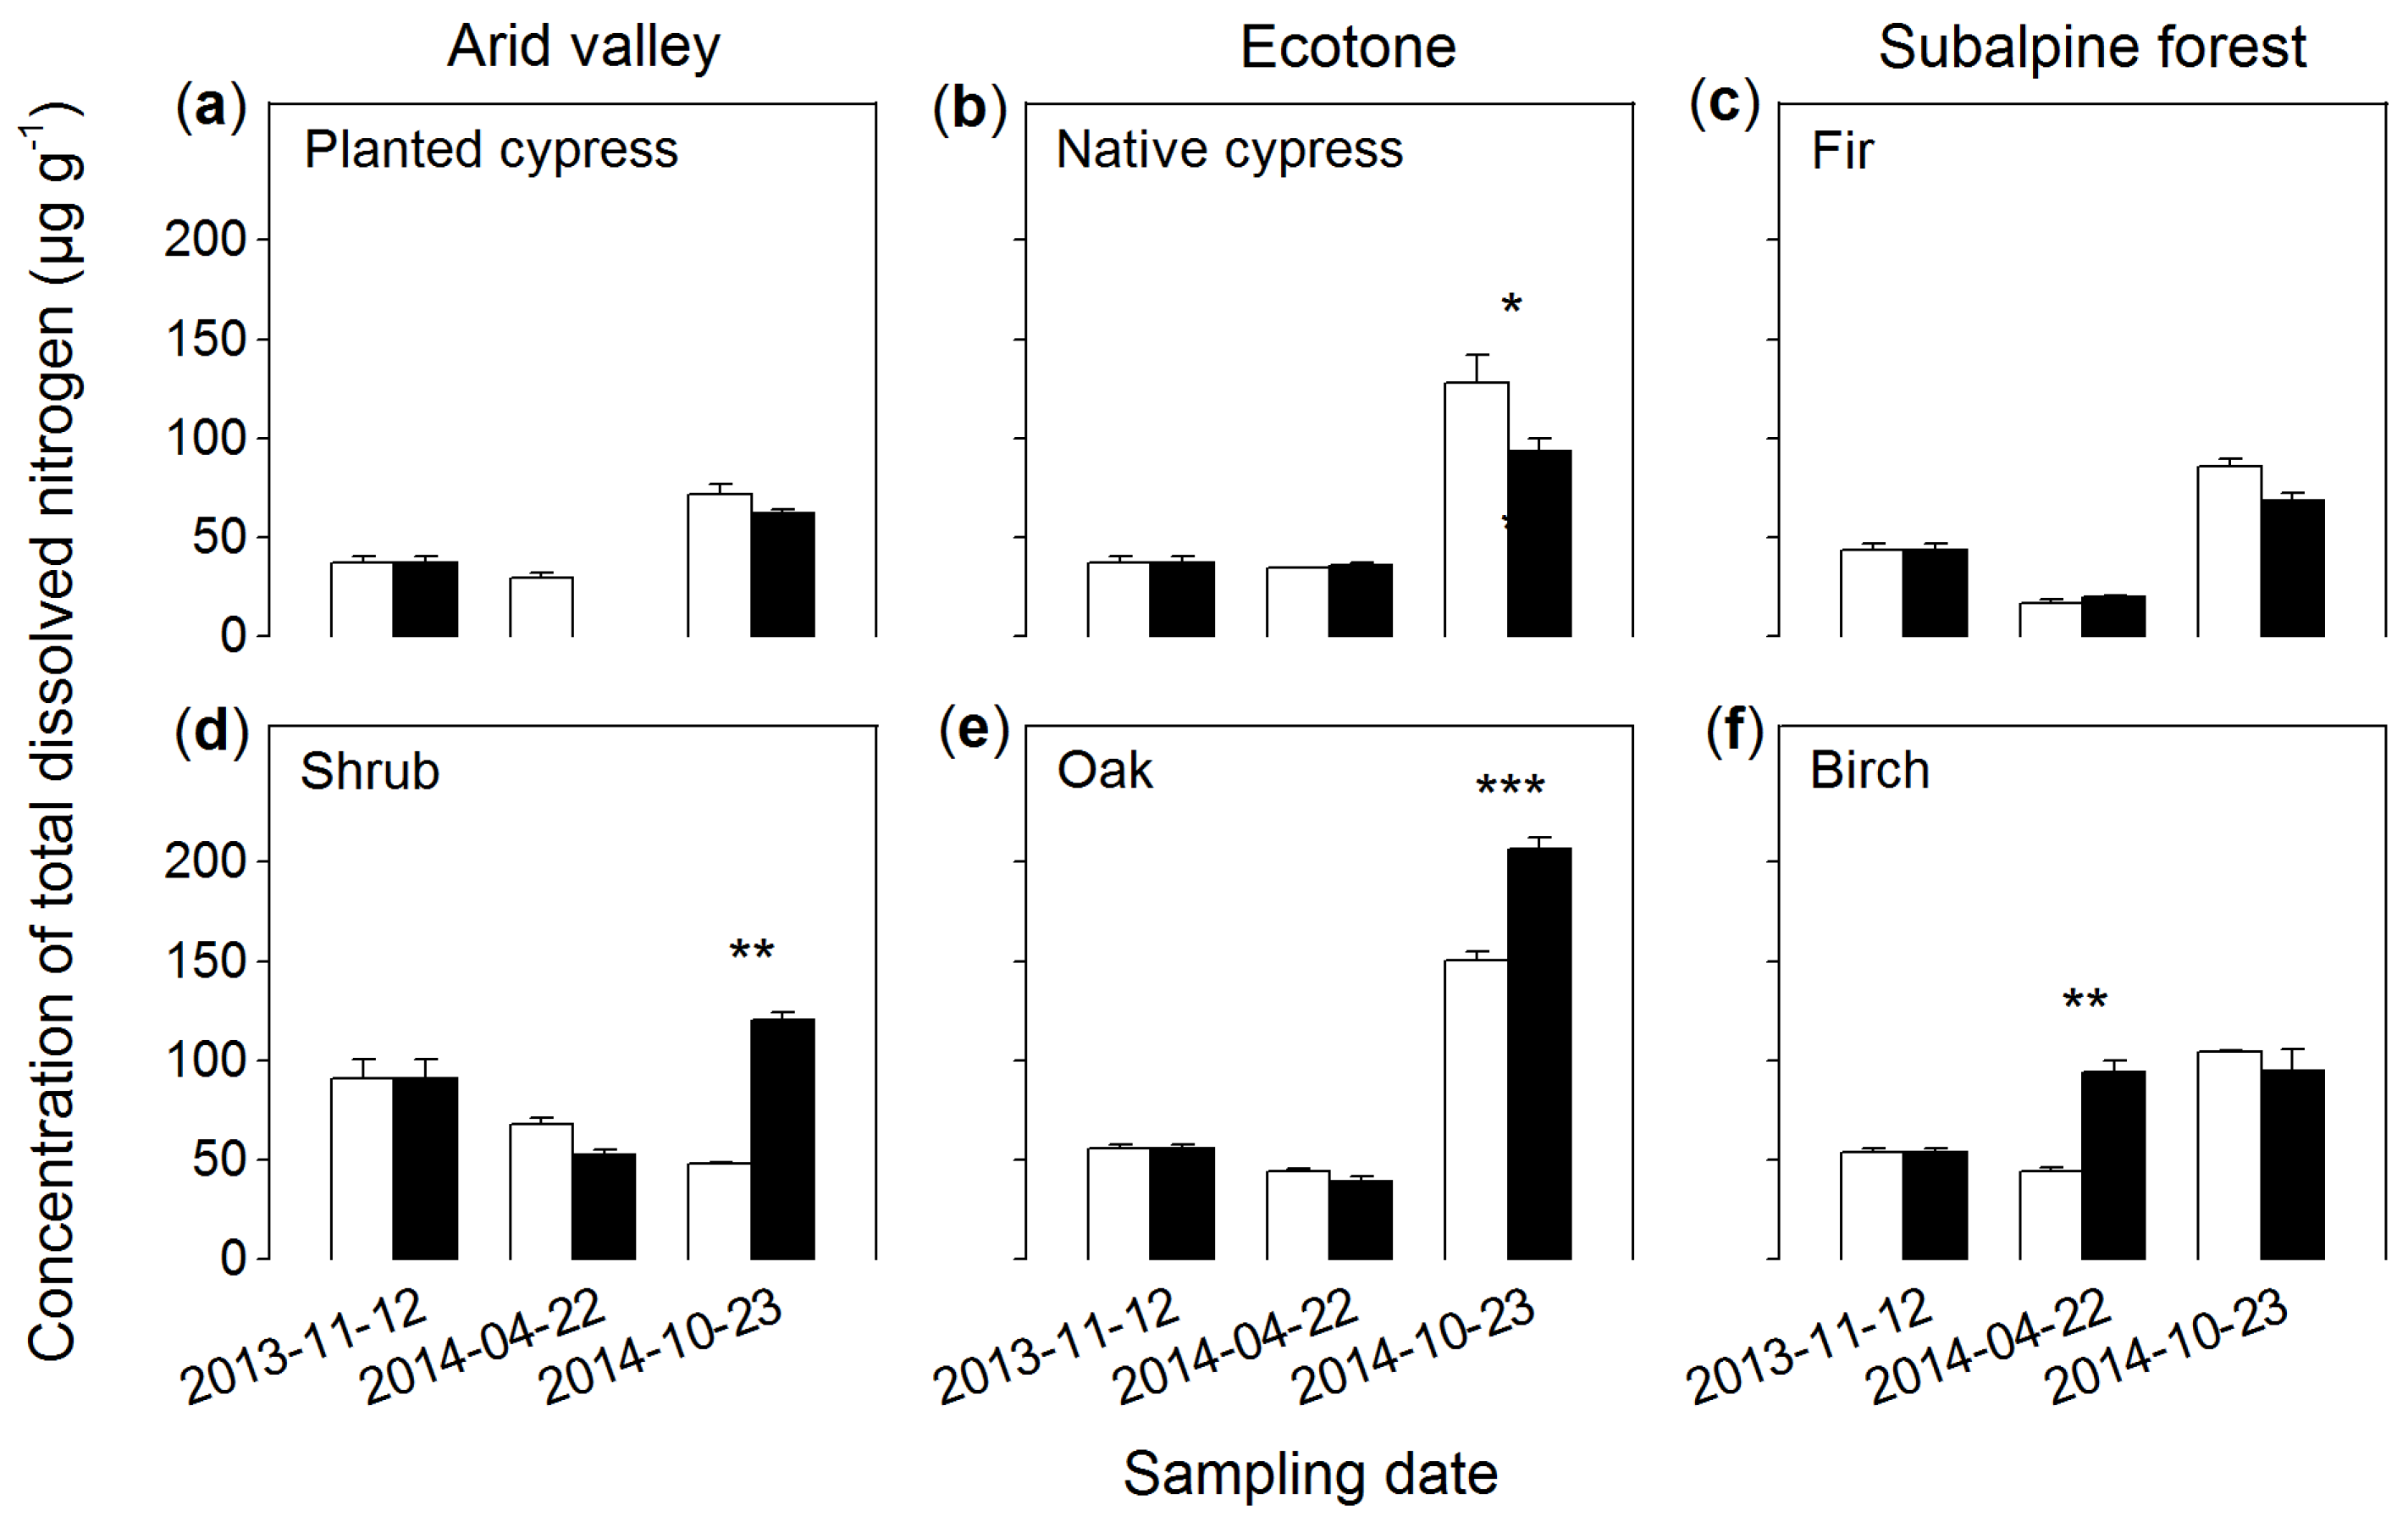
3.4. Total Dissolved Nitrogen
4. Discussion
5. Conclusions
Supplementary Materials
Acknowledgments
Author Contributions
Conflicts of Interest
References
- Berg, B. Decomposition patterns for foliar litter—A theory for influencing factors. Soil Biol. Biochem. 2014, 78, 222–232. [Google Scholar] [CrossRef]
- Berg, B.; McClaugherty, C. Plant Litter: Decomposition, Humus Formation, Carbon Sequestration, 3rd ed.; Springer: Berlin, Germany, 2014. [Google Scholar]
- Neff, J.C.; Asner, G.P. Dissolved organic carbon in terrestrial ecosystems: Synthesis and a model. Ecosystems 2001, 4, 29–48. [Google Scholar] [CrossRef]
- Cleveland, C.C.; Neff, J.C.; Townsend, A.R.; Hood, E. Composition, dynamics, and fate of leached dissolved organic matter in terrestrial ecosystems: Results from a decomposition experiment. Ecosystems 2004, 7, 275–285. [Google Scholar] [CrossRef]
- Fröberg, M.; Jardine, P.M.; Hanson, P.J.; Swanston, C.W.; Todd, D.E.; Traver, J.R.; Garten, C.T. Low dissolved organic carbon input from fresh litter to deep mineral soils. Soil Sci. Soc. Am. J. 2007, 71, 347–354. [Google Scholar] [CrossRef]
- Versini, A.; Mareschal, L.; Matsoumbou, T.; Zeller, B.; Ranger, J.; Laclau, J.-P. Effects of litter manipulation in a tropical Eucalyptus plantation on leaching of mineral nutrients, dissolved organic nitrogen and dissolved organic carbon. Geoderma 2014, 232–234, 426–436. [Google Scholar] [CrossRef]
- Caner, L.; Zeller, B.; Dambrine, E.; Ponge, J.-F.; Chauvat, M.; Llanque, C. Origin of the nitrogen assimilated by soil fauna living in decomposing beech litter. Soil Biol. Biochem. 2004, 36, 1861–1872. [Google Scholar] [CrossRef]
- Nebbioso, A.; Piccolo, A. Molecular characterization of dissolved organic matter (DOM): A critical review. Anal. Bioanal. Chem. 2013, 405, 109–124. [Google Scholar] [CrossRef] [PubMed]
- Huhta, V. The role of soil fauna in ecosystems: A historical review. Pedobiologia 2007, 50, 489–495. [Google Scholar] [CrossRef]
- Hättenschwiler, S.; Tiunov, A.V.; Scheu, S. Biodiversity and litter decomposition in terrestrial ecosystems. Annu. Rev. Ecol. Evol. Syst. 2005, 36, 191–218. [Google Scholar] [CrossRef]
- Bradford, M.A.; Tordoff, G.M.; Eggers, T.; Jones, T.H.; Newington, J.E. Microbiota, fauna, and mesh size interactions in litter decomposition. Oikos 2002, 99, 317–323. [Google Scholar] [CrossRef]
- García-Palacios, P.; Maestre, F.T.; Kattge, J.; Wall, D.H. Corrigendum to García-Palacios et al. Climate and litter quality differently modulate the effects of soil fauna on litter decomposition across biomes. Ecol. Lett. 2013, 16, 1418. [Google Scholar] [CrossRef]
- González, G.; Seastedt, T.R. Soil fauna and plant litter decomposition in tropical and subalpine forests. Ecology 2001, 82, 955–964. [Google Scholar] [CrossRef]
- Cotrufo, M.F.; Briones, M.J.I.; Ineson, P. Elevated CO2 affects field decomposition rate and palatability of tree leaf litter: Importance of changes in substrate quality. Soil Biol. Biochem. 1998, 30, 1565–1571. [Google Scholar] [CrossRef]
- Bernier, N.; Gillet, F. Structural relationships among vegetation, soil fauna and humus form in a subalpine forest ecosystem: A Hierarchical Multiple Factor Analysis (HMFA). Pedobiologia 2012, 55, 321–334. [Google Scholar] [CrossRef] [Green Version]
- Coûteaux, M.-M.; Bottner, P.; Berg, B. Litter decomposition, climate and litter quality. Trends Ecol. Evol. 1995, 10, 63–66. [Google Scholar] [CrossRef]
- Gessner, M.O.; Swan, C.M.; Dang, C.K.; McKie, B.G.; Bardgett, R.D.; Wall, D.H.; Hättenschwiler, S. Diversity meets decomposition. Trends Ecol. Evol. 2010, 25, 372–380. [Google Scholar] [CrossRef] [PubMed]
- Setälä, H.; Aarnio, T. Vertical stratification and trophic interactions among organisms of a soil decomposer food web—A field experiment using 15N as a tool. Eur. J. Soil Biol. 2002, 38, 29–34. [Google Scholar] [CrossRef]
- Brussaard, L.; Pulleman, M.M.; Ouédraogo, É.; Mando, A.; Six, J. Soil fauna and soil function in the fabric of the food web. Pedobiologia 2007, 50, 447–462. [Google Scholar] [CrossRef]
- Doblas-Miranda, E.; Sánchez-Piñero, F.; González-Megías, A. Soil macroinvertebrate fauna of a Mediterranean aeid system: Composition and temporal changes in the assemblage. Soil Biol. Biochem. 2007, 39, 1916–1925. [Google Scholar] [CrossRef]
- Tan, B.; Wu, F.; Yang, W.; Yu, S.; Liu, L.; Wang, A.; Yang, Y. Seasonal dynamics of soil fauna in the subalpine forests of west Sichuan at different altitudes. Acta Ecol. Sin. 2013, 33, 12–22. [Google Scholar] [CrossRef]
- Wang, B.; Wu, F.; Xiao, S.; Yang, W.; Justine, M.F.; He, J.; Tan, B. Effect of succession gaps on the understory water-holding capacity in an over-mature alpine forest at the upper reaches of the Yangtze River. Hydrol. Process. 2016, 30, 692–703. [Google Scholar] [CrossRef]
- Wang, B. Nitrogen Mineralization in an Ecotone and Its Adjacent Arid Valley and Subalpine Forest; Institute of Ecology and Forestry, Sichuan Agricultural University: Chengdu, China, 2016; Unpublished data. [Google Scholar]
- Milcu, A.; Manning, P. All size classes of soil fauna and litter quality control the acceleration of litter decay in its home environment. Oikos 2011, 120, 1366–1370. [Google Scholar] [CrossRef]
- Ayres, E.; Steltzer, H.; Berg, S.; Wall, D.H. Soil biota accelerate decomposition in high-elevation forests by specializing in the breakdown of litter produced by the plant species above them. J. Ecol. 2009, 97, 901–912. [Google Scholar] [CrossRef]
- IUSS Working Group WRB. World Reference Base for Soil Resources 2014; International Soil Classification System for Naming and Creating Legends for Soil Maps. World Soil Resources Reports 106; FAO: Rome, Italy, 2015. [Google Scholar]
- Zhu, J.; He, X.; Wu, F.; Yang, W.; Tan, B. Decomposition of Abies faxoniana litter varies with freeze-thaw stages and altitudes in subalpine/alpine forests of southwest China. Scand. J. For. Res. 2012, 27, 586–596. [Google Scholar] [CrossRef]
- Frouz, J.; Roubíčková, A.; Heděnec, P.; Tajovský, K. Do soil fauna really hasten litter decomposition? A meta-analysis of enclosure studies. Eur. J. Soil Sci. 2015, 68, 18–24. [Google Scholar] [CrossRef]
- Wu, F.; Yang, W.; Zhang, J.; Deng, R. Litter decomposition in two subalpine forests during the freeze-thaw season. Acta Oecol. 2010, 36, 135–140. [Google Scholar] [CrossRef]
- Ni, X.; Yang, W.; Li, H.; Xu, L.; He, J.; Tan, B.; Wu, F. The responses of early foliar litter humification to reduced snow cover during winter in an alpine forest. Can. J. Soil Sci. 2014, 94, 453–461. [Google Scholar] [CrossRef]
- Ni, X.; Yang, W.; Tan, B.; He, J.; Xu, L.; Li, H.; Wu, F. Accelerated foliar litter humification in forest gaps: Dual feedbacks of carbon sequestration during winter and the growing season in an alpine forest. Geoderma 2015, 241–242, 136–144. [Google Scholar] [CrossRef]
- Ni, X.; Yang, W.; Tan, B.; Li, H.; He, J.; Xu, L.; Wu, F. Forest gaps slow the sequestration of soil organic matter: A humification experiment with six foliar litters in an alpine forest. Sci. Rep. 2016, 6, 19744. [Google Scholar] [CrossRef] [PubMed]
- Li, H.; Wu, F.; Yang, W.; Xu, L.; Ni, X.; He, J.; Tan, B.; Wu, F. Effects of forest gaps on litter lignin and cellulose dynamics vary seasonally in an alpine forest. Forests 2016, 7, 27. [Google Scholar] [CrossRef]
- Yin, W.; Hu, S.; Shen, W. Handbook for Soil Fauna in China; Science Press: Beijing, China, 1998. [Google Scholar]
- Bryant, D.M.; Holland, E.A.; Seastedt, T.R.; Walker, M.D. Analysis of litter decomposition in an alpine tundra. Can. J. Bot. 1998, 76, 1295–1304. [Google Scholar]
- Lecerf, A.; Risnoveanu, G.; Popescu, C.; Gessner, M.O.; Chauvet, E. Decomposition of diverse litter mixtures in streams. Ecology 2007, 88, 219–227. [Google Scholar] [CrossRef]
- Liao, S.; Yang, W.; Tan, Y.; Peng, Y.; Li, J.; Tan, B.; Wu, F. Soil fauna affects dissolved carbon and nitrogen in foliar litter in alpine forest and alpine meadow. PLoS ONE 2015, 10, e0139099. [Google Scholar] [CrossRef] [PubMed]
- Wu, F.; Peng, C.; Zhu, J.; Zhang, J.; Tan, B.; Yang, W. Impacts of freezing and thawing dynamics on foliar litter carbon release in alpine/subalpine forests along an altitudinal gradient in the eastern Tibetan Plateau. Biogeosciences 2014, 11, 6471–6481. [Google Scholar]
- Konestabo, H.S.; Michelsen, A.; Holmstrup, M. Responses of springtail and mite populations to prolonged periods of soil freeze-thaw cycles in a sub-arctic ecosystem. Appl. Soil Ecol. 2007, 36, 136–146. [Google Scholar] [CrossRef]
- Prescott, C.E. Litter decomposition: What controls it and how can we alter it to sequester more carbon in forest soils? Biogeochemistry 2010, 101, 133–149. [Google Scholar] [CrossRef]
- Aerts, R. The freeze defrosting: Global warming and litter decomposition rates in cold biomes. J. Ecol. 2006, 94, 713–724. [Google Scholar] [CrossRef]
- Cornwell, W.K.; Cornelissen, J.H.C.; Amatangelo, K.; Dorrepaal, E.; Eviner, V.T.; Godoy, O.; Hobbie, S.E.; Hoorens, B.; Kurokawa, H.; Pérez-Harguindeguy, N.; et al. Plant species traits are the predominant control on litter decomposition rates within biomes worldwide. Ecol. Lett. 2008, 11, 1065–1071. [Google Scholar] [CrossRef] [PubMed]
- Zhang, D.; Hui, D.; Luo, Y.; Zhou, G. Rates of litter decomposition in terrestrial ecosystems: Global patterns and controlling factors. J. Plant Ecol. 2008, 1, 85–93. [Google Scholar] [CrossRef]
- Seniczak, S.; Seniczak, A. Oribatid mites (Acari, Oribatida) of pine and cypress litter in selected habitats of Sicily (Italy). Biol. Lett. 2013, 50, 97–104. [Google Scholar] [CrossRef]
- Pflug, A.; Wolters, V. Influence of drought and litter age on Collembola communities. Eur. J. Soil Biol. 2001, 37, 305–308. [Google Scholar] [CrossRef]
- Schmidt, A.; John, K.; Auge, H.; Brandl, R.; Horgan, F.G.; Settele, J.; Zaitsev, A.S.; Wolters, V.; Schädler, M. Compensatory mechanisms of litter decomposition under alternating moisture regimes in tropical rice fields. Appl. Soil Ecol. 2016, 107, 79–90. [Google Scholar] [CrossRef]
- Wickings, K.; Grandy, A.S. Management intensity interacts with litter chemistry and climate to drive temporal patterns in arthropod communities during decomposition. Pedobiologia 2013, 56, 105–112. [Google Scholar] [CrossRef]
- Fu, C. Litter Fall as Affected by Forest Gap in a Subalpine Forest; Institute of Ecology and Forestry, Sichuan Agricultural University: Chengdu, China, 2016; Unpublished data. [Google Scholar]
- Campbell, J.L.; Mitchell, M.J.; Groffman, P.M.; Christenson, L.M.; Hardy, J.P. Winter in northeastern North America: A critical period for ecological processes. Front. Ecol. Environ. 2005, 3, 314–322. [Google Scholar] [CrossRef]
- Tan, B.; Wu, F.; Yang, W.; Xu, Z.; Zhang, L.; Liu, Y. Soil fauna significantly contributes to litter decomposition at low temperatures in the alpine/subalpine forests. Pol. J. Ecol. 2015, 63, 377–386. [Google Scholar] [CrossRef]
- Groffman, P.M.; Driscoll, C.T.; Fahey, T.J.; Hardy, J.P.; Fitzhugh, R.D.; Tierney, G.L. Colder soils in a warmer world: A snow manipulation study in a northern hardwood forest ecosystem. Biogeochemistry 2001, 56, 135–150. [Google Scholar] [CrossRef]
- Bokhorst, S.; Metcalfe, D.B.; Wardle, D.A. Reduction in snow depth negatively affects decomposers but impact on decomposition rates is substrate dependent. Soil Biol. Biochem. 2013, 62, 157–164. [Google Scholar] [CrossRef]
- Coleman, D.C.; Crossley, D.A.; Hendrix, P.F. Fundamentals of Soil Ecology, 2nd ed.; Elsevier Academic Press: Burlington, VT, USA, 2004. [Google Scholar]
- Wickings, K.; Grandy, A.S. The oribatid mite Scheloribates moestus (Acari: Oribatida) alters litter chemistry and nutrient cycling during decomposition. Soil Biol. Biochem. 2011, 43, 351–358. [Google Scholar] [CrossRef]
- Heděnec, P.; Radochová, P.; Nováková, A.; Kaneda, S.; Frouz, J. Grazing preference and utilization of soil fungi by Folsomia candida (Isotomidae: Collembola). Eur. J. Soil Biol. 2013, 55, 66–70. [Google Scholar] [CrossRef]
- Kaneda, S.; Kaneko, N. Influence of soil quality on the growth of Folsomia candida (Willem) (Collembola). Pedobiologia 2002, 46, 428–439. [Google Scholar] [CrossRef]


| Site | Aspect | Slope (°) | Soil Bulk Density | pH | C (mg g−1) | N (mg g−1) | P (mg g−1) | Duration of Soil Freeze-Thaw |
|---|---|---|---|---|---|---|---|---|
| Arid valley | NW 327° | 36 | 1.76 | 7.50 | 25.20 | 0.84 | 0.65 | 10 December to 10 February |
| Ecotone | NE 53° | 23 | 1.49 | 5.70 | 47.20 | 2.91 | 0.38 | 21 November to 13 March |
| Subalpine forest | SE 128° | 3 | 0.62 | 5.90 | 161.4 | 8.10 | 0.90 | 25 October to 24 April |
| Period | Arid Valley | Ecotone | Subalpine Forest | |||
|---|---|---|---|---|---|---|
| Planted Cypress | Shrub | Native Cypress | Oak | Fir | Birch | |
| Winter | N/A | 0 ± 0 bB | 12.0 ± 2.5 bAB | 3.0 ± 1.7 aB | 4.7 ± 2.2 bB | 19.3 ± 3.8 bA |
| Growing season | 26.7 ± 12.7 AB | 10.7 ± 4.7 aB | 72.7 ± 5.8 aAB | 52.0 ± 26.9 aAB | 83.0 ± 16.5 aAB | 114.7 ± 32.4 aA |
| Period | Concentration of Dissolved Organic Carbon | Concentration of Total Dissolved Nitrogen | ||||||||||||||||
|---|---|---|---|---|---|---|---|---|---|---|---|---|---|---|---|---|---|---|
| Litter Species | Soil Fauna | Litter Species × Soil Fauna | Litter Species | Soil Fauna | Litter Species × Soil Fauna | |||||||||||||
| df | f value | p value | df | f value | p value | df | f value | p value | df | f value | p value | df | f value | p value | df | f value | p value | |
| Winter | 5 | 456.6 | <0.001 | 1 | 0.04 | 0.84 | 5 | 66.7 | <0.001 | 5 | 166.8 | <0.001 | 1 | 0.5 | 0.49 | 5 | 62.4 | <0.001 |
| Growing season | 5 | 40.7 | <0.001 | 1 | 42.9 | <0.001 | 5 | 26.6 | <0.001 | 5 | 83.2 | <0.001 | 1 | 7.2 | 0.013 | 5 | 24.3 | <0.001 |
| With/Without Soil Fauna | Arid Valley | Ecotone | Subalpine Forest | |||
|---|---|---|---|---|---|---|
| Planted Cypress | Shrub | Native Cypress | Oak | Fir | Birch | |
| Mass remaining (%) | ||||||
| Soil fauna | −40 (1.0) aAB | −55 (8.1) aA | −49 (1.3) bA | −28 (0.8) aB | −23 (2.1) aB | −24 (0.8) aB |
| No soil fauna | −28 (4.2) aB | −42 (3.7) aA | −38 (2.0) aAB | −33 (1.9) aAB | −24 (0.4) aB | −23 (0.06) aB |
| DOC concentration (mg g−1) | ||||||
| Soil fauna | −64 (0.1) aC | −93 (0.5) bA | −64 (3.1) aC | −85 (0.5) bB | −85 (0.2) aB | −40 (1.4) aD |
| No soil fauna | −57 (2.5) aC | −79 (1.4) aAB | −70 (2.4) bB | −77 (0.6) aAB | −85 (0.09) aA | −54 (3.3) aC |
| TDN concentration (μg g−1) | ||||||
| Soil fauna | +92 (4.1) aC | −46 (4.7) bD | +241 (13) aA | +169 (2.0) bB | +98 (11.7) aC | +95 (5.7) aC |
| No soil fauna | +67 (9.9) aC | +34 (9.0) aC | +151 (6.5) bB | +269 (3.1) aA | +58 (7.6) bC | +77 (14) aC |
© 2016 by the authors; licensee MDPI, Basel, Switzerland. This article is an open access article distributed under the terms and conditions of the Creative Commons Attribution (CC-BY) license (http://creativecommons.org/licenses/by/4.0/).
Share and Cite
Liao, S.; Ni, X.; Yang, W.; Li, H.; Wang, B.; Fu, C.; Xu, Z.; Tan, B.; Wu, F. Water, Rather than Temperature, Dominantly Impacts How Soil Fauna Affect Dissolved Carbon and Nitrogen Release from Fresh Litter during Early Litter Decomposition. Forests 2016, 7, 249. https://doi.org/10.3390/f7100249
Liao S, Ni X, Yang W, Li H, Wang B, Fu C, Xu Z, Tan B, Wu F. Water, Rather than Temperature, Dominantly Impacts How Soil Fauna Affect Dissolved Carbon and Nitrogen Release from Fresh Litter during Early Litter Decomposition. Forests. 2016; 7(10):249. https://doi.org/10.3390/f7100249
Chicago/Turabian StyleLiao, Shu, Xiangyin Ni, Wanqin Yang, Han Li, Bin Wang, Changkun Fu, Zhenfeng Xu, Bo Tan, and Fuzhong Wu. 2016. "Water, Rather than Temperature, Dominantly Impacts How Soil Fauna Affect Dissolved Carbon and Nitrogen Release from Fresh Litter during Early Litter Decomposition" Forests 7, no. 10: 249. https://doi.org/10.3390/f7100249