Article

Sapflow-Based Stand Transpiration in a Semiarid Natural Oak Forest on China’s Loess Plateau

1
State Key Laboratory of Soil Erosion and Dryland Farming on Loess Plateau, Northwest A&F University, Yangling 712100, Shaanxi, China
2
Institute of Soil and Water Conservation, Chinese Academy of Sciences and Ministry of Water Resources, Yangling 712100, Shaanxi, China
3
Upper and Middle Yellow River Bureau, Yellow River Conservancy Commission of the Ministry of Water Resources, Xi’an 710021, Shaanxi, China
4
School of Geographical Sciences, Southwest University, Chongqing 400715, China
5
Kasuya Research Forest, Kyushu University, Fukuoka 811-2415, Japan
6
Arid Land Research Center, Tottori University, Tottori 680-0001, Japan
*
Author to whom correspondence should be addressed.
Forests 2016, 7(10), 227; https://doi.org/10.3390/f7100227
Submission received: 5 August 2016 / Revised: 27 September 2016 / Accepted: 30 September 2016 / Published: 9 October 2016

Abstract

:
The semi-arid region of China’s Loess Plateau is characterized by fragile ecosystems and a shortage of water resources. The major natural forest type in this region is the secondary forest with the flora dominated by the Liaodong oak (Quercus liaotungensis Koidz.). To understand its transpiration water use in relation to environmental factors, we applied Granier-type thermal dissipation probes to monitor stem sap flows of 21 sample trees, representing different classes of diameter at breast height in a permanent plot. The stem- and stand-scale transpiration values during the 2008–2010 growing seasons were estimated using measurements of sap flux densities and corresponding sapwood areas. The dominant factors affecting stand-scale transpiration varied with time scales. Daily stand transpiration correlated with daily solar radiation and daytime average vapor pressure deficit. Seasonal and interannual changes in stand transpiration were closely related to leaf area index (LAI) values. No obvious relationship was observed between monthly stand transpiration and soil moisture or precipitation during the period, probably as a result of both the hysteretic effect of precipitation on transpiration, and changes in LAI throughout the growing season. Stand transpiration during the three growing seasons ranged from 75 to 106 mm, representing low to normal values for the semi-arid forest. The proportion of transpiration by oak trees in the stand was stable ranging from 60% to 66% and corresponded to their basal area proportion of approximately 59%. The results suggest that the natural forest consisting mainly of oak trees is in a formal stage of forest development that maintains a normal magnitude of annual water consumption.

1. Introduction

Water circulation is one of the vital processes in terrestrial ecosystems and is crucial for both environmental and economic development in arid and semi-arid regions. The ecological distribution of various vegetation types is closely related to water availability [1,2]. Proper forest management relies on maintaining sustainable water balances [3]. It is generally considered that the minimal precipitation level that differentiates warm temperate forests from grasslands (i.e., balancing the evapotranspiration demand) is approximately 500 mm [4]. However, in mountainous topography, water cycling in a forest is particularly complex owing to the drastic temporal and spatial changes of the inflow and outflow components [5]. Quantification of water use by trees and stands is a primary approach to elucidate the ecological and hydrological processes in a forest ecosystem [6,7].
China’s Loess Plateau region suffers from shortages of water resources, vegetation degradation in fragile ecosystems, and severe soil erosion during the rainy season [8,9,10]. The central part of the plateau has sub-humid and semi-arid climates and consists of forest-grassland transitional ecosystems with drought-resistant species of trees and shrubs [11,12,13,14]. In the past decades, protection of natural forests and reforestation with fast-growing trees have been applied for ecological restoration. There have been reports that the planted forests in this semi-arid region frequently result in an extremely dry horizon owing to the negative soil-water recharge over the years (e.g., [15]). In contrast, on a regional scale, Zhang et al. [10] found that the streamflows were reduced after the use of restoration practices in this region. On a catchment scale, Jian et al. [16] measured the water balance and found that precipitation could not meet evapotranspiration in slopes with planted forest and shrubs in the semi-arid loess area. The Liaodong oak (Quercus liaotungensis Koidz.) dominated forests have advantages over the common plantations, such as their ecological adaptations, provision of multiple services, and sustainability [17,18,19]. These secondary forests constitute the major types of natural forest ecosystems and were widely distributed in the past [14,19]. It is also suggested that compared with the planted forests in this region, the oak ecosystems created beneficial inner stand environments, significantly decreased surface runoff, and markedly reduced soil erosion [20]. However, knowledge about the hydrological process, especially the quantitative estimation of water use components in this ecosystem, remains inadequate.
Several methods have been employed to investigate forest evapotranspiration, including measurement of the soil water balance, calculation of micrometeorological parameters, and up-scaling of leaf or stem measurements. Measurement of tree transpiration is essential for the investigation of forest evapotranspiration, and dominant trees especially contribute to the dynamics of stand transpiration [21,22]. The Granier-type thermal dissipation probe (TDP) method has been increasingly used to measure the whole-tree water use because of the resulting simple sap flow calculations, high accuracy and temporal resolution, and little influence from heterogeneous topography on the values [23,24,25]. There are a few studies on the variation in sap flow along the radial profiles of sapwood [26,27], sap flow characteristics, and climatic responses in oak trees [28] based on TDP and similar methods. For example, Tateishi et al. [29] reported the effect of spatial variations in sap flow on stem-scale water-use calculations in Q. glauca trees; in their study, stand-scale transpiration and its seasonal changes were investigated in plantations of black locust near the present research area [18,30]. However, few studies have been conducted on sap flow measurements across seasons either in individual trees or at the stand level of this semi-arid natural oak forest.
In the present study, we monitored stem sap flow, estimated stand transpiration, and evaluated the intra- and inter-annual variations in stand transpiration for three years (2008–2010) in a secondary natural oak forest in the semi-arid area of China’s Loess Plateau. Our objectives were to (1) quantify the seasonal and annual patterns of transpiration of the oak forest at the tree- and stand-scale; (2) examine the influence of the stand and environmental factors on stand transpiration. This study enriches the database necessary for assessing the forest stand water balance and provides valuable information for forest management in this region.

2. Materials and Methods

2.1. Study Site

The study was conducted from 2008 to 2010 at the Mt. Gonglushan site (36°25.4′ N, 109°31.53′ E; 1353 m above sea level) near Yan’an city of Shaanxi Province, China. The area is at the margin of the natural forest distribution—bordered by the steppe zone to the north—and has a temperate semi-arid climate [9,12]. The mean annual precipitation and air temperature during 1971–2010 (obtained from the local meteorological station) were 504.7 mm and 10.1 °C, respectively [31]. Approximately 71% of the total annual rainfall is distributed between June and September, with a relatively dry period between April and June. A detailed description of the study site has been presented by Tateno et al. [19].
A permanent oak-dominated natural forest research plot (20 m × 20 m) has been in place since 2007. The stand sits on a northeast-facing slope with a declination of 22° and the upper story oak trees (Q. liaotungensis) are approximately 60 years old. Besides Q. liaotungensis, other species include Armeniaca sibirica L., Acer stenolobum Rehd., Platycladus orientalis (L.) Franco (an evergreen conifer), Ulmus macrocarpa Hance, Euonymus bungeanus Maxim., and several other species of small trees and shrubs. Average tree diameter at breast height (DBH, 1.3 m above the ground) and the tree basal area values for different years are shown in Table 1. The leaf area index (LAI) in the plot was measured once a month during the growing seasons (April to October) using a plant canopy analyzer (LAI-2000, Li-Cor, Lincoln, NE, USA). The basal area of oak and apricot trees covered approximately 86% of the total stand basal area at the site. Tree density was 1350 trees∙ha−1 and mean canopy height was 6.4 m. In order to cover the range of diameters found in the stand, we selected 11 oak trees, 6 apricot trees, and one each of the 4 other species for the installation of TDPs.

2.2. Meteorological Variables and Soil Water Content

Meteorological variables, including solar radiation (Rs, W∙m−2), air temperature (T, °C), relative humidity (RH, %), and precipitation (P, mm), were measured in an open area near the forest. Solar radiation was measured using a pyranometer (LI-200, Li-Cor, Lincoln, NE, USA). Air temperature and relative humidity were measured using a thermohygrograph (HMP50, Vaisala, Finland). Precipitation was measured using a tipping bucket rain gauge (Davis Rain collector II model 7852, Davis Instruments, Hayward, CA, USA). The pyranometer and thermohygrograph were mounted at a height of 2 m above the ground. The rain gauge was placed horizontally at a height of approximately 0.5 m. These measurements were sampled every 30 s and were recorded as 30-min averages in a data logger (CR10X, Campbell Scientific, Logan, UT, USA). Half-hourly vapor pressure deficit (VPD, kPa) was calculated from the temperature and relative humidity according to Campbell and Norman [32]. The mean daily daytime vapor pressure deficit (VPDm, kPa) was calculated as the average of VPD over the hours of 6:00–20:00 for each day.
Volumetric soil water content (θ, %) was measured using a time-domain reflectometry (TDR) moisture measurement system (TRIME, IMKO Micromodultechnik, Ettlingen, Germany) at three representative points within the plot. The measured data were calibrated using an equation established at the study site, based on gravimetric water levels from drilled soil cores and soil bulk density along the soil profiles.

2.3. Sap flow Measurements and Sapwood Area Estimates

Granier-type sensors [33] were used to measure xylem sap flow of 21 trees representing different DBH classes in the plot. DBH of these trees ranged from 5.83 to 24.99 cm in 2008, and the number of selected trees in each DBH class corresponded to the frequency distribution of DBH in the plot. Each sensor consisted of two cylindrical probes (10 mm long, 2 mm in diameter)—a continuously heated upper probe and an unheated lower probe. The upper heated probe included a heater that was continuously supplied with a constant power of 0.15 W while the lower unheated probe served as a temperature reference [34]. The probes contained copper-constantan thermocouples at the center to monitor the temperature, and were installed vertically 10–15 cm apart on the north side of a stem at approximately 1.3 m in height. The temperature difference between the two probes was measured every 30 s and was recorded as 30-min averages by a data logger (CR1000, Campbell, Logan, UT, USA) with a multiplexer (AM16/32, Campbell, Logan, UT, USA). Other technical details can be found in previously published materials [17,27]. Sap flux density (Fd) through the sapwood where the heated probe was located was calculated on the basis of the temperature difference between the two probes using the Granier empirical equation [33].
Considering the influence of radial and circumferential variations of Fd on the whole tree transpiration estimates, we installed multiple sensors on some individuals with relatively large diameters [27,35]. We placed two sensors on these large individuals, one each on the north and south sides of the tree. Fd values from both sensors were averaged, and any calculations of whole-tree transpiration for oak trees with sapwood wider than the probe length were corrected using the previous radial variation results.
Sapwood areas and thicknesses of the trees were calculated by core sample analysis. The sapwood of all these species was easy to distinguish from the heartwood based on color. For the oak and apricot trees, relationships between the sapwood area (AS) and DBH were established using power curve equations for the estimation of all the trees each year [36].

2.4. Calculation of Stand Transpiration

Stand transpiration was up-scaled from the stem-scale estimates, which were grouped according to species using the following equations [37,38,39]:
E T = i = 1 n E i
where ET and Ei are transpirations of the total stand and species i, respectively (n is the species number). Ei values were computed from the mean sap flux density values (Jsi) and the corresponding sapwood area relative to the ground as:
E i = J S i A S i A G
where ASi and AG are the total sapwood areas of the species and ground-projected area of the plot, respectively. For species with more than one DBH class (oak and apricot), Jsi was calculated as a weighted average according to the contribution of DBH classes:
J S i = j = 1 k F d i j A S j A S i
where Fdij is the mean sap flux density in DBH class j of the species (k is the number of classes), and ASj and ASi are the sapwood areas in the DBH class and the total sapwood area of the species, respectively. The units for ET, Ei, Jsi, and Fdij in the above equations are basically identical and are mm∙day−1 or mL∙m−2∙s−1 depending on the time scale.
For a specific DBH class, Fdij was also computed as a weighted average of the measured Fd corresponding to the sample trees’ sapwood areas. For oak trees, those with DBH > 8 cm were estimated and defined as having a sapwood thickness of >15 mm. Therefore, Fdij for these DBH classes was corrected to minimize the error from the radial variations based on the contribution of sap flux through the outer sapwood annuli (0–10 mm) relative to the total sap flux of sapwood area with 20 and 30 mm thicknesses as reported by Zhang et al. [27]. The radial variations in Fd of other species were not considered. In this study, Js and ET were integrated over one day to provide daily values at the stand scale; daily averages of Fd were computed for stem-scale estimates. The missing data for daily stand- and stem-scale transpirations due to occasional power losses were interpolated from VPDm using the exponential saturation model fitted by the data of the same month during which variations in the tree growth and soil conditions were considered insignificant [17,40,41].

3. Results

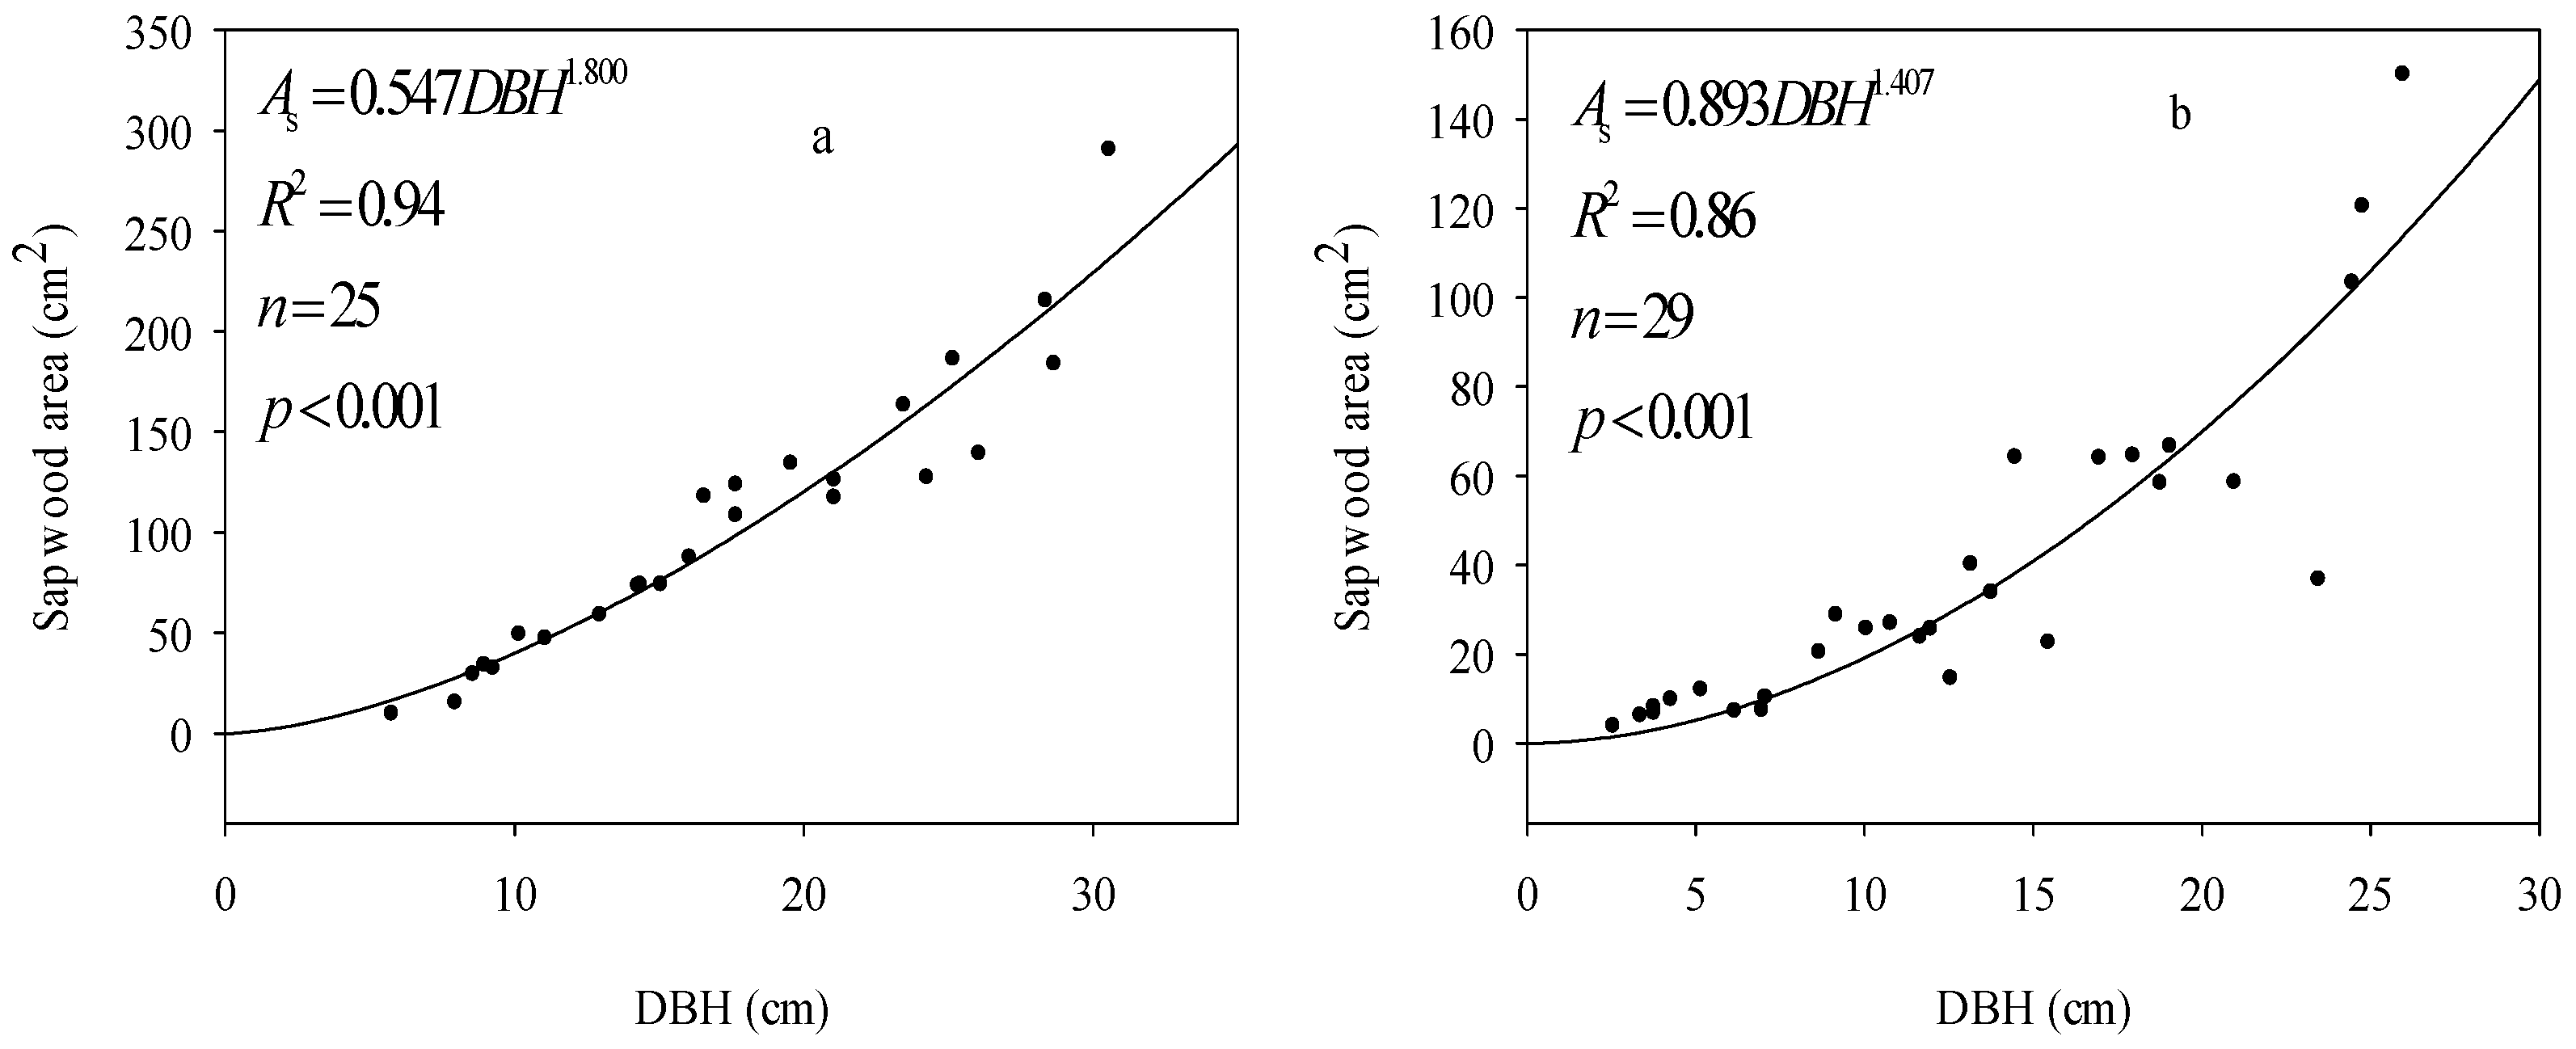
3.1. Sapwood Area Estimates

Regression equations of AS and DBH of oak and apricot trees were derived from the measurements of increment cores sampled around the plot as AS = 0.547DBH1.800 (R2 = 0.94) and AS = 0.893DBH1.407 (R2 = 0.86), respectively (Figure 1). Based on these equations, the sapwood area of each individual tree in the plot was calculated for each year. The AS of individual trees in the plot ranged from 2.37 to 179.42 cm2. In 2008, 2009, and 2010, the AS of oak trees in the plot were 0.1647, 0.1679, and 0.1774 m2, respectively, and the overall AS values of the plot were 0.2356, 0.2398, and 0.2506 m2, respectively.

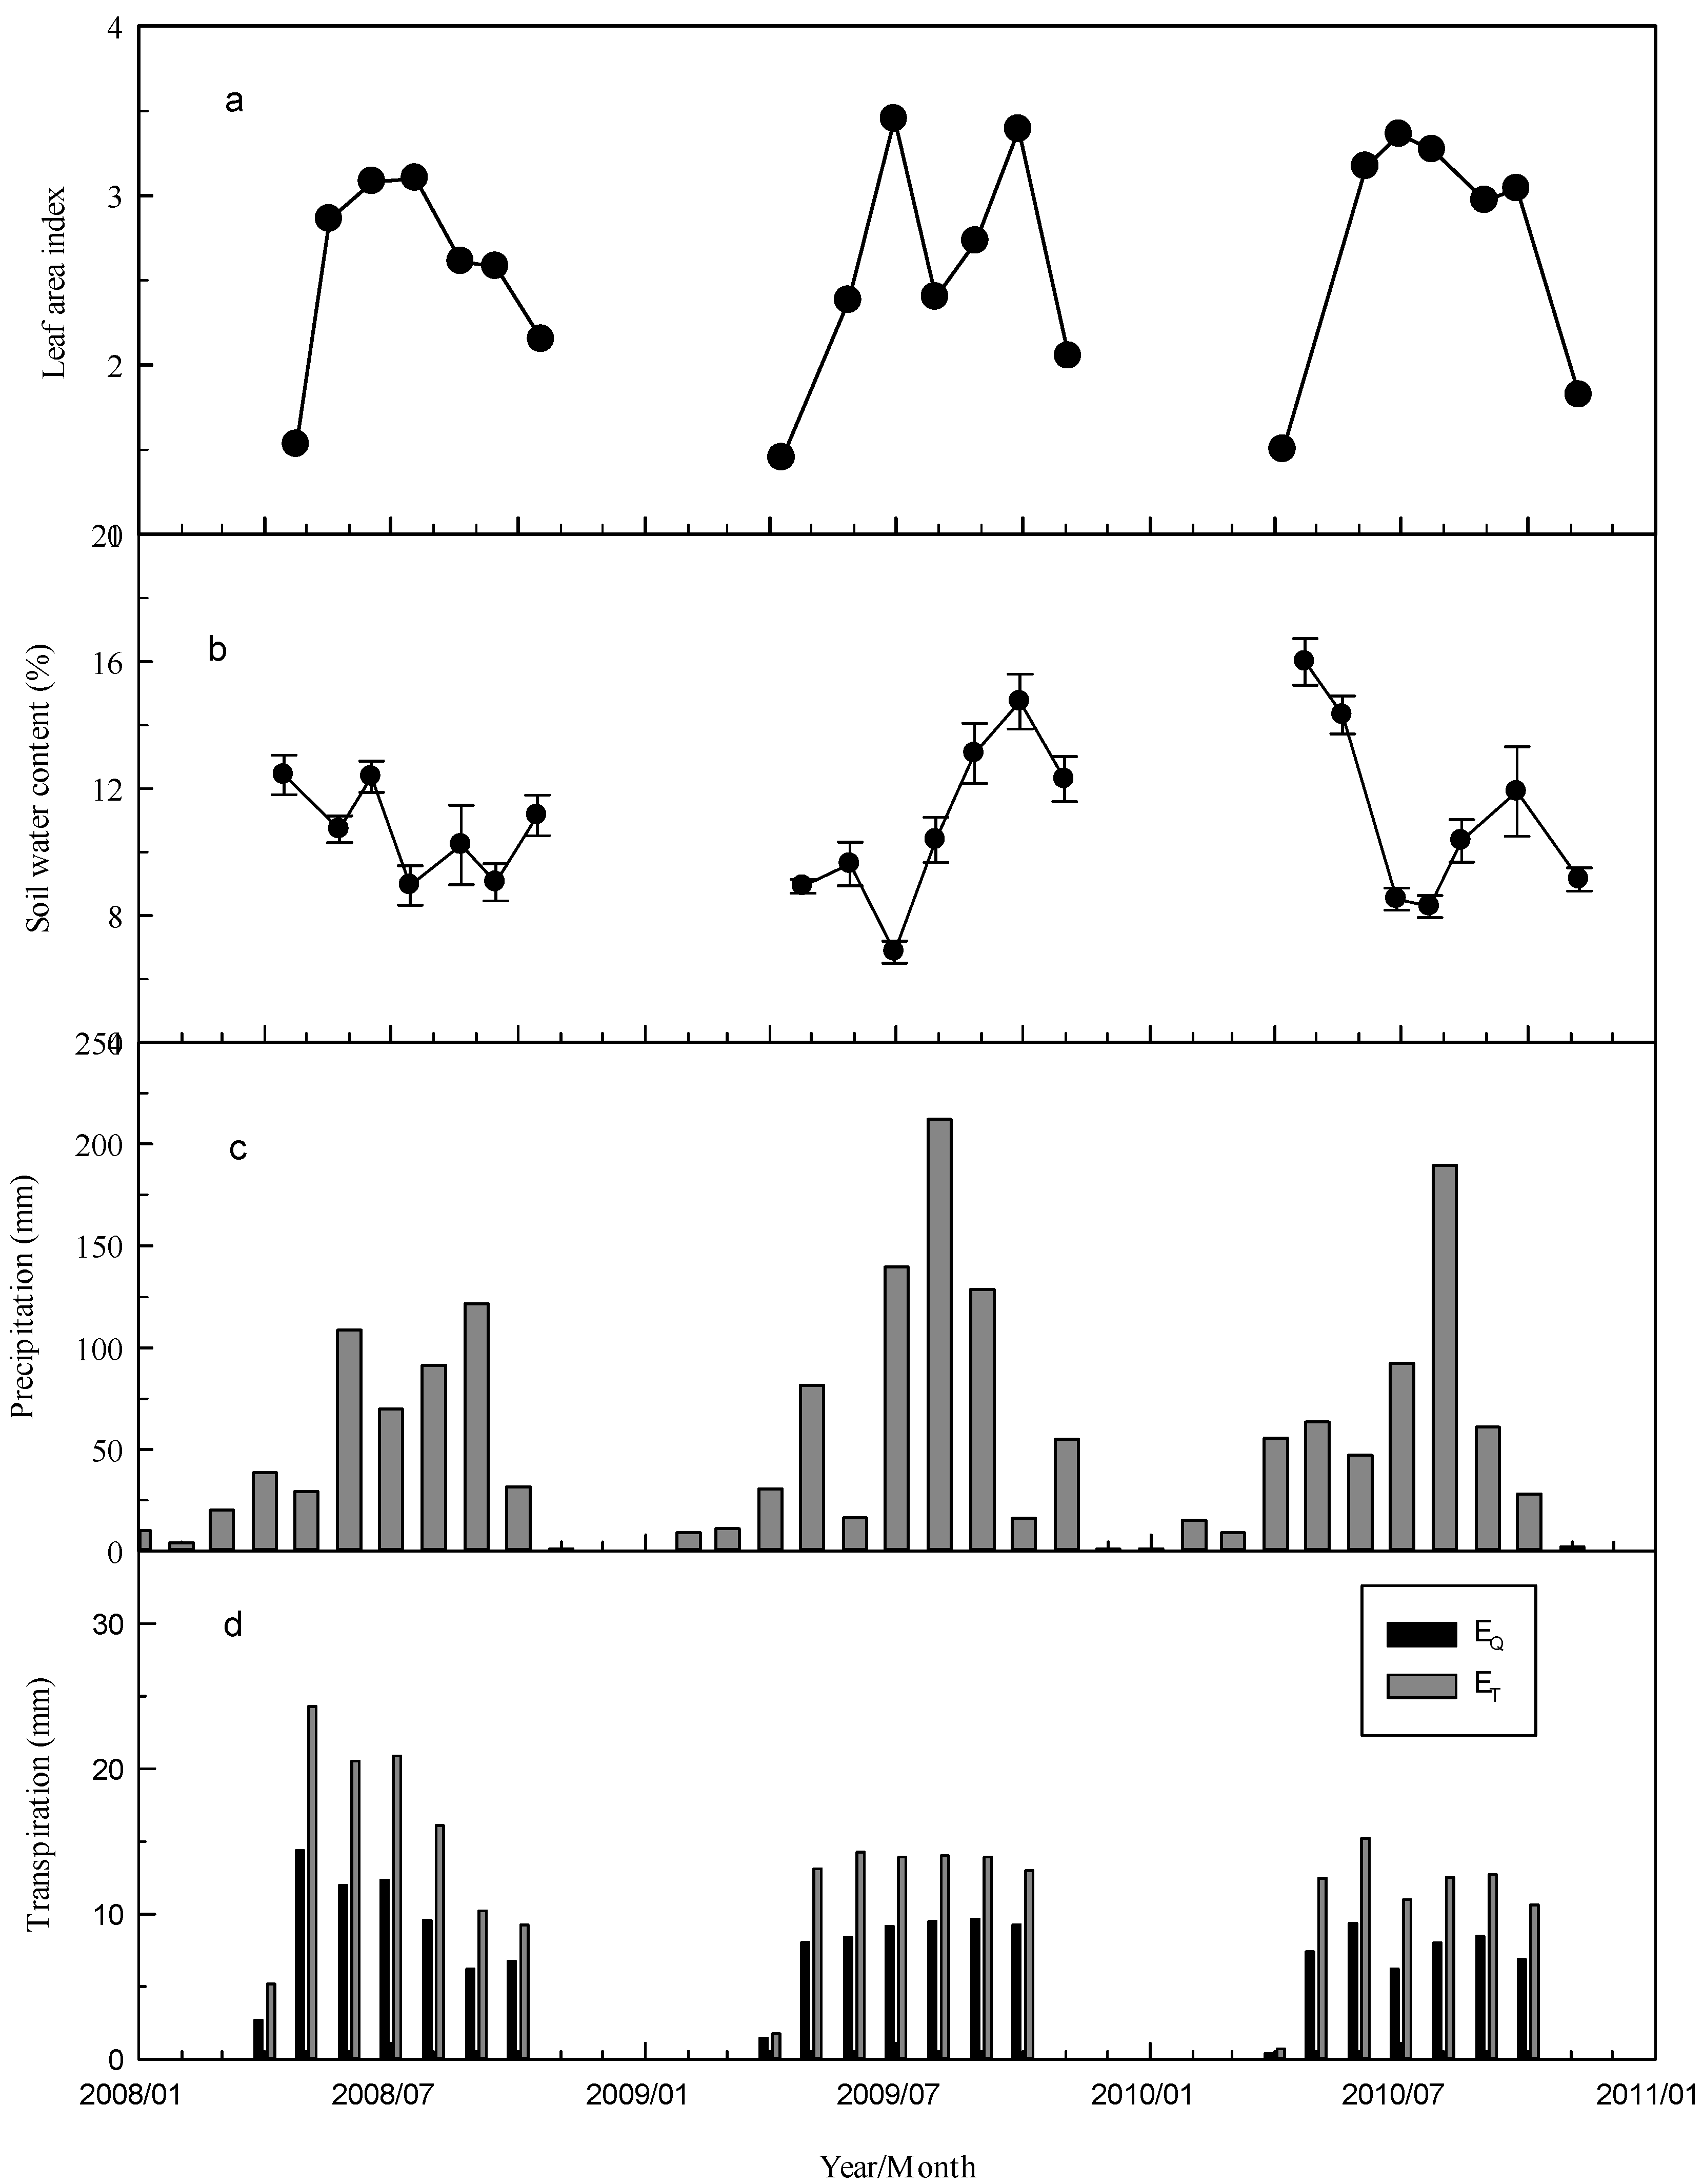
3.2. Meteorological Conditions, LAI, and Soil Water Content

Mean daily solar radiation (Rs), air temperature (T), and daytime vapor pressure deficit (VPDm) during the three growing seasons are shown in Table 1. Mean daily Rs did not clearly differ among the three growing seasons (approximately 17 MJ∙m−2). The inter-annual variation in VPDm was noticeable, as it varied from 1.22 through 1.20 to 0.99 kPa.
Over the three years, gross precipitation at the study site varied largely in both the total amount and monthly distribution (Table 1, Figure 2c). The annual sums were 526 mm (2008), 700 mm (2009), and 564 mm (2010). Precipitation was typically scarce in April and May and mainly occurred from July to September, in concordance with the long-term rainfall distribution pattern in the region. The precipitation in June varied greatly over the three years; while precipitation reached 108 mm in 2008, it was only 16 mm in 2009.
LAI of this forest ranged between 1.45 and 3.45 in the three years (Table 1, Figure 2a). Oak follows the flushing pattern of leafing, with a sharply increasing LAI in spring, a maximum LAI in June, and a smooth plateau in LAI until September (with occasional exceptions). In 2009, the site experienced very little rainfall and low soil moisture in June and exhibited a lowered LAI in July. Given that oak trees gradually lose their leaves during the winter, the LAI at the end of the growing season was higher than that at the beginning.
Soil water content exhibited large variations over the three years. Changes in soil water content generally reflected the refilling from precipitation events. The spring of 2010 showed relatively high soil water content with respect to the other years, probably due to copious rainfall in the previous months (Figure 2b,c).

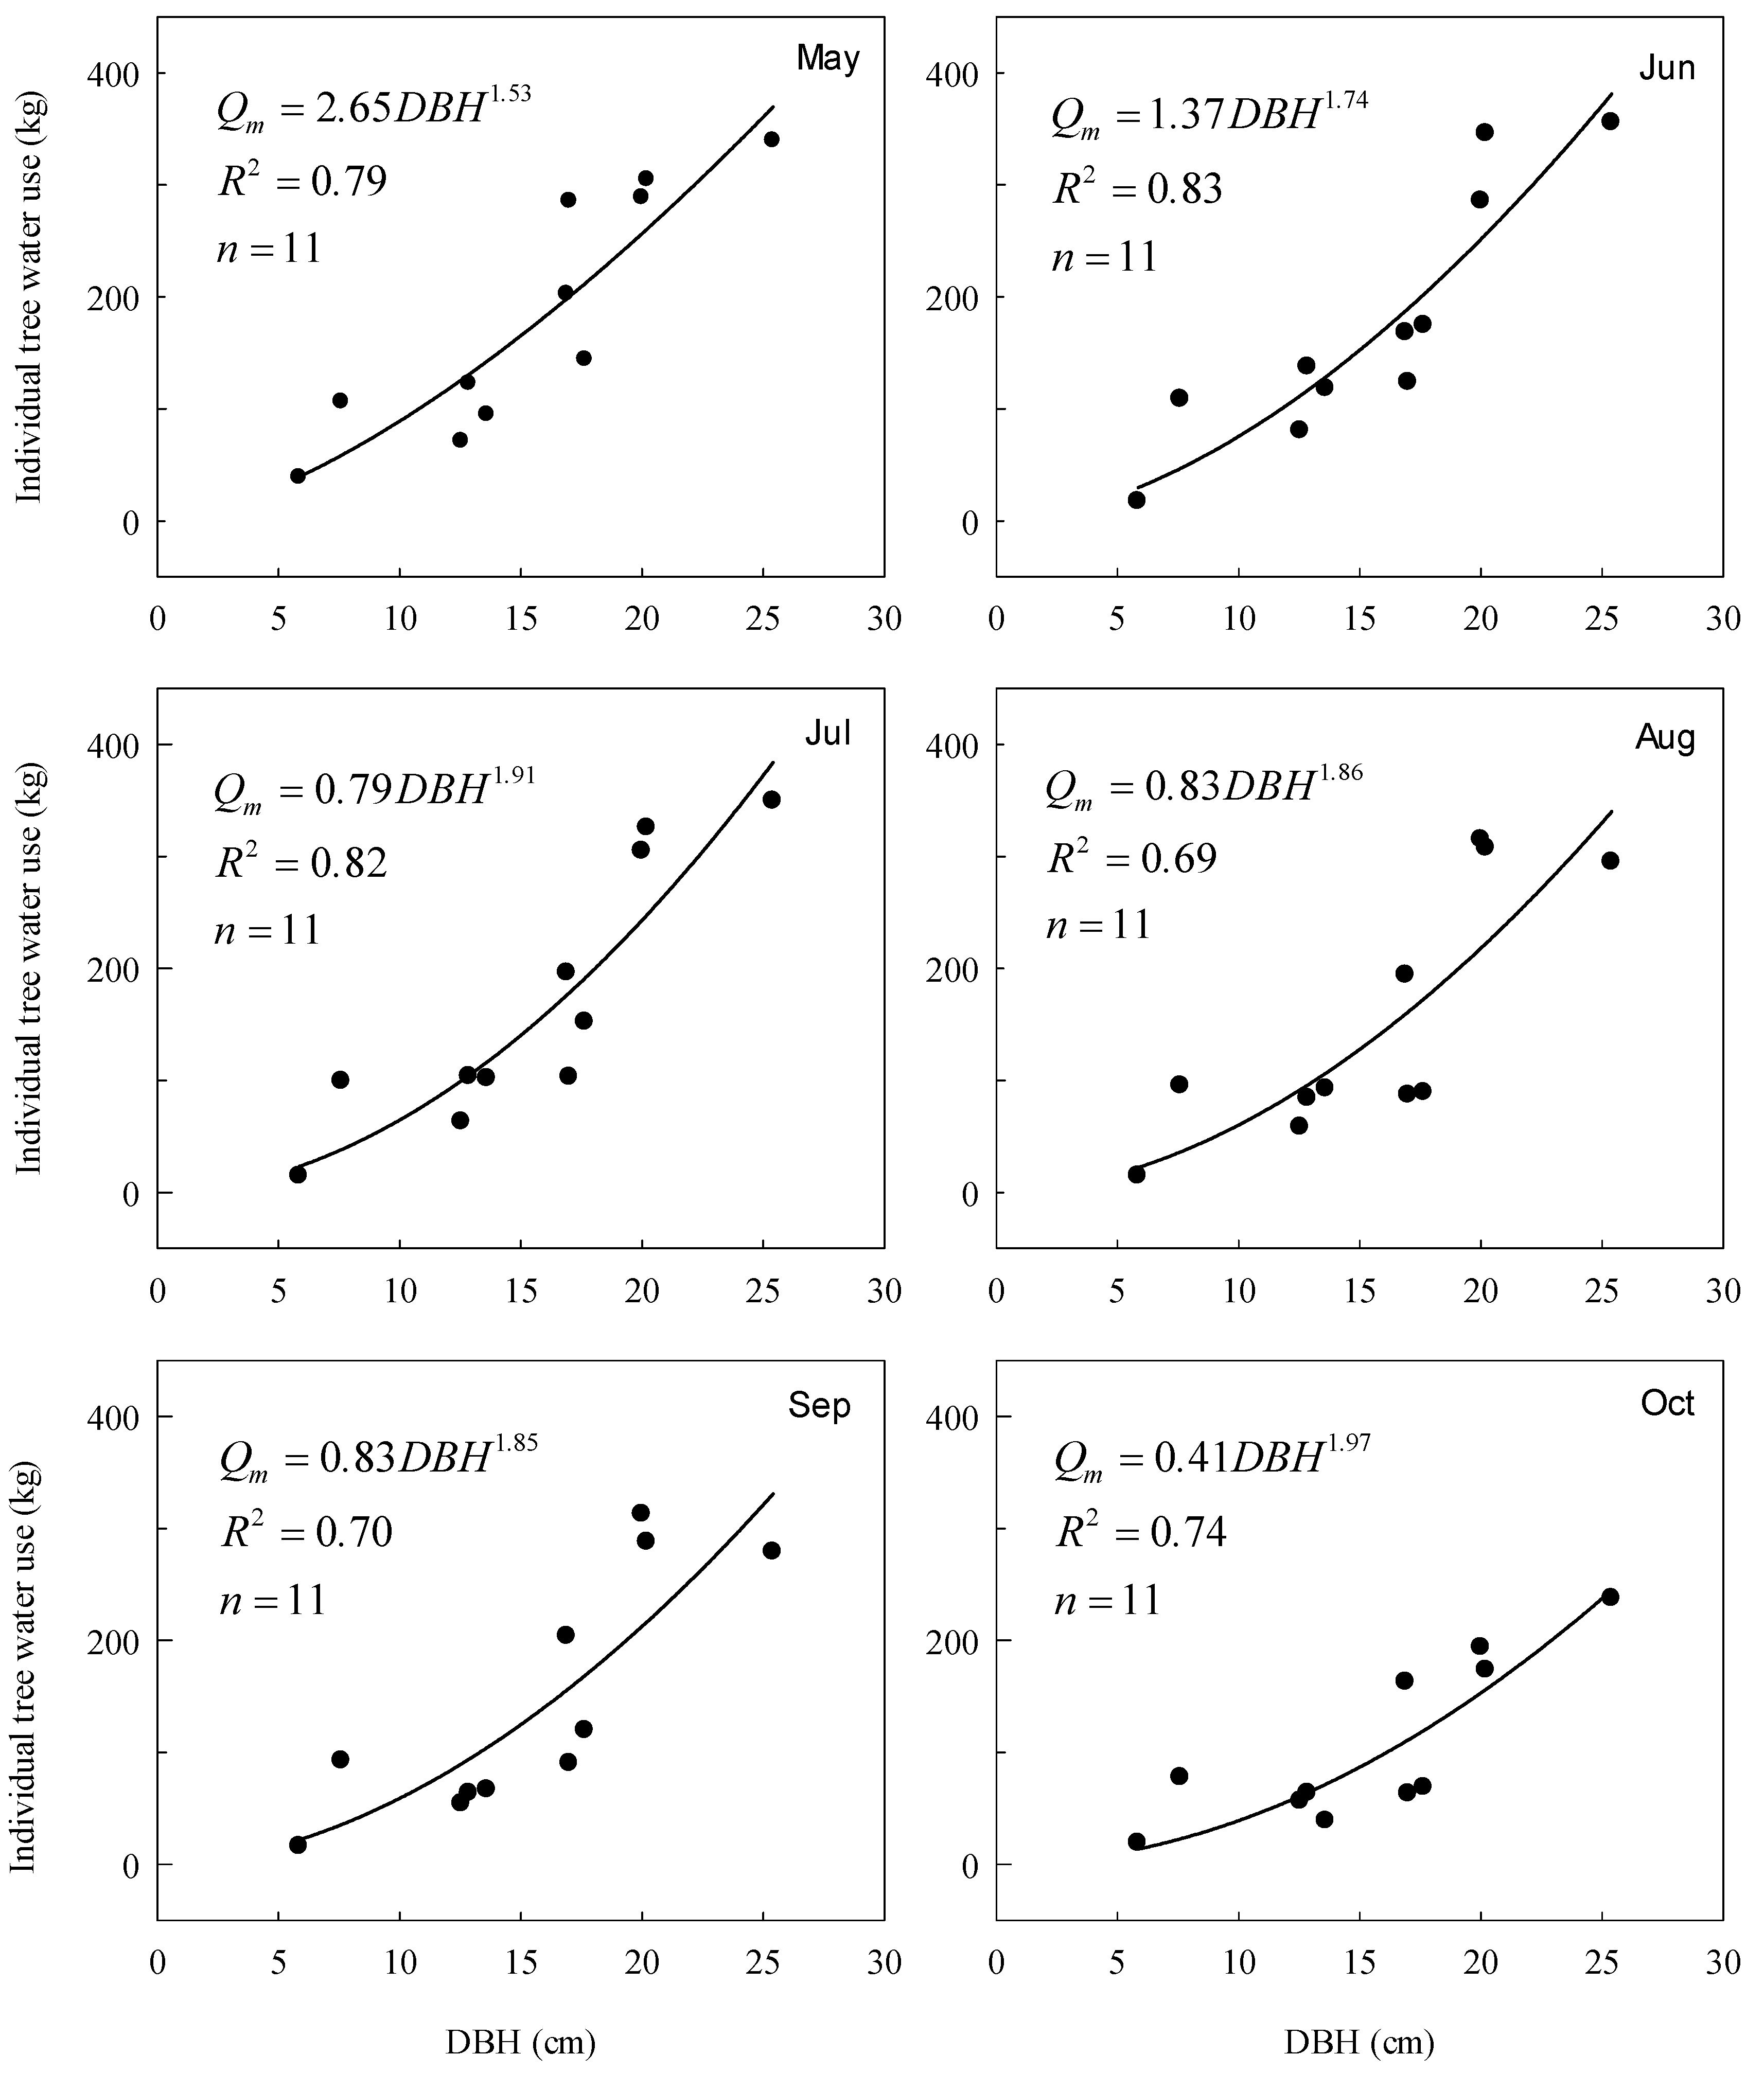
3.3. Transpiration at the Stem-Scale

We investigated monthly cumulative transpiration by oak trees at the stem scale. Figure 3 presents the relationships between monthly tree transpiration (Qm) and DBH during the growing season in 2009 as an example. Cumulative monthly tree transpiration in the plot was strongly related to DBH and could be expressed using the model y = axb. The DBH explains over 70% of the variation in Qm. However, the regression coefficients varied across the growing season, probably owing to the changes in environmental factors. Although the relationships of daily, monthly, and yearly sample tree transpiration versus DBH could also be well fitted by this model (data not shown), DBH was not related to individual tree transpiration in apricot trees. This might be attributable to the close correlation among transpirable crown size, sapwood area, and DBH in the canopy dominant oak trees and the contrasting weak correlation in apricot trees. The regressions across the months exhibited similar magnitudes of transpiration for all sizes of oak trees, except for the later months.

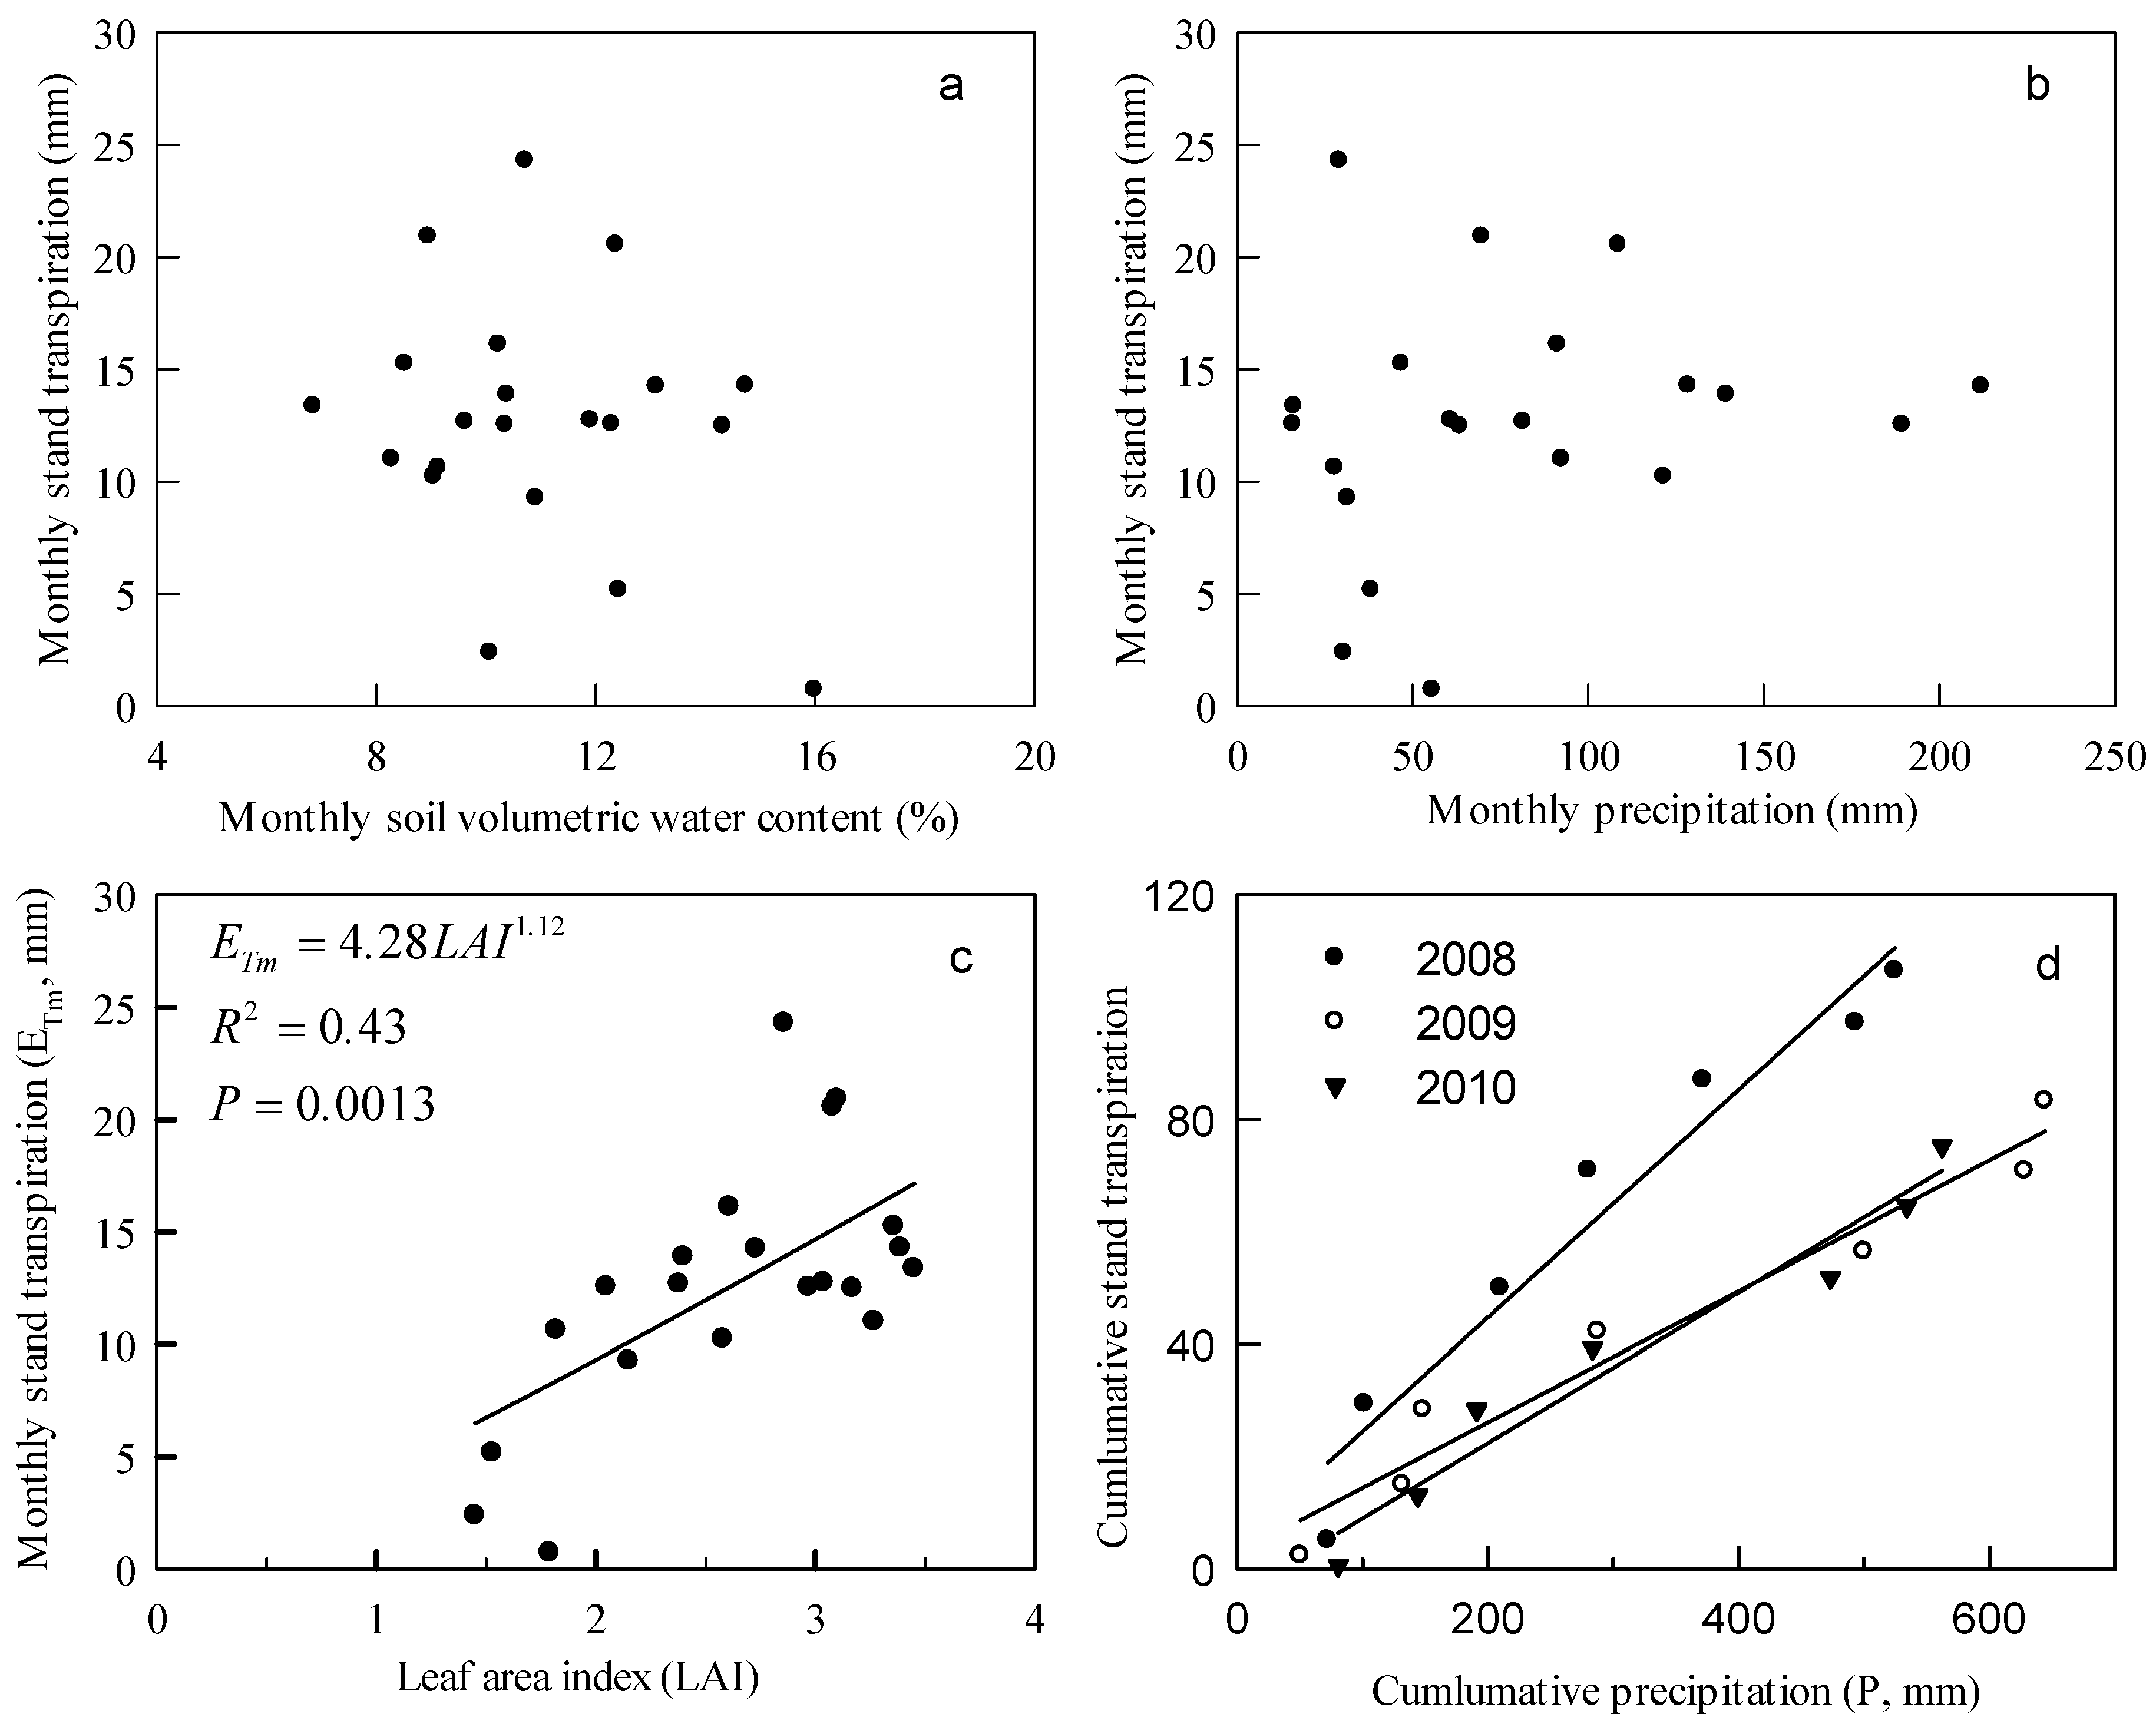
3.4. Stand Transpiration

Daily stand transpiration values were calculated based on species-specific estimates of transpiration in the stand. Regression equations of daily stand transpiration (ETd) with VPDm and Rs were established for each month during these growing seasons. The relationship between ETd and VPDm was fitted using the exponential saturation model, and the relationship between ETd and Rs was fitted using linear equations. Table 2 presents the monthly relationships of ETd with VPDm and Rs in 2009 as examples. ETd strongly correlated with VPDm and Rs. The missing daily stand transpiration data (due to occasional power losses) were filled in using VPDm and the corresponding month’s equations.
Monthly stand transpiration (ETm) values were integrated and their relationships with stand and environmental factors were analyzed. Although no obvious relationship was detected between ETm and either monthly mean θ or monthly P within these three growing seasons (Figure 4a,b), the analysis showed a significant linear correlation between ETm and LAI (p < 0.01) (Figure 4c). In addition, a significant linear correlation was observed between the cumulative stand transpiration at monthly intervals through the growing season and the corresponding cumulative precipitation within each year (Figure 4d) (the regression slopes were different among years). This provides some information about the proportion of tree transpiration that corresponds to gross rainfall. Although the gross precipitation was the lowest in 2008, transpiration was the highest, probably owing to the relatively large LAI in early summer and higher VPDm during the year.
During the three growing seasons, the total transpirations of the oak trees in the plot were estimated to be 63.93, 55.52, and 46.81 mm, respectively (Table 3). Total stand transpirations during the three growing seasons were estimated to be 106.47, 83.30, and 75.27 mm, respectively. The proportion of transpiration by oak trees was relatively stable over the years, ranging from 60% to 66%.

4. Discussion

4.1. Stem-Scale Transpiration Estimate and Influencing Factors

Stem-scale transpiration of oak trees was significantly related to the stem DBH at a monthly time scale (Figure 3). The difference in the parameters of the fitted curves across the months might be caused by other internal or environmental factors (e.g., soil moisture conditions). Nonetheless, similar magnitudes of transpiration were observed (with the exception of the later months). Vertessy et al. [36] showed that mean daily transpiration was strongly related to DBH in mountain ash trees. Jung et al. [42] also detected an agreement between the measured and estimated transpirations using a constructed relationship with DBH. Köstner et al. [43] suggested that whole-tree water use could be even more closely related to tree circumference or diameter than the sapwood area. Considering that DBHs are straightforward to measure, it was possible to make reliable assessments of the related stand parameters in the dominant oak trees. However, we did not detect such an obvious relationship in apricot trees. This inconsistency might be attributed to the dominance and hierarchical positions of individuals in the stand [44,45]. Compared to that of dominant trees, the lower trees are less exposed to radiation intensities and VPD, and hence exhibit lower transpiration and possibly other differences [46]; in the natural oak forest, the height of the apricot trees was generally lower than that of the oak trees. Nevertheless, DBH might play a promising role in estimating tree or stand transpiration in a pure stand.

4.2. Stand Transpiration Characteristics

Natural forests usually have complicated compositions, with diverse species and heterogeneous sizes. Transpiration estimates in such forests are generally conducted species-specifically for adult trees. Based on our previous studies on the variation in Fd across the radial xylem profiles in oak trees, we applied corrections for sap flux estimates to oak trees that had sapwood wider than the probe length [27]. Neglecting this radial variation would induce significant errors in the estimates of tree and stand water use [26,47,48], with systematic errors in whole tree water use from 90% reaching up to 300% [49]. In this study, if Fd was assumed to be uniform over the sapwood depth, transpiration of oak trees would have been overestimated by 25% (2009) to 42% (2010). This was consistent with the analysis by Kume et al. [26] which indicated a possible overestimate of 43%.
Our results also suggest that the factors influencing the tree or stand transpiration vary with time scales. On a seasonal or annual time scale, transpiration was largely controlled by phenological (e.g., LAI) and climatic factors (e.g., Rs and VPD). In the temperate deciduous forests, the dominant factor controlling the seasonal canopy conductance and stand transpiration is the degree of foliation [50]. The amount of foliage is mostly responsible for the transpired water, and therefore, the canopy photosynthesis [51]. Prediction of transpiration as a function of LAI has been developed in crop species to quantify the amount of water needed for irrigation [52].
Among the environmental factors, VPD and Rs directly affect the transpiration processes, and can trigger timely responses in plant transpiration, whereas the effects of rainfall and soil water are reflected on a longer temporal scale. Chen et al. [53] reported that stand transpiration was related to the monthly rainfall and increased with soil moisture recharge. Furthermore, daily transpiration of an olive plantation was higher under wet conditions resulting from rainfall and irrigation treatment than when the soil water was limited [54,55]. In this study, VPD and Rs can be well fitted to regressive equations with daily transpiration values on a monthly time scale (Table 2). However, no correlations were detected for monthly stand transpiration with either soil water content or precipitation (Figure 4a,b). This might suggest that other factors were more influential and that the soil condition in the stand was not subjected to moisture stress. As the soil moisture changes throughout the year, recharge during relatively dry periods would be more pronounced than that during wet periods. Previous reports suggest that early growth season precipitation has a positive influence on stand transpiration owing to soil water recovery following a dry period [18,56].
Stand transpiration during the three growing seasons of our investigation ranged from 75 to 106 mm, with average daily values of 0.4 to 0.56 mm. Although the estimates were lower than those recorded in previous studies on broadleaf trees in other regions [22,57,58], they fall in the range of values measured in the semi-arid regions of China. For example, the daily estimates for a larch plantation in the semi-arid northwestern China ranged from 0.64 to 1.6 mm [30,59]. The estimates for a temperate deciduous forest in Korea ranged from 0.64 to 0.70 mm [42]. Considering the variety of shrubs present in the natural oak forest, the actual stand transpiration would be greater than that of the present understory-excluded estimates. The dominant oak trees contributed to 60%–66% of the total transpiration and this level was relatively stable over the three years. It is expected that this natural ecosystem will be hydrologically sustainable under this semi-arid climatic condition.

5. Conclusions

At the stem scale, monthly oak tree transpiration was significantly correlated with DBH. The dominant factors affecting stand transpiration varied with time scales. Daily stand transpiration correlated with daily solar radiation and daytime average vapor pressure deficit. Seasonal changes in stand transpiration were closely correlated with LAI, indicating that LAI can be used as a proxy for stand phenology. No obvious relationship was observed between monthly stand transpiration and either soil moisture or precipitation during the study period, probably owing to the changes in LAI throughout a growing season making it the dominant factor, and/or the hysteretic effect of precipitation and soil moisture on transpiration. The proportion of transpiration by oak trees in the annual total stand transpiration of the forest was stable, ranging from 60% to 66%. This implies that the secondary natural oak forest exhibits stable growth with a normal magnitude of annual water consumption and is sustainable in this region.

Acknowledgments

This research was supported by the National Natural Science Foundation of China (No. 41171419, 41471440, 41411140035). The authors K. O. and N. Y. were supported by the Japan Society for the Promotion of Science through the NSFC-JSPS bilateral joint research project.

Author Contributions

S.D., N.Y. and K.O. conceived and designed the experiments; M.-J.Y., J.-G.Z., Q.-Y.H., W.-Y.S. and S.D. performed the experiments; J.-G.Z. and Q.-Y. H. analyzed the data; K.O. and N.Y. contributed technical advice; M.-J.Y, J.-G.Z. and S.D. wrote the paper.

Conflicts of Interest

The authors declare no conflict of interest.

References

  1. Fang, J.-Y.; Yoda, K. Climate and vegetation in china iii water balance and distribution of vegetation. Ecol. Res. 1990, 5, 9–23. [Google Scholar] [CrossRef]
  2. Kira, T. Forest ecosystems of east and southeast Asia in a global perspective. Ecol. Res. 1991, 6, 185–200. [Google Scholar] [CrossRef]
  3. Aranda, I.; Forner, A.; Cuesta, B.; Valladares, F. Species-specific water use by forest tree species: From the tree to the stand. Agric. Water Manag. 2012, 114, 67–77. [Google Scholar] [CrossRef]
  4. Kira, T. A climatological interpretation of japanese vegetation zones. In Vegetation Science and Environmental Protection; Miyawaki, A., Tüxen, R., Eds.; Maruzen: Tokyo, Japan, 1977; pp. 21–30. [Google Scholar]
  5. Wang, K.C.; Dickinson, R.E. A review of global terrestrial evapotranspiration: Observation, modeling, climatology, and climatic variability. Rev. Geophys. 2012, 50, RG2005. [Google Scholar] [CrossRef]
  6. Dulamsuren, C.; Hauck, M.; Leuschner, C. Recent drought stress leads to growth reductions in larix sibirica in the western khentey, mongolia. Glob. Chang. Biol. 2010, 16, 3024–3035. [Google Scholar] [CrossRef]
  7. Yaseef, N.R.; Yakir, D.; Rotenberg, E.; Schiller, G.; Cohen, S. Ecohydrology of a semi-arid forest: Partitioning among water balance components and its implications for predicted precipitation changes. Ecohydrology 2010, 3, 143–154. [Google Scholar] [CrossRef]
  8. Tian, J.-L.; Liang, Y.-M.; Liu, P.-L. Investigation into the Ecological Agriculture Construction in Hilly-Gully Region of the Loess Plateau; Yellowriver Water Conservancy Press: Zhengzhou, China, 2003; p. 275. (In Chinese) [Google Scholar]
  9. Tsunekawa, A.; Liu, G.; Yamanaka, N.; Du, S. Restoration and Development of the Degraded Loess Plateau, China; Springer: Tokyo, Japan, 2014; p. 288. [Google Scholar]
  10. Zhang, X.P.; Zhang, L.; Zhao, J.; Rustomji, P.; Hairsine, P. Responses of streamflow to changes in climate and land use/cover in the loess plateau, China. Water Resour. Res. 2008, 44. [Google Scholar] [CrossRef]
  11. Wu, Q.-X.; Yang, W.-Z. Forest and Grassland Vegetation Construction and Its Sustainable Development in Loess Plateau; (China’s) Science Press: Beijing, China, 1998; p. 289. (In Chinese) [Google Scholar]
  12. Cheng, J.M.; Wan, H.E. Vegetation Construction and Soil and Water Conservation in the Loess Plateau of China; China Forestry Publishing House: Beijing, China, 2002; p. 426. (In Chinese) [Google Scholar]
  13. Kimura, R.; Takayama, N. Climate of the loess plateau. In Restoration and Development of the Degraded Loess Plateau, China; Tsunekawa, A., Liu, G., Yamanaka, N., Du, S., Eds.; Springer: Tokyo, Japan, 2014; pp. 23–33. [Google Scholar]
  14. Yamanaka, N.; Hou, Q.C.; Du, S. Vegetation of the loess plateau. In Restoration and Development of the Degraded Loess Plateau, China; Tsunekawa, A., Liu, G., Yamanaka, N., Du, S., Eds.; Springer: Tokyo, Japan, 2014; pp. 49–60. [Google Scholar]
  15. Wang, Y.Q.; Shao, M.A.; Zhu, Y.J.; Liu, Z.P. Impacts of land use and plant characteristics on dried soil layers in different climatic regions on the loess plateau of china. Agric. For. Meteorol. 2011, 151, 437–448. [Google Scholar] [CrossRef]
  16. Jian, S.Q.; Zhao, C.Y.; Fang, S.M.; Yu, K. Effects of different vegetation restoration on soil water storage and water balance in the Chinese loess plateau. Agric. For. Meteorol. 2015, 206, 85–96. [Google Scholar] [CrossRef]
  17. Wang, Y.L.; Liu, G.B.; Kume, T.; Otsuki, K.; Yamanaka, N.; Du, S. Estimating water use of a black locust plantation by the thermal dissipation probe method in the semiarid region of loess plateau, China. J. For. Res. 2010, 15, 241–251. [Google Scholar] [CrossRef]
  18. Zhang, J.G.; Guan, J.H.; Shi, W.Y.; Yamanaka, N.; Du, S. Interannual variation in stand transpiration estimated by sap flow measurement in a semiarid black locust plantation, loess plateau, China. Ecohydrology 2015, 8, 137–147. [Google Scholar] [CrossRef]
  19. Tateno, R.; Tokuchi, N.; Yamanaka, N.; Du, S.; Otsuki, K.; Shimamura, T.; Xue, Z.D.; Wang, S.Q.; Hou, Q.C. Comparison of litterfall production and leaf litter decomposition between an exotic black locust plantation and an indigenous oak forest near yan’an on the loess plateau, China. For. Ecol. Manag. 2007, 241, 84–90. [Google Scholar] [CrossRef]
  20. Otsuki, K.; Yamanaka, N.; Du, S. Vegetation restoration on loess plateau. In Restoration and Development of the Degraded Loess Plateau, China; Tsunekawa, A., Liu, G., Yamanaka, N., Du, S., Eds.; Springer: Tokyo, Japan, 2014; pp. 233–251. [Google Scholar]
  21. Cermak, J.; Kucera, J.; Nadezhdina, N. Sap flow measurements with some thermodynamic methods, flow integration within trees and scaling up from sample trees to entire forest stands. Trees-Struct. Funct. 2004, 18, 529–546. [Google Scholar] [CrossRef]
  22. David, T.S.; Ferreira, M.I.; David, J.S.; Pereira, J.S. Transpiration from a mature eucalyptus globulus plantation in portugal during a spring-summer period of progressively higher water deficit. Oecologia 1997, 110, 153–159. [Google Scholar] [CrossRef]
  23. Lu, P.; Urban, L.; Zhao, P. Granier’s thermal dissipation probe (TDP) method for measuring sap flow in trees: Theory and practice. Acta Bot. Sin. 2004, 46, 631–646. [Google Scholar]
  24. Smith, D.; Allen, S. Measurement of sap flow in plant stems. J. Exp. Bot. 1996, 47, 1833–1844. [Google Scholar] [CrossRef]
  25. Granier, A.; Biron, P.; Bréda, N.; Pontailler, J.Y.; Saugier, B. Transpiration of trees and forest stands: Short and long-term monitoring using sapflow methods. Glob. Chang. Biol. 1996, 2, 265–274. [Google Scholar] [CrossRef]
  26. Kume, T.; Otsuki, K.; Du, S.; Yamanaka, N.; Wang, Y.L.; Liu, G.B. Spatial variation in sap flow velocity in semiarid region trees: Its impact on stand-scale transpiration estimates. Hydrol. Process. 2012, 26, 1161–1168. [Google Scholar] [CrossRef]
  27. Zhang, J.G.; He, Q.Y.; Shi, W.Y.; Otsuki, K.; Yamanaka, N.; Du, S. Radial variations in xylem sap flow and their effect on whole-tree water use estimates. Hydrol. Process. 2015, 29, 4993–5002. [Google Scholar] [CrossRef]
  28. Du, S.; Wang, Y.L.; Kume, T.; Zhang, J.G.; Otsuki, K.; Yamanaka, N.; Liu, G.B. Sapflow characteristics and climatic responses in three forest species in the semiarid loess plateau region of China. Agric. For. Meteorol. 2011, 151, 1–10. [Google Scholar] [CrossRef]
  29. Tateishi, M.; Kumagai, T.; Utsumi, Y.; Umebayasi, T.; Shiiba, Y.; Inoue, K.; Kaji, K.; Cho, K.; Otsuki, K. Spatial variations in xylem sap flux density in evergreen oak trees with radial-porous wood: Comparisons with anatomical observations. Trees-Struct. Funct. 2008, 22, 23–30. [Google Scholar] [CrossRef]
  30. Wang, Y.H.; Yu, P.T.; Xiong, W.; Shen, Z.X.; Guo, M.C.; Shi, Z.J.; Du, A.; Wang, L.M. Water-yield reduction after afforestation and related processes in the semiarid Liupan mountains, northwest China. J. Am. Water Resour. Assoc. 2008, 44, 1086–1097. [Google Scholar] [CrossRef]
  31. Shi, W.Y.; Yan, M.J.; Zhang, J.G.; Guan, J.H.; Du, S. Soil CO2 emissions from five different types of land use on the semiarid loess plateau of China, with emphasis on the contribution of winter soil respiration. Atmos. Environ. 2014, 88, 74–82. [Google Scholar] [CrossRef]
  32. Campbell, G.S.; Norman, J.M. An introduction to Environmental Biophysics; Springer: New York, NY, USA, 1998. [Google Scholar]
  33. Granier, A. Evaluation of transpiration in a douglas-fir stand by means of sap flow measurements. Tree Physiol. 1987, 3, 309–320. [Google Scholar] [CrossRef] [PubMed]
  34. James, S.A.; Clearwater, M.J.; Meinzer, F.C.; Goldstein, G. Heat dissipation sensors of variable length for the measurement of sap flow in trees with deep sapwood. Tree Physiol. 2002, 22, 277–283. [Google Scholar] [CrossRef] [PubMed]
  35. Zhang, J.G.; Yan, M.J.; Shi, W.Y.; Du, S. Seasonal dynamics and azimuthal variations of sap flow in quercus liaotungensis and their effects on transpiration estimates. J. Soil Water Conserv. 2011, 25, 193–197. [Google Scholar]
  36. Vertessy, R.; Benyon, R.; O’sullivan, S.; Gribben, P. Relationships between stem diameter, sapwood area, leaf area and transpiration in a young mountain ash forest. Tree Physiol. 1995, 15, 559–567. [Google Scholar] [CrossRef] [PubMed]
  37. Wilson, K.B.; Hanson, P.J.; Mulholland, P.J.; Baldocchi, D.D.; Wullschleger, S.D. A comparison of methods for determining forest evapotranspiration and its components: Sap-flow, soil water budget, eddy covariance and catchment water balance. Agric. For. Meteorol. 2001, 106, 153–168. [Google Scholar] [CrossRef]
  38. Pataki, D.; Oren, R. Species differences in stomatal control of water loss at the canopy scale in a mature bottomland deciduous forest. Adv. Water Resour. 2003, 26, 1267–1278. [Google Scholar] [CrossRef]
  39. Kumagai, T.; Aoki, S.; Shimizu, T.; Otsuki, K. Sap flow estimates of stand transpiration at two slope positions in a Japanese cedar forest watershed. Tree Physiol. 2007, 27, 161–168. [Google Scholar] [CrossRef] [PubMed]
  40. Ewers, B.E.; Mackay, D.S.; Gower, S.T.; Ahl, D.E.; Burrows, S.N.; Samanta, S.S. Tree species effects on stand transpiration in northern Wisconsin. Water Resour. Res. 2002, 38, 1–11. [Google Scholar] [CrossRef]
  41. Zhang, J.G.; Kume, T.; Otsuki, K.; Yamanaka, N.; Du, S. Sap flow dynamics of dominant trees in quercus liaotungensis forest in the semiarid loess plateau region. Sci. Silvae Sin. 2011, 47, 63–69. [Google Scholar]
  42. Jung, E.; Otieno, D.; Lee, B.; Lim, J.; Kang, S.; Schmidt, M.; Tenhunen, J. Up-scaling to stand transpiration of an asian temperate mixed-deciduous forest from single tree sapflow measurements. Plant Ecol. 2011, 212, 383–395. [Google Scholar] [CrossRef]
  43. Köstner, B.; Schulze, E.-D.; Kelliher, F.; Hollinger, D.; Byers, J.; Hunt, J.; McSeveny, T.; Meserth, R.; Weir, P. Transpiration and canopy conductance in a pristine broad-leaved forest of nothofagus: An analysis of xylem sap flow and eddy correlation measurements. Oecologia 1992, 91, 350–359. [Google Scholar] [CrossRef]
  44. Martin, T.A.; Brown, K.J.; Cermak, J.; Ceulemans, R.; Kucera, J.; Meinzer, F.C.; Rombold, J.S.; Sprugel, D.G.; Hinckley, T.M. Crown conductance and tree and stand transpiration in a second-growth abies amabilis forest. Can. J. For. Res. 1997, 27, 797–808. [Google Scholar] [CrossRef]
  45. Granier, A.; Biron, P.; Lemoine, D. Water balance, transpiration and canopy conductance in two beech stands. Agric. For. Meteorol. 2000, 100, 291–308. [Google Scholar] [CrossRef]
  46. Horna, V.; Schuldt, B.; Brix, S.; Leuschner, C. Environment and tree size controlling stem sap flux in a perhumid tropical forest of central sulawesi, Indonesia. Ann. For. Sci. 2011, 68, 1027–1038. [Google Scholar] [CrossRef]
  47. Ford, C.R.; McGuire, M.A.; Mitchell, R.J.; Teskey, R.O. Assessing variation in the radial profile of sap flux density in pinus species and its effect on daily water use. Tree Physiol. 2004, 24, 241–249. [Google Scholar] [CrossRef] [PubMed]
  48. Poyatos, R.; Cermak, J.; Llorens, P. Variation in the radial patterns of sap flux density in pubescent oak (quercus pubescens) and its implications for tree and stand transpiration measurements. Tree Physiol. 2007, 27, 537–548. [Google Scholar] [CrossRef] [PubMed]
  49. Nadezhdina, N.; Cermak, J.; Ceulemans, R. Radial patterns of sap flow in woody stems of dominant and understory species: Scaling errors associated with positioning of sensors. Tree Physiol. 2002, 22, 907–918. [Google Scholar] [CrossRef] [PubMed]
  50. Oren, R.; Pataki, D.E. Transpiration in response to variation in microclimate and soil moisture in southeastern deciduous forests. Oecologia 2001, 127, 549–559. [Google Scholar] [CrossRef]
  51. Baldocchi, D.D.; Hicks, B.B.; Camara, P. A canopy stomatal resistance model for gaseous deposition to vegetated surfaces. Atmos. Environ. (1967) 1987, 21, 91–101. [Google Scholar] [CrossRef]
  52. Brun, L.J.; Kanemasu, E.T.; Powers, W.L. Evapotranspiration from soybean and sorghum fileds. Agron. J. 1972, 64, 145–148. [Google Scholar] [CrossRef]
  53. Chen, L.; Zhang, Z.; Zeppel, M.; Liu, C.; Guo, J.; Zhu, J.; Zhang, X.; Zhang, J.; Zha, T. Response of transpiration to rain pulses for two tree species in a semiarid plantation. Int. J. Biometeorol. 2014, 58, 1569–1581. [Google Scholar] [CrossRef] [PubMed]
  54. O’Grady, A.P.; Worledge, D.; Battaglia, M. Constraints on transpiration of eucalyptus globulus in southern tasmania, Australia. Agric. For. Meteorol. 2008, 148, 453–465. [Google Scholar] [CrossRef]
  55. Tognetti, R.; Giovannelli, A.; Lavini, A.; Morelli, G.; Fragnito, F.; d’Andria, R. Assessing environmental controls over conductances through the soil-plant-atmosphere continuum in an experimental olive tree plantation of southern Italy. Agric. For. Meteorol. 2009, 149, 1229–1243. [Google Scholar] [CrossRef]
  56. Breda, N.; Granier, A. Intra- and interannual variations of transpiration, leaf area index and radial growth of a sessile oak stand (quercus petraea). Ann. For. Sci. 1996, 53, 521–536. [Google Scholar] [CrossRef]
  57. Wullschleger, S.D.; Hanson, P.; Todd, D. Transpiration from a multi-species deciduous forest as estimated by xylem sap flow techniques. For. Ecol. Manag. 2001, 143, 205–213. [Google Scholar] [CrossRef]
  58. Schiller, G.; Cohen, S.; Ungar, E.D.; Moshe, Y.; Herr, N. Estimating water use of sclerophyllous species under east-mediterranean climate: III. Tabor oak forest sap flow distribution and transpiration. For. Ecol. Manag. 2007, 238, 147–155. [Google Scholar] [CrossRef]
  59. Xiong, W.; Wang, Y.; Xu, D. Regulations of water use for transpiration of larix principi-rupprechtii plantation and its response on environmental factors in southern Ningxia hilly area. Sci. Silvae Sin. 2003, 39, 1–7. [Google Scholar]
Figure 1. Regressions of sapwood area (As) with the diameter at breast height (DBH) for oak (a) and apricot (b) trees.
Forests 07 00227 g001
Figure 2. Leaf area index (a); volumetric soil water content (b); monthly precipitation (c); and stand transpiration (d) for the site in 2008–2010. Precipitation is presented for all months, while other variables cover growing seasons only. Soil water contents are averages from three 1-m depth profiles. Transpiration estimates are presented for oak trees (EQ) and all trees (ET) in the plot.
Forests 07 00227 g002
Figure 3. Relationships between monthly individual tree water use of oak trees (Qm) and DBH in different months of the 2009 growing season.
Forests 07 00227 g003
Figure 4. Relationships between monthly stand transpiration and monthly mean soil volumetric water content (a); monthly precipitation (b); and monthly leaf area index (c) in the growing seasons from 2008 to 2010; (d) the relationship between cumulative stand transpiration at monthly intervals through the growing season and corresponding cumulative precipitation within each year.
Forests 07 00227 g004
Table 1. Summary of climatology and stand characteristics over the three years.
VariableYear
200820092010
Diameter at breast height (DBH, cm) of all trees11.80 ± 5.8111.93 ± 5.2312.20 ± 5.51
DBH of oak trees12.76 ± 1.0912.91 ± 1.1013.32 ± 1.13
Stand basal area (BA, m2∙ha−1)19.0419.4520.02
BA of oak trees (m2∙ha−1)11.0911.3312.04
Stand leaf area index (LAI)1.53–3.11.45–3.451.5–3.36
Soil moisture (θ, %)9.0–12.46.9–14.78.3–16.0
Mean daily solar radiation (Rs, MJ∙m−2)17.0 ± 0.5117.2 ± 0.5517.1 ± 0.53
Mean daily air temperature (T, °C)16.2 ± 0.3316.9 ± 0.3316.0 ± 0.43
Mean daily daytime vapor pressure deficit (VPDm, kPa)1.22 ± 0.051.20 ± 0.060.99 ± 0.05
Total gross precipitation (P, mm)526700564
Note: The measurement of DBH was conducted before the growing season (March) in each year (Mean ± Standard errors, n = 54). Others (LAI, θ, Rs, T, and VPD) only cover the growing seasons from April–October (Mean ± SE for meteorological data, n = 214).
Table 2. Fitted equations for daily stand transpiration (ETd) with mean daytime vapor pressure deficit (VPDm) and total solar radiation (Rs) for each month during the growing season of 2009.
MonthETd vs. VPDmR2ETd vs. RsR2
MayETd = 0.726(1 − Exp(−1.634VPDm))0.89ETd = 0.063 + 0.023Rs0.88
JunETd = 0.612(1 − Exp(−1.209VPDm))0.63ETd = 0.245 + 0.013Rs0.51
JulETd = 0.633(1 − Exp(−2.424VPDm))0.59ETd = 0.190 + 0.018Rs0.61
AugETd = 0. 639(1 − Exp(−2.744VPDm))0.88ETd = 0.141 + 0.023Rs0.74
SepETd = 0.714(1 − Exp(−2.425VPDm))0.93ETd = 0.068 + 0.034Rs0.89
OctETd = 0.553(1 − Exp(−1.335VPDm))0.44ETd = −0.56 + 0.031Rs0.61
Note: All the regressive equations are significant as p < 0.0001.
Table 3. Transpiration (E) and proportion of stand transpiration of different species in three years.
SpeciesE (mm)Species Contribution (%)
200820092010200820092010
Oak63.9355.5246.8160.0566.6562.19
Apricot22.2418.4018.5718.6122.7323.53
Others20.309.389.8916.9911.6012.54
Total106.4783.375.27100100100

