Article

Streamflow Regime Variations Following Ecological Management on the Loess Plateau, China

1
State Key Laboratory of Soil Erosion and Dry land Farming in Loess Plateau, Institute of Soil and Water Conservation, Chinese Academy of Sciences and Ministry of Water Resources, Yang ling 712100, Shaanxi, China
2
Institute of Soil and Water Conservation, Northwest A & F University, Yangling 712100, China
3
University of Chinese Academy of Sciences, Beijing 100049, China
*
Author to whom correspondence should be addressed.
Forests 2016, 7(1), 6; https://doi.org/10.3390/f7010006
Submission received: 6 September 2015 / Revised: 15 December 2015 / Accepted: 17 December 2015 / Published: 25 December 2015
(This article belongs to the Special Issue Forest Management and Water Resources in the Anthropocene)

Abstract

:
The continuous ecological management of the Loess Plateau is known throughout the world for two strategies: the integrated soil conservation project that began in the 1970s, and the “Grain for Green” project that began in the 1990s. Six sub-catchments nested in the Beiluo River basin were selected to investigate streamflow regime variations during the two project periods. The annual streamflow trends and change points were detected using a bootstrap-based Mann-Kendall test and Pettitt test. Annual streamflow (from the 1950s to 2011) exhibited significantly negative trends in five out of six catchments, varying from −0.15 to −0.30 mm/a. During the integrated soil conservation period, the annual streamflow was reduced due to high flow decreases (5% of time exceeded), whereas in the low flows (95%) it increased in all sub-catchments. During the “Grain for Green” period, the annual streamflow decreased due to daily streamflow reductions at four stations. In addition to high flow and low flow decreases at the Wuqi and Liujiahe stations during the “Grain for Green” period, it is significant that the low flows continuously increased. Compared with trends from the forestry area, which includes the Zhangcunyi and Huangling stations, incremental annual streamflow reductions were observed in other sub-catchments, which can be linked to ecological management. This result implies that streamflow can be moderated by appropriate management options, even in semiarid areas. It was concluded that a stable streamflow regime can be achieved in vegetated areas, and streamflow moderation is dependent on ecological management practices.

1. Introduction

Observations in most regions throughout the world show that hydrological cycles are being affected by climate change. Such changes disrupt the hydrology of drainage basins, altering both the balance between rainfall and evaporation and the runoff response of the area [1,2]. Simultaneously, the impact of human activities on streamflow variations is spatially heterogeneous throughout the world [3,4]. Thus, climate change and human activity related to streamflow effects must be investigated to avoid and minimize the economic costs associated with floods and droughts [3,5,6]. Streamflow regime variations must be understood to achieve sustainable water resources management and develop decision-making strategies.
The Loess Plateau (640,000 km2), located in the middle reaches of the Yellow River basin, generates some of the highest sediment yields observed on earth, with sediment yields exceeding 3 × 10⁴ to 4 × 10⁴ t·km−2·a−1 in some tributaries over recent decades [7,8,9]. Such high soil erosion rates cause serious problems on-site, including soil nutrients and agricultural land losses, degrade the ecologic environment in the middle Yellow River basin and represent the primary cause of sedimentation in the lower Yellow River [10,11]. It has been illustrated that the majority of the sediment yield can be attributed to land use intensification driven by the increasing population [9,12,13]. National ecological management projects have been implemented to control the severe soil erosion. These projects include the integrated soil conservation and “Grain for Green” projects.
The integrated soil conservation project, which focuses on the integrated management of small watersheds, was implemented on the Loess Plateau during the 1970s [11,14,15]. It comprises an extensive series of management actions, including engineering works (building terraces and sediment-trapping dams) and vegetation measures (changing land cover through replanting trees and improving pastures). This project was replaced by the “Grain for Green” project, which mainly consists of vegetation measures. It has been implemented on a massive scale since the 1990s via improving vegetation on slopes [14,15,16,17]. The areas that have been treated by management actions in each sub-catchment are listed in Table 1.
Table 1. Cumulative area treated by management actions in the corresponding sub-catchments from 1959 to 2006 [14,18,19].
Corresponding StationsYearManagement Actions (%)Total (%)
TerraceAfforestationPastureSediment Trapping Dams
Wuqi Liujiahe19590.040.770.020.010.8
19690.522.430.190.153.3
19791.264.220.530.296.3
19891.988.142.470.2912.9
19992.9912.353.950.2919.6
20063.8822.1410.060.2936.4
Zhangcunyi Huangling19590.020.050.000.000.1
19690.180.160.010.010.4
19790.720.280.020.041.0
19890.690.530.080.051.4
19991.040.810.130.052.0
20061.350.960.170.052.5
Jiaokou19590.030.650.010.010.7
19690.402.040.110.172.7
19791.073.540.310.245.2
19891.566.831.430.2410.1
19992.3510.362.280.2415.2
20063.0418.575.790.2427.6
Zhuangtou19590.030.440.010.010.5
19690.311.400.070.051.8
19790.762.430.210.123.5
19891.204.690.970.177.0
19994.7711.801.750.1718.5
20066.1821.164.440.1732.0
The processes that reduce streamflow and sediment yields are different. The engineered projects can block or delay the streamflow routing. By depositing the suspended sediment and steadily releasing water [7,20], the engineering projects can effectively slow runoff and attenuate high flow magnitudes and peaks [20,21,22]. Generally, engineering projects significantly and immediately impact runoff. However, sediment-trapping dams will slowly lose their effectiveness and eventually became abandoned due to sedimentation if proper maintenance is not performed [20,22,23]. Appropriate vegetation measures typically decrease surface runoff and increase in situ water infiltration, thereby decreasing the streamflow and sediment yields [24,25]. In addition, vegetation can alter the water balance by increasing rainfall interception and evapotranspiration in a catchment [26,27,28]. Vegetation measures typically take several years to become effective because vegetative succession is a slow process [28,29]. The effect of appropriate vegetation measures becomes increasingly significant over time [10]. Accordingly, streamflow regime processes and time periods may vary between engineering and vegetation projects.
Numerous studies have analyzed middle Yellow River basin streamflow variations in the context of ecological management. These analyses determined that various management actions have reduced the streamflow in the tributaries, which effectively decreased sediment yields [4,6,28,30,31]. Moreover, these studies also noted that results varied between basins, which may be due to differences in the percentage of an area treated by management actions, vegetation cover, landforms, and other factors. When assessing streamflow variations, it is necessary to consider both climate variability and human activities. Although climate change, such as precipitation variations, have been relatively insignificant on the Loess Plateau [32], climate variability has partly caused streamflow reduction [4,6,30,33,34]. As shown in Table 1, the treated area significantly increased during the 1990s. The transition from the integrated soil conservation project to the “Grain for Green” project represents an intensified process of ecological management process. Previous studies mainly investigated pre- and post-project streamflow changes. However, it is unclear how streamflow regimes concurrently varied during the implementation of these two ecological management projects. The effects of the two projects on streamflow regime changes have been well documented, which in turn indicate if the management actions are appropriate. Accordingly, streamflow regime investigations can help to optimize ecological management.
The aim of this paper is to investigate how the streamflow regime changed during the implementation of the two ecological management strategies. Six sub-catchments from the basin-Beiluo River basin were selected as the study area. We analyzed annual streamflow trends and variations during the two ecological management periods.

2. Study Area and Data
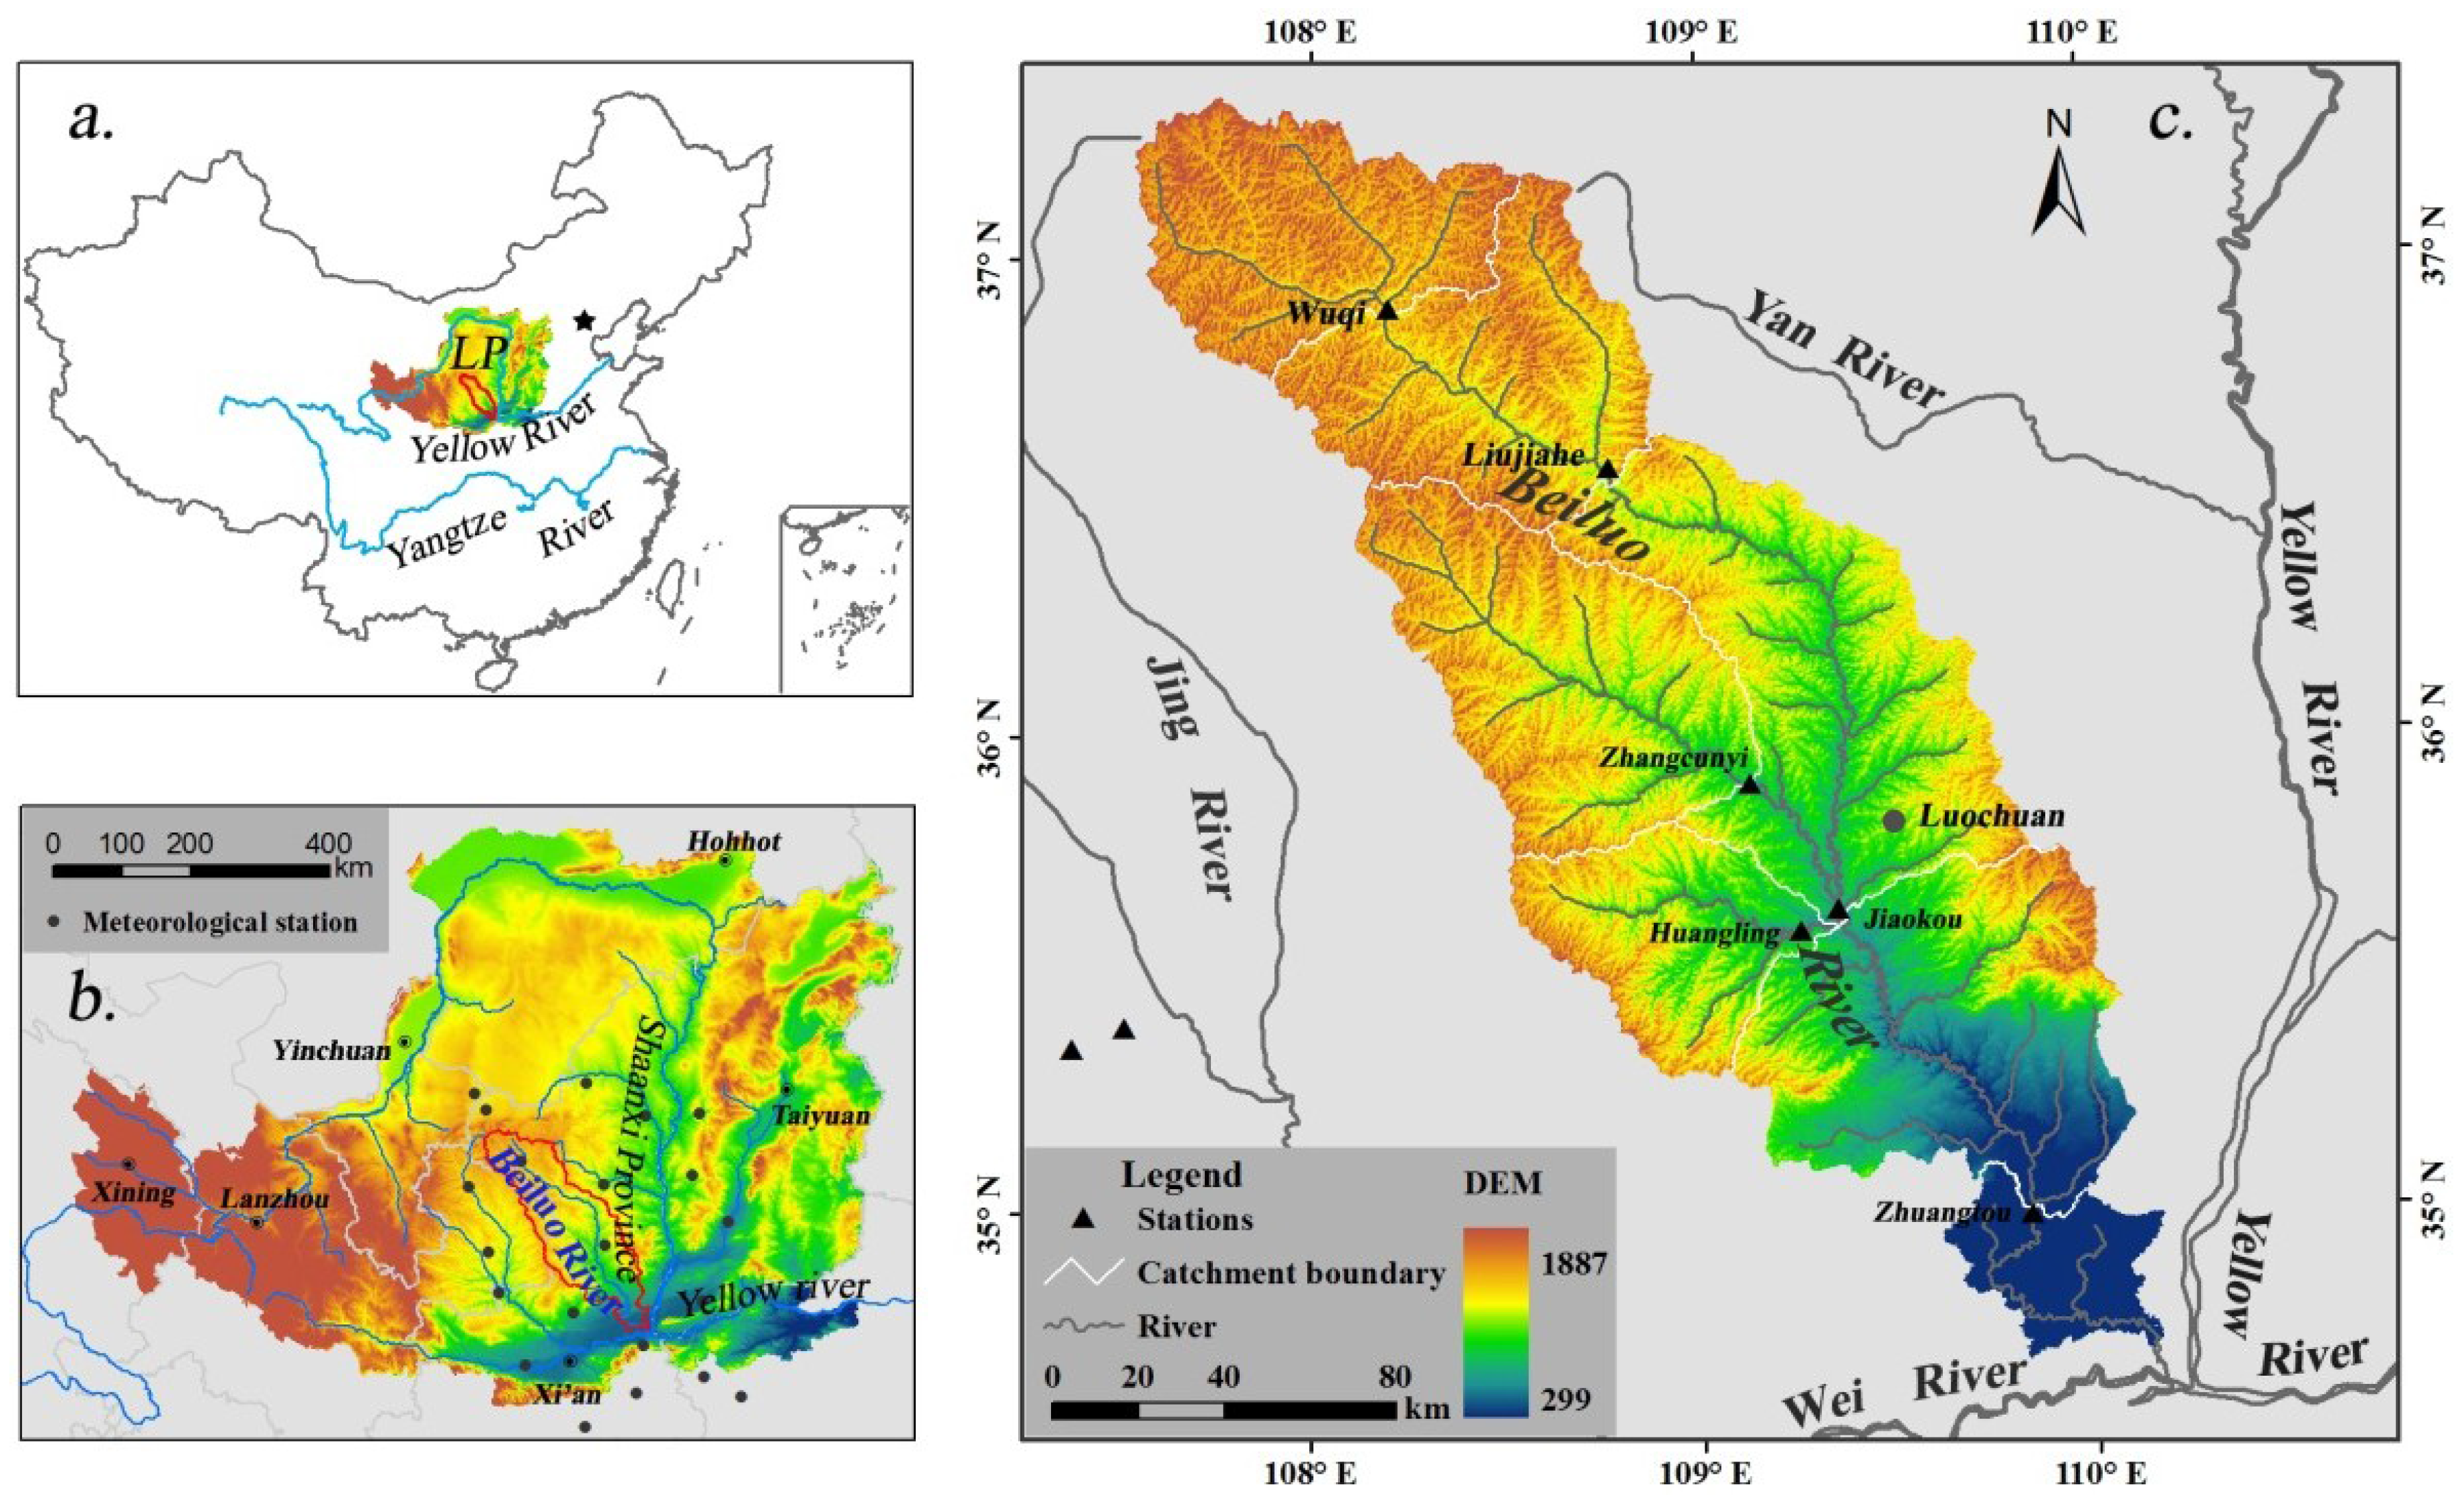
2.1. Study Site

The Beiluo River drains an area of 26,905 km2 and is 680 km long. It is a tributary of the Wei River and a secondary tributary of the Yellow River (Figure 1). The wind-deposited loess, which developed during the Quaternary Period, covers the study area with a thickness of 50–200 m. However, a portion of the sub-catchment above Wuqi is semiarid. Otherwise, the basin is mainly semi-humid, with a mean annual PET of 1690.1 mm, precipitation of 534.3 mm and runoff depth of 32.5 mm from 1958 to 2011 (Figure 2 and Table 2). The basin is one of the major coarse sediment source areas of the Yellow River. The mean annual streamflow and sediment yield of the river are 8.65 × 10⁸ m3 and 8.65 × 10⁷ t, respectively. Approximately 76.2% of the annual precipitation occurs during the wet season (between May and September), and 92.6% of the total sediment is transported by the top 5% of the daily sediment load (1958–2011). The mean annual streamflow and sediment yield above the Liujiahe station account for 26.8% and 91.1% of the total basin yield, respectively, with the area accounting for 27.2% of the entire basin [35]. The streamflow below Liujiahe and Zhangcunyi and above Zhuangtou accounts for 61.9% of the entire basin, and accounts for 52.2% of the area [35]. This indicates that the streamflow and sediment source areas are non-uniformly distributed in the basin, which is common in the Yellow River basin. Accordingly, the Beiluo River basin is a representative basin of the Yellow River.
Figure 1. (a) The location of the Beiluo River basin and the Loess Plateau in China; (b) map of the Loess Plateau in the middle reaches of the Yellow River basin; (c) map of the Beiluo River basin.
Forests 07 00006 g001
Figure 2. Annual precipitation, runoff, potential evapotranspiration (PET), and the area affected by soil conservation measures in the Beiluo River basin (Upper Zhuangtou station).
Forests 07 00006 g002
Table 2. Characteristics and streamflow records for all sub-catchments.
No.StationsArea (km2)Streamflow RecordsRunoff Ranges (×10−3 mm/d)Annual Average
Runoff (mm/a)Precipitation (mm/a)PET (mm/a)Vegetation Coverage (%)
1Wuqi34081963–20110.15~4183128.0415.31786.334.2
2Liujiahe73251959–20115.66~3019532.3446.51743.932.5
3Zhangcunyi47151958–20110.47~370123.0540.01640.465.9
4Huangling22661967–20110.31~892246.8563.71643.568.1
5Jiaokou171801958–20111.51~704125.9502.81693.547.7
6Zhuangtou256541958–20112.06~657732.5534.31690.144.7
Extreme precipitation events occasionally occur in the area, but they significantly impact the fragile Loess Plateau ecosystem. For instance, a 1000-year precipitation event was observed in Wuqi on 30 August 1994, when the six-hour precipitation reached 214 mm. A daily sediment concentration of 1060 kg·m−3 induced by the event was measured on 31 August 1994 at the Wuqi station. The streamflow/sediment yield was 2.41/25.6 times the mean annual streamflow/sediment load from 2002 to 2011. In addition, and the sediment load was equivalent to 9.6% of the total sediment yields from 1963 to 2011.
Both the integrated soil conservation project and “Grain for Green” project have been implemented on a massive scale in the basin. Generally, management actions such as afforestation on slopes have been implemented based on natural vegetation zones, while the elevations shown in Figure 1 were not seriously considered. Table 1 lists the basin area variations as a result of soil conservation measures, including terracing, afforestation, pasture re-establishment, and the sediment trapping dams. In addition to the soil conservation measures, a large amount of farmland has been abandoned and hillsides have been closed to eliminate grazing. The Zhangcunyi and Huangling basins drain into the only natural secondary forest on the Loess Plateau. They represent sub-catchments with few ecological management actions and minimal human activities.

2.2. Database

Streamflow data for six stations (Table 2) were obtained from the Water Resources Committee of the Yellow River Conservancy Commission. Annual streamflow data ware calculated from the daily data. The daily precipitation and Pan Evaporation (PET) data were observed in meteorological stations and obtained from the State Meteorology Bureau of China (http://cdc.nmic.cn/home.do). The annual precipitation and PET data were calculated based on the daily data. As shown in Figure 1, data from 20 meteorological stations were used to interpolate the annual precipitation and PET data using the kriging data interpolation technique in ArcGIS 9.3 [36]. The annual data from 1994 (Wuqi and Liujiahe stations) were eliminated from the trend analysis to avoid the influence of extreme precipitation events.

3. Methodology

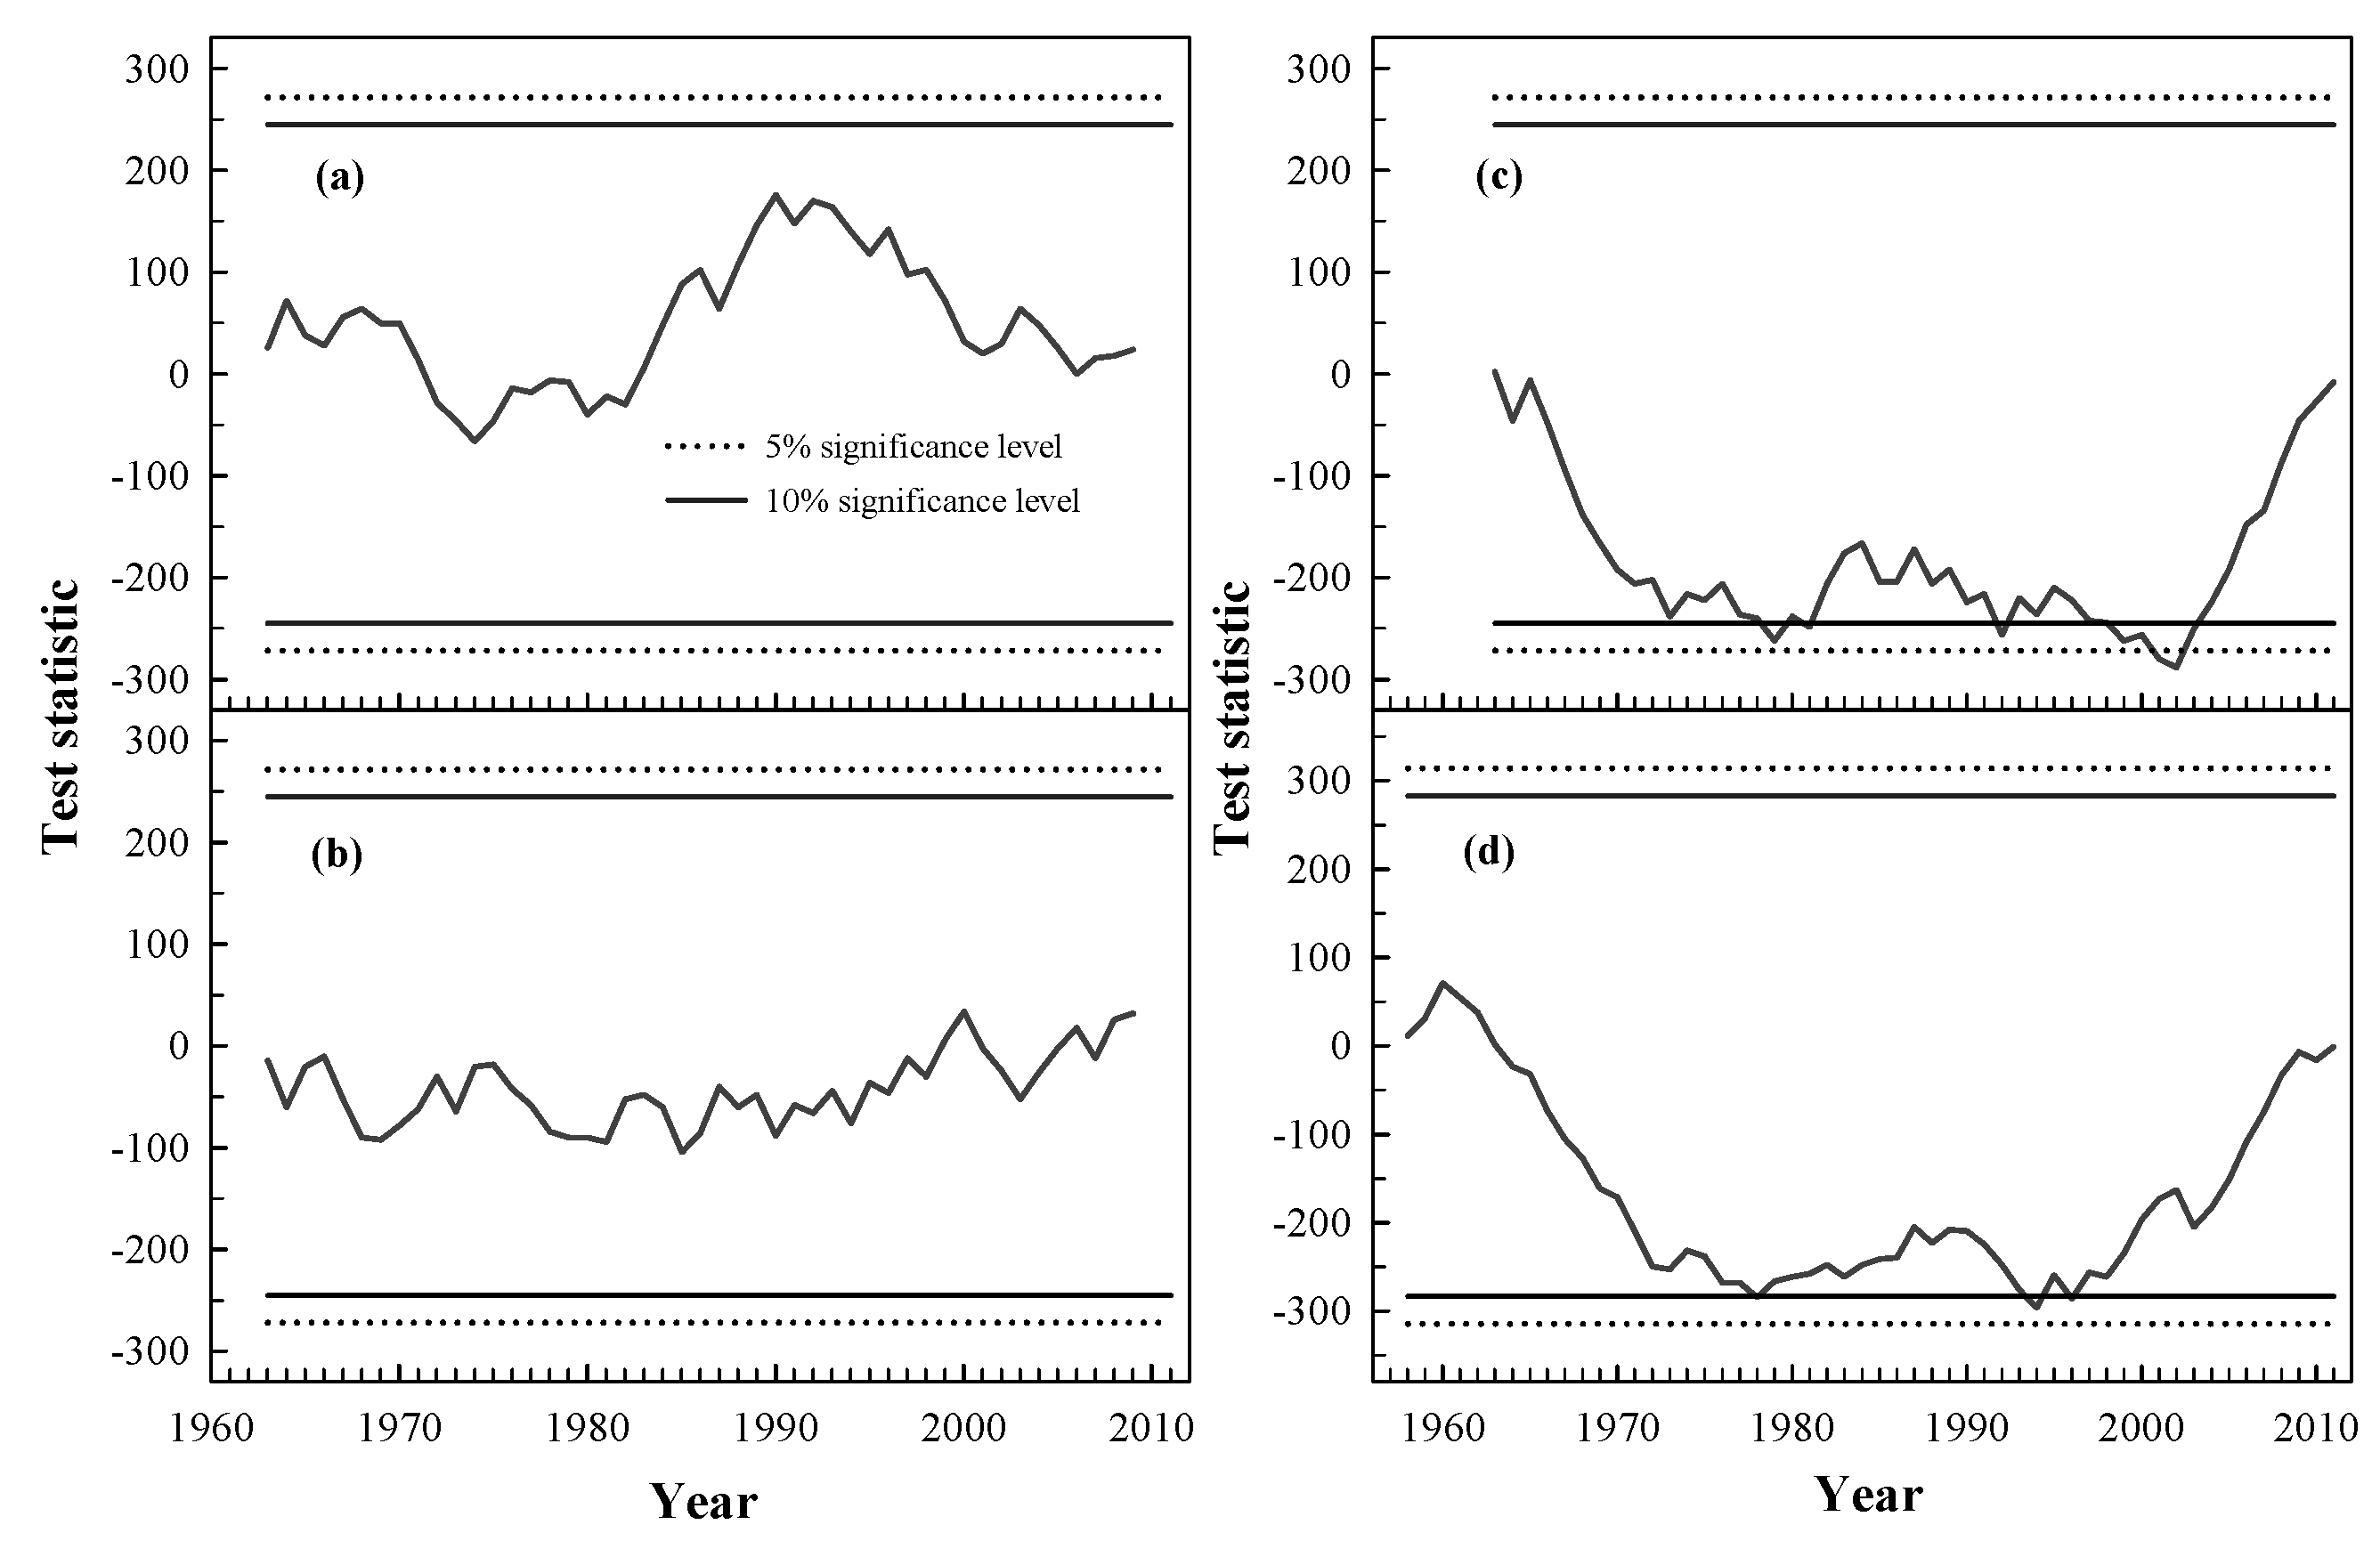
Trends and Change Point Analysis

The Mann–Kendall (MK) rank correlation coefficient [37,38] is commonly used to assess the significance of trends in hydro-meteorological time series and was implemented in this study. The Mann–Kendall test statistic (S) is given by
S = k = 1 n = 1 j = k + 1 n sgn ( x j x k ) , k < j < n
where
sgn ( x ) = { + 1 , x > 0 0 , x = 0 1 , x < 0
and n is the data set record length; xj and xk are the sequential data values. When S is positive, a positive trend is present, and vice versa. If no serial correlation is observed in the data, existing formulas can be used to assess the significance of the trend using standard Z score methods. However, the existence of a serial correlation alters the variance of MK statistic estimate [39,40]. Therefore, we have adopted the bootstrap-based procedure proposed by Yue and Pilon [41] to remove the serial correlation effect. The significance of S is assessed based on the bootstrap-based procedure MK test (BS-MK), which can be derived by randomly bootstrapping the sample data X. A bootstrapped sample, denoted by X*, {x1*, x2*, ..., xn*}, is obtained by n random samples times with replacements, with an equal probability of 1/n from the observed sample x1, x2, ..., xn. By bootstrapping X M times, M independent bootstrap samples X*1, X*2, ..., X*M can be obtained, each with sample size n. The S* for each of the bootstrapped samples is then estimated using Equation (1). By arranging {S1*, S2*, ..., Sn*} in ascending order, the bootstrap empirical cumulative distribution of the slope can be obtained. The p value of S is estimated as:
P = Pr [ S * S ] = m S M
where ms is the rank corresponding to the largest value when S*S.
The nonparametric median-based linear model method proposed by Sen [42] was used to fit trend slopes (β) to the data:
β = M e d i a n [ x j x k j k ]   for all   k   <   j ,
where 1 < k < j < n. β is the median of all possible pair combinations in the data set.
The nonparametric method developed by Pettitt [43] was applied to detect the change point using the Mann–Whitney statistic Ut,N. The Ut,N is used to verify if two samples x1,..., xt and xt +1,..., xN are from the same population. The test statistic Ut,N is given by
U t 1 , N = U t 1 , N + j = 1 N sgn ( x t x j )   for   t   =   2 , ,   n ,
where sgn(θ) = 1 if θ > 0, sgn(θ) = 0 if θ = 0 and sgn(θ)= −1 if θ <0.
The test statistic counts the number of times a member of the first sample exceeds a member of the second sample. The null hypothesis of Pettitt’s test is the absence of a changing point. The statistic K(t) and the associated probabilities used in the significance testing are given as
K ( t ) = max 1 t < N | U t , N |
p 2 exp { 6 k n 2 / ( N 3 + N 2 ) }
where kn is numerical value for K(t) (K+ or K) and N is the observed sample.
The trends were determined by applying the BS-MK and Sen tests to the annual and daily series of streamflow series. Incremental percentiles on an annual basis were used to obtain data series [44]. The observed data from each year were sorted in descending order. Then, data from each year within the same exceedance percentile were selected for a daily percentile series. The obtained daily series were sorted by year. The daily series were normalized before applying the BS-MK test and Sen’s slope estimation to compare the rates of change of series in various percentiles via:
X i = ( X i X min ) / ( X max X min ) 100

4. Results

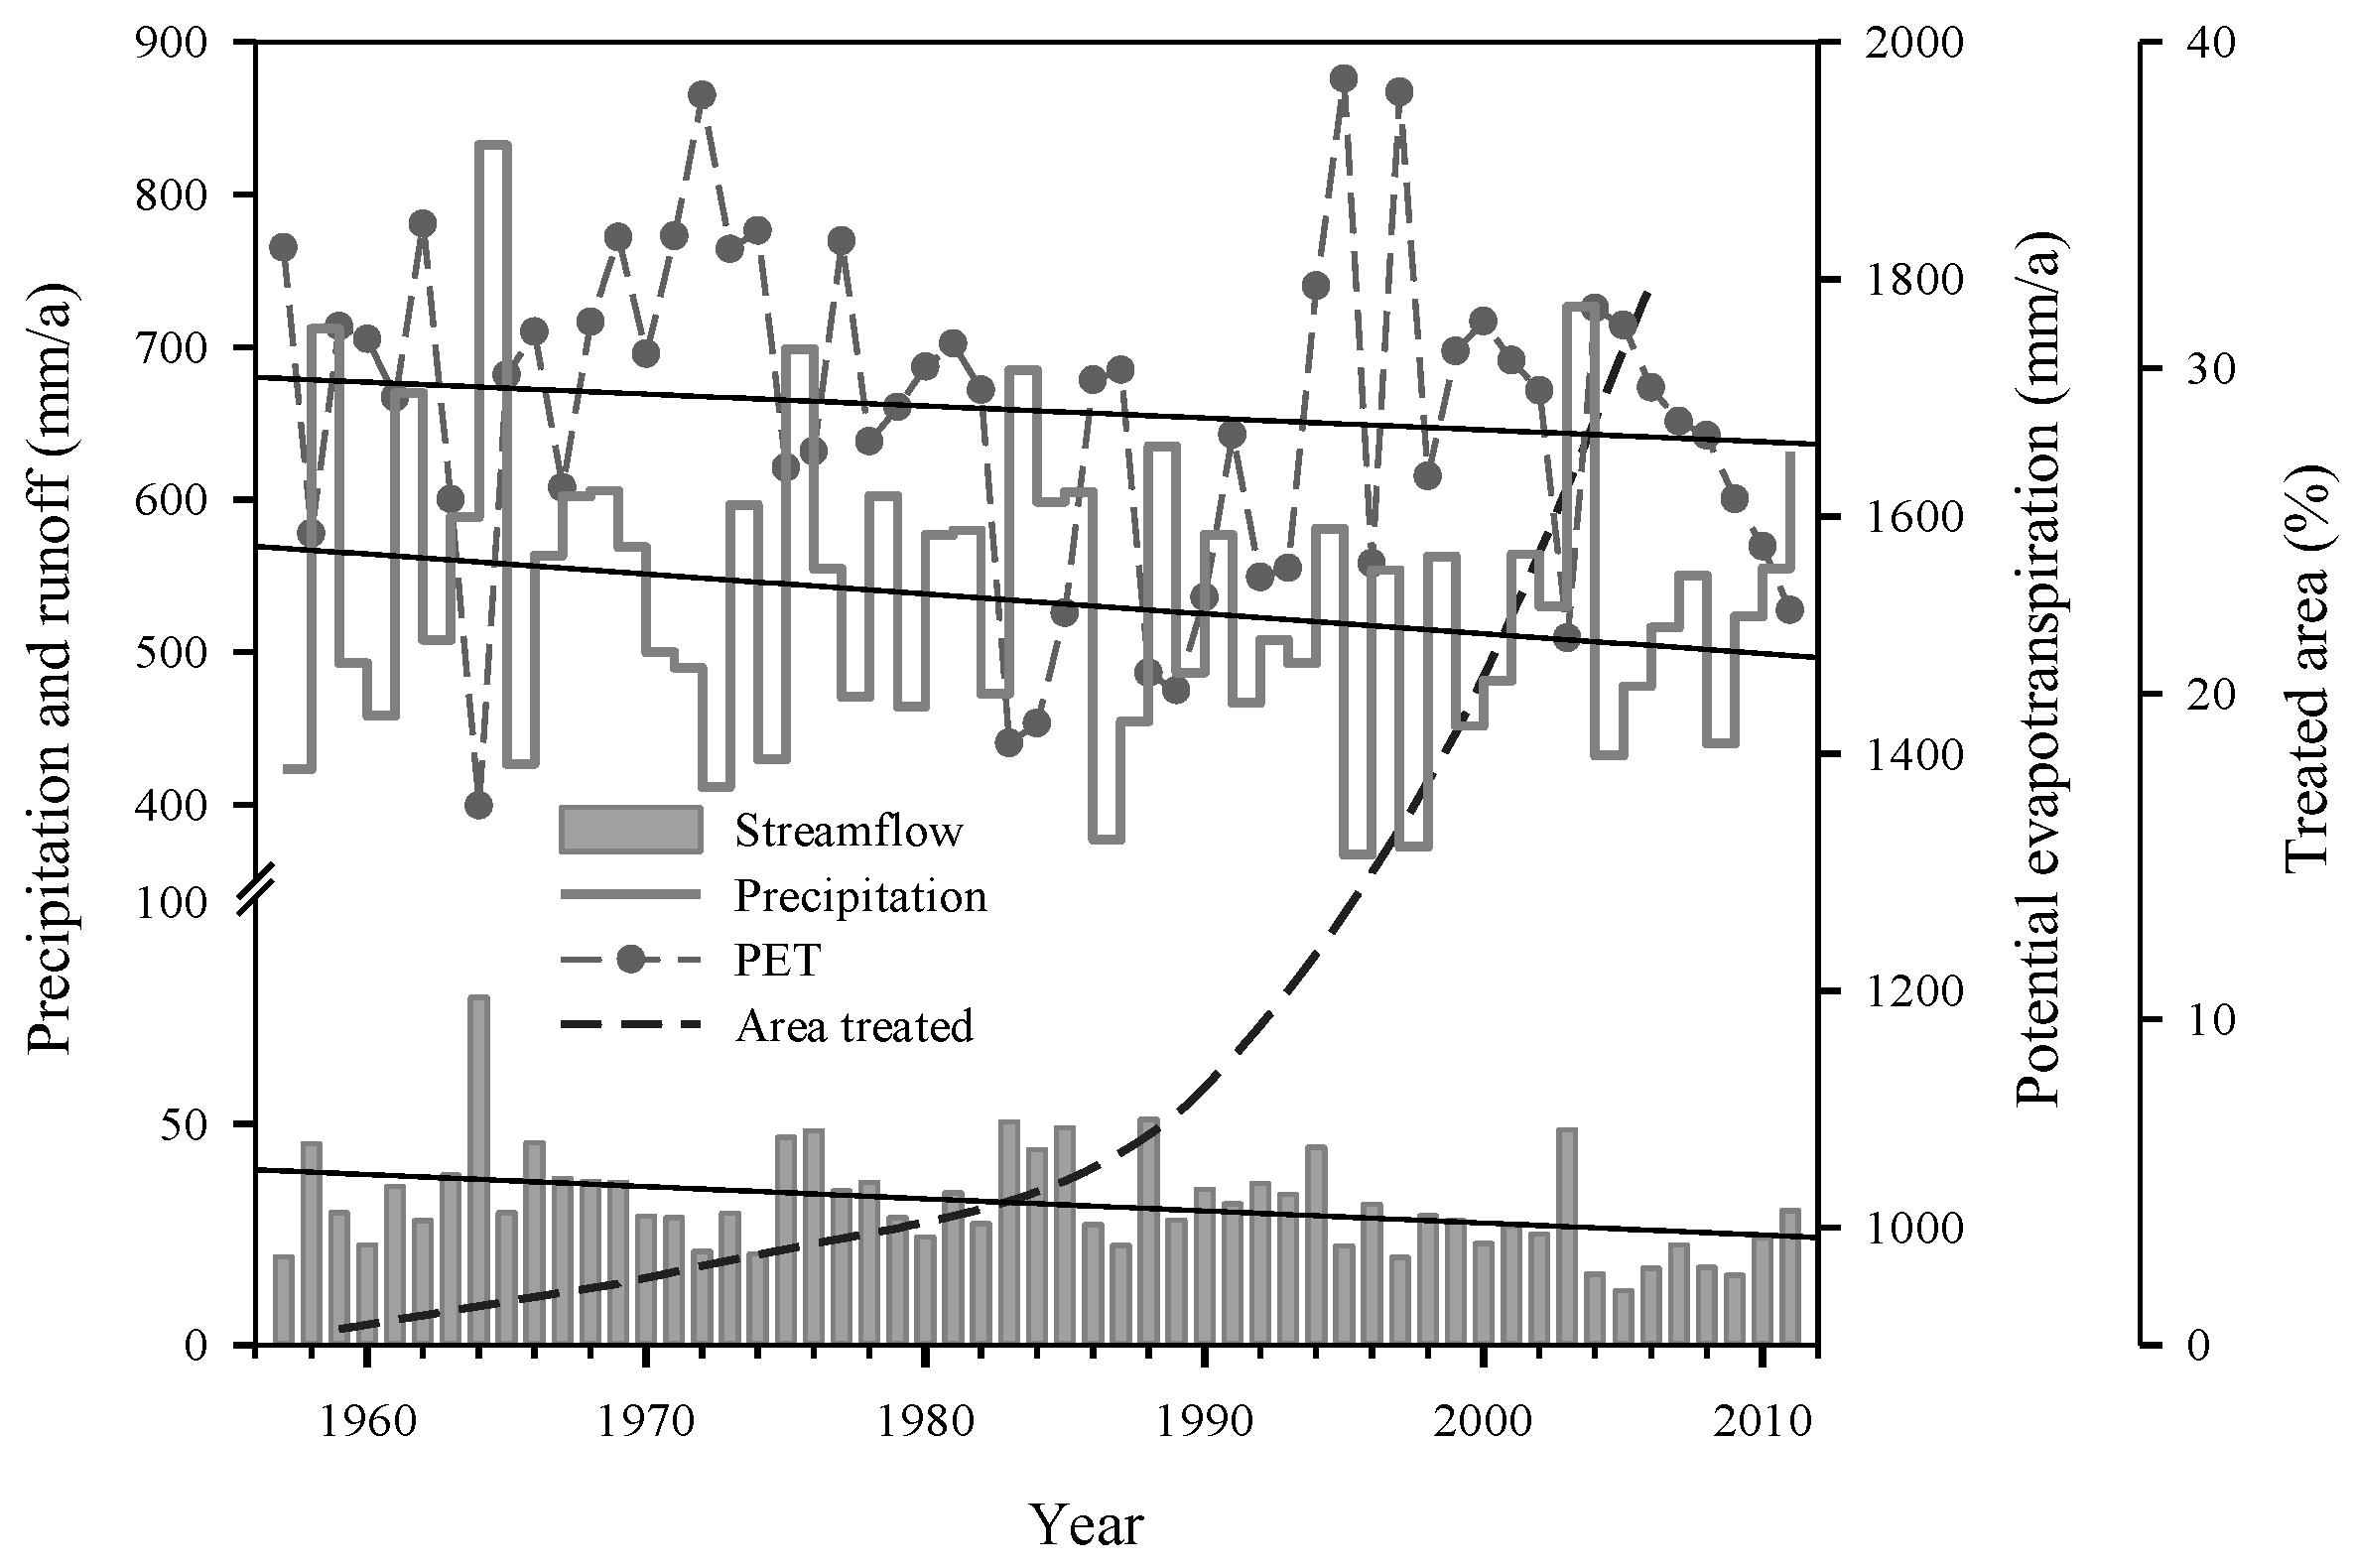
4.1. Temporal Trends in Annual Streamflow, Precipitation, and PET

The Mann–Kendall trend test identified negative annual streamflow trends at five out of six stations, with the rate varying from −0.15 to −0.30 mm·a−1. Streamflow changes at the Wuqi, Jiaokou, and Zhuangtou stations exhibited negative trends at a statistically significant level of 0.01 (Table 3). The streamflow decrease at the Zhangcunyi station was significant (p < 0.05), whereas the decrease at the Huangling station was insignificant. The rate of streamflow reduction varied among stations. However, the streamflow change rate (Table 3) divided by the mean annual streamflow (Table 2) in the forestry area (Zhangcunyi and Huangling stations) is lower than other stations. The annual precipitation and PET trends were detected to understand the nature of streamflow changes. As shown in Table 3, significantly negetive annual precipitation trends were identified in three sub-catchments (Zhangcunyi, Jiaokou, and Zhuangtou). No significant annual PET trends were identified in any sub-catchment.

4.2. Precipitation, PET, and Streamflow Variation over Time

The water balance in a catchment involves precipitation, evapotranspiration, and streamflow. The streamflow stablity depends on a stable climate system. To fully understand the nature of streamflow changes, it is necessary to determine precipitation regime variations. The means and standard deviations of annual streamflow, precipitation, and PET from each station in three periods were analyzed. Per Table 4, the t-tests and F tests showed that the mean and the standard deviation of the annual precipitation exhibited insignificant changes in all sub-catchments. The annual PET results suggest that the mean annual PET decreased during PII in four sub-catchments. However, the mean annual PET in PIII was identified to be indifferent from PI.
By contrast, both the mean and the standard deviation of the annual streamflow significantly decreased over the three periods. Moreover, the coefficient of variation (CV) of annual streamflow exhibited a reduction at all stations (Table 4), which was consistent with the expected ecological management effect. A reduced CV indicates that streamflow became less variable, while an increased CV indicates that the proportional reduction in the mean is lower than the reduction in the standard deviation.
Annual streamflow values in all sub-catchments have continuously decreased in recent decades, as shown in Table 4 and Table 5. Compared to the streamflow in the forestry area (Huangling and Zhangcunyi stations), incremental annual streamflow reductions were observed at the other four stations. These differences are related to minimal ecological management in the forestry area versus intensive ecological management actions in other catchments (Table 1). In addition, the vegetation in the forestry area helps to stabilize the streamflow, making it less sensitive to climate variability and ecological management. In addition, ecological management area increases (Table 1 and Figure 2) and precipitation decreases (Table 3) led to higher streamflow reductions during PIII.
The Pettitt’s test at the Wuqi station is shown in Figure 3. No change points for annual precipitation and PET were identified in Wuqi sub-catchment. The annual streamflow curve indicates that the ecological management effects that occurred during the two study periods are well documented in the annual streamflow variation. The change point, e.g., the maximum of the curve, was detected in 2002. Moreover, the integrated soil conservation resulted in a relative maximum in 1979 (Figure 3), which was also determined to be statistically significant. The annual streamflow at Wuqi was divided into three periods, including the baseline period (PI), integrated soil conservation period (PII), and “Grain for Green” period (PIII). The same division process was applied to data from the other stations, such as Zhangcunyi in Figure 3d. In addition, the most likely points-in-time at Huangling station were also selected for comparison.
Table 3. Summary of annual streamflow, precipitation, and PET trends in each sub-catchment from the 1950s to 2011.
StationsAnnual StreamflowAnnual PrecipitationAnnual PET
lag 1BS-MKSenChange Pointlag 1BS-MK TestSenlag 1BS-MKSen
Corr.SSig.β (mm/a)YearCorr.SSig.β (mm/a)Corr.SSig.β (mm/a)
Wuqi−0.06−0.339**−0.3019792002−0.14−0.101ns−1.010.15−0.067ns0.79
Liujiahe−0.10−0.264*−0.2419791999−0.18−0.129ns−1.570.24−0.090ns−1.23
Zhangcunyi0.18−0.275*−0.1519781994−0.23−0.172*−1.660.27−0.027ns−0.36
Huangling0.14−0.152ns−0.2719841994−0.20−0.087ns−1.020.31−0.070ns−1.14
Jiaokou0.01−0.323**−0.2119791994−0.22−0.166*−1.630.24−0.077ns−1.26
Zhuangtou0.15−0.323**−0.2619781994−0.26−0.166*−1.370.24−0.072ns−1.24
Note: ** and * indicate significance levels of 0.01 and 0.05; ns indicates that the significance level exceeds 0.05.
Table 4. Summary of the annual streamflow, precipitation, and PET statistics.
ObjectsStationsPIPIIPIII
Mean (mm)SD (mm)CVMean (mm)S.D. (mm)CVMean (mm)SD (mm)CV
RunoffWuqi32.47 A12.80 a0.3925.49 B7.99 b0.3116.15 C3.12 c0.19
Liujiahe37.21 A11.29 a0.3031.94 A8.28 a0.2622.65 B4.86 c0.21
Zhangcunyi26.98 A11.98 a0.4425.42 A7.07 a0.2820.15 B3.86 b0.24
Huangling50.95 A33.38 a0.6248.64 A23.33 a0.5143.02 B9.98 b0.31
Jiaokou29.35 A10.84 a0.3727.76 A7.94 a0.2920.66 B4.47 b0.22
Zhuangtou36.33 A12.62 a0.3535.64 A9.47 a0.2823.78 B4.92 b0.25
PrecipitationWuqi436.4108.70.25408.884.50.21385.374.70.19
Liujiahe472.6109.80.23429.982.00.19429.480.60.19
Zhangcunyi573.2112.70.20537.387.60.16524.494.80.19
Huangling584.2101.20.17555.787.50.16546.8109.10.20
Jiaokou525.7110.90.21501.481.20.16494.383.10.18
Zhuangtou552.1105.10.19517.390.90.18524.383.60.16
PETWuqi1783.4145.90.081789.2153.50.091783.694.90.05
Liujiahe1778.9141.40.081705.5163.80.101754.592.30.05
Zhangcunyi1679.9 A135.70.081550.6 B144.2 a0.091686.6 A136.7 a0.08
Huangling1661.3 AB151.7 a0.091546.3 B134.7 b0.091686.9 A136.7 b0.08
Jiaokou1733.2 A125.6 b0.071606.5 B130.4 a0.081728.0 A129.8 a0.08
Zhuangtou1730.9 A121.1 a0.071638.2 B164.0 a0.101690.8 A84.1 b0.05
Note: Different capital letters (“A,” “B,” and “C”) indicate significantly different mean annual streamflow values over three periods at p < 0.05, while small letters (“a,” “b,” and “c”) represent standard deviations.
Figure 3. Pettitt’s statistical significance, which was used for detecting change points for (a) annual PET; (b) annual precipitation; and (c) annual streamflow at Wuqi station; and (d) annual streamflow at Zhangcunyi station.
Forests 07 00006 g003

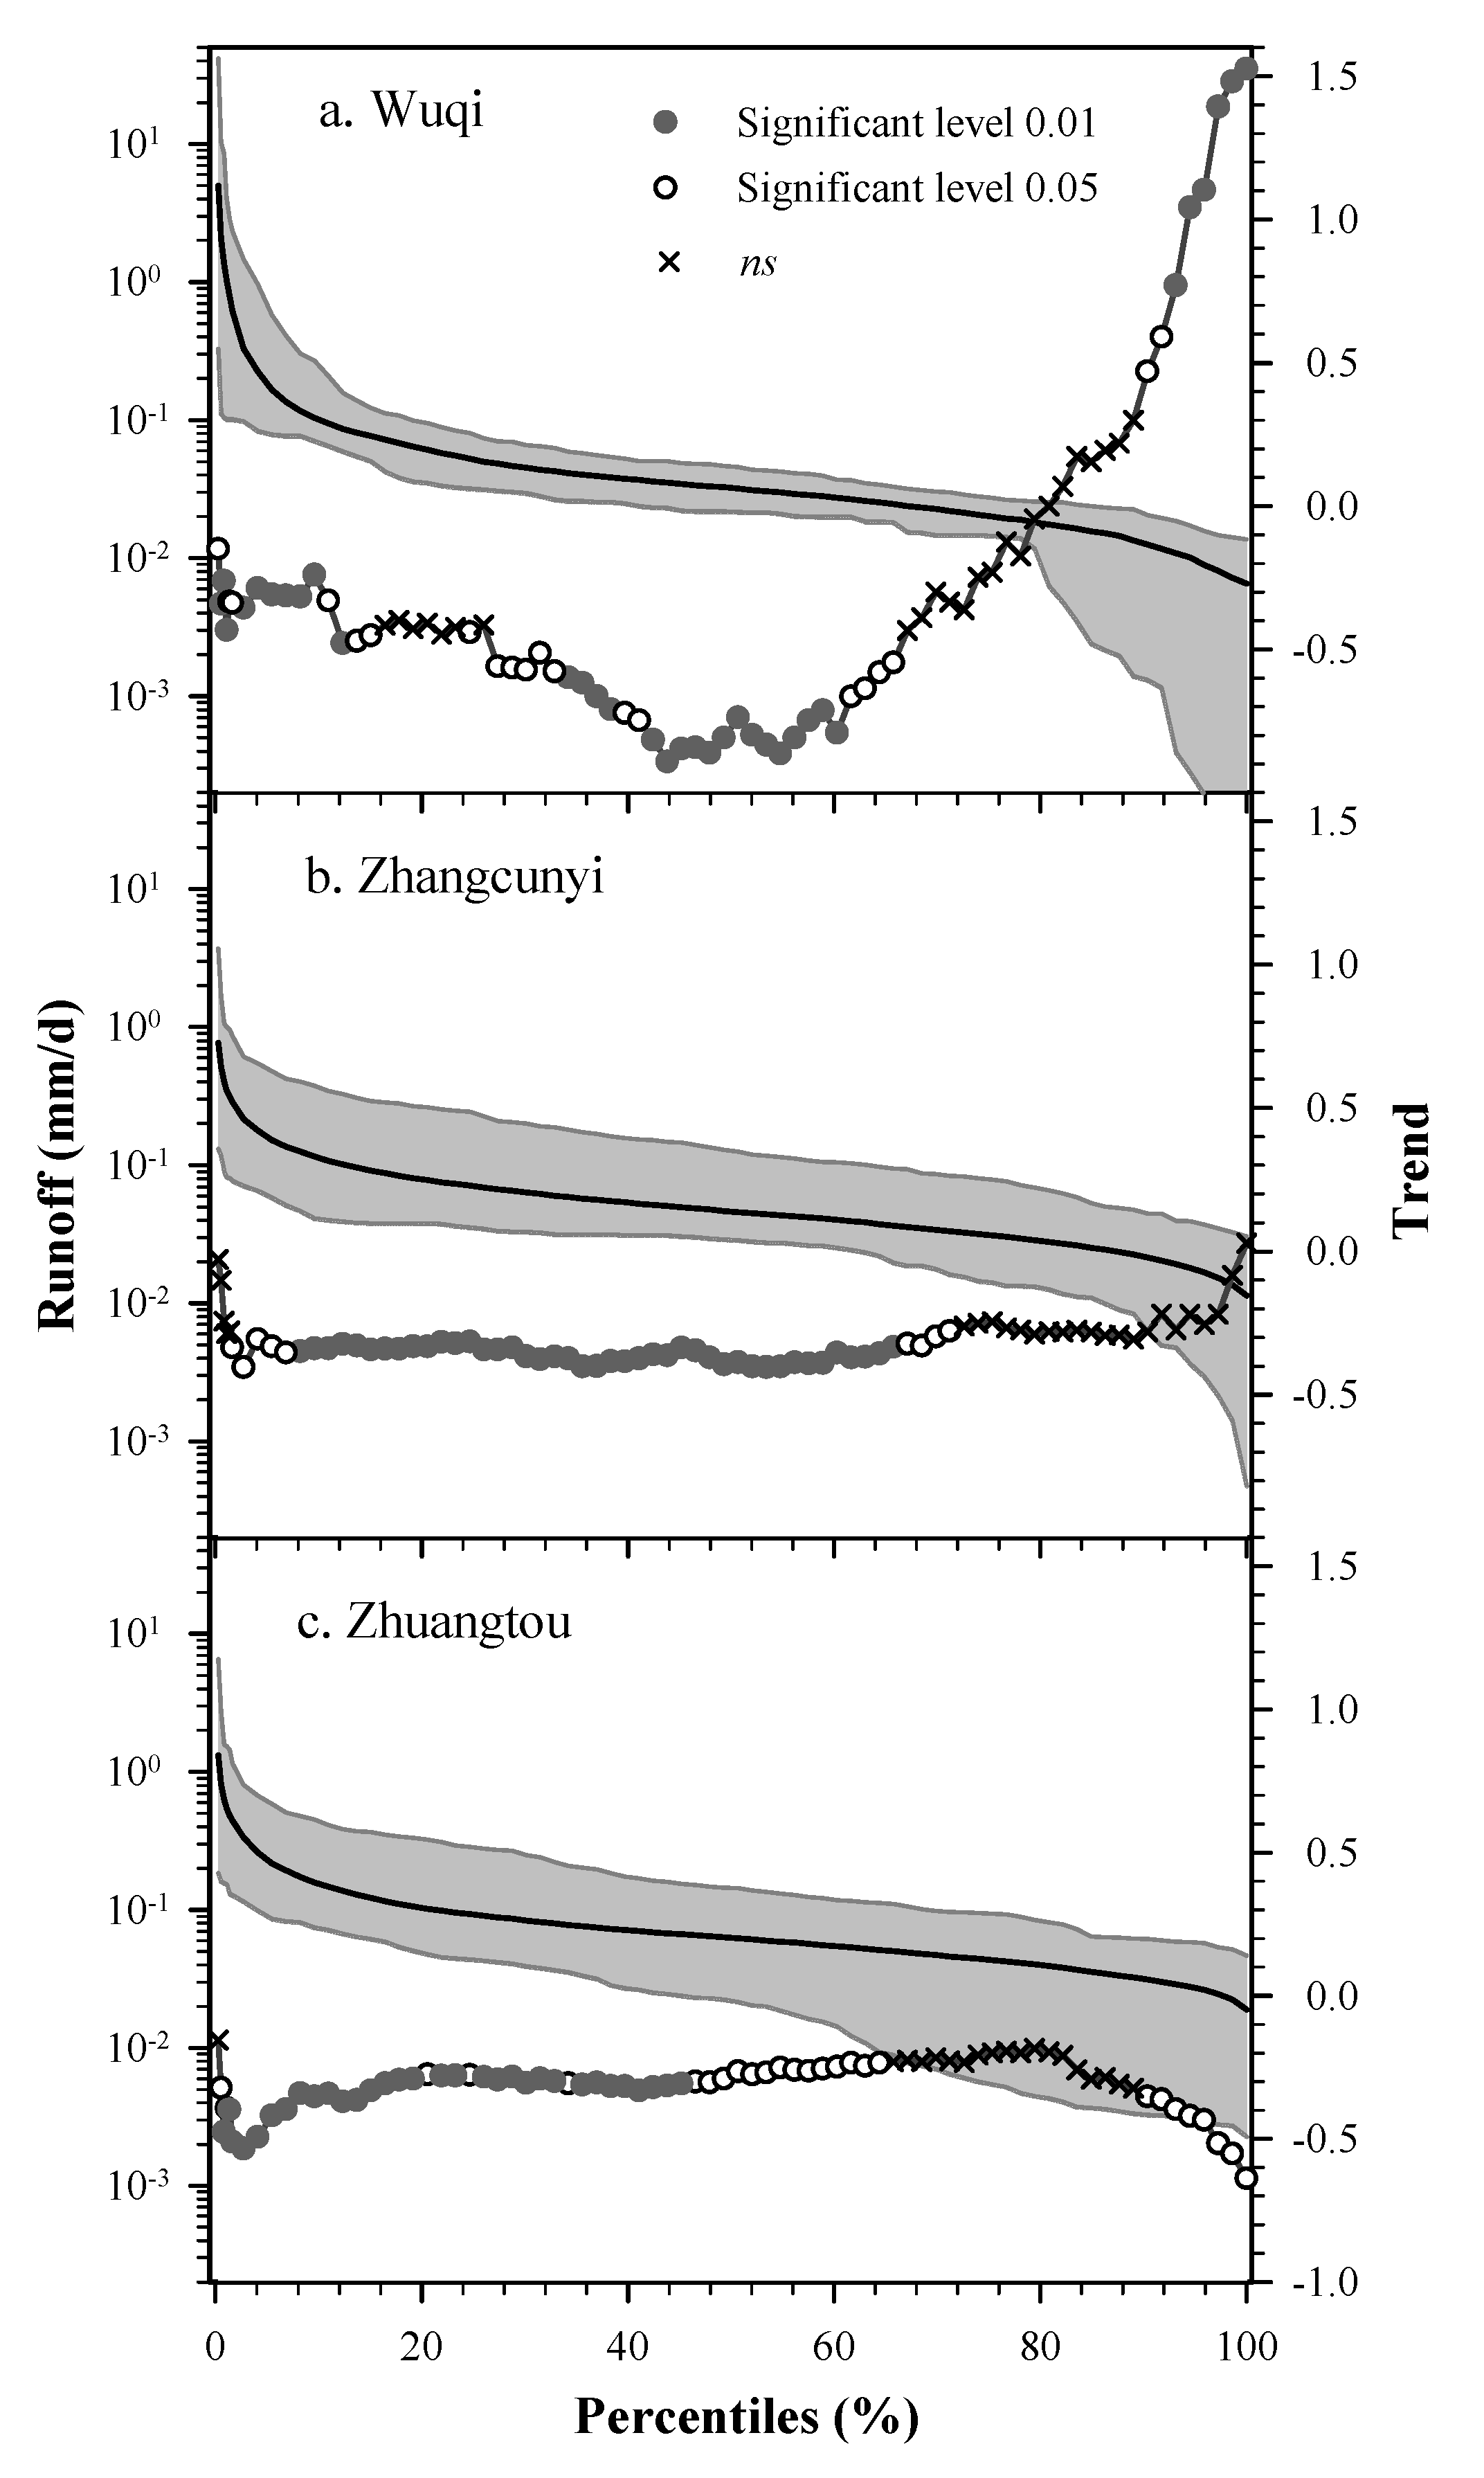
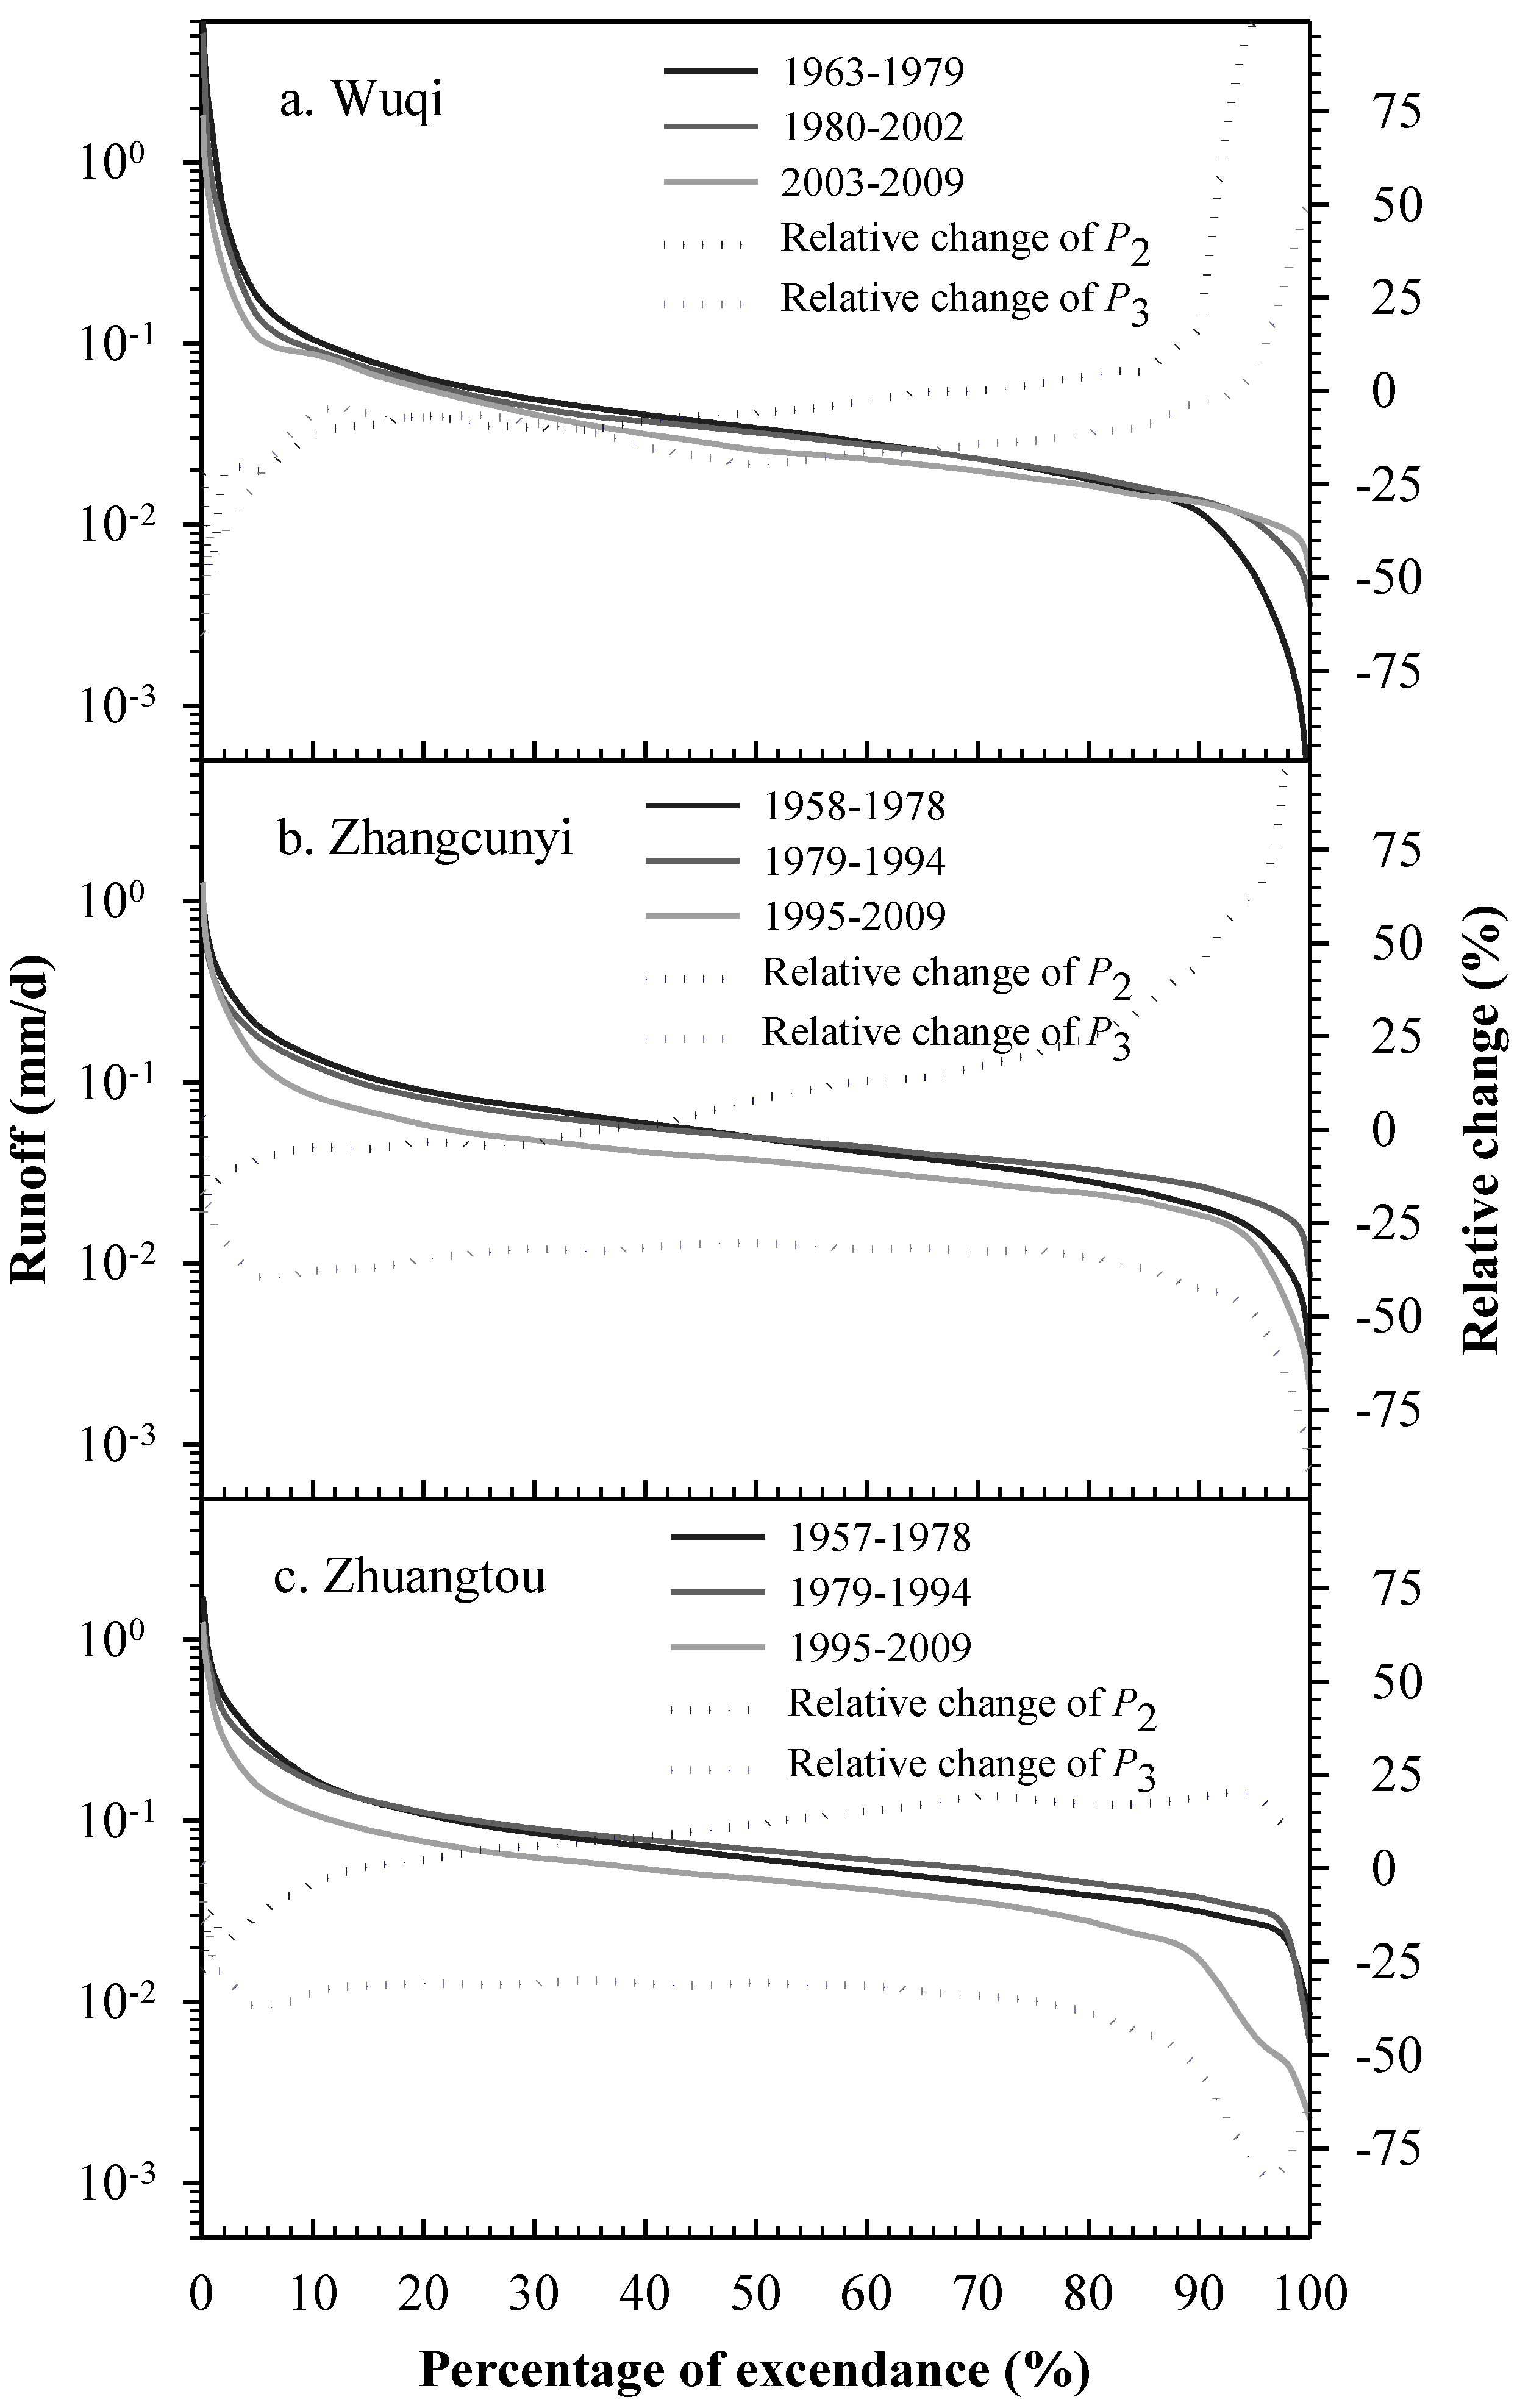
4.3. Daily Streamflow Regime and Changes

Daily streamflow series were obtained to compare trends in various magnitudes streamflow. These series were normalized using Equation (7) before trend detection. The trends and statistical significance levels were determined using the BS-MK and Sen tests, as shown in Figure 4. For the Wuqi basin (Figure 4a), the high extreme flow series trends (e.g., the annual maximum flow series) are lower than the median flow series. This indicates that high extreme flows, which are induced by extreme precipitation events, are more difficult to effectively moderate. As shown in Figure 4a,b, the daily series trends for the majority of percentiles in Wuqi are higher than those in Zhangcunyi. As noted in Section 2, the forestry area is less influenced by ecological management, implying that larger streamflow variations occurred in response to more intensive ecological management. The gray strip in Figure 4 represents the daily streamflow variation over the past six decades. The dynamic daily streamflow range in Wuqi is an order of magnitude larger than that in Zhangcunyi (Figure 4a,b), which is similar in area and landform, but located in the forestry area. Moreover, the dynamic daily streamflow range in Zhangcunyi is equivalent to that in the entire basin (Zhuangtou) (Figure 4b,c), implying that a much more stable daily streamflow can be achieved in highly vegetated areas.
Flow duration curves help to put the daily streamflow variation magnitudes into perspective, as shown in Figure 5. The relative streamflow change is calculated by (QafterQbefore)/Qbefore. Given the mixed nature of both climate variability and human activities, the streamflow variations shown in the flow duration curves likely reflect combined effects. As shown in Figure 5, the relative change curves indicate that daily streamflow sharply decreased at three stations for percentiles <5% (time exceedance) during PII. Relative streamflow changes in the percentile interval from 5% to 70% were generally stable with values between −15% and 15%. However, the relative change curves sharply increased for the >75% percentile. As shown in Table 5 and Figure 5, the streamflow decreased during PIII for all percentiles at four stations. In addition to high and median flow decreases, the low flows continuously increased in Wuqi and Liujiahe stations in PIII. Overall, as shown in Figure 5 and Table 5, high flow (5%) decreased in both PII and PIII; median flow (50%) slightly increased in PII and then slightly decreased in PIII in all sub-catchments. Low flow (95%) highly increased in PII, and then decreased in PIII in four sub-catchments.
Figure 4. Trends, statistically significant levels, and ranges of daily streamflow series over the past six decades at the (a) Wuqi; (b) Zhangcunyi; and (c) Zhuangtou stations. The solid line represents the means of all daily streamflow series, the upper boundary of the gray strip represents the maximum of all daily series, and the lower boundary represents the minimum of all daily series.
Forests 07 00006 g004

Table 5. Mean annual runoff variation (∆Qt°t) and relative high (Q5), median (Q50), and low flow (Q95) changes during for the PII and PIII.
StationsPIIPIII
∆Qt°t (mm)∆Q5 (%)∆Q50 (%)∆Q95 (%)∆Qt°t (mm)∆Q5 (%)∆Q50 (%)∆Q95 (%)
Wuqi−7.0−21.5−5.899.0−16.3−23.6−19.75.6
Liujiahe−5.3−7.110.942.5−14.6−28.8−16.611.9
Zhangcunyi−1.6−11.53.240.5−6.8−34.0−27.0−48.1
Huangling−2.3−30.91.061.6−7.9−29.8−13.8−17.8
Jiaokou−2.5−17.510.230.5−9.3−24.7−23.0−15.7
Zhuangtou−3.1−12.711.919.5−13.0−37.4−30.7−80.1
Figure 5. Comparison of daily flow duration curves over three periods at the (a) Wuqi; (b) Zhangcunyi; and (c) Zhuangtou stations.
Forests 07 00006 g005
Note that low flow increased at the Wuqi and Liujiahe stations during the two ecological management periods (Figure 5a and Table 5). This increase is likely due to continuous ecological management. The vegetation in the sub-catchments above the two stations is dominated by grass and shrubs. Wuqi County (3791.5 km2, Figure 1) converted 1578.6 km2 of cultivated land to grassland/forestry in 1999, representing the largest cultivated land conversion in China. In addition, Wuqi County exhibits a high revegetation rate [19]. The continuously increasing low flow implies that streamflow regime could be moderated via the appropriate management options, even in semiarid areas.
Moreover, we detected the daily precipitation regime in Wuqi and Luochuan stations using erosive rainfall (≥10 mm) data. Generally, daily erosive rainfall is defined as rainfall that can generate surface runoff and produce erosion [45]. The Gumbel and Weibull distribution parameters of erosive rainfall data during PI were estimated using L-moments [46]. A Goodness-of-fit test (Kolmogorov–Smirnov test) showed that the daily precipitation data in three periods provided an excellent fit to the parameters of the two distribution functions (p > 0.95). This indicates that the precipitation regime (probability distribution) has not changed, which implies that the water yield capacity of rainfall event has not changed. We have also collected the data for mean daily non-erosive precipitation (<10 mm/day) and the corresponding wet days in each year. The t-test showed that the mean non-erosive precipitation was statistically insignificant over three periods, whereas a significant decrease of wet days between PI and PIII was identified. This result indicates that the increase of low flow was not owing to precipitation variation.

5. Discussion

5.1. Processes of Streamflow Reduction between Ecological Management Periods

In this study, the streamflow decreased as the ecological management area increased (Table 1 and Figure 2). This result is supported by Wang and Hejazi [3], who noted that the effect of regional human activities is somewhat heterogeneous owing to different extent. Zhu et al. [47] investigated the effect of community functional composition on soil and water conservation in a revegetation area on the Loess Plateau. They indicated that the management strategies led to large areas of mono-specific vegetation, and streamflow had not been substantially decreased by revegetation during the soil conservation period. Sediment trapping dams across eroding gullies and smaller tributaries have been used to control streamflow and sediment yields on the Loess Plateau [7]. These dams impede the flow of water and induce sediment deposition [7,11,14]. During the “Grain for Green” period, the community functional diversity was incorporated into the ecological management design, and streamflow and soil were efficiently conserved [47]. Annual and daily streamflow variations suggest that two corresponding regulation phases exist during the two ecological management periods:

Phase 1: by Impeding Floods 

Independent of annual precipitation regime variations, the daily streamflow significantly decreased in multiple percentiles (Figure 4). Revegetation was not dense enough and the revegetated area (Table 1) was not large enough to decrease the streamflow during PII. As noted by Zhu et al. [47], the streamflow was not substantially moderated by mono-specific revegetation during this period. However, engineering projects prohibited or delayed the streamflow during PII [7], thus decreasing high flows. Engineering projects also increased the median and low flow ((Table 5) and Figure 5) by depositing the suspended sediments and releasing water [20,21,22]. Therefore, the streamflow was effectively moderated by sediment-trapping dams. As a result, the annual streamflow slightly decreased during PII.

Phase 2: by Reducing Streamflow Effectively 

Sediment-trapping dams lose their effectiveness over time if proper maintenance is not performed [20,22,23]. It was reported that more than 100,000 sediment-trapping dams were built on the Loess Plateau in the late 1960s and 1970s [47]. However, a survey in the northern Shaanxi province (shown in Figure 1b) noted that more than 80% of the sediment-trapping dams were destroyed by intensive storms in the early 1980s [14,20]. Thus, the effects of engineering projects were significantly diminished during PIII. However, the implementation of the “Grain for Green” project increased the ecological management area by >30% of the entire basin in 2006 (Table 1). Moreover, the community functional diversity increased over 30 years of vegetation succession and significantly reduced streamflow and sediment yields [47]. Vegetation management effects become significant over time [10]. The surface runoff decreased as in situ water infiltration increased [24,25]. Moreover, increasing the rainfall interception and evapotranspiration led to streamflow decreases. As a result, incremental streamflow reductions were observed in PIII compared to PII (Table 5). Thus, the streamflow was efficiently reduced by revegetation during PIII. This result is supported by Zeng and Ma [48] and Cai [29], who illustrated that artificial vegetation will only reduce streamflow reduction if the accumulated vegetation coverage exceeded a critical value of approximately 20%.

5.2. Can Streamflow Be Successfully Moderated?

Compared with that the Wuqi and Liujiahe stations, the hydrological regime in the secondary forestry area (Zhangcunyi and Huangling stations) exhibits a daily streamflow regime that is more stable (Figure 4) and less in soil erosion (below the soil-loss tolerance). This scenario represents the theoretical basis for ecological management on the Loess Plateau, i.e., to produce an ideal streamflow regime by reducing high flows and increasing low flows, thus reducing the potential for flood hazards and properly allocating water resources [14,17,18]. The incremental annual streamflow reductions in the four non-forest sub-catchments imply that streamflow reduction magnitudes would be lower if no ecological management had been implemented on the vast Loess Plateau in the past decades.
A comparison between Zhangcunyi (forestry area) and Wuqi high flow variations indicates that high flow can be moderated. Streamflow at the Wuqi and Liujiahe stations were moderated by decreasing high flows and increasing low flows, indicating that streamflow can be moderated by appropriate ecological management actions. Streamflow can be moderated into the future via the continuous optimization of ecological management, such as incorporating community functional diversity into ecological management design.

6. Conclusions

The continuous ecological management of the Loess Plateau has involved two strategies: the integrated soil conservation project that began in the 1970s, and the “Grain for Green” project that began in the 1990s. This study investigated the streamflow variations in response to the two ecological management projects by selecting six sub-catchments nested in a representative basin, the Beiluo River basin. Data from the 1950s to 2011 were analyzed, and statistically significant negative annual streamflow trends were identified in five out of six sub-catchments over the past 60 years, with the rates varying from −0.15 to −0.30 mm·a−1.
The streamflow regime variations differ between the two ecological management periods. The annual streamflow was reduced by decreasing high flows, whereas low flow increases were observed in all sub-catchments during PII. Conversely, the annual streamflow decreased due to daily streamflow decreases at four stations during PIII. In addition to high and median flow decreases, the low flows continuously increased in Wuqi and Liujiahe stations in PIII. Compared with streamflow changes in the forestry area, incremental annual streamflow reductions were observed in other sub-catchments, which are mainly due to ecological management. These results imply that the streamflow regime can be moderated using appropriate management actions, even in semiarid areas. Moreover, streamflow in the forestry area is more stable, indicating that a stable streamflow regime can be achieved in areas with well-preserved vegetation. In conclusion, ecological management strategies can successfully achieve streamflow moderations.

Acknowledgments

This study was supported by the National Natural Science Foundation of China (Grant No. 41440012, 41230852, and 41101265), and the Knowledge Innovation Program of the Chinese Academy of Sciences (KZZD-EW-04-03-03; KZCX2-XB3-13). The authors thank the two anonymous reviewers for their constructive comments.

Author Contributions

Xiaoping Zhang and Jianjun Zhang conceived and designed the experiments; Jianjun Zhang, Tingting Zhang, and Yongnan Lei performed the data collecting; Jianjun Zhang, Xiaoping Zhang and Rui Li analyzed the data; Xiaoping Zhang and Rui Li contributed reagents/materials/analysis tools; Jianjun Zhang wrote the manuscript.

Conflicts of Interest

The authors declare no conflict of interest.

References

  1. Milly, P.C.; Dunne, K.A.; Vecchia, A.V. Global pattern of trends in streamflow and water availability in a changing climate. Nature 2005, 438, 347–350. [Google Scholar] [PubMed]
  2. Oki, T.; Kanae, S. Global hydrological cycles and world water resources. Science 2006, 313, 1068–1072. [Google Scholar] [CrossRef] [PubMed]
  3. Wang, D.; Hejazi, M. Quantifying the relative contribution of the climate and direct human impacts on mean annual streamflow in the contiguous United States. Water Resour. Res. 2011, 47. [Google Scholar] [CrossRef]
  4. Zhang, X.; Zhang, L.; Zhao, J.; Rustomji, P.; Hairsine, P. Responses of streamflow to changes in climate and land use/cover in the Loess Plateau, China. Water Resour. Res. 2008, 44, W00A07. [Google Scholar] [CrossRef]
  5. Haddad, K.; Rahman, A. Regional flood frequency analysis in eastern Australia: Bayesian GLS regression-based methods within fixed region and ROI framework-Quantile Regression vs. Parameter Regression Technique. J. Hydrol. 2012, 430, 142–161. [Google Scholar] [CrossRef]
  6. Zhao, G.; Tian, P.; Mu, X.; Jiao, J.; Wang, F.; Gao, P. Quantifying the impact of climate variability and human activities on streamflow in the middle reaches of the Yellow River basin, China. J. Hydrol. 2014, 519, 387–398. [Google Scholar] [CrossRef]
  7. Zhang, X.; Walling, D.E.; Quine, T.A.; Wen, A. Use of reservoir deposits and caesium-137 measurements to investigate the erosional response of a small drainage basin in the rolling loess plateau region of China. Land Degrad. Dev. 1997, 8, 1–16. [Google Scholar] [CrossRef]
  8. Zhang, X.; Walling, D.E.; Yang, Q.; He, X.; Wen, Z.; Qi, Y.; Feng, M. Cs-137 budget during the period of 1960s in a small drainage basin on the Loess Plateau of China. J. Environ. Radioactiv. 2006, 86, 78–91. [Google Scholar] [CrossRef] [PubMed]
  9. Shi, H.; Shao, M. Soil and water loss from the Loess Plateau in China. J. Arid Environ. 2000, 45, 9–20. [Google Scholar] [CrossRef]
  10. Zheng, F.; He, X.; Gao, X.; Zhang, C.E.; Tang, K. Effects of erosion patterns on nutrient loss following deforestation on the Loess Plateau of China. Agric. Ecosyst. Environ. 2005, 108, 85–97. [Google Scholar] [CrossRef]
  11. Tang, K. The Changes of Erosion, Runoff and Sediment in the Yellow River. Science China Press: Beijing, China, 1993. [Google Scholar]
  12. Xu, J.X. A study of physico-geographical factors for formation of hyperconcentrated flows in the Loess Plateau of China. Geomorphology 1998, 24, 245–255. [Google Scholar] [CrossRef]
  13. Shi, C.; Dian, Z.; You, L. Changes in sediment yield of the Yellow River basin of China during the Holocene. Geomorphology 2002, 46, 267–283. [Google Scholar] [CrossRef]
  14. Ran, D.; Liu, L.; Zhao, L.; Bai, Z.; Liu, B.; Wang, H. The Soil Conservation Practices and Streamflow and Sediment Load Changes in the Hekou-Longmen Region of Middle Reaches of Yellow River. Yellow River Water Conservancy Press: Zhengzhou, China, 2000. [Google Scholar]
  15. Yao, W.; Li, Z.B.; Kang, L.L.; Ran, D. The Effects of Controlling Soil Erosion on Environment on the Loess Plateau; Science and Technology Press: Beijing, China, 2005. [Google Scholar]
  16. Uchida, E.; Xu, J.; Rozelle, S. Grain for green: Cost-effectiveness and sustainability of China’s conservation set-aside program. Land Econ. 2005, 81, 247–264. [Google Scholar] [CrossRef]
  17. Tang, K. Soil and Water Conservation in China; Science China Press: Beijing, China, 2004; In Chinese. [Google Scholar]
  18. Yao, W.; Xu, J.; Ran, D. Analysis and Evaluation of the Water Sand Changing Regime in Catchments of Yellow River Basin; Yellow River Water Conservancy Press: Zhengzhou, China, 2011; In Chinese. [Google Scholar]
  19. Zhang, S.; kang, L.; Wei, Y. Research of the Impact of Human Activities on Streamflow and Sediment Load in the Middle Reaches of Yellow River. Yellow River Water Conservancy Press: Zhengzhou, China, 2010; In Chinese. [Google Scholar]
  20. Xu, X.; Zhang, H.; Zhang, O. Development of check-dam systems in gullies on the Loess Plateau, China. Environ. Sci. Policy 2004, 7, 79–86. [Google Scholar]
  21. Wang, G.; Wu, B.; Wang, Z.Y. Sedimentation problems and management strategies of Sanmenxia Reservoir, Yellow River, China. Water Resour. Res. 2005, 41. [Google Scholar] [CrossRef]
  22. Wang, Y.; Fu, B.; Chen, L.; Lü, Y.; Gao, Y. Check dam in the Loess Plateau of China: Engineering for environmental services and food security. Environ. Sci. Technol. 2011, 45, 10298–10299. [Google Scholar] [CrossRef] [PubMed]
  23. Ran, L.; Lu, X.; Xin, Z.; Yang, X. Cumulative sediment trapping by reservoirs in large river basins: A case study of the Yellow River basin. Glob. Planet. Change 2013, 100, 308–319. [Google Scholar] [CrossRef]
  24. Sahin, V.; Hall, M.J. The effects of afforestation and deforestation on water yields. J. Hydrol. 1996, 178, 293–309. [Google Scholar] [CrossRef]
  25. Quinton, J.N.; Edwards, G.M.; Morgan, R.P.C. The influence of vegetation species and plant properties on runoff and soil erosion: Results from a rainfall simulation study in south east Spain. Soil Use Manag. 1997, 13, 143–148. [Google Scholar] [CrossRef]
  26. Zhang, L.; Dawes, W.; Walker, G. Response of mean annual evapotranspiration to vegetation changes at catchment scale. Water Resour. Res. 2001, 37, 701–708. [Google Scholar] [CrossRef]
  27. Brown, A.E.; Zhang, L.; McMahon, T.A.; Western, A.W.; Vertessy, R.A. A review of paired catchment studies for determining changes in water yield resulting from alterations in vegetation. J. Hydrol. 2005, 310, 28–61. [Google Scholar] [CrossRef]
  28. Gao, Z.; Fu, Y.; Li, Y.; Liu, J.; Chen, N.; Zhang, X. Trends of streamflow, sediment load and their dynamic relation for the catchments in the middle reaches of the Yellow River over the past five decades. Hydrol. Earth Syst. Sci. 2012, 16, 3219–3231. [Google Scholar] [CrossRef]
  29. Cai, Q. Soil erosion and management on the Loess Plateau. J. Geogr. Sci. 2001, 11, 53–70. [Google Scholar]
  30. Zhao, G.; Mu, X.; Tian, P.; Wang, F.; Gao, P. Climate changes and their impacts on water resources in semiarid regions: A case study of the Wei River basin, China. Hydrol. Process. 2013, 27, 3852–3863. [Google Scholar] [CrossRef]
  31. Mu, X.; Zhang, L.; McVicar, T.R.; Chille, B.; Gau, P. Analysis of the impact of conservation measures on stream flow regime in catchments of the Loess Plateau, China. Hydrol. Process. 2007, 21, 2124–2134. [Google Scholar] [CrossRef]
  32. Wan, L.; Zhang, X.; Ma, Q.; Zhang, J.; Ma, T.; Sun, Y. Spatiotemporal characteristics of precipitation and extreme events on the Loess Plateau of China between 1957 and 2009. Hydrol. Process. 2013. [Google Scholar] [CrossRef]
  33. Zhao, F.; Zhang, L.; Xu, Z.; Scott, D.F. Evaluation of methods for estimating the effects of vegetation change and climate variability on streamflow. Water Resour. Res. 2010, 46. [Google Scholar] [CrossRef]
  34. Zhang, X.; Zhang, L.; McVicar, T.R.; Van Niel, T.G.; Li, L.T.; Li, R.; Yang, Q.; Wei, L. Modelling the impact of afforestation on average annual streamflow in the Loess Plateau, China. Hydrol. Process. 2008, 22, 1996–2004. [Google Scholar] [CrossRef]
  35. Ran, D.; Zuo, Z.; Wu, Y.; Li, X.; Li, Z. Streamflow and Sediment Load Changes Response to Human Activites in the Middle Reaches of the Yellow River. Science China Press: Beijing, China, 2012. [Google Scholar]
  36. Oliver, M.A.; Webster, R. Kriging: A method of interpolation for geographical information systems. Int. J. Geogr. Inform. Syst. 1990, 4, 313–332. [Google Scholar] [CrossRef]
  37. Mann, H.B. Nonparametric tests against trend. Econom. J. Econom. Soc. 1945, 13, 245–259. [Google Scholar] [CrossRef]
  38. Kendall, M. Rank Correlation Methods; Griffin: London, UK, 1975. [Google Scholar]
  39. Yue, S.; Pilon, P.; Cavadias, G. Power of the Mann-Kendall and Spearman’s rho tests for detecting monotonic trends in hydrological series. J. Hydrol. 2002, 259, 254–271. [Google Scholar] [CrossRef]
  40. Yue, S.; Pilon, P.; Phinney, B.; Cavadias, G. The influence of autocorrelation on the ability to detect trend in hydrological series. Hydrol. Process. 2002, 16, 1807–1829. [Google Scholar] [CrossRef]
  41. Yue, S.; Pilon, P. A comparison of the power of the t test, Mann-Kendall and bootstrap tests for trend detection/Une comparaison de la puissance des tests t de Student, de Mann-Kendall et du bootstrap pour la détection de tendance. Hydrol. Sci. J. 2004, 49, 21–37. [Google Scholar] [CrossRef]
  42. Sen, P.K. Estimates of the regression coefficient based on Kendall’s tau. J. Am. Stat. Assoc. 1968, 63, 1379–1389. [Google Scholar] [CrossRef]
  43. Pettitt, A. A non-parametric approach to the change-point problem. Appl. Stat. 1979, 28, 126–135. [Google Scholar] [CrossRef]
  44. Wilcox, B.P.; Huang, Y.; Walker, J.W. Long-term trends in streamflow from semiarid rangelands: Uncovering drivers of change. Glob. Change Biol. 2008, 14, 1676–1689. [Google Scholar] [CrossRef]
  45. Xie, Y.; Liu, B.Y.; Zhang, W.B. Study on Standard of Erosive Rainfall. J. Soil Water Conserv. 2000, 14, 6–11. [Google Scholar]
  46. Haddad, K.; Rahman, A.; Green, J. Design rainfall estimation in Australia: A case study using L moments and generalized least squares regression. Stoch. Env. Res. Risk A 2011, 25, 815–825. [Google Scholar] [CrossRef]
  47. Zhu, H.; Fu, B.; Wang, S.; Zhu, L.; Zhang, L.; Jiao, L.; Wang, C. Reducing soil erosion by improving community functional diversity in semi-arid grasslands. J. Appl. Ecol. 2015. [Google Scholar] [CrossRef]
  48. Zeng, B.; Ma, W. Study on impact of artificial grass coverage on water-borne silt yield. In Collected Papers on Sino-Canada Study of Soil Erosion Regularity on Loess Plateau of West Shanxi, China; Water and Hydropower Publishing House: Beijing, China, 1990. [Google Scholar]

