Article

Responses of Clonal Eucalypt Plantations to N, P and K Fertilizer Application in Different Edaphoclimatic Conditions

by
Eduardo Aparecido Sereguin Cabral de Melo
1,*,
José Leonardo de Moraes Gonçalves
2,
José Henrique Tertulino Rocha
2,
Rodrigo Eiji Hakamada
2,
José Henrique Bazani
3,
Andrea Virginia Athayde Wenzel
2,
José Carlos Arthur, Jr.
1,
Jarbas Silva Borges
4,
Rogério Malheiros
5,
Cristiane Camargo Zani de Lemos
6,
Eric Victor de Oliveira Ferreira
2 and
Alexandre De Vicente Ferraz
2
1
Forestry Science and Research Institute (IPEF), Via Comendador Pedro Morgante, 3500, Piracicaba, CEP: 13.400-970, Brazil
2
Department of Forest Science, Luiz de Queiroz College of Agriculture (ESALQ), Av. Padua Dias, 11, Piracicaba, CEP: 13.400-970, Brazil
3
4tree Agroflorestal, Tiradentes St., 435, Piracicaba, CEP.: 13.400-360, São Paulo, Brazil
4
Duratex, Rod. Marechal Rondon, S/N, Km 323, Agudos, CEP: 17.120-000, Brazil
5
Ramires Reflortec, Rd Br 262, S/N, Km 273, Ribas do Rio Pardo, CEP: 79180-000 Brazil
6
International Paper do Brasil, Rod. SP 340, Km 171, Mogi-Guaçu, CEP: 13844-502 Brazil
*
Author to whom correspondence should be addressed.
Forests 2016, 7(1), 2; https://doi.org/10.3390/f7010002
Submission received: 15 October 2015 / Revised: 7 December 2015 / Accepted: 15 December 2015 / Published: 22 December 2015

Abstract

:
Eucalypt plantations in Brazil have the highest mean productivity when compared to other producing countries, and fertilizer application is one of the main factors responsible for these productivities. Our aim was to identify appropriate rates of N, P and K in eucalypt plantations and their interactions with edaphoclimatic factors. Four trials with four rates and three nutrients (N, P and K) were set up. Each nutrient was studied separately, and the trees received sufficient rates of all of the other nutrients through fertilization, to avoid limitations not related to the desired nutrient. We assessed solid wood volume (SV), productivity gains (PG), leaf nutrient content and leaf area index (LAI) to determine the responses to fertilization. PG, regarding N, rates ranged from 104% to 127% at 60 months after planting. P fertilizer application led to gains in productivity in soils with levels of P-resin up to 5 mg·kg−1, but decreased with stand age. K fertilizer application responses increased within age in three sites. In Paulistania, responses to K application were close to zero. N and K responses were climate related. Leaf nutrient content and LAI were not able to predict the highest yields obtained.

1. Introduction

In the last few decades, Brazilian forestry presented advances in tree breeding, silvicultural practices and pest management [1,2]. The average yield of eucalypt plantations increased from 25 to 39 m3·ha−1·year−1 between 1990 and 2015 [3]. The soils intended for forest plantations usually have few physical limitations, but low fertility, which requires fertilizer application for appropriate rates and periods to maintain high yields. N, P and K are some of the major nutrients applied to eucalypt plantations [4,5].
Fertilizer applications in eucalypt plantations provide gains that can range from 5% to over 90% in wood production, depending on the nutrient, the stand age and the edaphoclimatic conditions [6,7,8,9]. Forest plantations depend on fertilizer application in appropriate levels, soil water availability and favorable climatic conditions to achieve high levels of productivity [2,10,11].
Eucalyptus species originated from Oceania and Asia, where they have high responses to N fertilizer application [12,13]. In Brazil, the maintenance of the forest residues on the soil after harvest and the favorable weather conditions accelerate the decomposition action of soil microorganisms, with a half-life of the litterfall of about 0.6 years. In Brazil, soil organic matter (SOM) originated from litterfall decomposition is rich in nutrients, such as N, and contributes to decreased responses to N fertilizer application in eucalypt stands, especially after canopy closure, period of litterfall deposition and biogeochemical cycling intensification [1,14]. In tropical forest plantations, the water deficit intensifies two years after planting, because of intraspecific competition. Furthermore, a lower water availability has a great influence on reducing responses to N fertilizer application, limiting production and mitigating potential responses for this nutrient [15]. According to Goncalves et al. [1] and Pulito et al. [6], eucalypt plantations on sandy soils may present responses to nitrogen fertilizer application in the next rotations due to the high demands of more productive genetic materials and exporting rates exceeding the quantities applied.
Restrictions imposed by intraspecific competition for water and light are commonly noticed [2]. Therefore, yield increases related to N and P fertilizer application tend to decrease with stand age, while for K, these yields increase [1,15,16]. Forests with higher productivities may be achieved at low water availability conditions when fertilized with appropriate rates of K, due to the effect of this nutrient in the stomatal activity [17].
Eucalypt plantations under soils with good water retention and availability (clayey soils), but deficient in N, tend to have larger and longer gains in wood productivity compared to sandy soils, due to the water competition mitigation [6,18]. The appropriate rate and the potential of responses are directly dependent on not only the soil fertility, but also the rainfall regime distribution and climate [19].
The major nutrients that limit the growth of planted eucalypt forests in Brazil are P and K [8]. P is applied at rates of 10–50 kg·ha−1 [1,19], but in conditions of low availability, rates of P exceeding 60 kg·ha−1 provided gains of 97% in the wood volume produced [7]. During the first assays of mineral fertilizing for eucalypt plantations in Brazil, no responses to K fertilizer application were observed [20]. However, eucalypt plantations have shown increasing responses to fertilizer application with K in the last years, due to the expansion of planted forests to regions where the soils have low natural chemical fertility and pronounced periods of water stress [8,21]. For N fertilizer application, recent studies presented gains in solid wood volume in stands from 2 to 11 years old, varying from 5% to 35% [6,18]. Due to outputs being higher than inputs and higher productivities, it is expected that responses to N fertilization start to appear in the upcoming eucalypt rotations [1].
The development of silvicultural practices and eucalypt breeding increased yields and, at the same time, reduced rotation time, which intensified nutrient output in forest sites and raised the responses for N, P and K fertilizer applications [22]. Despite the advances in silviculture and tree breeding achieved in recent years, which provided superior genetic materials adapted to specific edaphoclimatic conditions, with higher nutritional demands and yields, few studies on eucalypt N, P and K fertilizer application were developed. Due to the highly responsive and productive clonal eucalyptus stands, the impoverishment of forest soils and the expansion of eucalyptus plantations to low fertility areas in the mid-west and north regions of Brazil, it is expected that productivity gains will be more related to N, P and K fertilizer applications in the upcoming rotations. To meet N, P and K nutritional demands for different genetic materials and sites, the calibration of fertilizer application rates is necessary to reach the maximum yield [1,14,23].
Given the highly productive short rotation eucalypt stands cultivated in low fertility soils, associated with nutrient outputs higher than the inputs, we tested the hypotheses that higher demands for N, P and K fertilizer applications would be expected in eucalypt stands under highly weathered forest soils. Late reports show responses to N, P and K, though only a few presented growth results of stands over three years old, mainly for N and P, which tend to show smaller gains within stand age, and even fewer tested more than two nutrients at the same site. The effect of successive crop rotations over fertilization responses also represents an important feature in this work. We wanted to evaluate productivity gains related to N, P and K fertilizer rates separately, without another nutritional deficiency, under different edaphoclimatic conditions used for eucalypt plantations. For this, we provided the trees with commonly-used rates of all of the other nutrients, including Ca, Mg, micronutrients and N (for P and K rates), P (for N and K rates) and K (for N and P rates). Additionally, we determine the length of these gains according to the age, nutrient and the shape of the growth response curves over stand age.

2. Material and Methods

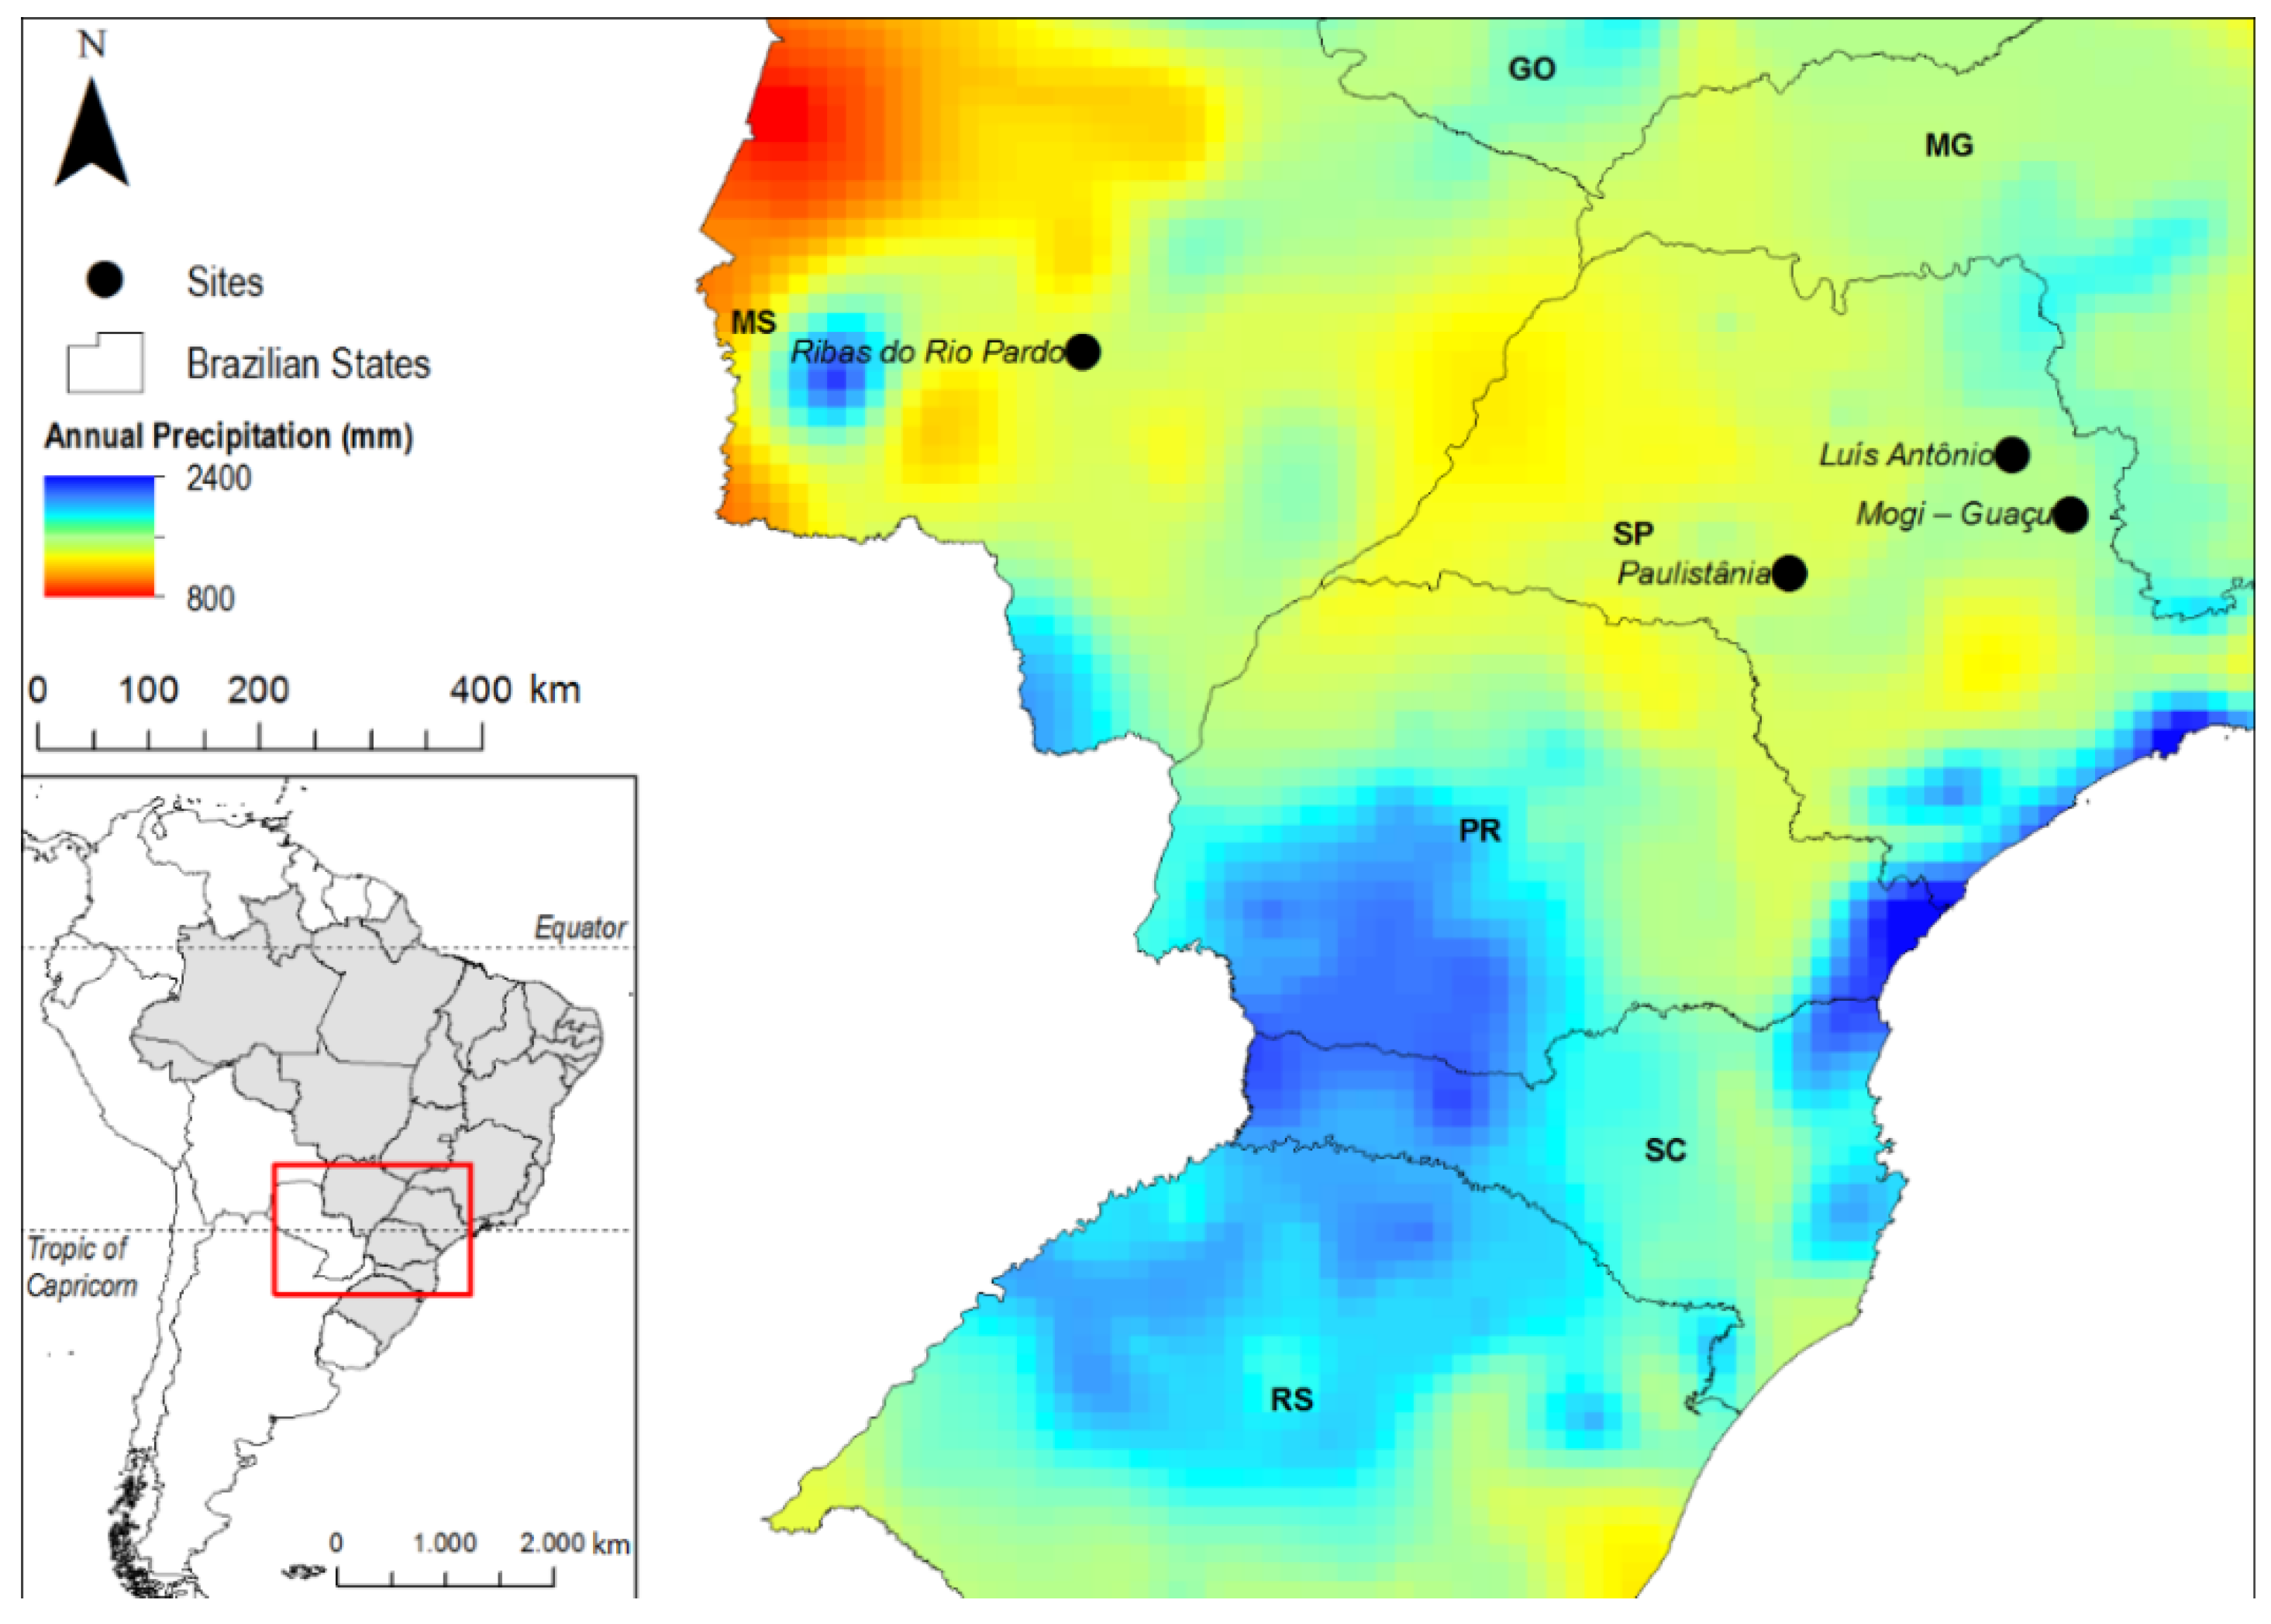
2.1. Site Description

Four sites were selected for this experiment, considering their soil types, climates and previous land use, to represent the conditions found in most sites currently used for forest plantations in the mid-west and southeastern regions, responsible for 65% of the eucalyptus plantation area in Brazil (Table 1). These sites belong to industrial companies from the states of São Paulo and Mato Grosso do Sul (Figure 1). According to the Köppen classification, the climate is Cwa at the Mogi Guacu (MGG) and Paulistania (PLT) sites. Cwa is a humid subtropical climate with dry winters and rainy summers, with a mean temperature in the hottest month higher than 22 °C. Ribas do Rio Pardo (RRP) and Luis Antonio (LAT) have climate described as Aw, a tropical climate with dry winters and a mean temperature in the coldest month above 18 °C (Table 1). The soils in LAT and RRP are Typic Quartzipsamment (Quartzarenic Neosol); in MGG, Typic Hapludox (red yellow Latosol); and in PLT, Rhodic Hapludox (red Latosol) (Table 2). The experimental sites at LAT and MGG were managed with eucalypt plantations for more than 20 years; in PLT, the site was previously used for agricultural crops; and in RRP, the experiment was established in an area with previous Cerrado (Brazilian Savannah) vegetation, known for the low levels of P, K, Ca, cation exchange capacity (CEC) and a lower decomposition rate [24,25,26].
The experiments were set up in November 2008 (RRP and PLT) and November 2009 (MGG and LAT). The genotypes used were two hybrids of E. grandis × urophylla (RRP and PLT) and one hybrid of E. urophylla × globulus (MGG and LAT). Tree spacing of MGG and RRP was 3.00 m × 2.75 m, for LAT, 3.00 m × 2.50 m, and for PLT, 3.00 m × 2.00 m. The silvicultural practices performed were soil preparation (subsoiling at 0.6 m), planting, irrigation and fertilizer application. Herbicides were applied 2–3 times during the first 3 years after planting to prevent herbaceous species in the stands.
Table 1. Latitude (Lat), longitude (Long), altitude (Alt) and mean annual values for temperature (T), pluviometric precipitation (PP), water surplus (WS), water deficit (WD) and months with WD per year (WDM) in each site. RRP, Ribas do Rio Pardo; PLT, Paulistania; MGG, Mogi Guacu; LAT, Luis Antonio.
SiteLatLongAltTPPWS 1,2WD 1,3WDM
S 4W 5m°C____________mm____________
RRP20°45′54°62′53024.514723101736
PLT22°33′49°19′61022.51387355866
MGG22°04′47°02′59122.01446488995
LAT21°35′47°31′61021.512133111186
1 Calculated according to Thornthwaite and Matter [27]; 2 mean of annual water surplus; 3 mean of annual water deficit; 4 South; 5 West.
Figure 1. Location of the studied site in the states of São Paulo and Mato Grosso do Sul.
Forests 07 00002 g001
Table 2. Soil classification, physical and chemical attributes (0–20 cm depth layer) at the studied sites.
SiteSoil Type 1Clay 2Sand 2OM 3pH 4P-Resin 5Cation Exchange
Ca 5Mg 5K 5Al 6
%g·kg−1mg·kg−1________mmolc·kg−1________
RRPQuartzipsamment7.390.812.94.01.41.41.00.36.8
PLTRhodic Hapludox12.386.09.83.63.03.01.50.49.5
LATQuartzipsamment8.990.719.44.18.716.35.80.44.1
MGGTypic Hapludox16.450.916.14.14.020.53.50.30.9
1 Soil Taxonomy, USDA [28]; 2 pipette method [29]; 3 organic matter determined by potassium dichromate and sulfuric acid extraction; 4 CaCl2 0.01 mol·L−1 soil to solution 1:2.5 ratio; 5 extracted by ion exchange resin [30]; 6 extracted by KCl 1 mol·L−1.

2.2. Experimental Design

The experiments were conducted in a randomized block experimental design with four replicates for each site. The plot had 36 trees, surrounded by a two-tree border. The experimental areas received three groups of treatments (N, P and K), with four rates (treatments) of each nutrient. The treatments for the N group were: (1) N0 (0 kg·ha−1); (2) N50 (50 kg·ha−1); (3) N100 (100 kg·ha−1); and (4) N150 (150 kg·ha−1). Each treatment in this group received the same amounts of P (40 kg·ha−1) and K (125 kg·ha−1). The treatments for the P group were: (1) P0 (0 kg·ha−1); (2) P13 (13 kg·ha−1); (3) P26 (26 kg·ha−1); and (4) P40 (40 kg·ha−1). Each treatment in this group received the same amounts of N (100 kg·ha−1) and K (125 kg·ha−1). The treatments for the K group were: (1) K0 (0 kg·ha−1); (2) K41 (41 kg·ha−1); (3) K83 (83 kg·ha−1); and (4) K125 (125 kg·ha−1). Additionally, K190 (190 kg·ha−1) and K250 (250 kg·ha−1) were applied only at PLT. Each treatment in this group received the same amounts of N (100 kg·ha−1) and P (40 kg·ha−1). A control treatment was also tested with application of rates of N (10 kg·ha−1), P (4 kg·ha−1) and K (8 kg·ha−1). The fertilizer sources used were ammonium nitrate (AN), triple superphosphate (TSS) and potassium chloride (KCl). Other nutrients applied to all sites and treatments were Ca (542 kg·ha−1), Mg (150 kg·ha−1), B (5.4 kg·ha−1), Zn and Fe (1.2 kg·ha−1, each), Mn (0.8 kg·ha−1), Mo and Cu (0.2 kg·ha−1, each). Ca and Mg were supplied through lime application, B, through ulexite and, the other micronutrients, through fritted trace elements (FTE) Br 9. The rates of Ca, Mg and all of the applied micronutrients were set up according to those commonly applied in eucalypt stands throughout Brazil to guarantee that these nutrients would not interfere in the experiment. The rates proposed for N, P and K were established according to those commonly used in eucalypt stands throughout Brazil [1,8,9,31].
Fertilizer rates were split into three applications. In the first was applied all P, 10 kg·ha−1 of N and 8 kg·ha−1 of K, into two side holes close to the seedling. The second and the third were performed at 3 and 8 months after planting, dividing equally the remaining rates (amount varied according to treatment) and spread over the crown projection.

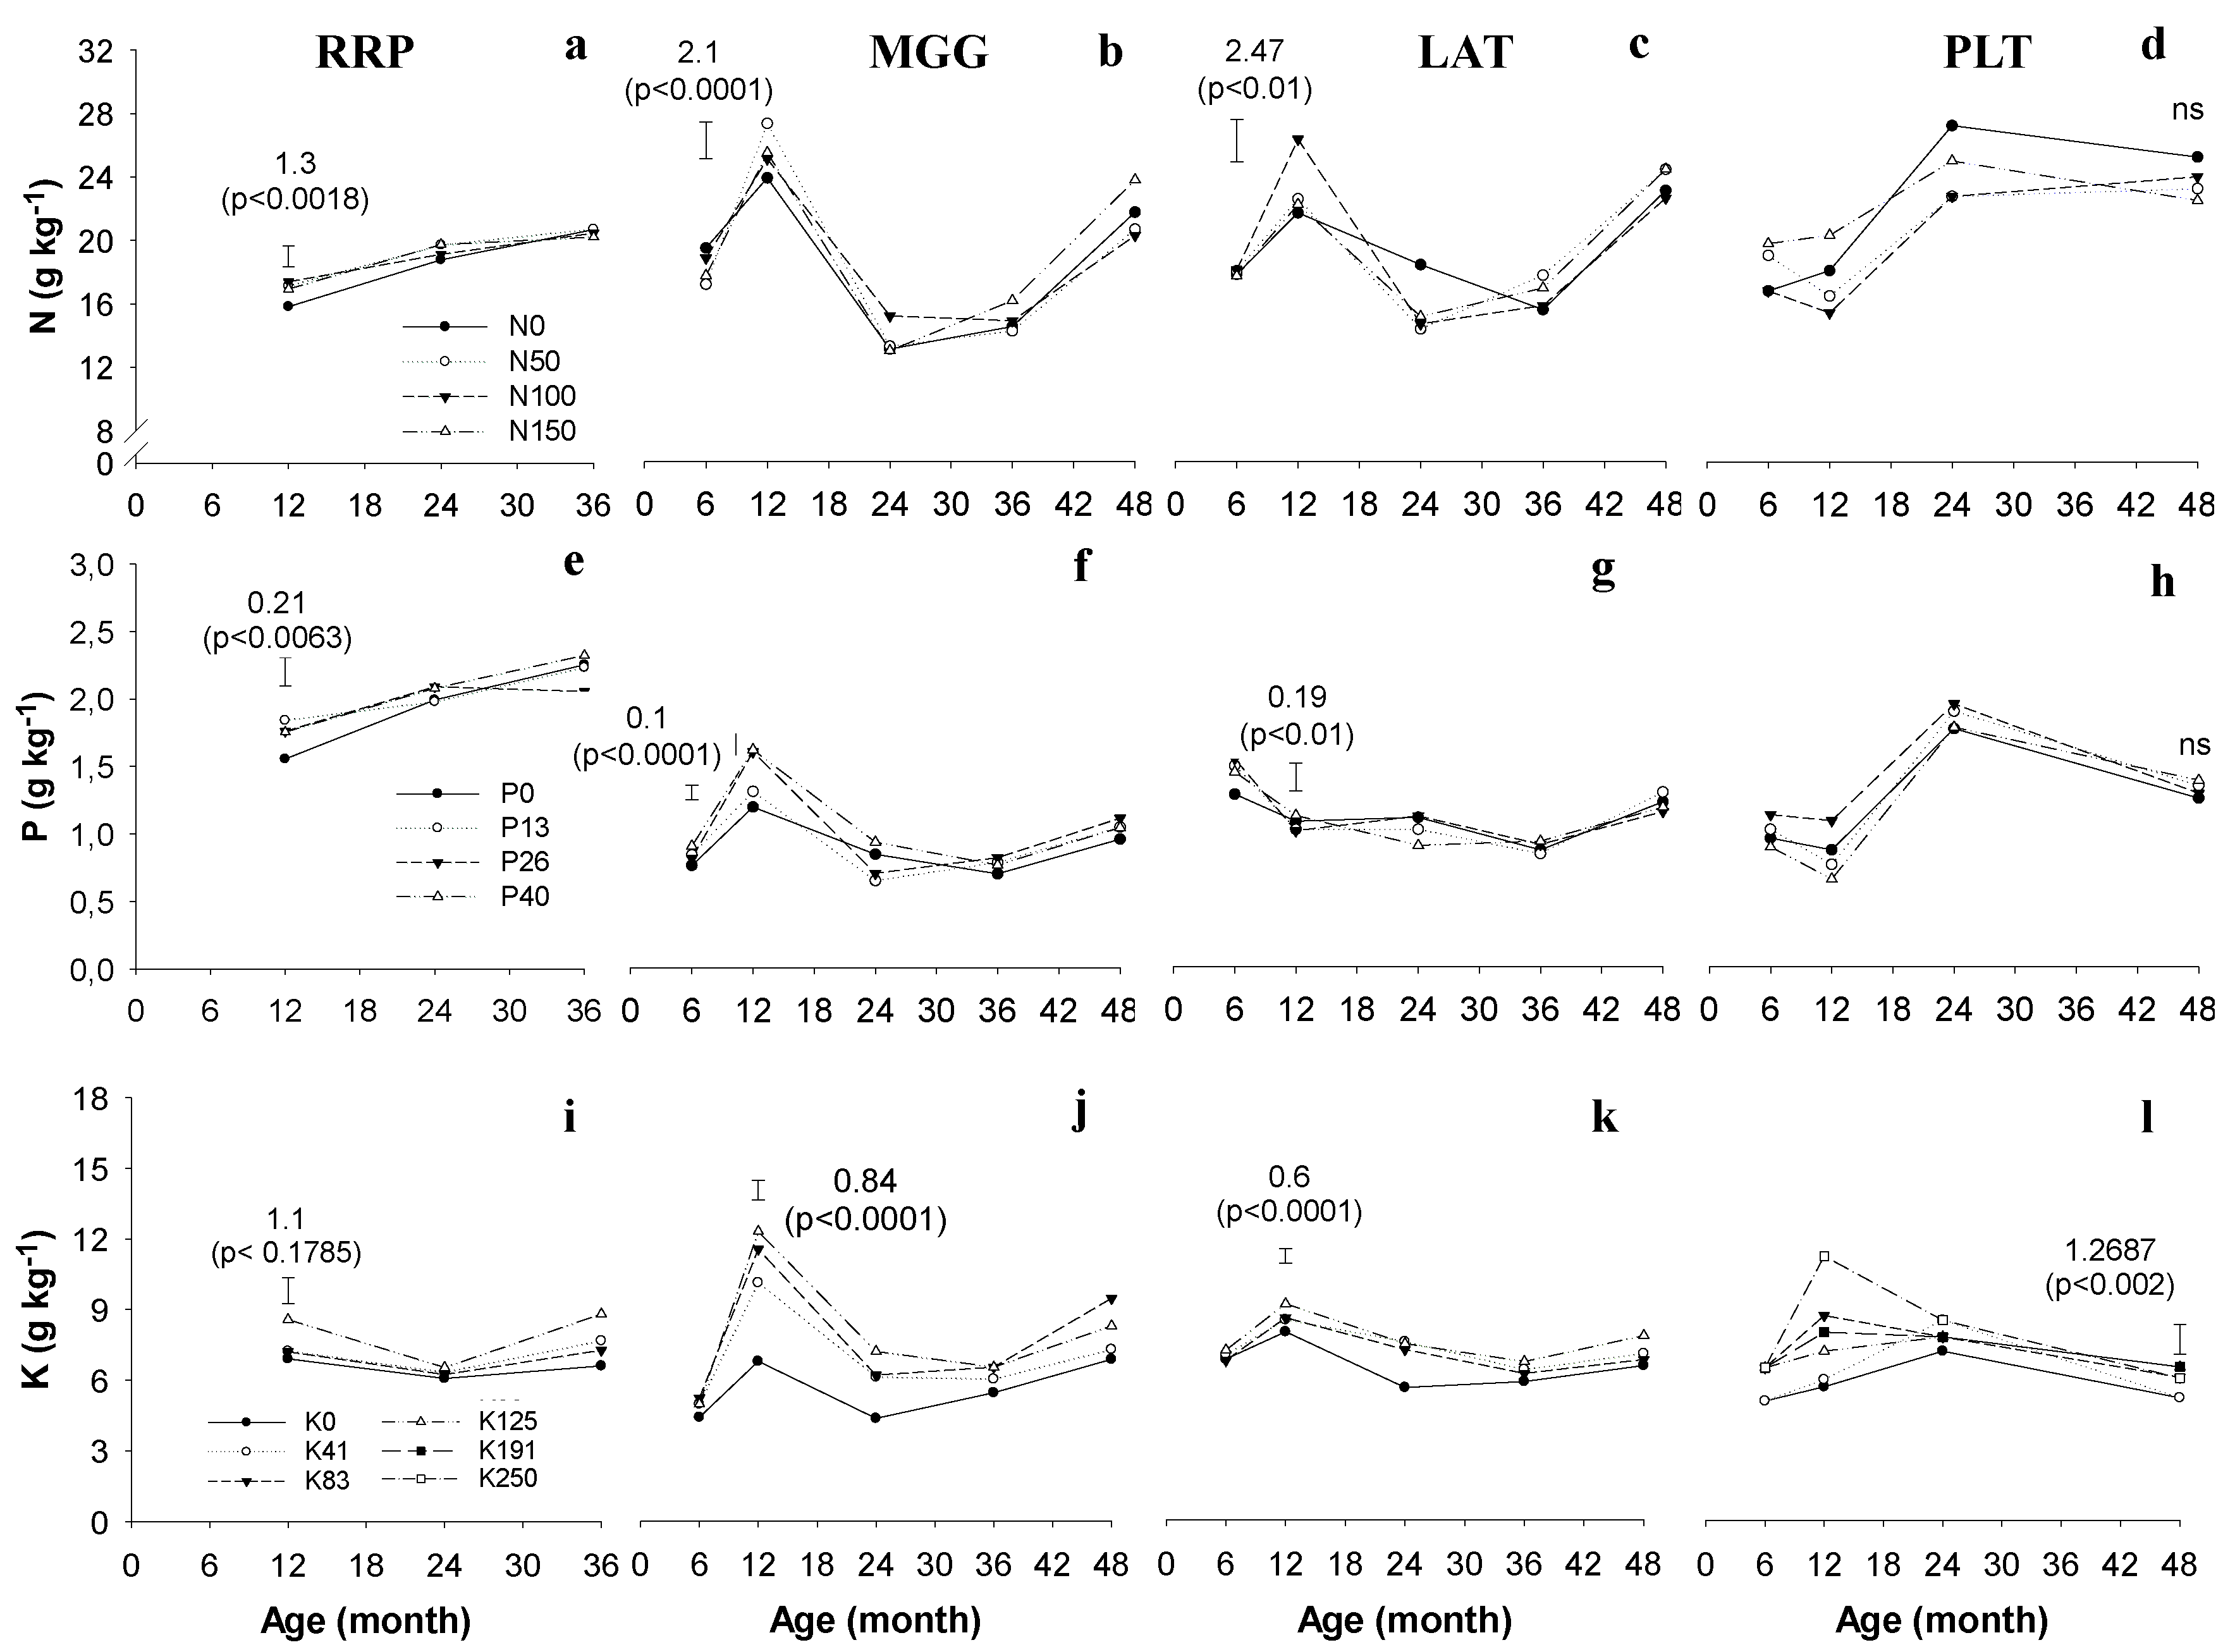
2.3. Leaf Nutrient Content

Leaves were collected in the upper third of the canopy. Twenty young fully-expanded leaves were collected from each tree, with four trees sampled per plot, forming a composite sample. This process was performed in three blocks at MGG, LAT and RRP (PLT, at 48 months). For PLT, at 6, 12, 24 and 36 months, only one composite sample was collected per treatment. Sampling started six months after planting for MGG, LAT and PLT and twelve months after that limit for RRP. Samples were air dried at 65 °C to a constant weight and ground for chemical determinations of N, P and K concentrations. The total N was determined after sulfuric acid digestion using the micro Kjeldahl method. After nitropercloric digestion, the P content was determined by colorimetry, K content was determined by flame photometry [32].

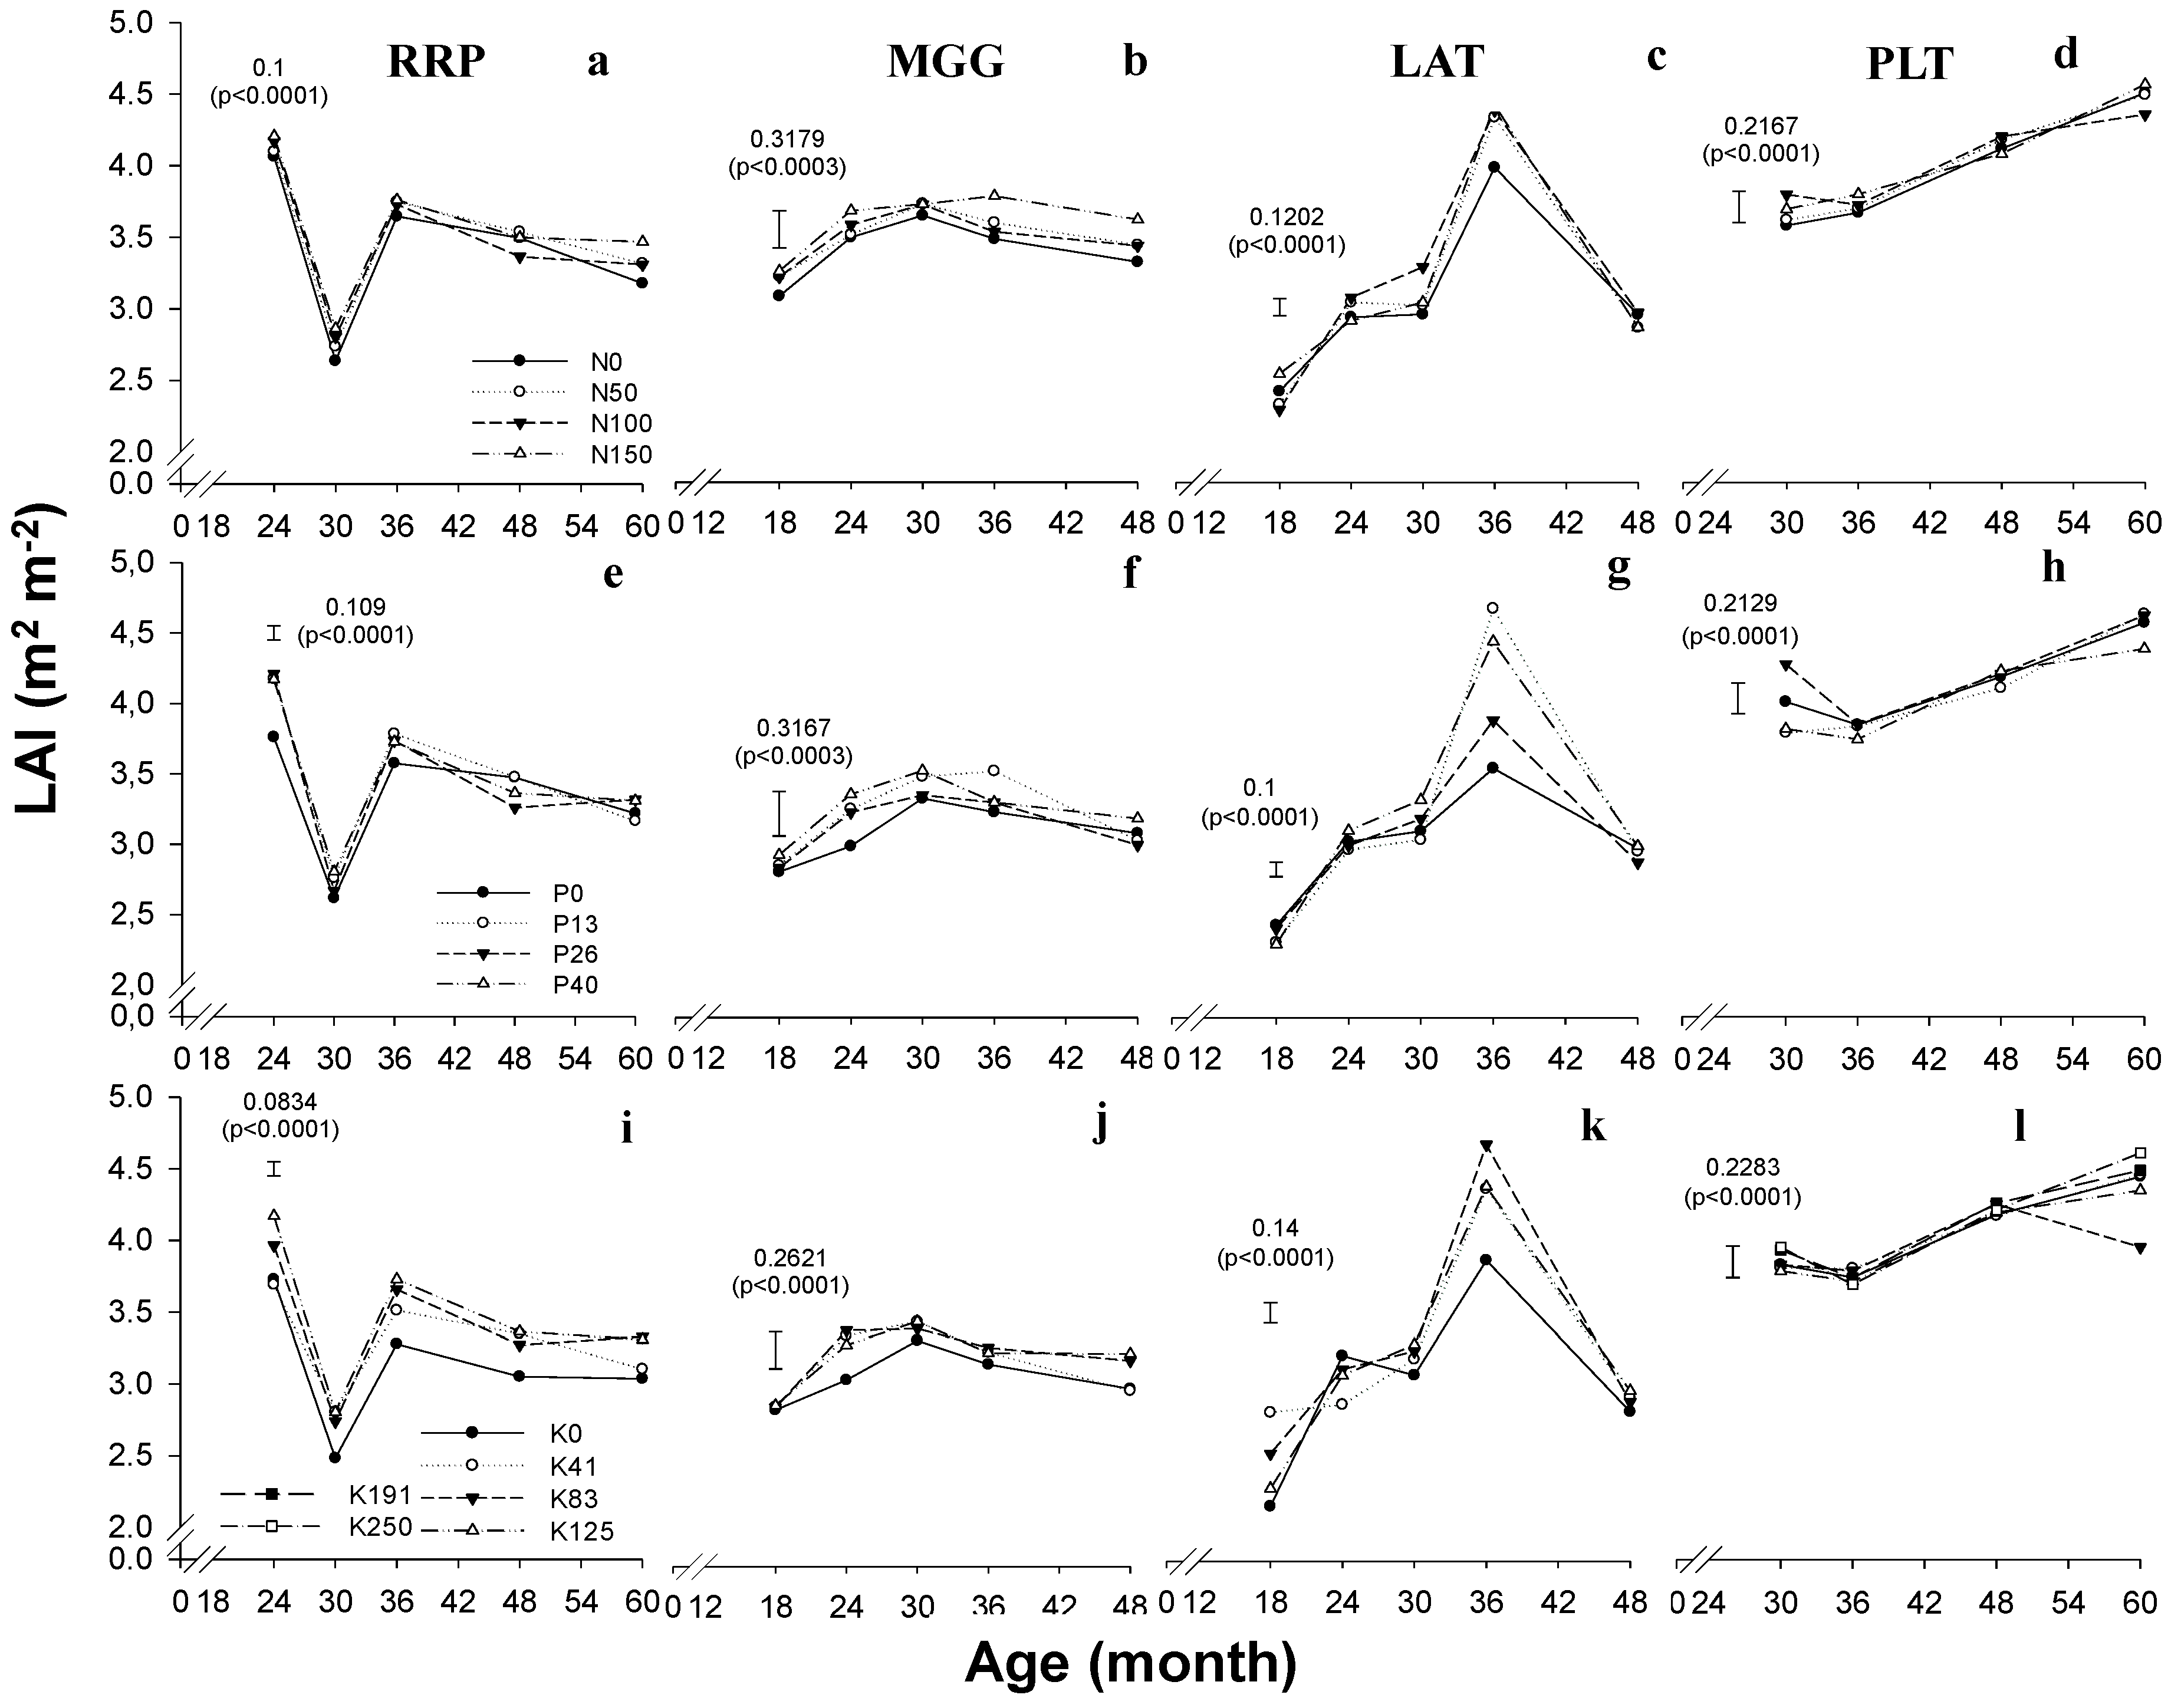
2.4. Leaf Area Index

The leaf area index (LAI) was obtained using hemispheric photographs analyzed with the software Hemisfer 1.41 [33,34,35]. The photograph images were sampled at 18, 24, 30, 36, 48 and 60 months after planting, according to the site. To provide the canopy image used to estimate LAI, the camera was positioned with the lens aiming at the canopy at a 1.0-m height, parallel to the ground. A compass was used to determine and direct the upper part of the lens to magnetic north. Four canopy images were sampled per plot.

2.5. Tree Growth

Tree height, diameter at breast height (DBH) and survival were measured at 18 (except for RRP), 24, 36, 48 and 60 (except for MGG and LAT) months after planting, to estimate the solid wood volume with bark (SV). Allometric equations using DBH and height developed by the industrial companies specifically for each genetic material were used to estimate SV. The productivity gain (PG) increase was calculated to compare the eucalypt responses to N, P or K fertilizer applications between sites, regardless of the growth increment (Equation (1)). The rates compared were N150/N0, P40/P0 and K125/K0.
PG ( % ) = S V   m a x S V × 100
where SV is the wood volume with bark for N0, P0 or K0; SVmax: SV for the highest rate of N (N150), P (P40) or K (K125).

2.6. Data Analysis

Data were checked for normality (Shapiro–Wilk) and homoscedasticity (Box–Cox). ANOVA was performed at the 5% confidence level (F-test). When significant by the F-test, an LSD test (p < 0.05) was performed for contrasting the means. The regression between the solid wood volume with bark (SV) and their fertilizer rates was established and applied to determine optimum nutrient rates for each nutrient and site at 24 and 48 months after planting for PLT, RRP, MGG and LAT and at 60 months after planting for PLT and RRP. Statistical analyses were performed using the software SAS Version 12.1 (SAS Institute, Cary, NC, USA)) and Sigmaplot Version 12.0 (Systat Software Inc., San Diego, CA, USA).

3. Results

The leaf N content ranged from 12 to 27 g·kg−1 in the four sites. N application affected N leaf content in RRP, MGG and LAT, but not in PLT (Figure 2). In RRP, there were differences between the N0 and the other rates only at 12 months. In MGG, the leaf N content of N0 was lower than the N50 (12 months) and N150 (48 months). In LAT, the leaf N content in N0 was lower only than N100 (12 months). A relationship between the applied N rates and the leaf N contents could not be found. The highest leaf N contents were found at 24 and 48 months in PLT, at 12 and 48 months in MGG and LAT and after 36 months in RRP. Among the four sites, the highest leaf N means were observed in PLT and MGG. Regarding the P rates, levels of this nutrient in leaf biomass had different performances in the sites. In RRP, the levels increased from 1.5 to 2.3 g·kg−1, between 12 and 36 months. In MGG, the levels ranged, between six and 48 months, with values higher than 1.5 g·kg−1 found with P40, at 12 months. The variation between treatments was close to 0.1 g·kg−1 at 36 months. P levels decreased after six months in LAT, ranging from 0.6 to 1.5 g·kg−1. The highest levels of P observed in PLT were higher than 1.6 g·kg−1, at 24 months, and the lowest between six and 12 months, close to 0.6 g·kg−1. Leaf K content increased until 12 months, then decreased in MGG, LAT and PLT. The highest (12.3 g·kg−1) and lowest (4.4 g·kg−1) values for the nutrient were observed in the MGG site.
LAI, related to the N application, varied according to the sites (Figure 3). The highest LAIs were found at 24 months in RRP, at 30 months in MGG, at 36 months in LAT, and in PLT, the values were not stable until 60 months. The LAI variation was similar in all sites, and it was related to the genetic material and climatic conditions, regardless of evaluated nutrient. No relationship between P rates and LAI was found for the studied sites. Regarding K rates, the lowest LAI in all ages were for K0, except in PLT. Similar results were found for N rates, with the lowest LAI values related to N0. The LAI differences between treatments ranged up to 1.2 m2·m−2.
Figure 2. Nutrient leaf contents of N (ad), P (eh) and K(il) for RRP (a,e,i), MGG (b,f,j), LAT (c,g,k) and PLT (d,h,l), according to the applied rates of the nutrients and stand age. Bars indicate the least significant difference by the LSD test (p < 0.05).
Forests 07 00002 g002
Figure 3. Leaf area index of N (ad), P (eh) and K(il) for RRP (a,e,i), MGG (b,f,j), LAT (c,g,k) and PLT (d,h,l), according to the applied rates of the nutrients and the plantation age. Bars indicate the least significant difference by the LSD test (p < 0.05).
Forests 07 00002 g003
The highest mean annual increment (MAI) at 48 months was found in PLT, 54 m3·ha−1·year−1 (N150), and the lowest in RRP, 12 m3·ha−1·year−1 (control) (Figure 4). The highest yield gains to P fertilizer application were observed in RRP, PLT and MGG. For N fertilizer application, the most responsive sites were in RRP, MGG and LAT, and to K fertilizer application, the sites were RRP, MGG and LAT.
Regarding N fertilizer application, decreases in the productivity gains (PG) along stand age were observed in MGG and LAT (Figure 5). The PG in PLT was 104% at 18 and 60 months, with minor variations along age; in LAT was 150% at 18 and 119% at 48 months; in MGG, PG was 120% at 18 and 114% at 48 months; and in RRP was 113% at 24 and 127% at 60 months.
For P rates, the PG decreased during the studied period, except in LAT. After 48 months, PG values were 105% (LAT), 110% (MGG) and 113% (PLT). In RRP, a PG of 165% at 24 and 140% at 60 months was observed. For K rates, PG increased in RRP and MGG, while in PLT, no responses were found to the applied rates.
The response curves and the optimal rate of each nutrient varied according to the site and stand age. The optimal N rate for the sites of MGG, LAT and PLT could not be established, due to the linear response to fertilizer application during the evaluation period, therefore being higher than 150 kg·ha−1. The optimal rate of N in RRP was 84 kg·ha−1, at 60 months. The optimum rate of P was higher than 40 kg·ha−1 in RRP at 60 months and 25 kg·ha−1 in MGG at 48 months. In LAT, no responses were found, and in PLT, a hyperbolic model was adjusted. The optimal rate of K in RRP was higher than the highest tested rate, 125 kg·ha−1 (60 months after planting). The optimal rate of K was 184 kg·ha−1 in MGG and 104 kg·ha−1 in LAT, at 48 months. PLT presented no volumetric gains related to the rate of application of K.
Figure 4. Solid wood volume with bark (SV) according to the applied rates of N (a,d,g,j), P (b,e,h,k) and K (c,f,i,l) in RRP (ac), MGG (df), LAT (gi) and PLT (jl). Bars indicate the least significant difference by the LSD test (p < 0.05).
Forests 07 00002 g004
Figure 5. Productivity gains (PG) for N (a), P (b) and K (c) fertilizer applications at different ages in Eucalyptus sp. at four sites.
Forests 07 00002 g005
The responses to K rates found in RRP fit linear models at 24, 48 and 60 months. Late responses were observed in LAT, with differences in wood volume between treatments from 36 months (Table 3). The responses in this site fit a quadratic model. MGG presented responses to the K rates during the evaluation period, fitting a quadratic model. In PLT, there were no responses to the K rates applied.
Table 3. Regression equations for N, P and K applied (kg·ha−1) according to the age and site in stands of E. grandis × urophylla (PLT and RRP) and E. urophylla × globulus (MGG and LAT).
NutrientSiteAge (years)NOR 1EquationR2p
NMGG2>150.0SV 2 = 22.3555 + 0.027 N0.910.05
4>150.0SV = 119.5067 + 0.1295 N0.880.01
LAT2>150.0SV = 12.9599 + 0.4441 N0.980.01
4>150.0SV = 97.78 + 0.1385 N0.970.01
PLT255.0SV = 90.8829 + 0.01111 N + 0.001 N20.990.05
4>150.0SV = 197.2356 + 0.0821 N0.990.01
5>150.0SV = 260.5 + 0.0683 N0.960.01
RRP2 ns 3
483.0SV = 83.17 + 0.83 N − 0.005 N20.980.01
584.0SV = 92.6145 + 1.4245 N − 0.0085 N20.980.01
PMGG2-SV= 39.1693 + 13.0978 P/(7,7766 + P)0.990.01
425.0SV = 121.527 + 1.591 P − 0.032 P20.990.01
LAT2 ns
4 ns
PLT2-SV = 59.6622 + 43.7815 P/(9.2192 + P)0.980.05
4-SV = 185.2123 + 32.2774 P/(9.0247 + P)0.990.01
5-SV = 234.5716 + 40.6509 P/(4.3426 + P)0.990.01
RRP2-SV = 9.8719 + 7.5309 P/(6.253 + P)0.990.01
4-SV = 92.8321 + 28.4579 P/(20.8669 + P)0.980.01
5>40.0SV = 105.568 + 0.468 P0.980.01
KMGG2117.0SV = 46.14 + 0.07 K − 0.0003 K20.890.05
4184.0SV = 112.275 + 0.2577 K − 0.0007 K20.990.05
LAT2-ns
4103.00SV = 94.7431 + 0.39 K − 0.0019 K20.910.05
PLT2-ns
4-ns
5-ns
RRP2148.0SV = 10.4628 + 0.1182 K − 0.0004 K20.990.01
4>125.0SV = 58.92 + 0.47 K0.950.01
5>125.0SV = 68.62 + 0.61 K0.940.01
1 Nutrient optimum rates (NOR) determined for quadratic models; 2 solid wood volume (m3 ha-1); 3 no significant.
The optimal rates for RRP at 48 (K) and 60 months (P and K) could not be established, due to the linear response to fertilizer application. The response curves of P for MGG, PLT and RRP (24 and 48 months) fit hyperbolic models, with decreasing increments. The model fit by the response curves of K varied for MGG, LAT and RRP. As the trees grew, K curves in MGG better fit the quadratic models. The response curves of K in LAT did not fit to any model at 24 months after planting. At 48 months, they fit to a quadratic model. In RRP, they fit to a quadratic model at 24 months and to linear models at 48 and 60 months after planting.

4. Discussion

4.1. Leaf Nutrient Contents

Leaf nutrient content and leaf area index are commonly used as quality indicators of forest plantations [2,8,36]. Environmental conditions and age can influence the performance and responses of stands under different fertilizer application regimes, as observed in other studies [8,9,21]. Eucalypt clonal plantations in a sandy soil in southeastern Brazil, with application of P rates from 9 to 36 kg·ha−1, presented differences in the leaf P content only at three months old, equaling the other treatments after this age [21]. In seedling monoprogeny plantations of E. grandis, comparing the control (no P application) and a P rate of 26 kg·ha−1, leaf P content presented differences until 120 days after planting, equaling later [9].
In our study, a decrease was observed in the leaf nutrient contents along stand age and in the differences between leaf nutrient contents of the treatments, as the stands developed. The highest variations were related to the age and weather seasonality, and not to the applied rates. LAT, a site with soil-available P levels considered high for eucalypt stands (Table 1), presented the lowest variations and differences in leaf P content along the stand age. According to Goncalves et al. [1], P contents higher than 8 mg·dm−3 at a 0–20-cm soil depth are considered high, with low or no potential responses to phosphorus fertilizer application. Therefore, P content in the soil was sufficient to supply the demand of the trees from the planting, and consequently, the leaf P contents in this site underwent less variation than in the other three sites.
Nutrient leaf content tends to be higher in eucalypt up to 24 months (canopy closure), due to the lower production of total biomass and the larger canopy contribution compared to other tree compartments. After this age, the canopy closes, and nutrient requirements decline until the end of the rotation [37]. According to Laclau et al. [31], N, P and K uptake from the soil are higher in the first year after planting. After this age, 30% of annual N and P and 45% of annual K requirements are met through internal retranslocation. Stocked in the leaves, nutrients are retranslocated to other compartments, especially to the stem, causing a dilution effect, with a reduction of the differences previously present in nutrient leaf content. This process decreases the possibility of associations between leaf nutrient contents and the responses to fertilizer applications, especially in stands more than 24 months old.
According to Gonçalves [36], the average leaf N, P and K contents in eucalypt stands in Brazil vary between 21 and 30 g·kg−1 (N), 1.0 and 1.3 g·kg−1 (P) and 5.5 and 8.0 g·kg−1 (K). In this study, while the P and K contents were within the proper range during most of the evaluation period, the N contents were below the proper range during all (RRP) or part (MGG, LAT and PLT) of the evaluation period. RRP was the site with the higher response to nitrogen fertilizer application, while PLT had the lower one, presenting the highest N content. No differences were found in N leaf contents between treatments at a single age in any of the sites. Similar results were found by Misra et al. [38] and Jesus et al. [18], who observed an increase in wood production not followed by an increase in leaf N content. These results can be attributed to an even distribution of the nutrient in biomass, as shown by Jesus et al. [18], who found larger amounts of N (kg·ha−1) in the aboveground biomass (including litterfall), according to the nutrient rates applied. Responses to P fertilizer application were observed in RRP, despite the leaf P content being above the threshold. Biochemical cycling possibly occurred with less intensity, due to the low MAI in RRP, which allowed higher P leaf contents until 36 months after planting.

4.2. Leaf Area Index

LAI is influenced by stand age, as well as the leaf nutrient content [2]. After canopy closure, between 24 and 36 months after planting, LAI values tend to decrease until stabilization. After this age, the factor that most affects LAI is weather seasonality, related to rainfall regime and soil water availability [39,40].
The maximum LAI is usually found until 36 months old, with minor variations and decreases afterwards. In some cases, LAI may continue to increase after that age, as observed in PLT, which can be attributed to its favorable edaphoclimatic conditions and the genetic material used [41]. The genetic material used in PLT was developed specifically for the study area, while the genetic materials used in RRP, LAT and MGG were developed for other regions. These genetic materials may have contributed to the results found, since they are more susceptible to edaphoclimatic adversities.
In RRP, where the highest responses to fertilizer application were found, small LAI variations were verified by applying increasing rates of N and P (Figure 3). The difference between K0 and K125 in RRP was lower than 9% at 24 and 11% at 60 months, while the yield difference at the same ages was 81% and 128%, respectively. The responses to fertilizer application observed in wood productivity were not followed by significant differences in the LAI in any of the evaluated sites. According to Battie-Laclau et al. [17], LAI variations up to 20% depending on the period of the year can be expected. The studied sites had no major variations in LAI between treatments in the rainy or the dry seasons. These results are similar to those presented by Bazani et al. [9] on P and Almeida et al. [8] on N.
Similar LAI between treatments with different wood yields indicates a higher leaf biomass contribution to the total biomass for treatments with lower yields. Fernandez et al. [7] found a higher relative contribution of leaves in total biomass of E. camaldulensis trees in treatments with lower rates of P (9.6 years after planting). Such results demonstrate the lower efficiency in light and water use, indicating that less productive treatments are less efficient in use and assimilate resources in low nutrient availability situations [13,42].

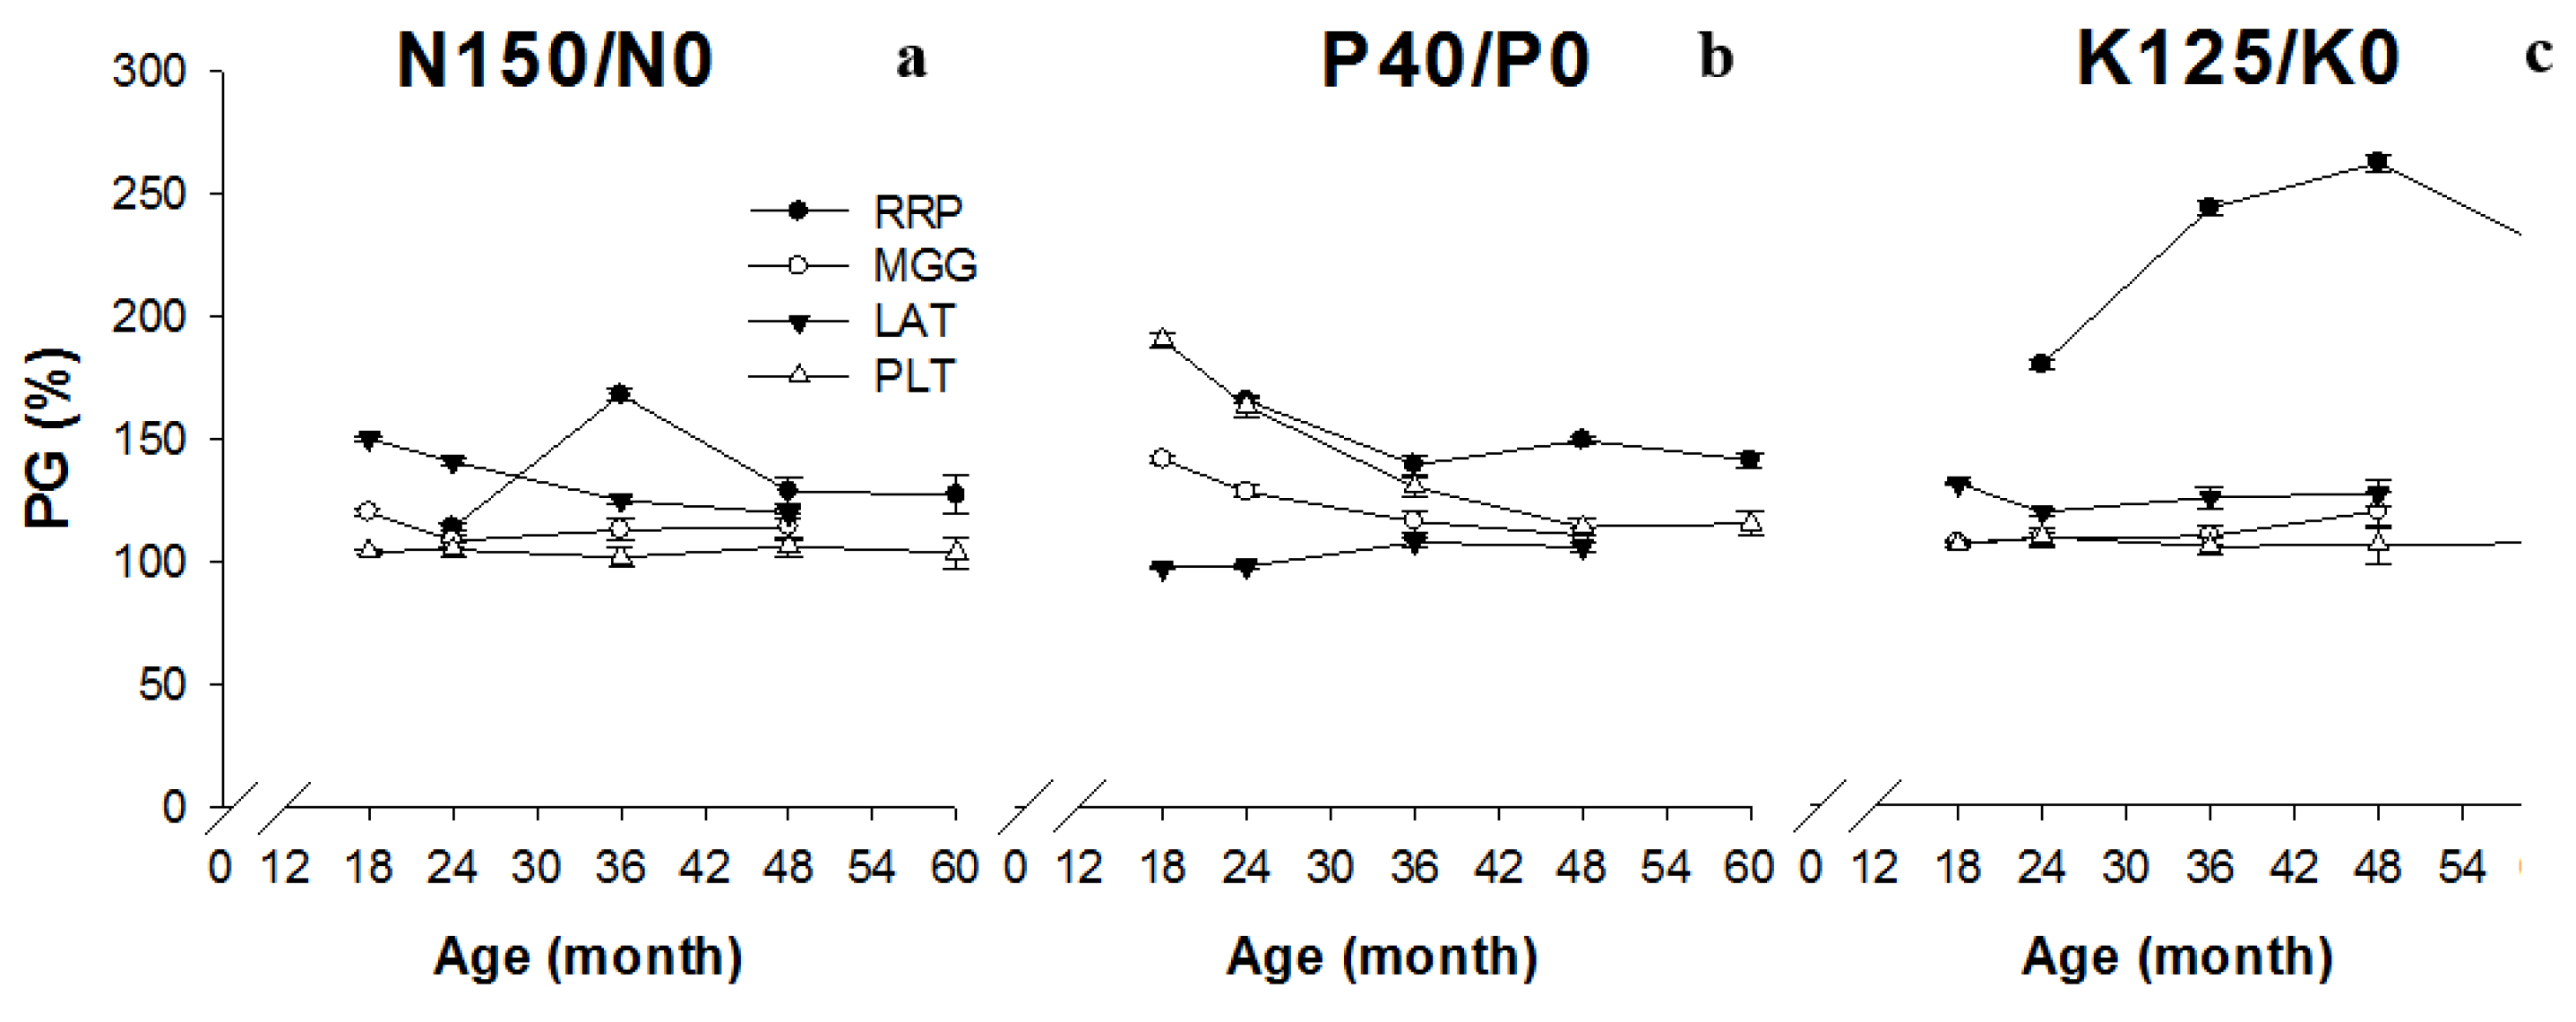
4.3. Productivity of Plantations in Response to Fertilizer Application

Productivity responses found in MGG, LAT and RRP to the N rate application might indicate an impoverishment of these soils. MGG and LAT sites have been managed with eucalypt plantations for more than 20 years. RRP was established in an area with previous Cerrado vegetation under low soil fertility (Table 2). PLT was previously managed with agricultural crops, differently from the other studied sites, and therefore, the productivity gains due to N fertilizer application were smaller.
A decrease in the responses (PG) to N fertilizer application, verified with age, was found in other experiments with different rates of N [6]. N demand from fertilizer application decreases with age, due to the canopy closure, internal cycling and intensification of the biogeochemical cycling, responsible for the mineralization and availability of N and other nutrients found in soil organic matter [1,31]. The competition for water and light after canopy closure limits tree growth and productivity responses to N fertilizer application [43]. As part of the chlorophyll structure responsible for photosynthesis [44], N demand is closely related to LAI. After canopy closure and the intensification of biogeochemical cycling, N demands tend to decrease in eucalypt stands. Other N input sources, such as deposition through rainfall, can add 2–10 kg·ha−1·year−1 of N to the soil and contribute to the decrease in the demand for nitrogen fertilizer application [31].
In LAT, no P fertilizer application responses were observed, due to the high P content present in the soil, which was able to meet the stand demand (>8 mg·kg−1) [14] (Table 1). In the other sites, there was a decrease in responses to the P rates applied throughout the stand development. Similar results were found in experiments with different rates of P [45,46]. In plants, P plays a vital role as part of the chemical structures of adenosine triphosphate (ATP). In the early stages of eucalypt growth, there is an intensification of the metabolic process, in which ATP is required, for biomass production [8]. Therefore, higher demands and uptake of this nutrient are noticed. Decreasing responses to P fertilizer application might be related to the root system development with stand age, exploring broader volumes of soil, thus accessing larger amounts of P in the soil [47]. The competition by other limiting factors, such as water and light, also influenced these results [1].
Planted forests in Brazil have their higher rates of current annual increment (CAI) between three and four years old. After this period, the demand for water considerably increases, initiating an intraspecific competition. Water is a regulator of forest production, and its limitation mitigates responses to nutrient application, especially to P and N [38]. Regarding K, due to its effect on stomatal regulation, forests with adequate K availability exposed to water stress tend to have lower productivity losses [43]. Eucalypt plantation responses to K fertilizer application usually increase with stand age, because of this relation between water use efficiency and K content in the leaves [1,8,17,48].
In soils with low exchangeable K availability, productivity gains for E. grandis reached 191% after 36 months and 230% after 84 months with the application of 116 kg·ha−1 of K compared to a treatment without K fertilizer application, presenting an increase of responses with age [8,14]. Almeida [48] found, in E. grandis stands, lower transpiration by leaf unit area for the treatments that received K application compared to the control, with a water loss 30% lower. This author also found that the amount of water required per kilogram of produced stem reduced from 500 L (control) to 248 L (116 kg·ha−1 of K) three years after planting.
RRP presented the highest response to K application, with relative gains greater than 130% at 60 months, comparing K0 and K125. This site presented sandy soil (91% sand); therefore, it retained the smallest amounts of water, due to the water retention capacity associated with clayey soils. The water balance calculated for this site also indicated the longer periods of soil water deficit and shorter for water surplus (Table 1). Edaphoclimatic conditions, associated with the low K availability, were crucial for the K fertilizer application responses found [8,17].
The lack of responses to K application in PLT is associated with the previous use of this site. In the other three sites, the area had either been used for eucalypt plantations in previous rotations (MGG and LAT) or presented a low fertility soil and no fertilizer application background. In PLT, the experiment was conducted in an area previously used for agricultural crops, usually with higher fertilizer demands and application. Thus, the residual effect of previous fertilizer application probably provided larger amounts of K to plants, mitigating the fertilizer application effects. The previous crops in this site had a shallow root system with smaller depths of soil exploration, which may have contributed to a greater water accumulation at depths greater than 5 m, accessible only by species with deeper root exploration of the soil, such as Eucalyptus [49]. The lowest soil water deficits found in this site compared to the others is also considered responsible for the lack of responses to K application, since there were no differences found comparing the treatments with and without rates of K, even under higher water consumption conditions.
The hyperbolic models fit by response curves of P in MGG (24 months), PLT (24, 48 and 60 months) and RRP (24 and 48 months) indicate decreasing increments with the increasing of P rates (Table 3). The volume of wood to be obtained and the economic returns should be consider to determine the optimal rate in these models.
The responses found with N application showed that the use of soil organic matter (SOM) alone as an indicator to consider for N recommendation could limit the plantation productive potential. The higher responses to N application were expected in PLT due to the lower SOM contents in the soil layer of 0–20 cm; however, these were found in RRP (Figure 4). Both of the sites used the E. urophylla × grandis hybrid. MGG and LAT used an E. urophylla × globulus hybrid, and higher yield responses were found in LAT, which had higher SOM contents. Regarding the climatic variables, the sites with higher responses to N application were those of higher values of mean water deficit in the soil. RRP had an average water deficit of 173 mm (2009–2013), and LAT presented an average water deficit of 118 mm (2010–2013). According to Stape et al. [50], the water supply is directly related to the productive potential of a site, and at low soil water availability, trees tend to limit their growth and provide greater amounts of carbohydrates to root formation; therefore, there is a reduction in the aboveground biomass.
The contents of P in the soil were directly related to the yields found. RRP, the site with the lowest values of P available in the soil, presented the highest gains in wood (with bark) volume to P rate application. LAT, the site with the highest P content in the soil, had no responses to P fertilizer application. The greatest demand for P in the early growth stages of the trees indicated the role of phosphorus fertilizer application during the period in which the exploration of the soil by the root system is still limited.

5. Conclusions

Long-term eucalypt sites are gradually responding to N. In these sites, productivity gains due to N fertilizations are expected for the upcoming rotations. For P application, productivity gains decreased with stand age, proving a greater demand for this nutrient in the early growth stages (until two years old) of eucalypt plantations. Demands for K arose according to stand age in three sites. Differences in LAI and leaf nutrient contents according to the fertilizer rates were smaller than productivity gains, for N, P and K fertilizer applications, limiting the use of these variables as productivity indicators.

Acknowledgments

The authors thank the companies Ramires Reflortec S.A., Duratex S.A. and International Paper, for financial support, provision of the areas for conducting the study and support during field measurements and sampling. The authors also thank the Cooperative Program of Silviculture and Management of the Institute of Forestry Research and Science (IPEF-PTSM) for their support in conducting and interpreting the results.

Author Contributions

Eduardo A.S.C. de Melo, José L.M. Gonçalves, José C. Arthur Jr, Rodrigo E. Hakamada, Rogerio Malheiros and Jarbas S. Borges contributed to the design and installation of the study. Eduardo A. S. C. de Melo, E. Hakamada, Jarbas S. Borges, José H. Bazani, José H. T. Rocha, Andrea V. A. Wenzel and Cristiane C. Z. Lemos contributed to the maintenance of the experimental areas. Eduardo A. S. C. de Melo, José H. T. Rocha, Jose H. Bazani and Andrea V. A. Wenzel participated in data analysis. Eduardo A. S. C. de Melo, Jose L. M. Gonçalves, Jose H. T. Rocha, Eric V. O. Ferraz and Alexandre V. Ferraz wrote the paper.

Conflicts of Interest

The authors declare no conflict of interest.

References

  1. Goncalves, J.L.M.; Stape, J.L.; Laclau, J.P.; Bouillet, J.P.; Ranger, J. Assessing the effects of early silvicultural management on long-term site productivity of fast-growing eucalypt plantations: The Brazilian experience. South. For. 2008, 70, 105–118. [Google Scholar] [CrossRef]
  2. Goncalves, J.L.D.; Alvares, C.A.; Higa, A.R.; Silva, L.D.; Alfenas, A.C.; Stahl, J.; Ferraz, S.F.D.; Lima, W.D.P.; Brancalion, P.H.S.; Hubner, A.; et al. Integrating genetic and silvicultural strategies to minimize abiotic and biotic constraints in Brazilian eucalypt plantations. For. Ecol. Manag. 2013, 301, 6–27. [Google Scholar] [CrossRef]
  3. Brazilian Tree Industry (IBA). Relatório ibá 2015. Available online: http://iba.org/images/shared/iba_2015.pdf (accessed on 10 September 2015).
  4. Smethurst, P.; Baillie, C.; Cherry, M.; Holz, G. Fertilizer effects on LAI and growth of four Eucalyptus nitens plantations. For. Ecol. Manag. 2003, 176, 531–542. [Google Scholar] [CrossRef]
  5. Smethurst, P.; Holz, G.; Moroni, M.; Baillie, C. Nitrogen management in Eucalyptus nitens plantations. For. Ecol. Manag. 2004, 193, 63–80. [Google Scholar] [CrossRef]
  6. Pulito, A.P.; de Moraes Goncalves, J.L.; Smethurst, P.J.; Arthur Junior, J.C.; Alvares, C.A.; Tertulino Rocha, J.H.; Huebner, A.; de Moraes, L.F.; Miranda, A.C.; Kamogawa, M.Y.; et al. Available nitrogen and responses to nitrogen fertilizer in Brazilian eucalypt plantations on soils of contrasting texture. Forests 2015, 6, 973–991. [Google Scholar] [CrossRef]
  7. Fernandez, J.Q.P.; Dias, L.E.; Barros, N.F.; Novais, R.F.; Moraes, E.J. Productivity of Eucalyptus camaldulensis affected by rate and placement of two phosphorus fertilizers to a Brazilian oxisol. For. Ecol. Manag. 2000, 127, 93–102. [Google Scholar] [CrossRef]
  8. Almeida, J.C.R.; Laclau, J.P.; Goncalves, J.L.D.; Ranger, J.; Saint-Andre, L. A positive growth response to NaCl applications in Eucalyptus plantations established on K-deficient soils. For. Ecol. Manag. 2010, 259, 1786–1795. [Google Scholar] [CrossRef]
  9. Bazani, J.H.; Gonçalves, J.L.M.; Rocha, J.H.T.; Melo, E.A.S.C.; Prieto, M. Nutrição fosfatada em plantações de eucalipto. Inf. Agron. 2014, 148, 11. [Google Scholar]
  10. Christina, M.; le Maire, G.; Battie-Laclau, P.; Nouvellon, Y.; Bouillet, J.-P.; Jourdan, C.; de Moraes Goncalves, J.L.; Laclau, J.-P. Measured and modeled interactive effects of potassium deficiency and water deficit on gross primary productivity and light-use efficiency in Eucalyptus grandis plantations. Glob. Chang. Biol. 2015, 21, 2022–2039. [Google Scholar] [CrossRef] [PubMed]
  11. Sette, C.R., Jr.; Filho, M.T.; Dias, C.T.S.; Laclau, J.P. Crescimento em diâmetro do tronco das árvores de Eucalyptus grandis W. Hill. Ex. Maiden e relação com as variáveis climáticas e fertilização mineral. Rev. Árvore 2010, 34, 979–990. [Google Scholar] [CrossRef]
  12. Forrester, D.I.; Medhurst, J.L.; Wood, M.; Beadle, C.L.; Valencia, J.C. Growth and physiological responses to silviculture for producing solid-wood products from Eucalyptus plantations: An australian perspective. For. Ecol. Manag. 2010, 259, 1819–1835. [Google Scholar] [CrossRef]
  13. Forrester, D.I.; Collopy, J.J.; Beadle, C.L.; Warren, C.R.; Baker, T.G. Effect of thinning, pruning and nitrogen fertiliser application on transpiration, photosynthesis and water-use efficiency in a young Eucalyptus nitens plantation. For. Ecol. Manag. 2012, 266, 286–300. [Google Scholar] [CrossRef]
  14. Goncalves, J. Silvicultural effects on the productivity and wood quality of eucalypt plantations. For. Ecol. Manag. 2004, 193, 45–61. [Google Scholar] [CrossRef]
  15. Bouillet, J.-P.; Laclau, J.-P.; de Moraes Goncalves, J.L.; Voigtlaender, M.; Gava, J.L.; Leite, F.P.; Hakamada, R.; Mareschal, L.; Mabiala, A.; Tardy, F.; et al. Eucalyptus and Acacia tree growth over entire rotation in single- and mixed-species plantations across five sites in Brazil and Congo. For. Ecol. Manag. 2013, 301, 89–101. [Google Scholar] [CrossRef]
  16. Jourdan, C.; Silva, E.V.; Goncalves, J.L.M.; Ranger, J.; Moreira, R.M.; Laclau, J.P. Fine root production and turnover in Brazilian Eucalyptus plantations under contrasting nitrogen fertilizer application regimes. For. Ecol. Manag. 2008, 256, 396–404. [Google Scholar] [CrossRef]
  17. Battie-Laclau, P.; Laclau, J.-P.; Domec, J.-C.; Christina, M.; Bouillet, J.-P.; Piccolo, M.D.C.; de Moraes Goncalves, J.L.; Moreira e Moreira, R.; Krusche, A.V.; Bouvet, J.-M.; et al. Effects of potassium and sodium supply on drought-adaptive mechanisms in Eucalyptus grandis plantations. New Phytol. 2014, 203, 401–413. [Google Scholar] [CrossRef] [PubMed]
  18. Jesus, G.L.; de Barros, N.F.; da Silva, I.R.; Neves, J.C.L.; Henriques, E.P.; Lima, V.C.; Fernandes, L.V.; Soares, E.M.B. Effect of nitrogen rates and sources on Eucalyptus yield and soil organic matter fractions in the cerrado region of Minas Gerais. Rev. Bras. Ciênc. Solo 2012, 36, 201–214. [Google Scholar] [CrossRef]
  19. Aguiar Ferreira, J.M.; Stape, J.L. Productivity gains by fertilisation in Eucalyptus urophylla clonal plantations across gradients in site and stand conditions. South. For. 2009, 71, 253–258. [Google Scholar]
  20. Mello, H.A.; Mascarenhas Sobrinho, J.; Simões, J.W.; do Couto, H.T.Z. Resultados da aplicação de fertilizantes minerais na produção de madeira de Eucalyptus saligna sm. Em solos de cerrado do estado de são paulo. IPEF 1970, 1, 20. [Google Scholar]
  21. Silva, P.H.M.; Poggiani, F.; Libardi, P.L.; Goncalves, A.N. Fertilizer management of eucalypt plantations on sandy soil in Brazil: Initial growth and nutrient cycling. For. Ecol. Manag. 2013, 301, 67–78. [Google Scholar] [CrossRef]
  22. Smethurst, P.J. Forest fertilizer application: Trends in knowledge and practice compared to agriculture. Plant Soil 2010, 335, 83–100. [Google Scholar] [CrossRef]
  23. Gava, J.L.; Goncalves, J.L.M.; Shibata, F.Y.; Corradini, L. Eficiência relativa de fertilizantes fosfatados no crescimento inicial de eucalipto cultivado em solos do cerrado. Rev. Bras. Ciênc. Solo 1997, 21, 497–504. [Google Scholar] [CrossRef]
  24. Lopes, A.S.; Cox, F.R. A survey of the fertility status of surface soils under cerrado vegetation in Brazil. Soil. Sci. Soc. Am. J. 1977, 41, 742–747. [Google Scholar] [CrossRef]
  25. Vendrame, P.R.S.; Brito, O.R.; Guimaraes, M.F.; Martins, E.S.; Becquer, T. Fertility and acidity status of latossolos (oxisols) under pasture in the Brazilian cerrado. An. Acad. Bras. Cienc. 2010, 82, 1085–1094. [Google Scholar] [CrossRef] [PubMed]
  26. Valenti, M.W.; Cianciaruso, M.V.; Batalha, M.A. Seasonality of litterfall and leaf decomposition in a cerrado site. Braz. J. Biol. 2008, 68, 459–465. [Google Scholar] [CrossRef] [PubMed]
  27. Thornthwaite, C.W.; Mather, J.R. The Water Balance; Drexel Institute of Technology, Laboratory of Climatology: Centerton, NJ, USA, 1955; p. 104. [Google Scholar]
  28. Soil Survey Staff. Keys to Soil Taxonomy; USDA, National Resources Conservation Service, National Soil Survey Center: Lincoln, NE, USA, 2014; Volume 12. [Google Scholar]
  29. Empresa Brasileira de Pesquisa Agropecuária—EMBRAPA. Manual de Métodos de Análise de Solo; EMBRAPA: Rio de Janeiro, Brazil, 1999; p. 212. [Google Scholar]
  30. Van Raij, B.; Andrade, J.C.; Cantarella, H.; Quaggio, J.A. Análise Química Para Avaliação da Fertilidade de Solos Tropicais; Instituto Agronômico de Campinas: Campinas, Brazil, 2001; p. 285. [Google Scholar]
  31. Laclau, J.P.; Ranger, J.; Goncalves, J.L.D.; Maquere, V.; Krusche, A.V.; M’Bou, A.T.; Nouvellon, Y.; Saint-Andre, L.; Bouillet, J.P.; Piccolo, M.D.; et al. Biogeochemical cycles of nutrients in tropical Eucalyptus plantations main features shown by intensive monitoring in Congo and Brazil. For. Ecol. Manag. 2010, 259, 1771–1785. [Google Scholar] [CrossRef]
  32. Malavolta, E.; Vitti, G.C.; Oliveira, A.S. Avaliação do Estado Nutricional das Plantas; Princípios e Aplicações Potafos: Piracicaba, Brazil, 1997; p. 319. [Google Scholar]
  33. Schleppi, P.; Conedera, M.; Sedivy, I.; Thimonier, A. Correcting non-linearity and slope effects in the estimation of the leaf area index of forests from hemispherical photographs. Agric. For. Meteorol. 2007, 144, 236–242. [Google Scholar] [CrossRef]
  34. Campoe, O.C.; Stape, J.L.; Teixeira Mendes, J.C. Can intensive management accelerate the restoration of Brazil’s Atlantic forests? For. Ecol. Manag. 2010, 259, 1808–1814. [Google Scholar] [CrossRef]
  35. Neto, C.G.; Hakamada, R.; Otto, M.S.G.; Stape, J.L.; Silva, S.R. Calibração de dois métodos indiretos para estimativa do índice de área foliar em plantações de Eucalyptus. Sci. For. (accepted).
  36. Gonçalves, J.L.M. Fertilização de plantação de eucalipto. In Anais do 2° Encontro Brasileiro de Silvicultura; Gonçalves, J.L.M., Pulito, A.P., Arthur Júnior, J.C., Silva, L.D., Eds.; PTSM; IPEF; ESALQ; FUPEF: Piracicaba, Brazil, 2011; pp. 85–114. [Google Scholar]
  37. Tuner, J.; Lambert, M.J. Nutrient cycling in age sequences of two Eucalyptus plantation species. For. Ecol. Manag. 2008, 255, 1701–1712. [Google Scholar] [CrossRef]
  38. Misra, R.K.; Turnbull, C.R.A.; Cromer, R.N.; Gibbons, A.K.; LaSala, A.V.; Ballard, L.M. Below- and above-ground growth of Eucalyptus nitens in a young plantation II. Nitrogen and phosphorus. For. Ecol. Manag. 1998, 106, 295–306. [Google Scholar] [CrossRef]
  39. Battaglia, M.; Cherry, M.L.; Beadle, C.L.; Sands, P.J.; Hingston, A. Prediction of leaf area index in eucalypt plantations: Effects of water stress and temperature. Tree Physiol. 1998, 18, 521–528. [Google Scholar] [CrossRef] [PubMed]
  40. Liu, Z.; Chen, J.M.; Jin, G.; Qi, Y. Estimating seasonal variations of leaf area index using litterfall collection and optical methods in four mixed evergreen-deciduous forests. Agric. For. Meteorol. 2015, 209, 36–48. [Google Scholar] [CrossRef]
  41. Xavier, A.C.; Soares, J.V.; Almeida, A.C. Variação do índice de área foliar em clones de eucalipto ao longo de seu ciclo de crescimento. Rev. Árvore 2002, 26, 7. [Google Scholar] [CrossRef]
  42. Otto, M.S.G.; Hubbard, R.M.; Binkley, D.; Stape, J.L. Dominant clonal Eucalyptus grandis × urophylla trees use water more efficiently. For. Ecol. Manag. 2014, 328, 117–121. [Google Scholar] [CrossRef]
  43. Barros, N.F.; Novais, R.F.; Neves, J.C.L. Recomendação de fertilizantes minerais em plantios de eucalipto. In Nutrição e Fertilização Florestal; Gonçalves, J.L.M., Benedetti, V., Eds.; IPEF: Piracicaba, Brazil, 2000; pp. 270–283. [Google Scholar]
  44. Epstein, E.; Bloom, A.J. Nutrição Mineral de Plantas: Princípios E Perspectivas; Editora Planta: Londrina, Brazil, 2006; p. 403. [Google Scholar]
  45. Xu, D.; Dell, B.; Malajczuk, N.; Gong, M. Effects of P fertilisation on productivity and nutrient accumulation in a E. grandis x urophylla plantation in southern China. For. Ecol. Manag. 2002, 161, 89–100. [Google Scholar] [CrossRef]
  46. Xu, D.; Dell, B.; Yang, Z.; Malajczuk, N.; Gong, M. Effects of phosphorus application on productivity and nutrient accumulation of a Eucalyptus urophylla plantation. J. Trop. For. Sci. 2005, 17, 447–461. [Google Scholar]
  47. Novais, R.F.; Barros, N.F.; Neves, J.C.L. Interpretação de análise química do solo para o crescimento e desenvolvimento de Eucalyptus spp.:Níveis críticos de implantação e manutenção. Rev. Árvore 1986, 10, 105–111. [Google Scholar]
  48. Almeida, J.C.R. Nutrição, crescimento, eficiência de uso de água e de nutrientes em povoamentos de Eucalyptus grandis fertilizados com potássio e sódio. In Tese—Escola Superior de Agricultura Luiz de Queiroz; Universidade de São Paulo: Piracicaba, Brazil, 2009. [Google Scholar]
  49. Laclau, J.-P.; da Silva, E.A.; Lambais, G.R.; Bernoux, M.; le Maire, G.; Stape, J.L.; Bouillet, J.-P.; de Moraes Goncalves, J.L.; Jourdan, C.; Nouvellon, Y. Dynamics of soil exploration by fine roots down to a depth of 10 m throughout the entire rotation in Eucalyptus grandis plantations. Front. Plant Sci. 2013, 4, 1–10. [Google Scholar] [CrossRef] [PubMed] [Green Version]
  50. Stape, J.L.; Binkley, D.; Ryan, M.G.; Fonseca, S.; Loos, R.A.; Takahashi, E.N.; Silva, C.R.; Silva, S.R.; Hakamada, R.E.; Ferreira, J.M.D.; et al. The Brazil Eucalyptus potential productivity project: Influence of water, nutrients and stand uniformity on wood production. For. Ecol. Manag. 2010, 259, 1684–1694. [Google Scholar] [CrossRef]

