1. Introduction
Oak is the largest tree species in China [
1]. Mongolian oak (
Quercus mongolica Fisch.) is a main tree species of the secondary broad-leaved forest that grows mainly throughout Northeast China. It not only has economically important value for timber production, but also has the capacity to improve environment, soil and water conservation. Unfortunately, the wood quality of most Mongolian oak in Northeast China is poor because of short clear bole lengths, frequent occurrence of water sprouts and crooked stems. However, the wood quality of Mongolian oak growing in other regions, such as Japan, is excellent, and its wood has been widely used and also exported internationally [
2]. These facts indicate that the Mongolian oak growing in Northeast China has a potential to grow well like those species in Japan if adequate silvicultural treatments are applied. Forest management requires growth and yield models that enable prediction of the development of forest stands under different silvicultural systems. To overcome the negative effects of clearcutting, uneven-aged selection management has been practiced in Northeast China [
3]. The selection management needs the individual tree growth and yield models because they provide good simulation of growth and mortality for short-term projections, produce detailed information about stand structure and allow consideration of a wide variety of silvicultural treatments. However, there are no individual tree growth models of Mongolian oak forests for good forest management with the exception of the integrated stand growth model developed by using system equations [
4].
Diameter growth and mortality models are basic components of individual tree growth modeling. Diameter at breast height (
DBH) is the most important and the easiest tree factor to measure. Based on
DBH, we can directly calculate stand basal area. In addition, because there is a strong relationship between
DBH and tree height and volume, tree height and volume can be calculated through tree height-
DBH curve and volume equation. Therefore, the establishment of a diameter growth model for forest growth forecast is of great significance. On the other hand, mortality is an important growth process in maintaining the population dynamic changes, species diversity, and structure diversity. A mortality model is important to understand forest evolution, and thus an essential component of the growth and yield models. Both individual tree diameter growth equations and mortality models have been largely used to predict annual or periodic growth and mortality of trees [
5,
6,
7,
8,
9,
10,
11,
12,
13,
14,
15,
16,
17,
18]. Furthermore, from a biological perspective, the diameter growth and mortality equations of individual-tree growth model are related. Due to the highly internal correlation of these two equations, we can obtain more accurate and compatible parameter estimation through the establishment of joint estimation of simultaneous equations using nonlinear three stage least squares (N3SLS) and seemingly unrelated regression (SUR), which has been widely applied in forest growth and yield modeling [
11,
19,
20,
21,
22,
23,
24].
Therefore, the objective of this study was to develop nonlinear equations for individual tree diameter growth and mortality through simultaneous equations, in order to obtain more accurate and compatible parameter estimation for reasonable management of natural Mongolian oak forest in Northeast China. N3SLS and SUR were examined and compared with the traditional individual tree diameter growth and mortality equations based on maximum likelihood estimation (MLE).
2. Materials and Methods
2.1. Data
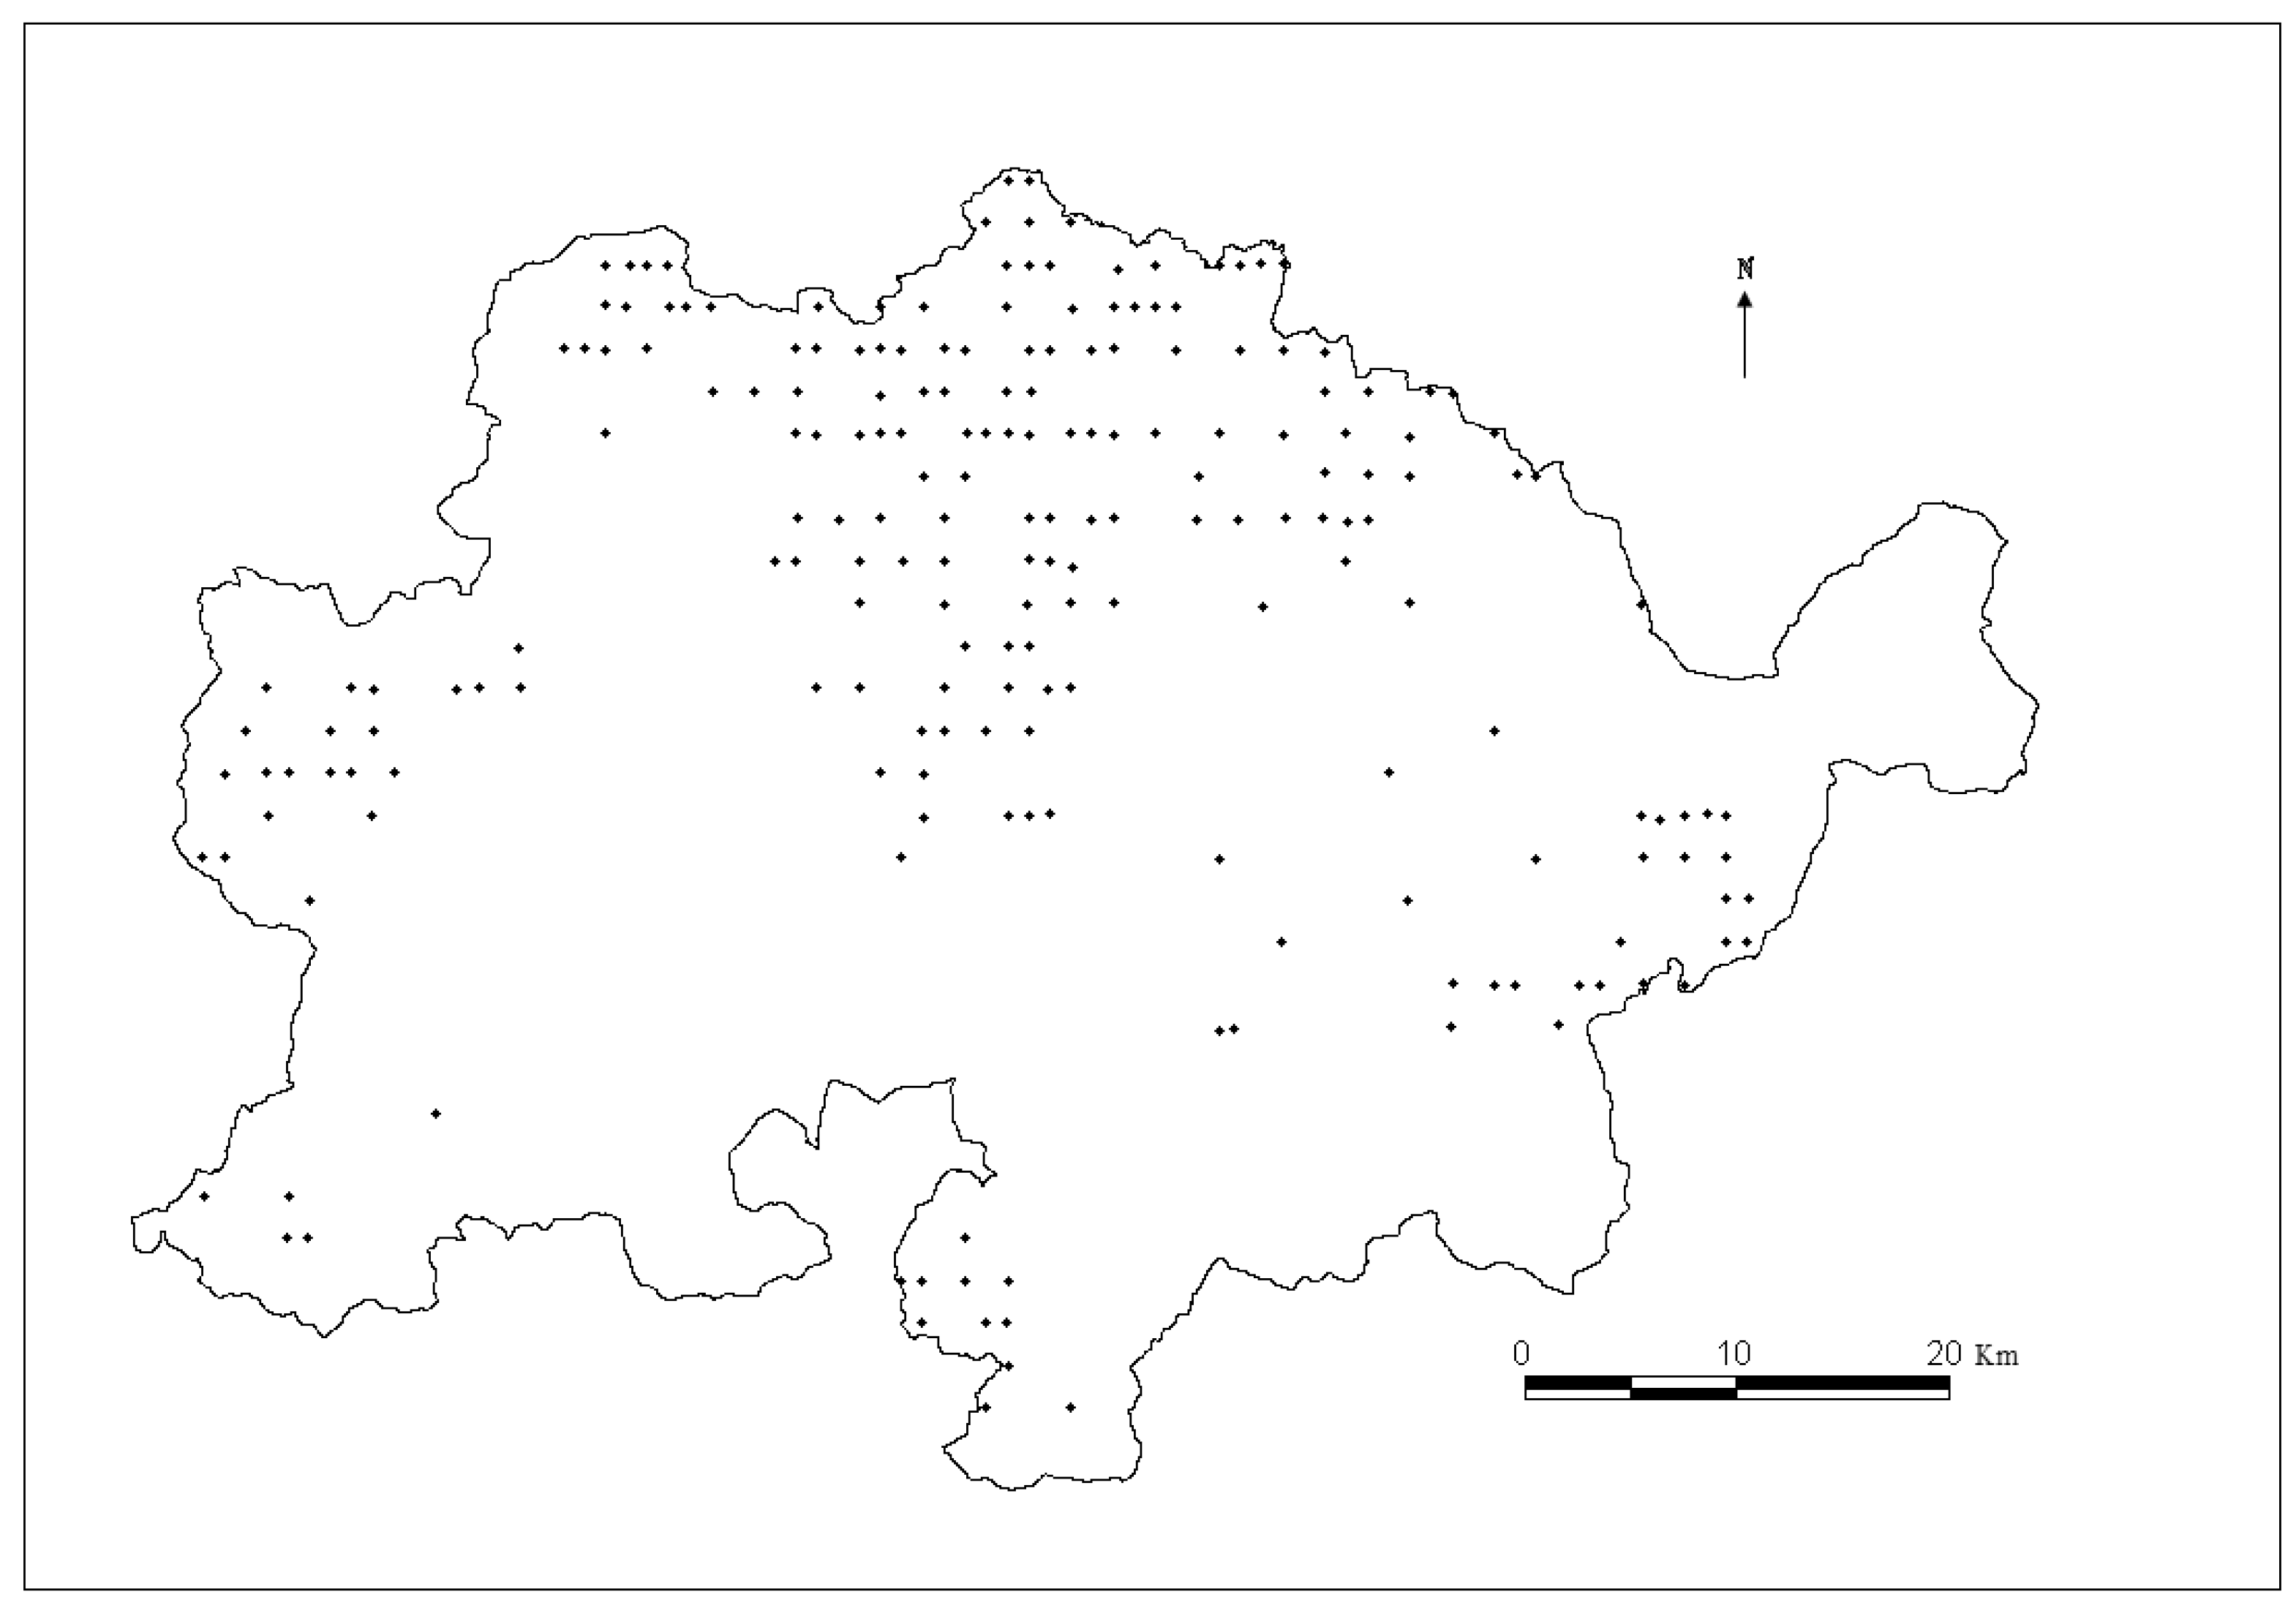
The data used to develop individual-tree diameter growth and mortality models for predicting natural Mongolian oak were collected from 195 re-measured permanent sample plots (PSP) in Wangqing Forestry Bureau, Jilin Province, Northeast China (
Figure 1). The area of each plot was 0.06 hm
2 and all of the plots were natural pure forests. These PSPs were selected using the following criteria: tree- and stand-level characteristics of these sample plots have been remeasured periodically with an interval of ten years from 1997 to 2007, and plots are located in forests without any evidence of silvicultural treatments or any other forms of human interference, such as cutting and artificial regeneration. One hundred and sixty plots were selected for model calibration, and the rest 35 plots were for model validation. On each sample plot, physical site attributes were collected including geographic coordinates, slope, aspect, and elevation. Trees with
DBH above 5 cm were measured with species, diameter, and status (recruitment, live, or dead). In total, we received 13,360 observations. For each plot, we calculated the following stand or tree factors: stand basal area (
BA), number of trees per hectare (
N), stand density index (
SDI), stand quadratic diameter and its increment (
ΔDq), and competition index.
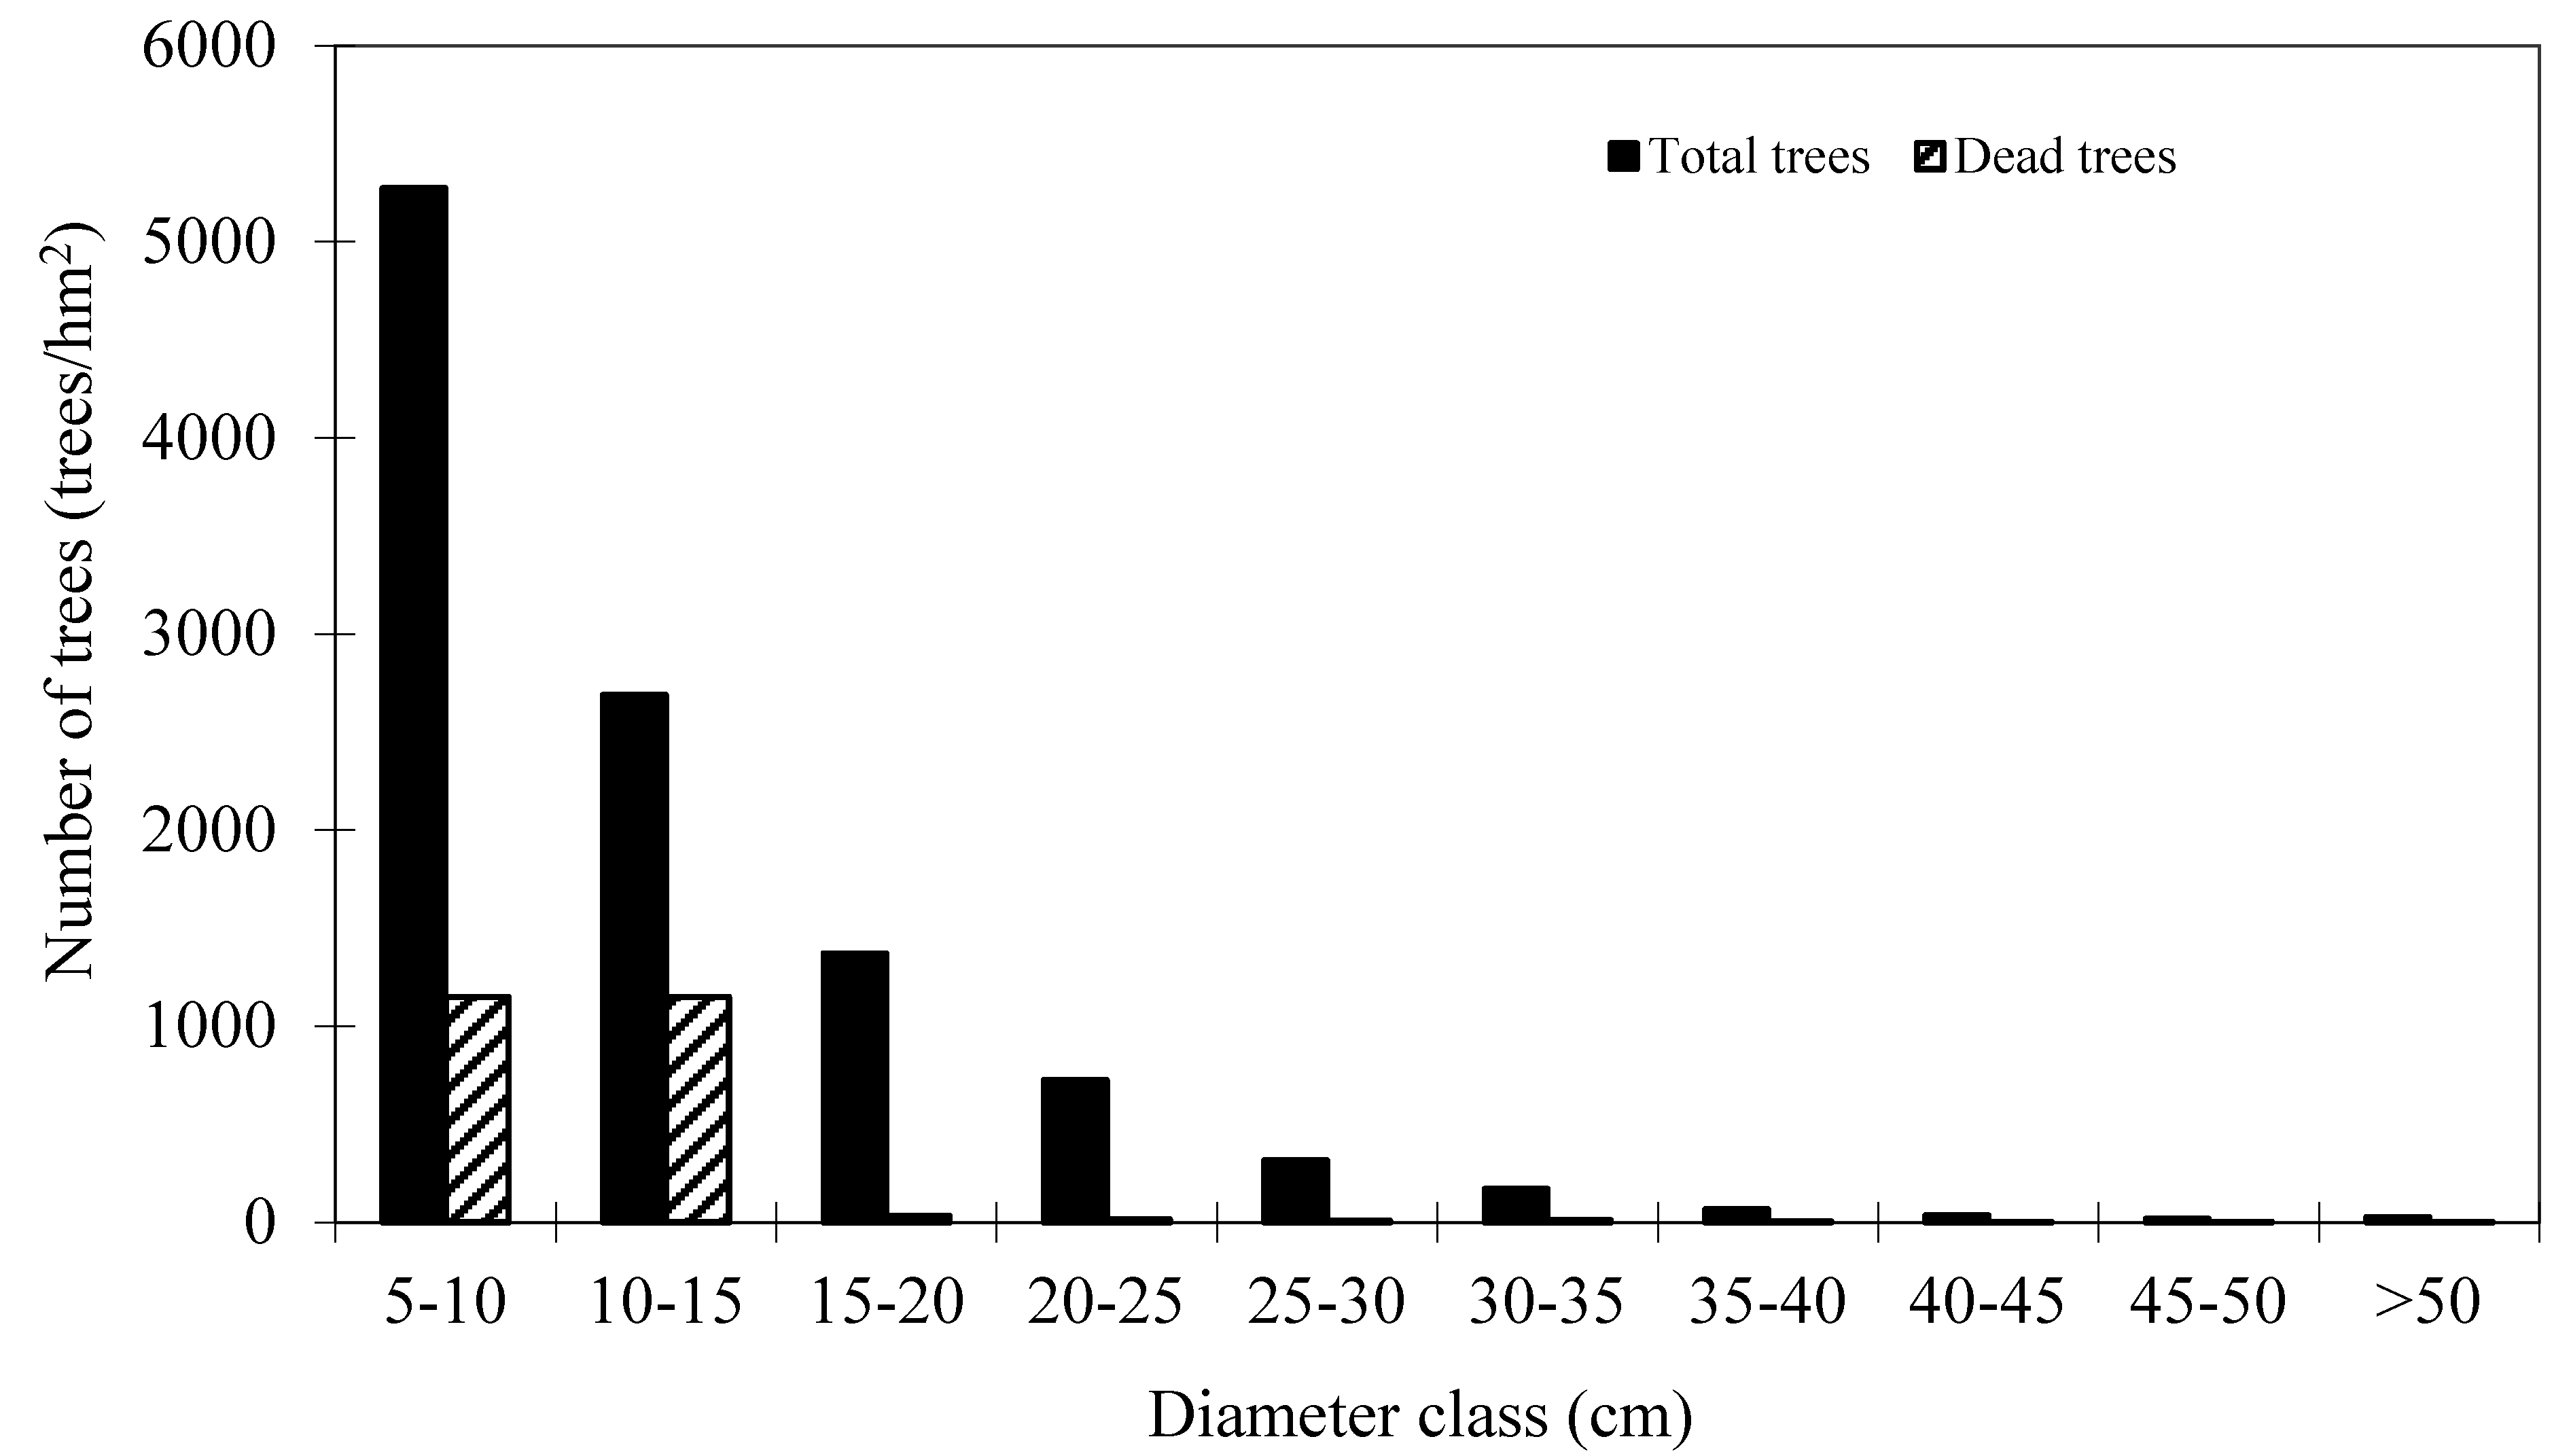
Summary statistics of tree and plot level variables for model calibration are shown in
Table 1. These plots are good representative for the research site. Mortality occurred in 152 plots out of 160 plots. The distribution of total trees and dead trees by diameter classes is shown in
Figure 2, which indicates that mortality mainly occurred in the small diameter classes.
Figure 1.
Map of Mongolian oak plots distribution in Wangqing Forestry Bureau, Northeast China.
Figure 1.
Map of Mongolian oak plots distribution in Wangqing Forestry Bureau, Northeast China.
Figure 2.
Distribution of total trees and dead trees by diameter classes of Mongolian oak.
Figure 2.
Distribution of total trees and dead trees by diameter classes of Mongolian oak.
Table 1.
Summary statistics of tree- and plot-level variables for model calibration of Mongolian oak in Wangqing Forestry Bureau, Northeast China (n = 10,698).
Table 1.
Summary statistics of tree- and plot-level variables for model calibration of Mongolian oak in Wangqing Forestry Bureau, Northeast China (n = 10,698).
| Variable | Max. | Min. | Mean | Std. |
|---|
| DBH (cm) | 72.0 | 5.1 | 12.9 | 7.3 |
| BA (m2/hm2) | 42.15 | 5.81 | 23.68 | 5.42 |
| SDI (stems/hm2) | 1362 | 237 | 848 | 207 |
| N (stems/hm2) | 3067 | 533 | 1643 | 570 |
| ΔDq (cm) | 4.00 | 0.42 | 1.53 | 0.57 |
2.2. Model Development
The usually identified components of individual-tree growth models are diameter (or basal area) increment, mortality, and recruitment [
25]. Recruitment was not considered in the present study. At first, diameter growth and mortality models are established separately by maximum likelihood estimation, then due to the internal correlation of these two equations, simultaneous equations are built to obtain more accurate and compatible parameter estimation by three-stage least squares (N3SLS) [
22] and seemingly unrelated regression (SUR) [
23].
2.2.1. Diameter Growth Model
The diameter growth model predicts increment as a function of different variables describing tree size, competition and site conditions [
13]. After the test of a variety of forms of diameter growth equations, the individual tree diameter growth adding one in ten years (
Δd+1) was selected as the predicted variable. The potential explanatory variables and their transformation were tested:
Tree size: tree diameter at breast height (DBH).
Distance-independent competition indices (COMP): basal area larger than subject trees (BAL), the ratio of objective tree’s DBH and average DBH from stand basal area (RD), stand basal area per hectare (BA), number of trees per hectare (N), stand density index (SDI), the square sum of tree’s diameter bigger than objective tree (DL), the ratio of objective tree’s DBH and the biggest tree’s DBH (DDM).
Site: site condition which is a composited function of slope, aspect, altitude [
26] and site index which is the stand mean height at reference age and computed as Equation (1) [
27] since no dominant height was available in both class A and B inventory in China.
where
H is stand mean height,
T is stand mean age.
The model of periodical diameter growth within ten years (
Δd+1) was expressed as Equation (2):
Non-significant variables were removed in the modeling process. In order to avoid multicollinearity, the value of the variance inflation factor (
VIF) was computed for the groups of variables that best predicted. Those alternatives with a
VIF larger than 10 were rejected, as suggested by Myers and Kutner
et al. [
28,
29].
2.2.2. Mortality Model
The possibility of a tree dying in next 10 years was modeled by using logistic function Equation (3), which is widely applied for tree mortality [
14,
15,
16,
17]. The candidate variables for the mortality model were numerous and diverse. Hamilton classified such variables in four groups: measures of individual tree size, tree competition, tree vitality and measures of stand density [
18]. Several possibilities for transformation of this variable exist and have been applied [
15,
18,
30,
31,
32]. Only significant variables (
p < 0.05) with
VIF less than 10 were selected.
where
Pi is the probability of tree mortality,
b0–bn are parameters to be estimated and
x1–xn are explanatory variables.
2.3. Simultaneous Systems of Individual Diameter Growth and Mortality Models
Because a strong concomitant relationship exists between (
Δd+1) and
Pi, they used some same tree- and stand-level variables as predictors in both Equation (2) and Equation (3). It is likely to improve projection accuracy and ensure logical consistency. Treated in this manner, Equation (2) and Equation (3) were fitted as a nonlinear simultaneous system. Fitting this simultaneous system using maximum likelihood estimation would result in biased estimates of the coefficients, termed simultaneity bias [
33,
34,
35]. To remove simultaneity bias, the simultaneous system was firstly fitted using nonlinear three-stage least squares (N3SLS) regression, with the following three stages [
24]:
- (1)
Tree- and stand-level variables were used to estimate a first-stage estimate of (Δd+1) ((Δd+ 1)first) with a nonlinear model. Then a first-stage estimate of Pi (Pi first) was developed by the same basic procedure with a binary logistic model.
- (2)
Some same or different tree- and stand-level variables were taken as predictor variables in both Equation (2) and Equation (3) in the second stage. Simultaneity bias across simultaneous systems of equations was removed by this. Simultaneous correlation and the correlation of errors, which arise in the two equations of the system, were then estimated by the error terms of these second-stage equations.
- (3)
In the third stage, the estimated simultaneous correlation was used in which a seemingly unrelated regressions approach was taken to fit the two equations as a system.
For comparison, a consistent and asymptotically efficient estimator also was obtained if the system of nonlinear equations was jointly estimated under seemingly unrelated regression SUR directly [
23].
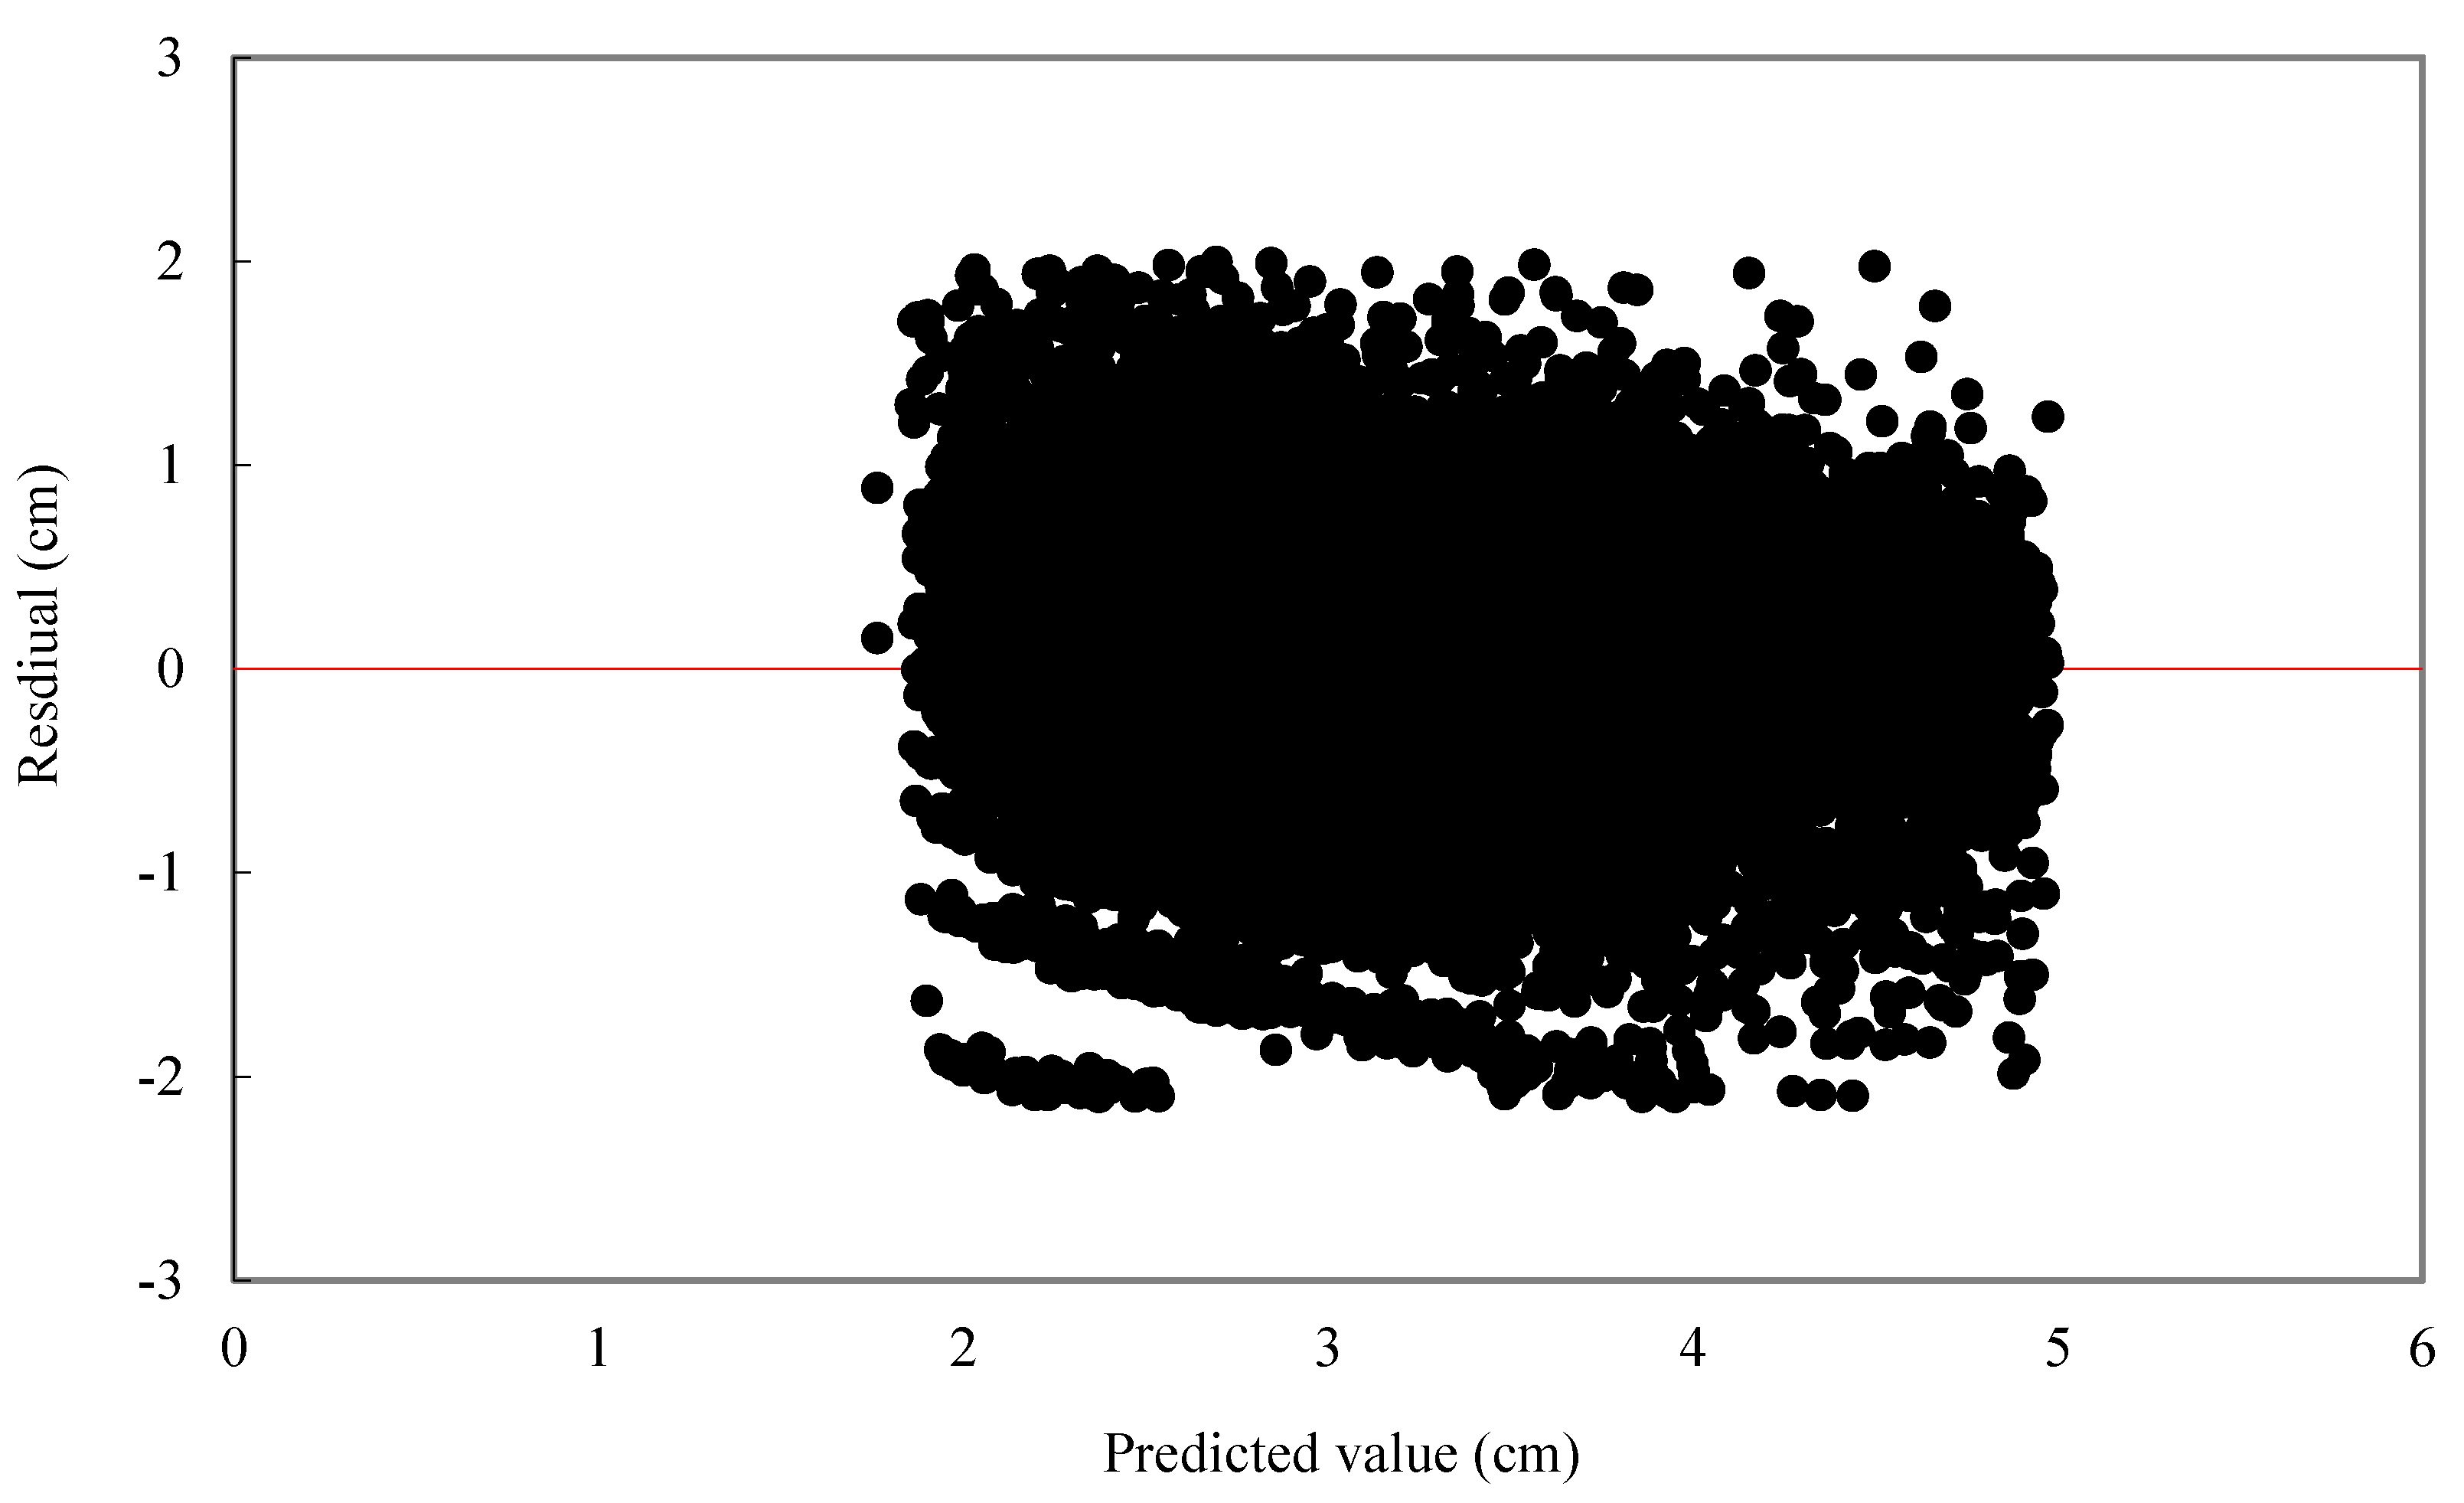
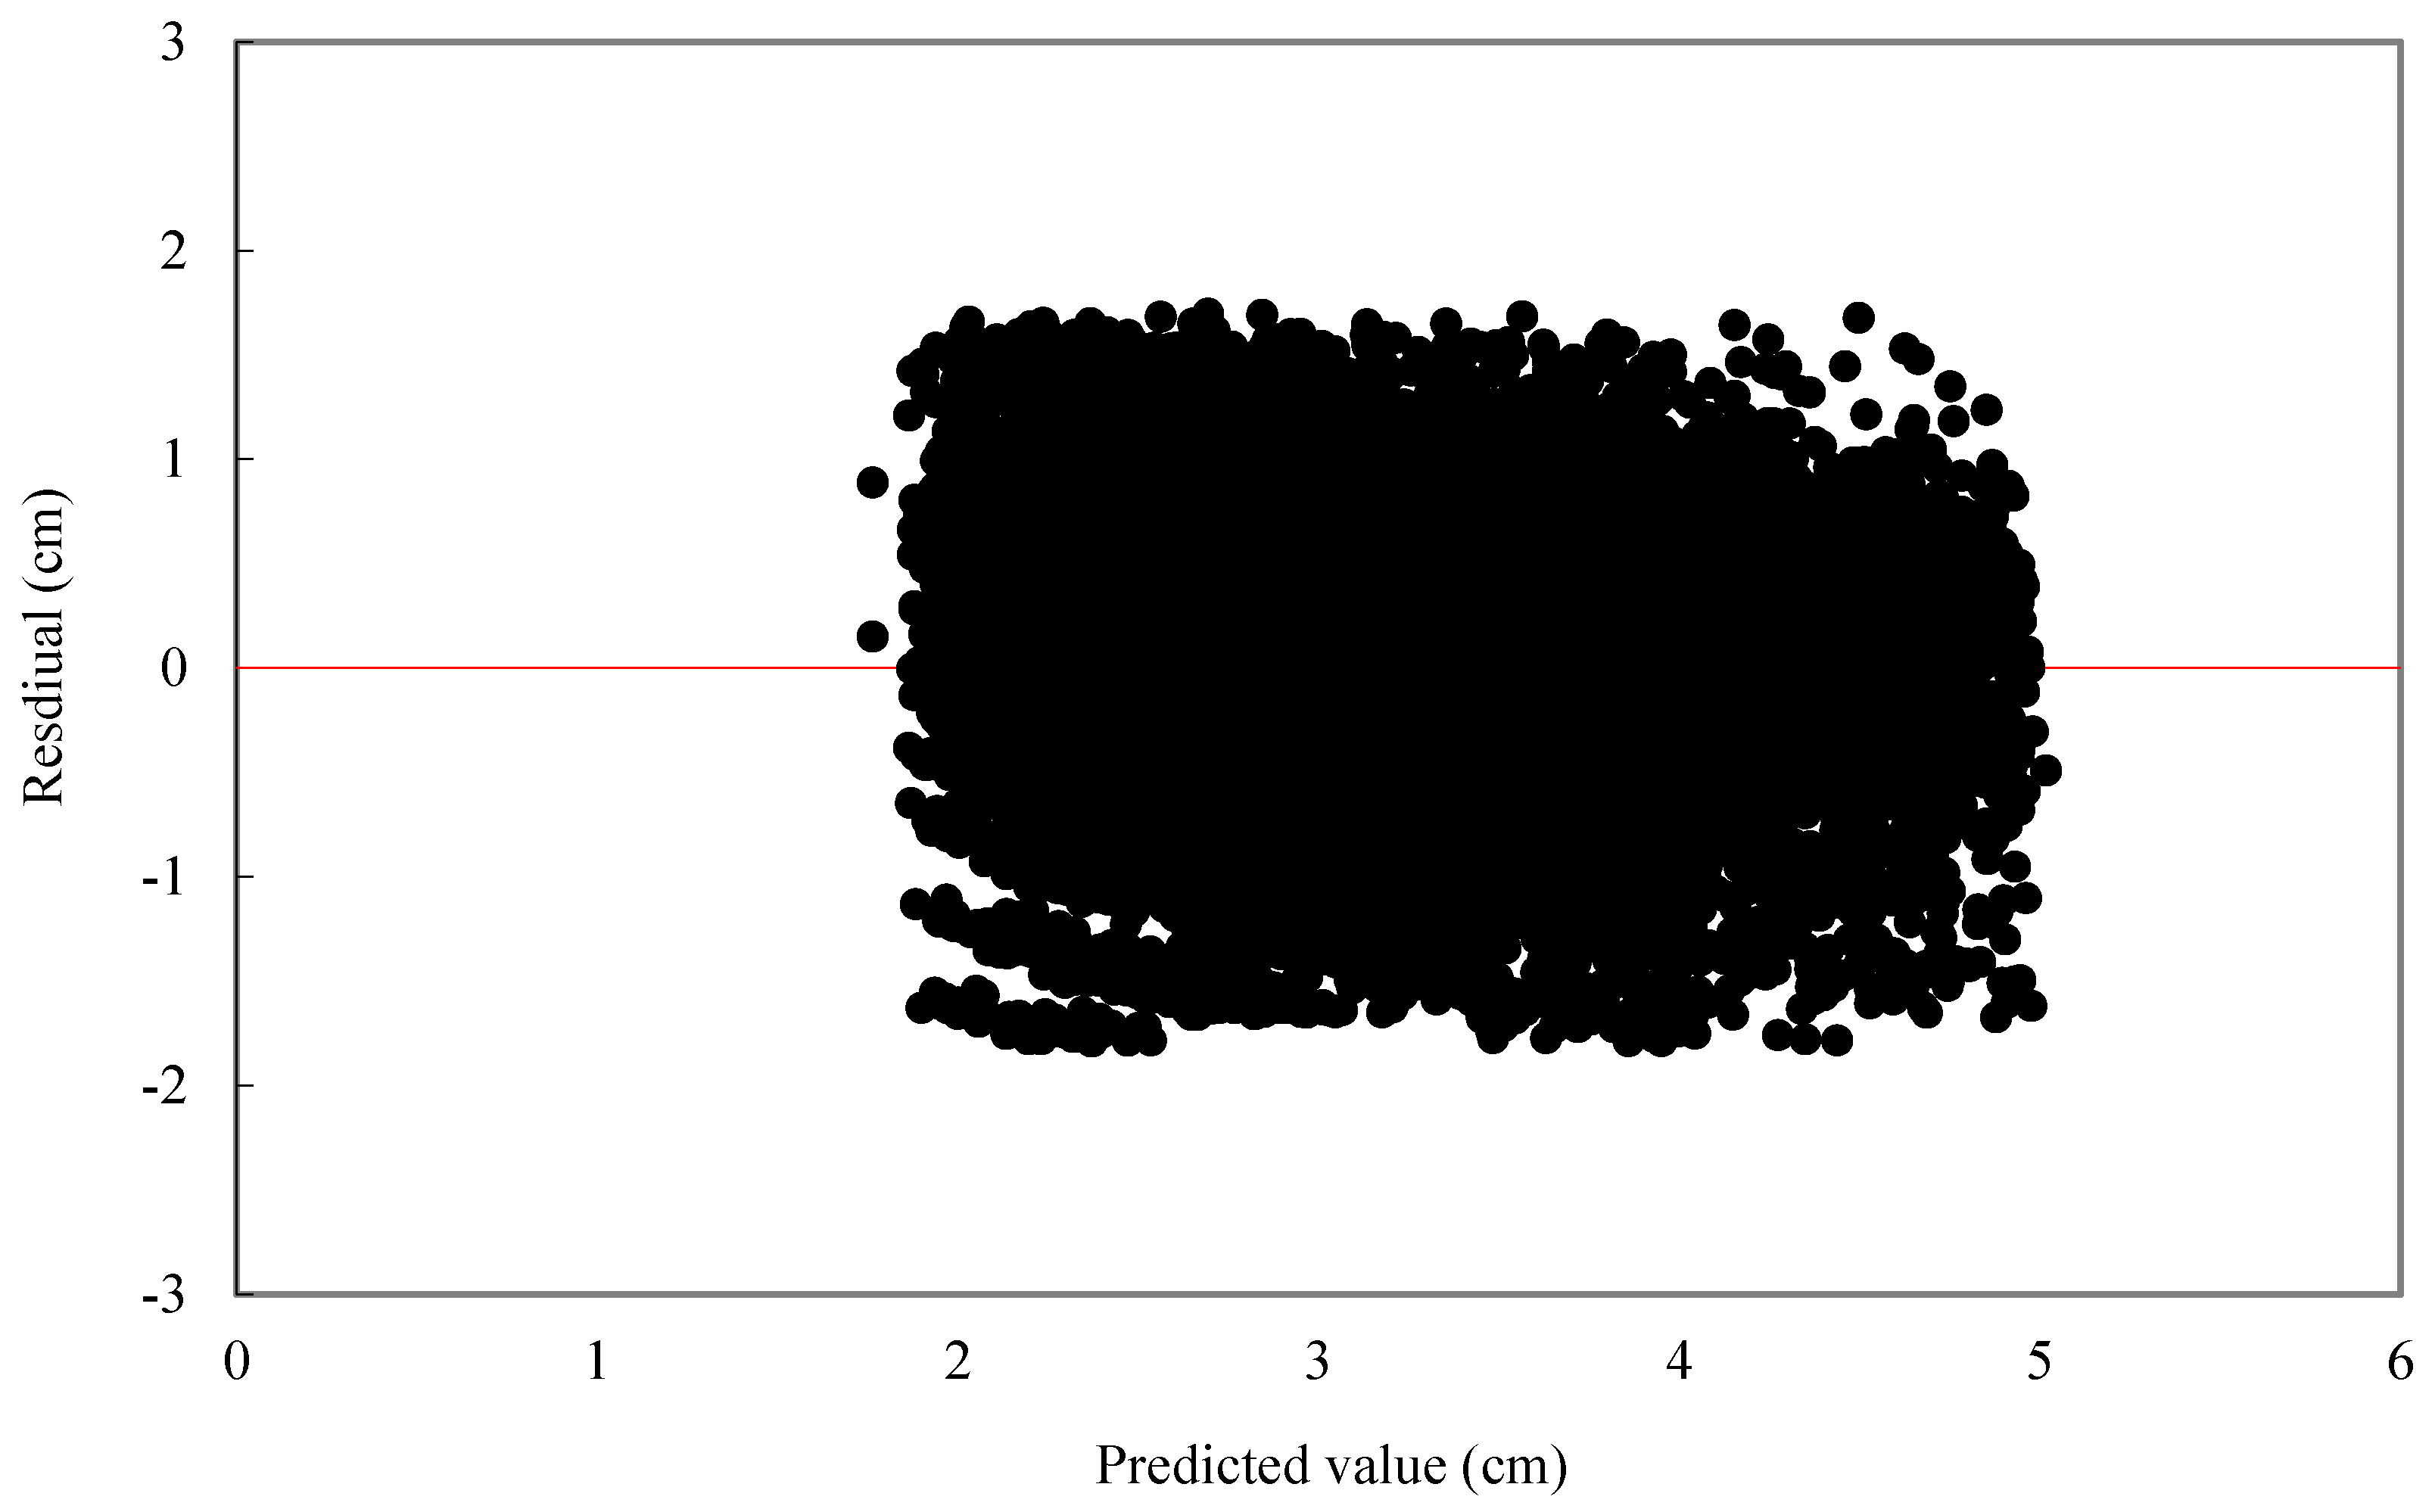
Initial model residual diagnosis showed that there was heterocedasticity for diameter growth equation. To deal with the problem, an additional weighting factor was used. Heterocedasticity residual variance was modeled as a power function of an independent variable [
36,
37]:
. The
q value was subsequently included in the weighting factor (
w) as:
.
2.4. Model Evaluation
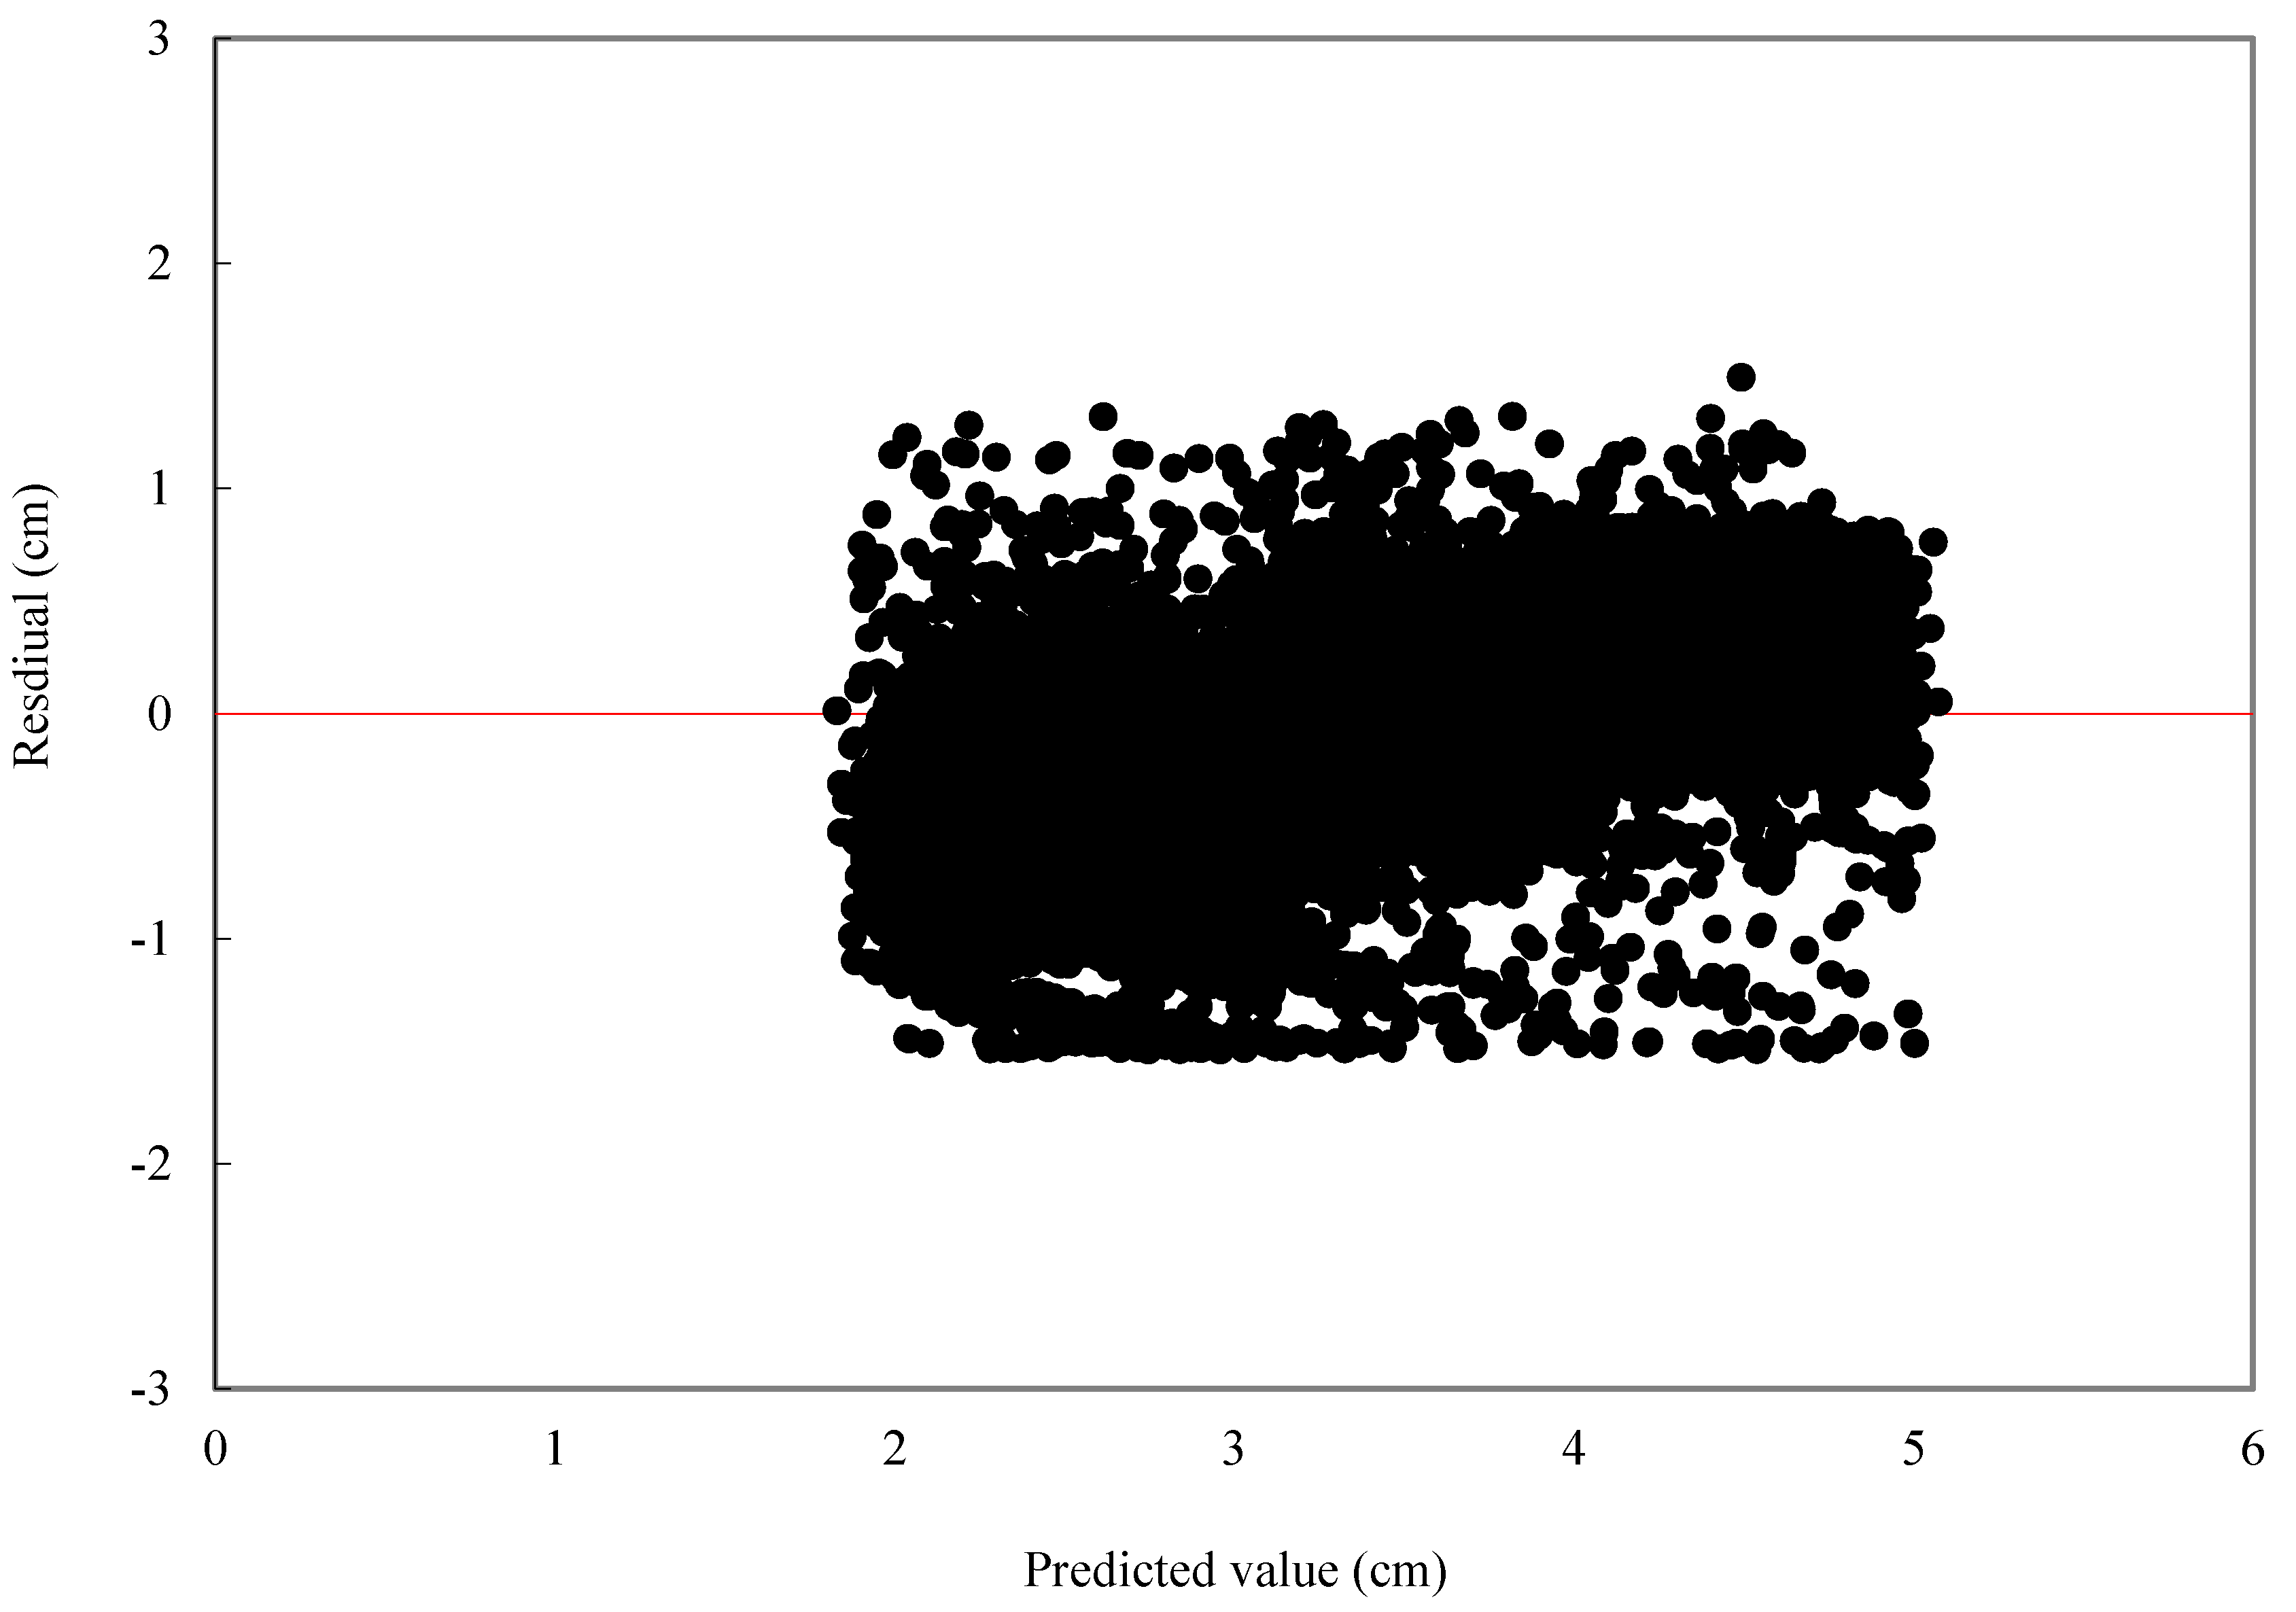
For individual tree diameter growth model, the following statistics were calculated: mean bias (MB) and mean relative bias (MB%), which showed the bias of model prediction, root mean square error (RMSE), and relative root mean square error (RMSE%) which is expressed in the same units as the dependent variable, giving an idea of the mean error when using the model.
Relative root mean square error:
where
is observed value,
is predicted value,
is average value,
n is the number of trees, and
p is the number of parameters.
For individual tree mortality model, a probability threshold has to be determined to assign mortality. If the estimated probability of mortality exceeds the threshold then the tree is considered dead. The principle of using the maximum summary threshold (MST) was used in the study [
38], namely taking the probability threshold when the sum of sensitivity and specificity is maximum (
Table 2). Specificity is the ratio of the number of correctly predicted survived trees and observed survived trees. Sensitivity is the ratio of the number of correctly predicted dead trees and observed dead trees.
Table 2.
Contingency table of the observed values and predicted values.
Table 2.
Contingency table of the observed values and predicted values.
| Item | Predicted Values | Total |
|---|
| Dead Trees | Survived Trees |
|---|
| Observed values | Dead trees | a11 | a12 | A1m |
| Survived trees | a21 | a22 | A2m |
| Total | An1 | An2 | Anm |
| Sensitivity =
a11/A1m | Specificity =
a22/A2m |
Where a11 is the number of correctly predicted dead trees, a12 is the number of incorrectly predicted dead trees, a21 is the number of incorrectly predicted survived trees, a22 is the number of correctly predicted survived trees, A1m is observed dead trees, A2m is observed survived trees, An1 is predicted dead trees, An2 is predicted survived trees, Anm is total trees.
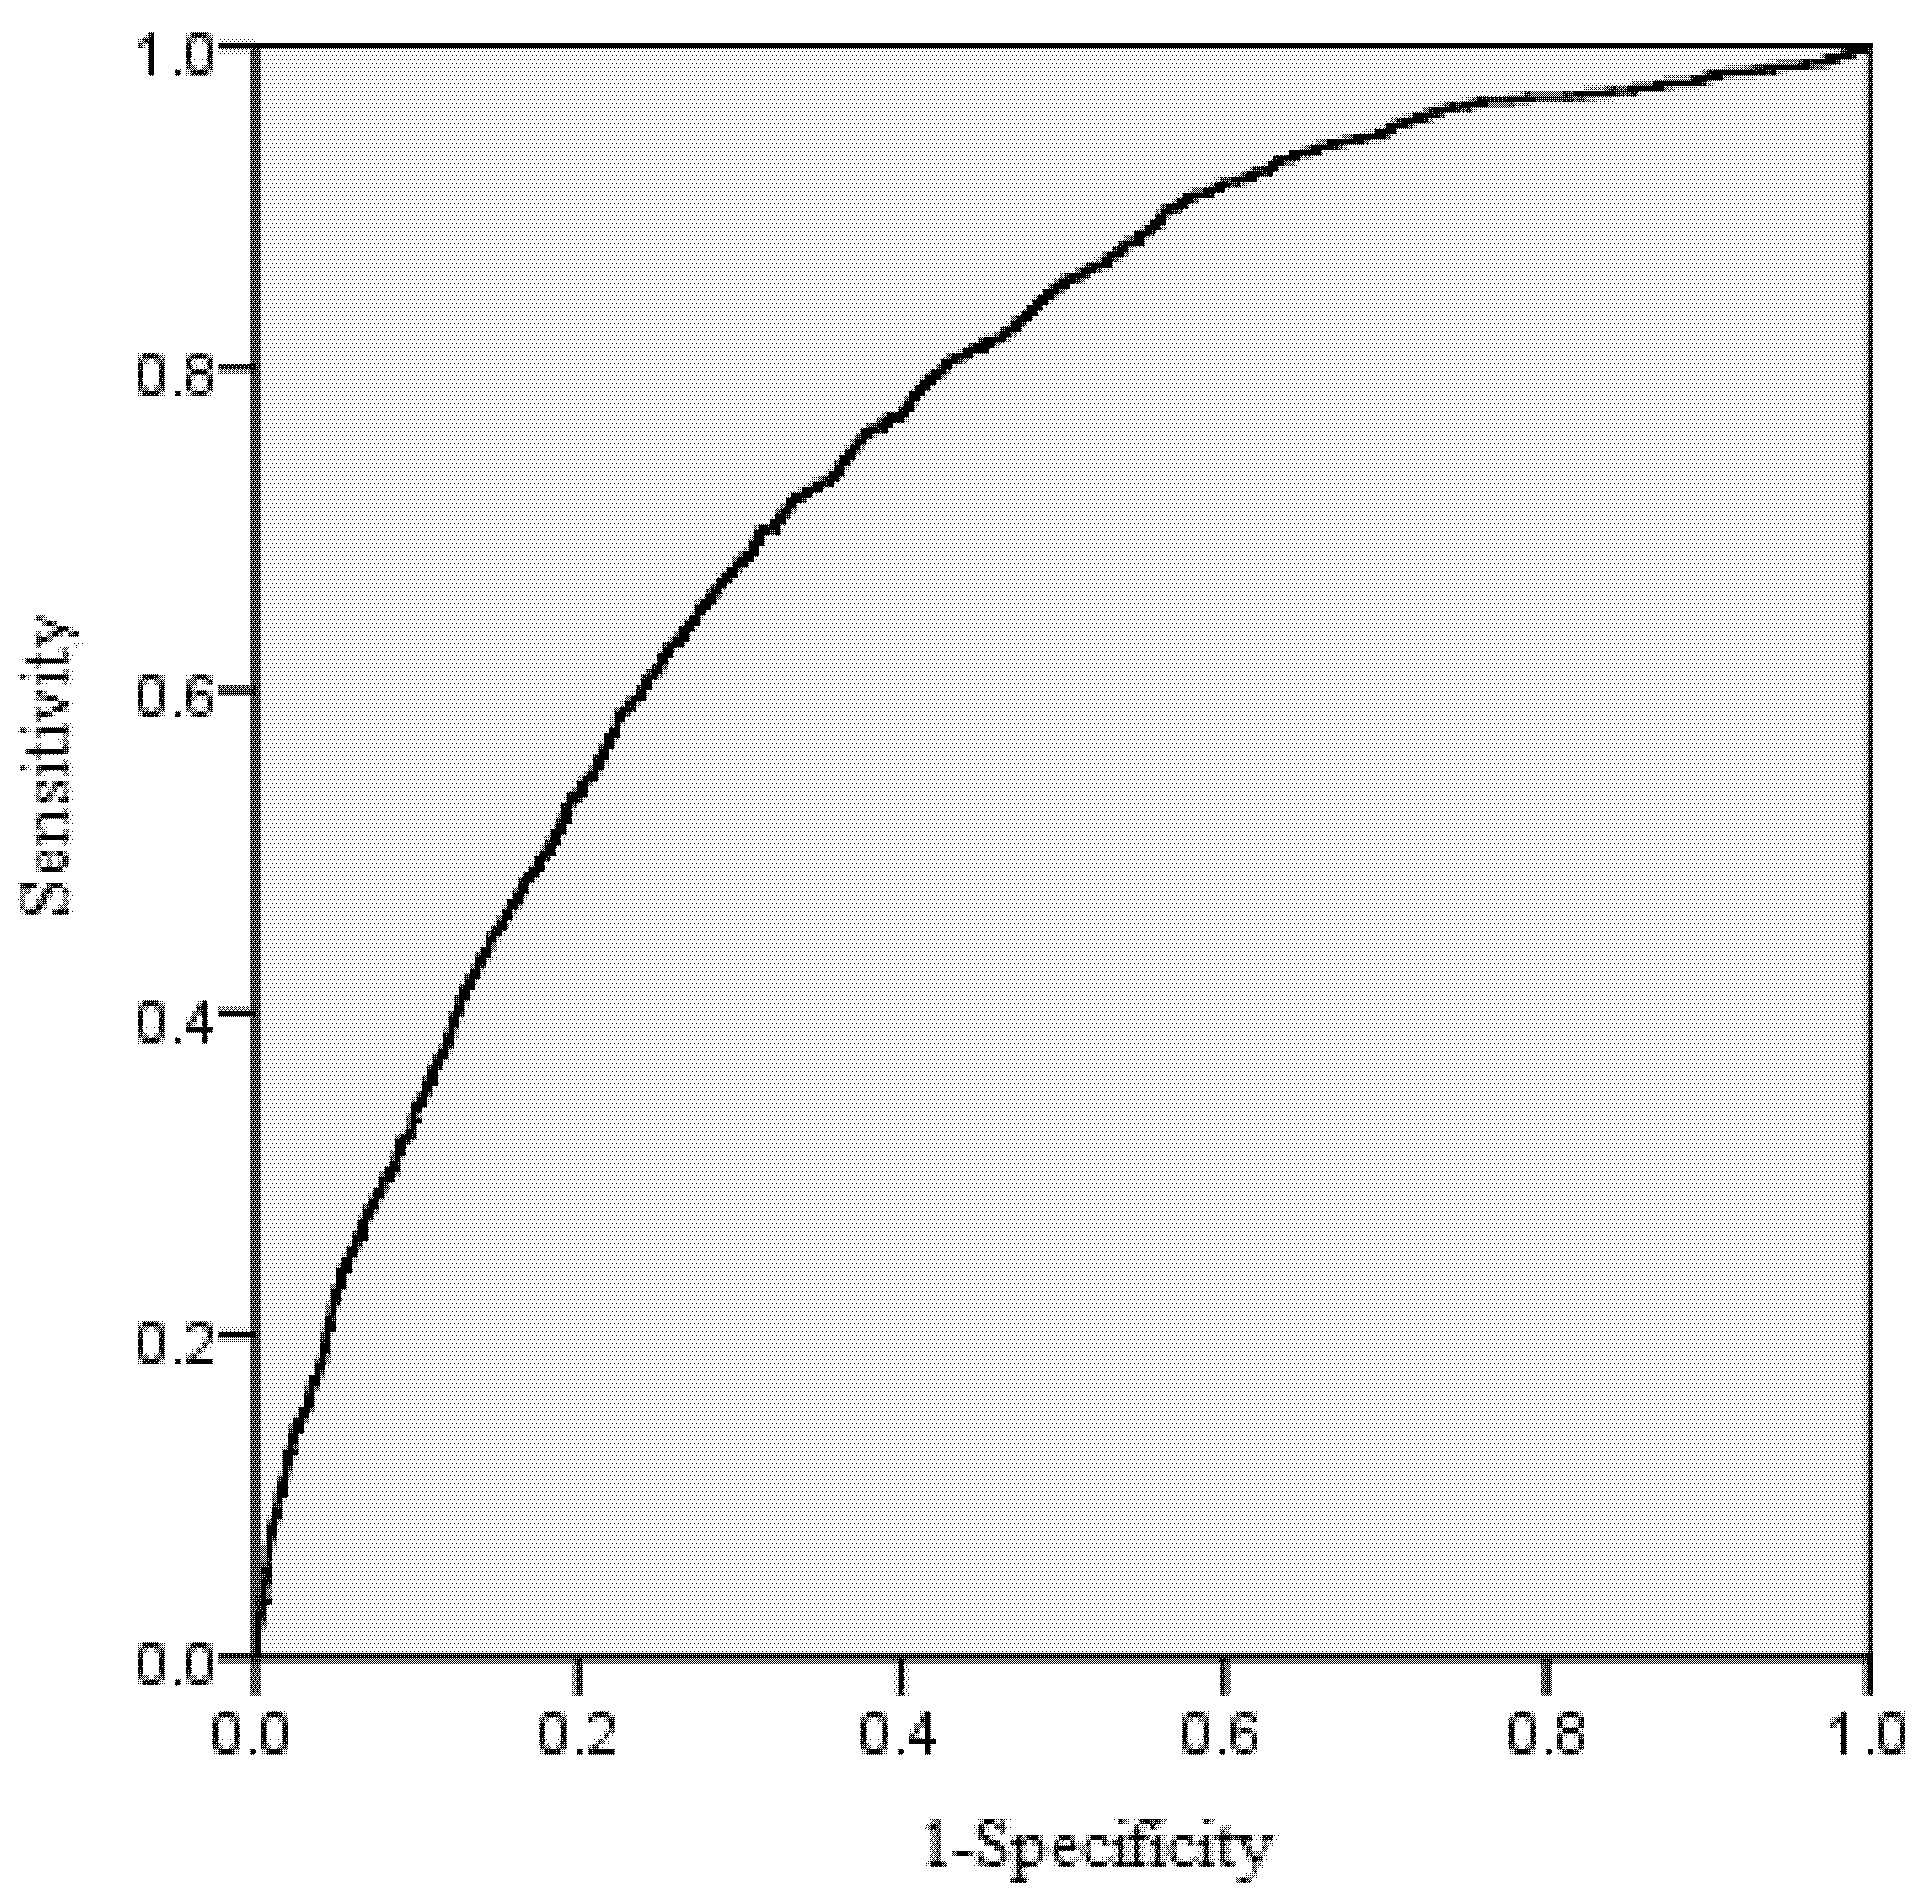
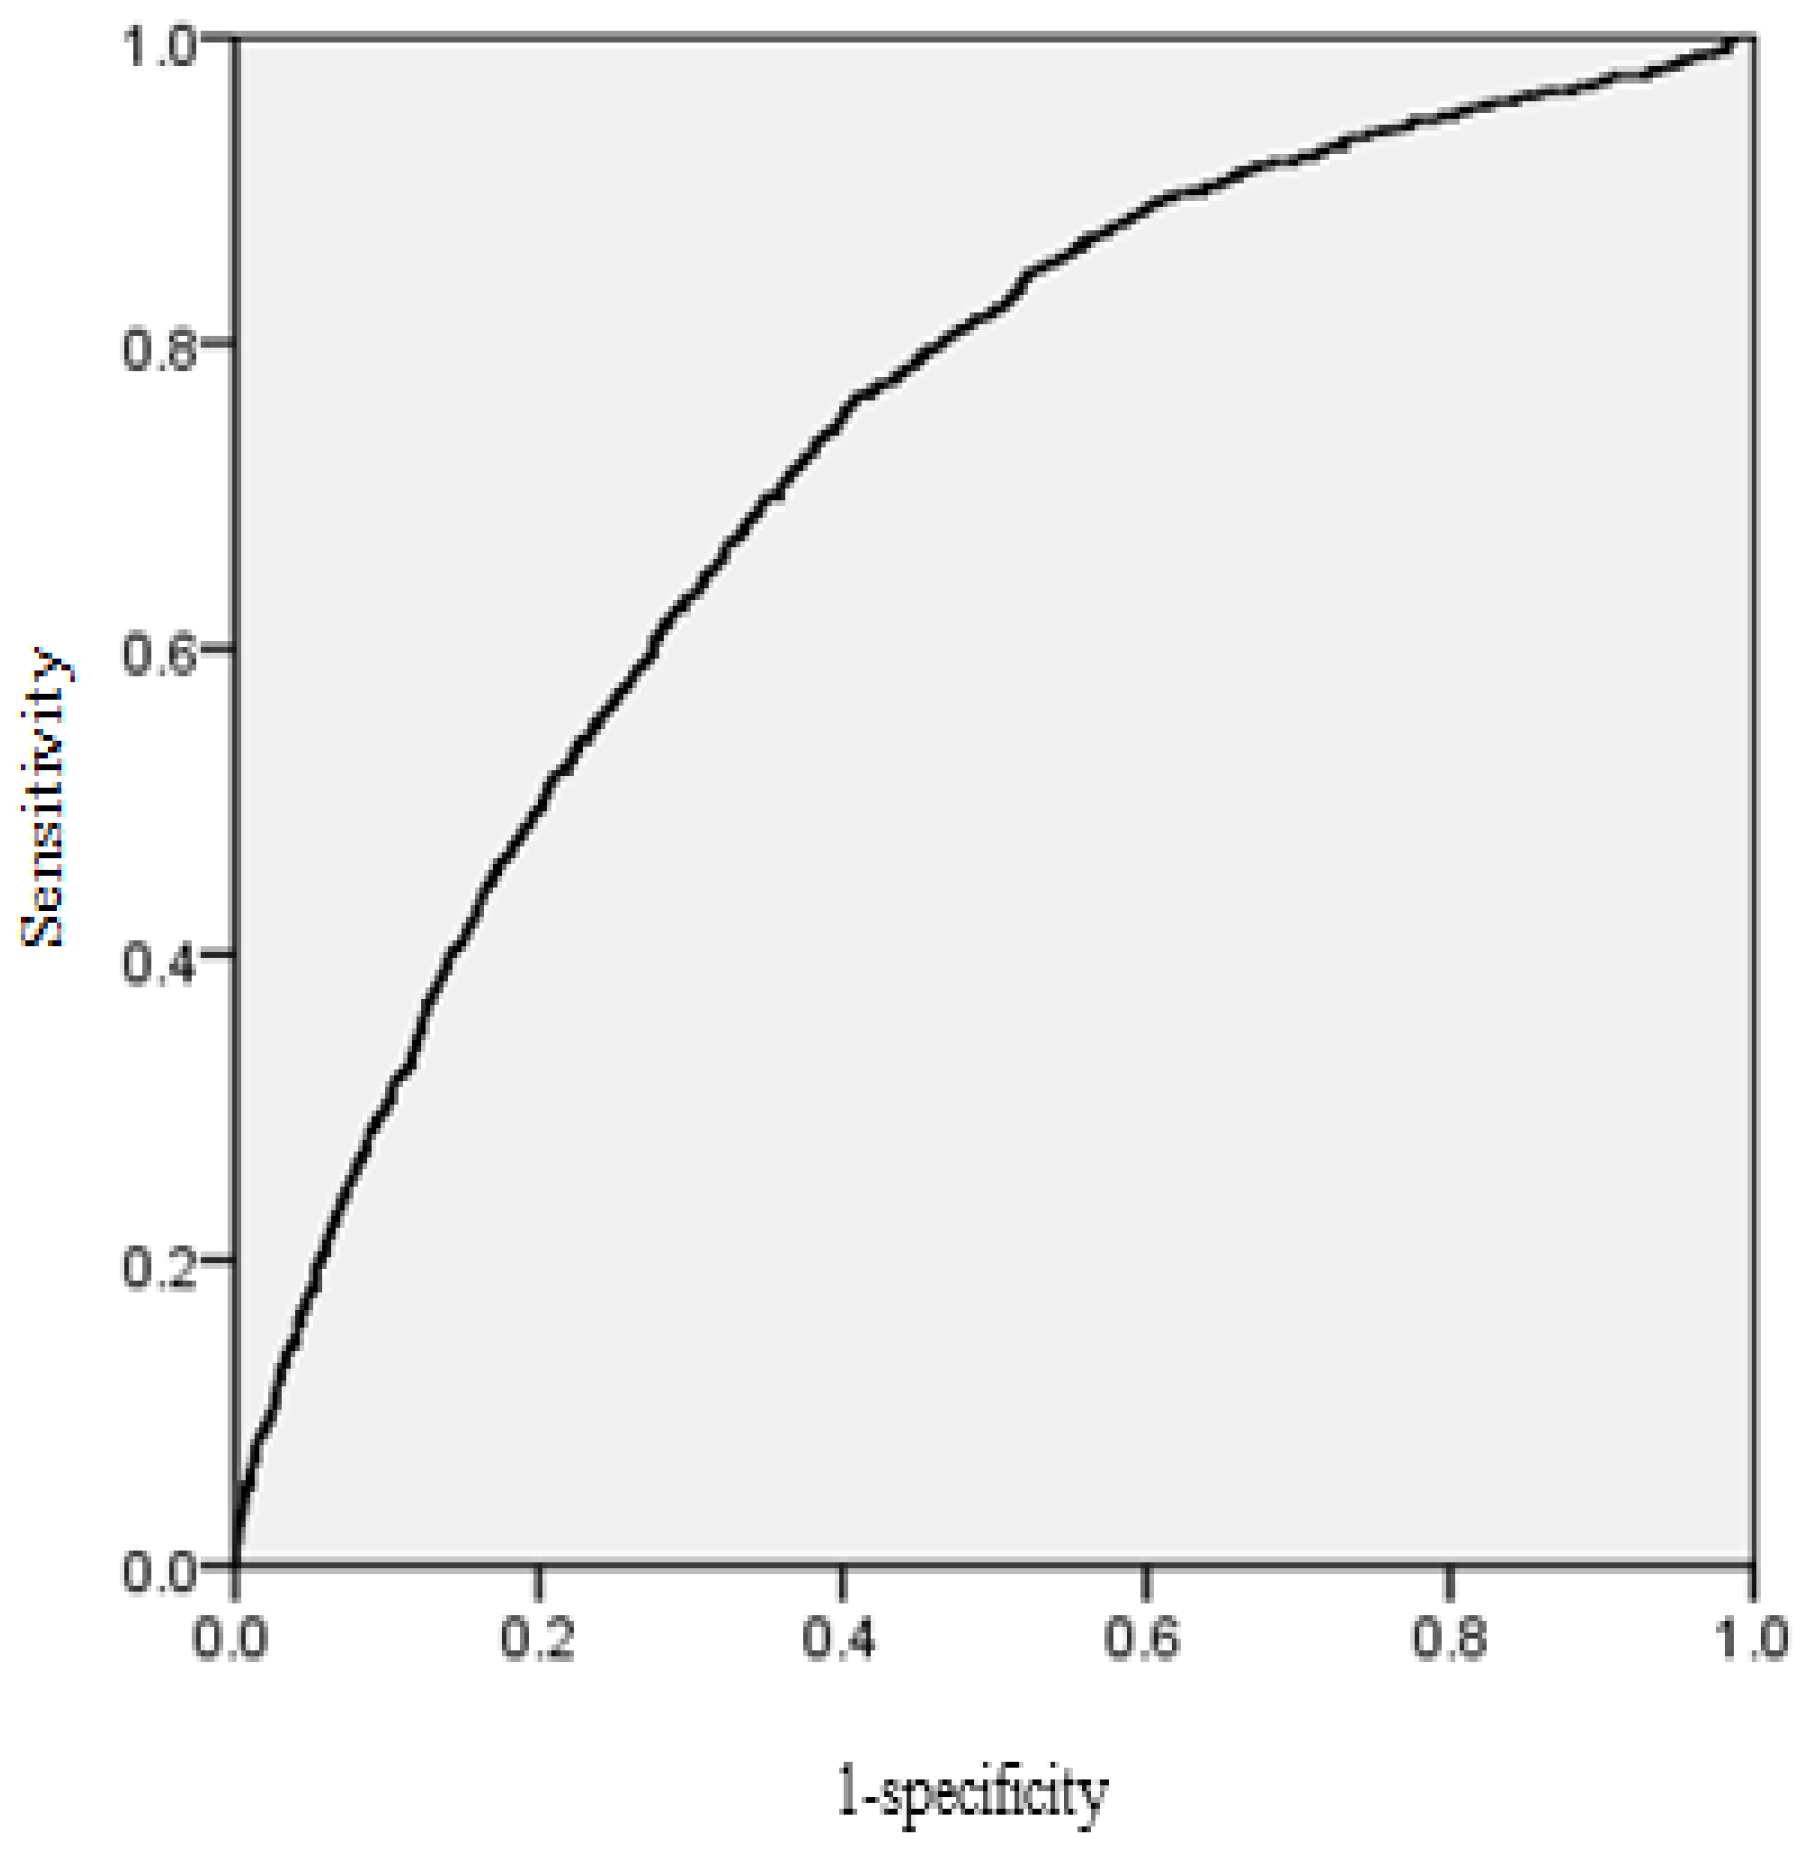
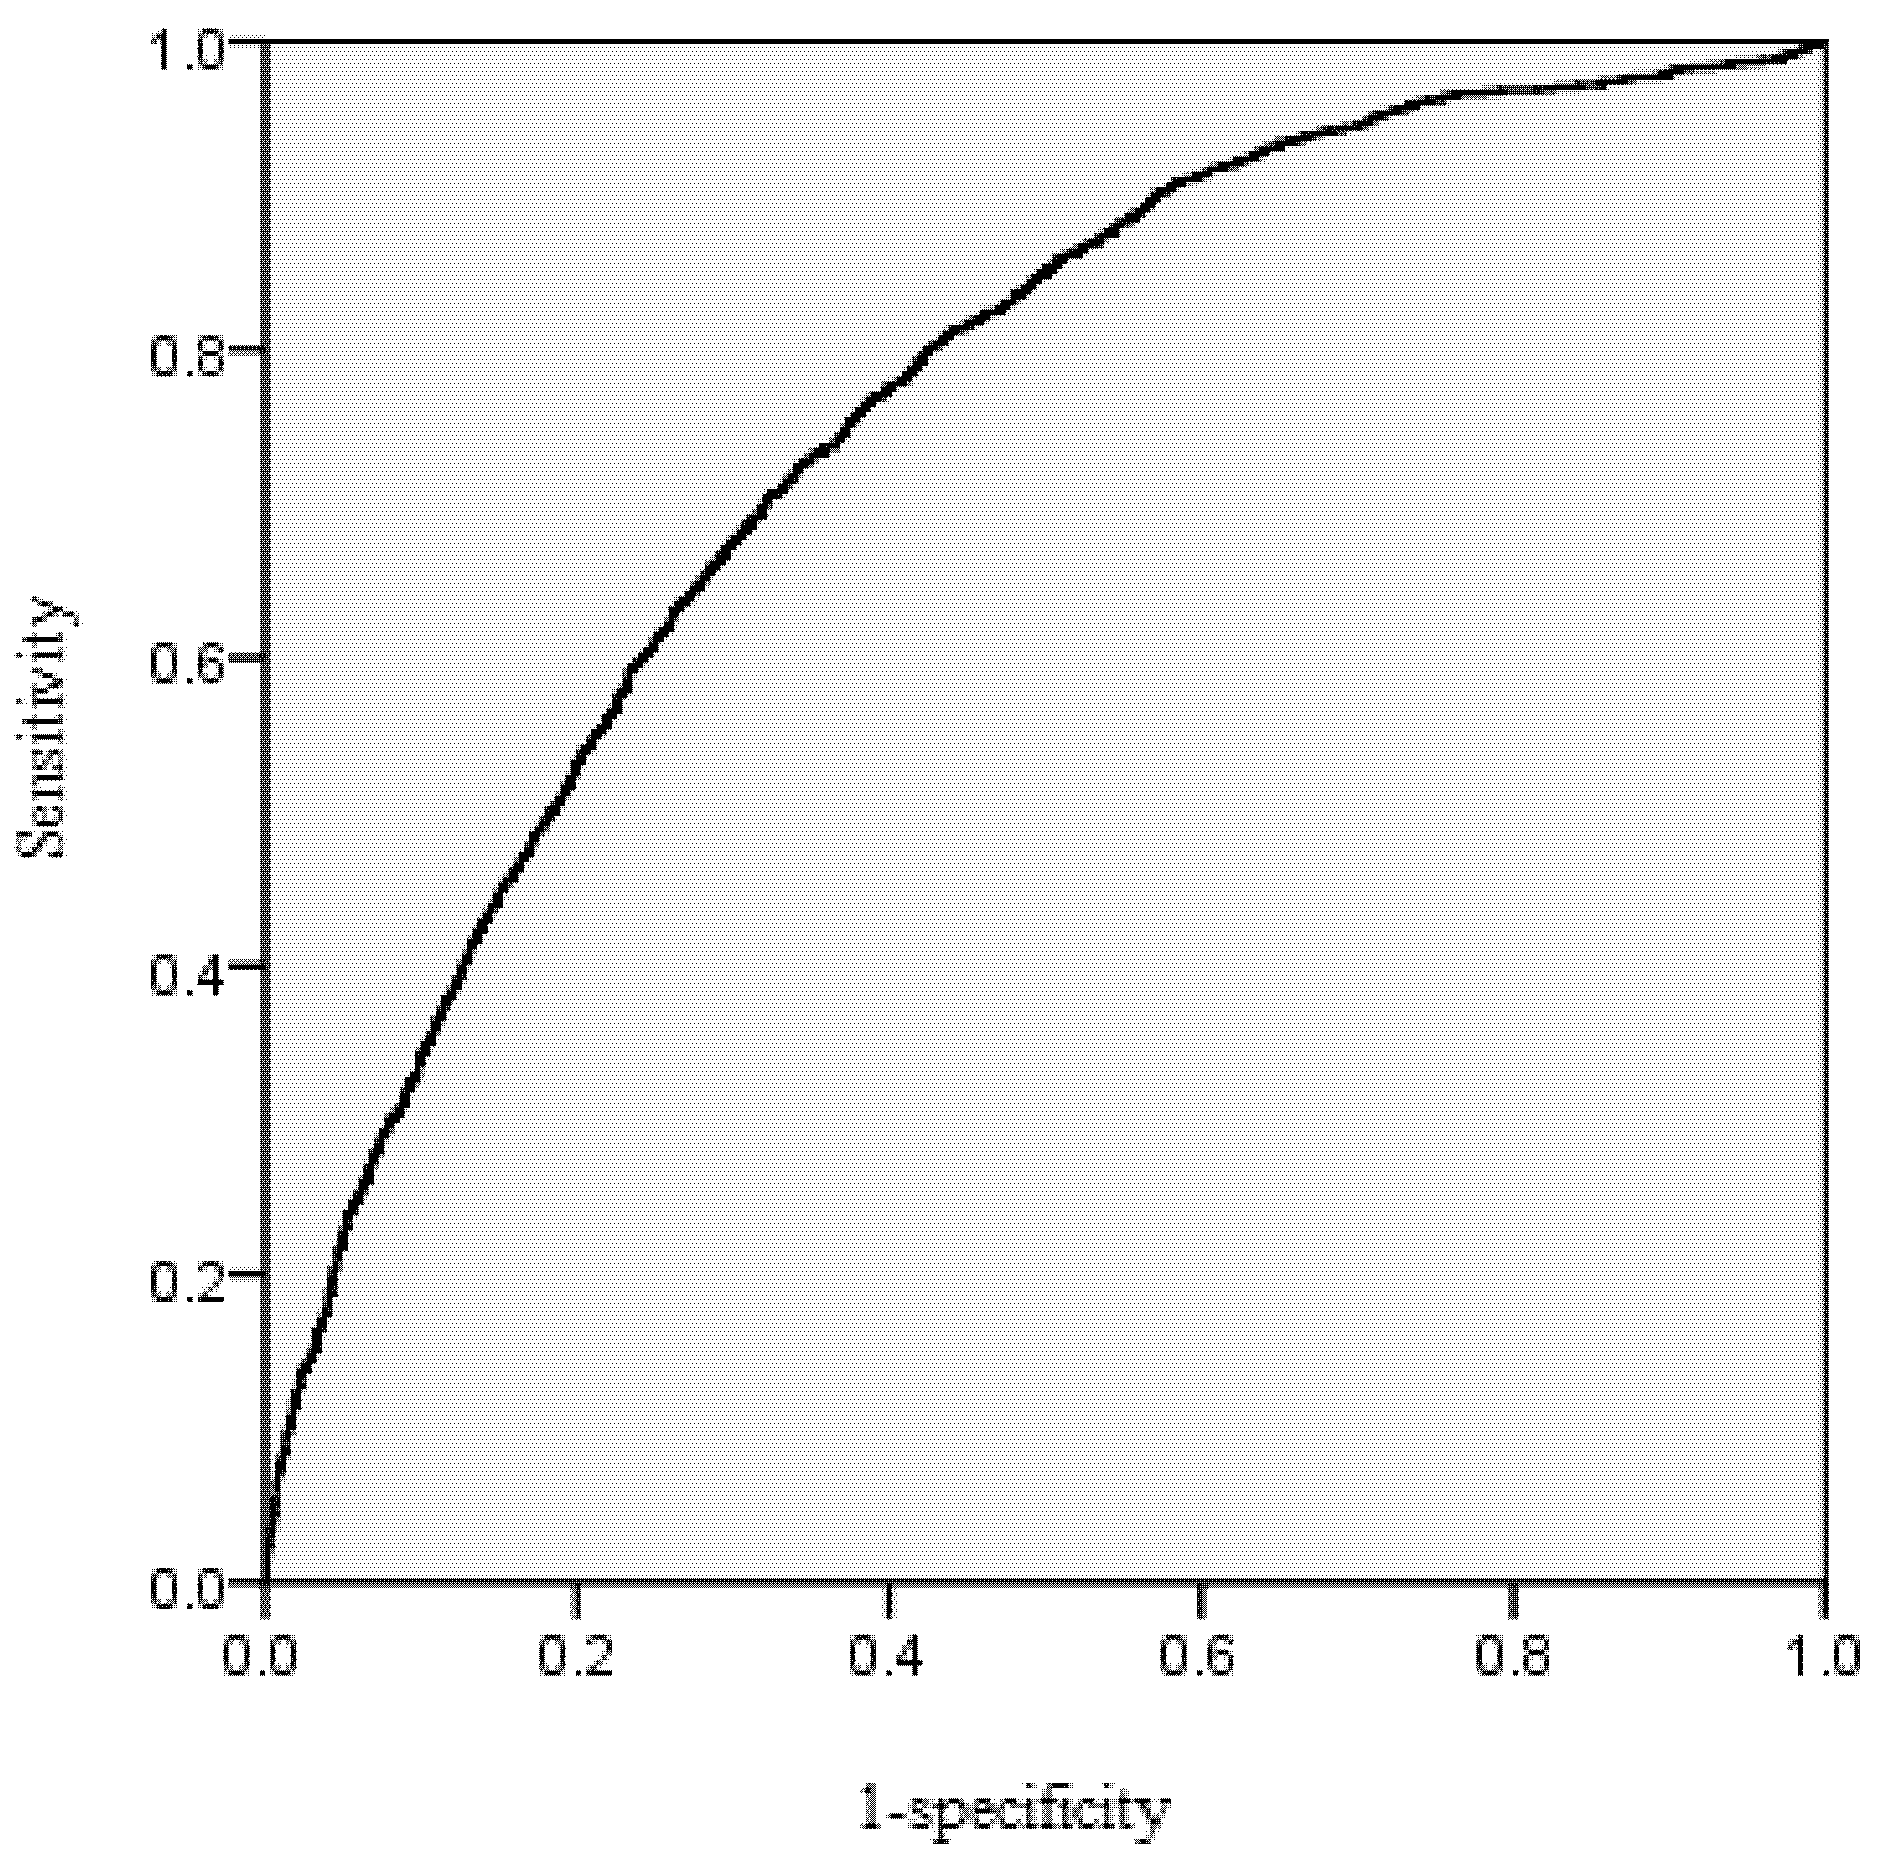
The area under the receiver operating characteristic (ROC) curve was calculated for the mortality model. According to Hosmer and Lemeshow [
39], the area under the ROC curve is a threshold independent measure of model discrimination, where a value of 0.5 suggests no discrimination, 0.7–0.8 suggests acceptable discrimination, and 0.8–0.9 suggests excellent discrimination. To carefully check the bias among diameter classes, the deviations between predicted and observed values were tested by means of Pearson Chi-Squared Statistics [
40,
41]. Chi-Squared values for classes within an attribute were calculated as:
where
NDobs,
NDpred are the number of observed and predicted dead trees in a diameter class, respectively.
Large chi-squared values provided evidence of lack of fit. When the chi-squared values we calculated are less than the critical chi-squared values with significant level p = 0.05, it means there is no significant difference between the probability of observed and predicted dead trees.
Model calibrations were carried out in R with the lme4 and systemfit package [
42].
4. Discussion
Diameter growth and mortality models have long been recognized as a critical component in individual tree growth modeling. This study firstly presented a separate individual-tree diameter growth model and mortality model for Mongolia oak in Northeast China, based on permanent sample plots. Potential predictor variables were selected based on their biological importance for tree growth and mortality rather than simply fitting statistics because if a model does not make biological sense, it will not perform well for any data set other than that used for model development [
18]. The predictor variables for both models are related to tree size, tree competition and site conditions. After testing different independent variables, the following were included in the two models: the initial diameter at breast height (
DBH), basal area of larger trees (
BAL), stand basal area (
BA), and site index (
SI). Owing to same predictors and error correlation of both models, the simultaneous fitting was done through N3SLS and SUR. Possible correlated error components in the equations could be explained by the simultaneous fitting, because some tree- and stand-level variables depended on parameter estimates and were used in both equations. In contrast to individual fitting of the equations, this approach results in a decrease in the approximate standard errors of the coefficients and more accurate projections as shown in this study. Both stand- and tree-level system equations were reported to be superior to separate growth models [
22,
23,
43,
44,
45]. However, the simultaneous fitting using N3SLS provided the more precise projection and similar parameter estimates than those obtained using SUR in the region. Because the bias from nonlinear N3SLS were smaller than those from SUR, which means N3SLS was more efficient than SUR in this region. Therefore, N3SLS is the most appropriate method for system equation estimate in the study. Recently, a system of equations was developed by Sattler and LeMay to predict crown length and crown radius for trees in structurally complex stands [
24]. Compatible branch and foliage biomass simultaneous equations were constructed based on the crown biomass mixed models, in which the crown biomass was divided into the two components of branch and foliage biomass [
46].
In the simultaneous fitting using N3SLS, the individual tree diameter growth model showed that higher values of ln
DBH and
SI led to greater increments, while higher values of any of the other variables (
BA and BAL) resulted in lower increments. The results confirmed that bigger trees and trees in better sites representing more vigor had higher diameter growth. The basal area of larger trees (
BAL) confirmed that an increase in competition leads to a reduction in the diameter growth.
BAL has been considered as a variable to capture competition for light [
47]. Stand basal area (
BA) also has negative effects, which showed a decrease in the growth rate as the stand becomes more crowded. It is consistent with the separate individual tree diameter growth model [
13,
48,
49,
50]. In addition, the crown characteristics were also included in some individual tree diameter growth models [
9,
51]. However, crown measurements were not used in this study, and no crown models were available for the species in the study area. Therefore, it will be interesting to test whether crown attributes would be beneficial to assess Mongolia oak stand dynamics in future research.
In the case of the mortality model from simultaneous fitting using N3SLS, higher values of
SI representing good site condition resulted in lower mortality, while higher values of any of the other variables (1
/DBH,
BAL,
BA) resulted in greater mortality. The results implied that the mortality probability of big trees is lower than that of small trees. Similar results have been reported for this species from Austria [
15], Norway [
41], and Finland [
52]. However, Monserud and Sterba [
15] hypothesized an increased mortality rate for very large diameters due to senescence of over-mature trees, included DBH
2 in the model, and found it significant in predicting mortality for Norway spruce. The basal area of larger trees (
BAL), stand basal area (
BA) indicated that an increase in competition of stand leads to a higher possibility of mortality. This means that the denser the stand and the more suppressed the tree, the greater is the mortality rate [
41,
53,
54]. The size of the tree affects one-sided or asymmetric competition and occurs when larger trees have a disproportionate share of resources [
55], so smaller trees are more likely to die due to stagnation. Light is the most common example of an asymmetric resource because of its directionality, but it is perhaps not the only one, since the degree of symmetry or asymmetry of mineral nutrients and water are not enough studied [
47]. The basal area of larger trees and the ratio of basal area of individual tree and stand have been considered as a variable to capture competition for light, and, hence, it is seen as a surrogate of one-sided competition [
56], while stand basal area and number of trees is used to express two-side competition [
53]. This makes sense as these trees grow in relatively sparse stands with high availability of light, where competition seems to be for belowground resources [
57].
Owing to lack of stand dominant height, site productivity in the study was realized by the stand mean height at a given age, which is a practical measure of site productivity in the past [
58]. It had significant effects on diameter and mortality in the both models as expected. There are still unexplained variances in both individual diameter growth and mortality models, and further model improvement will be considered in the future with the application of a mixed-effect model with plot as a random effect, for example. Height growth and recruitment models will also be needed.


