
A Comparison of the Composition and Diversity of Tree Populations along a Hydrological Gradient in Floodplains (Southern Québec, Canada)

Abstract
:1. Introduction
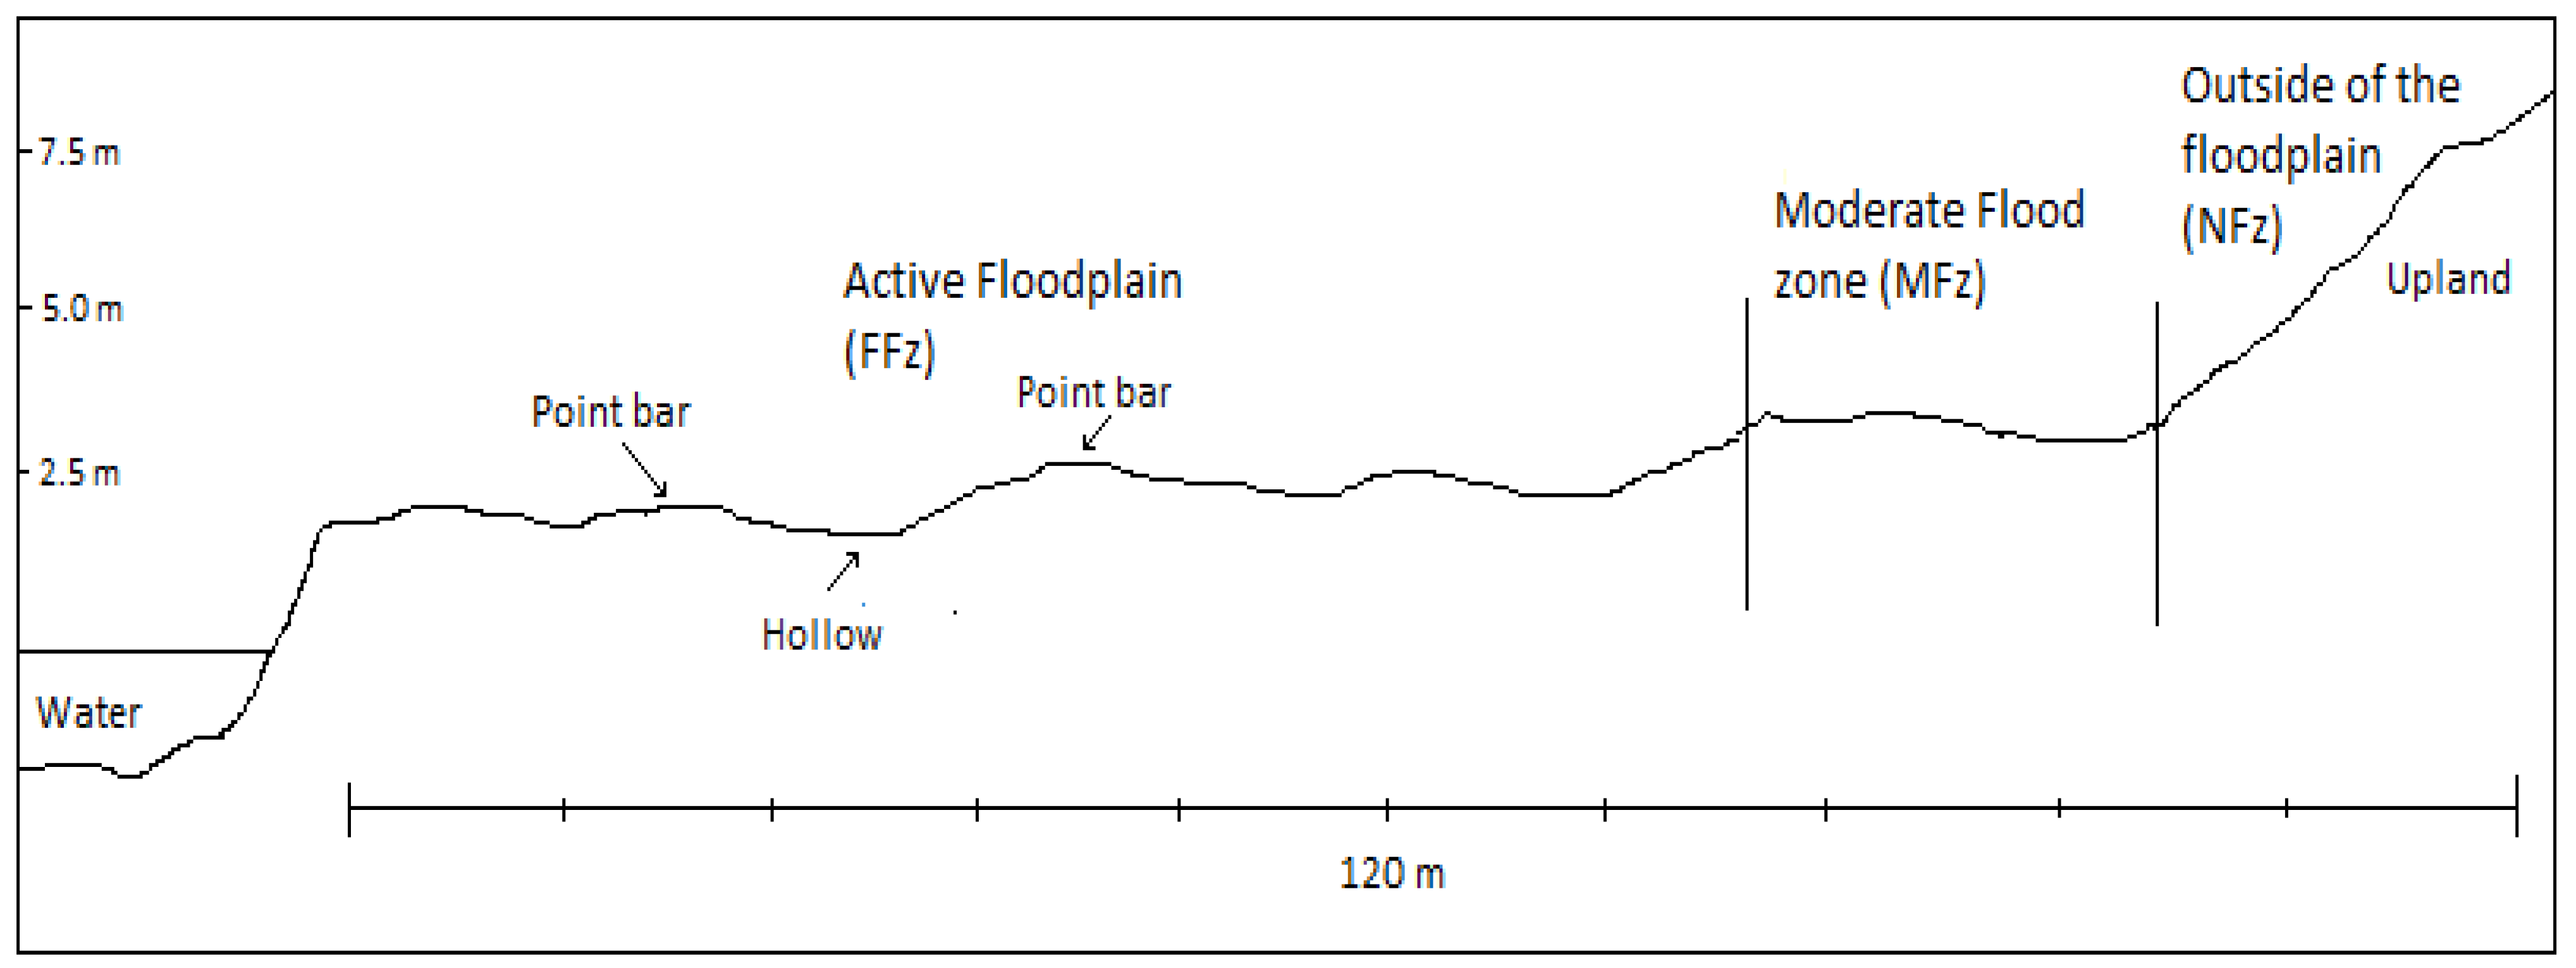
2. Methods
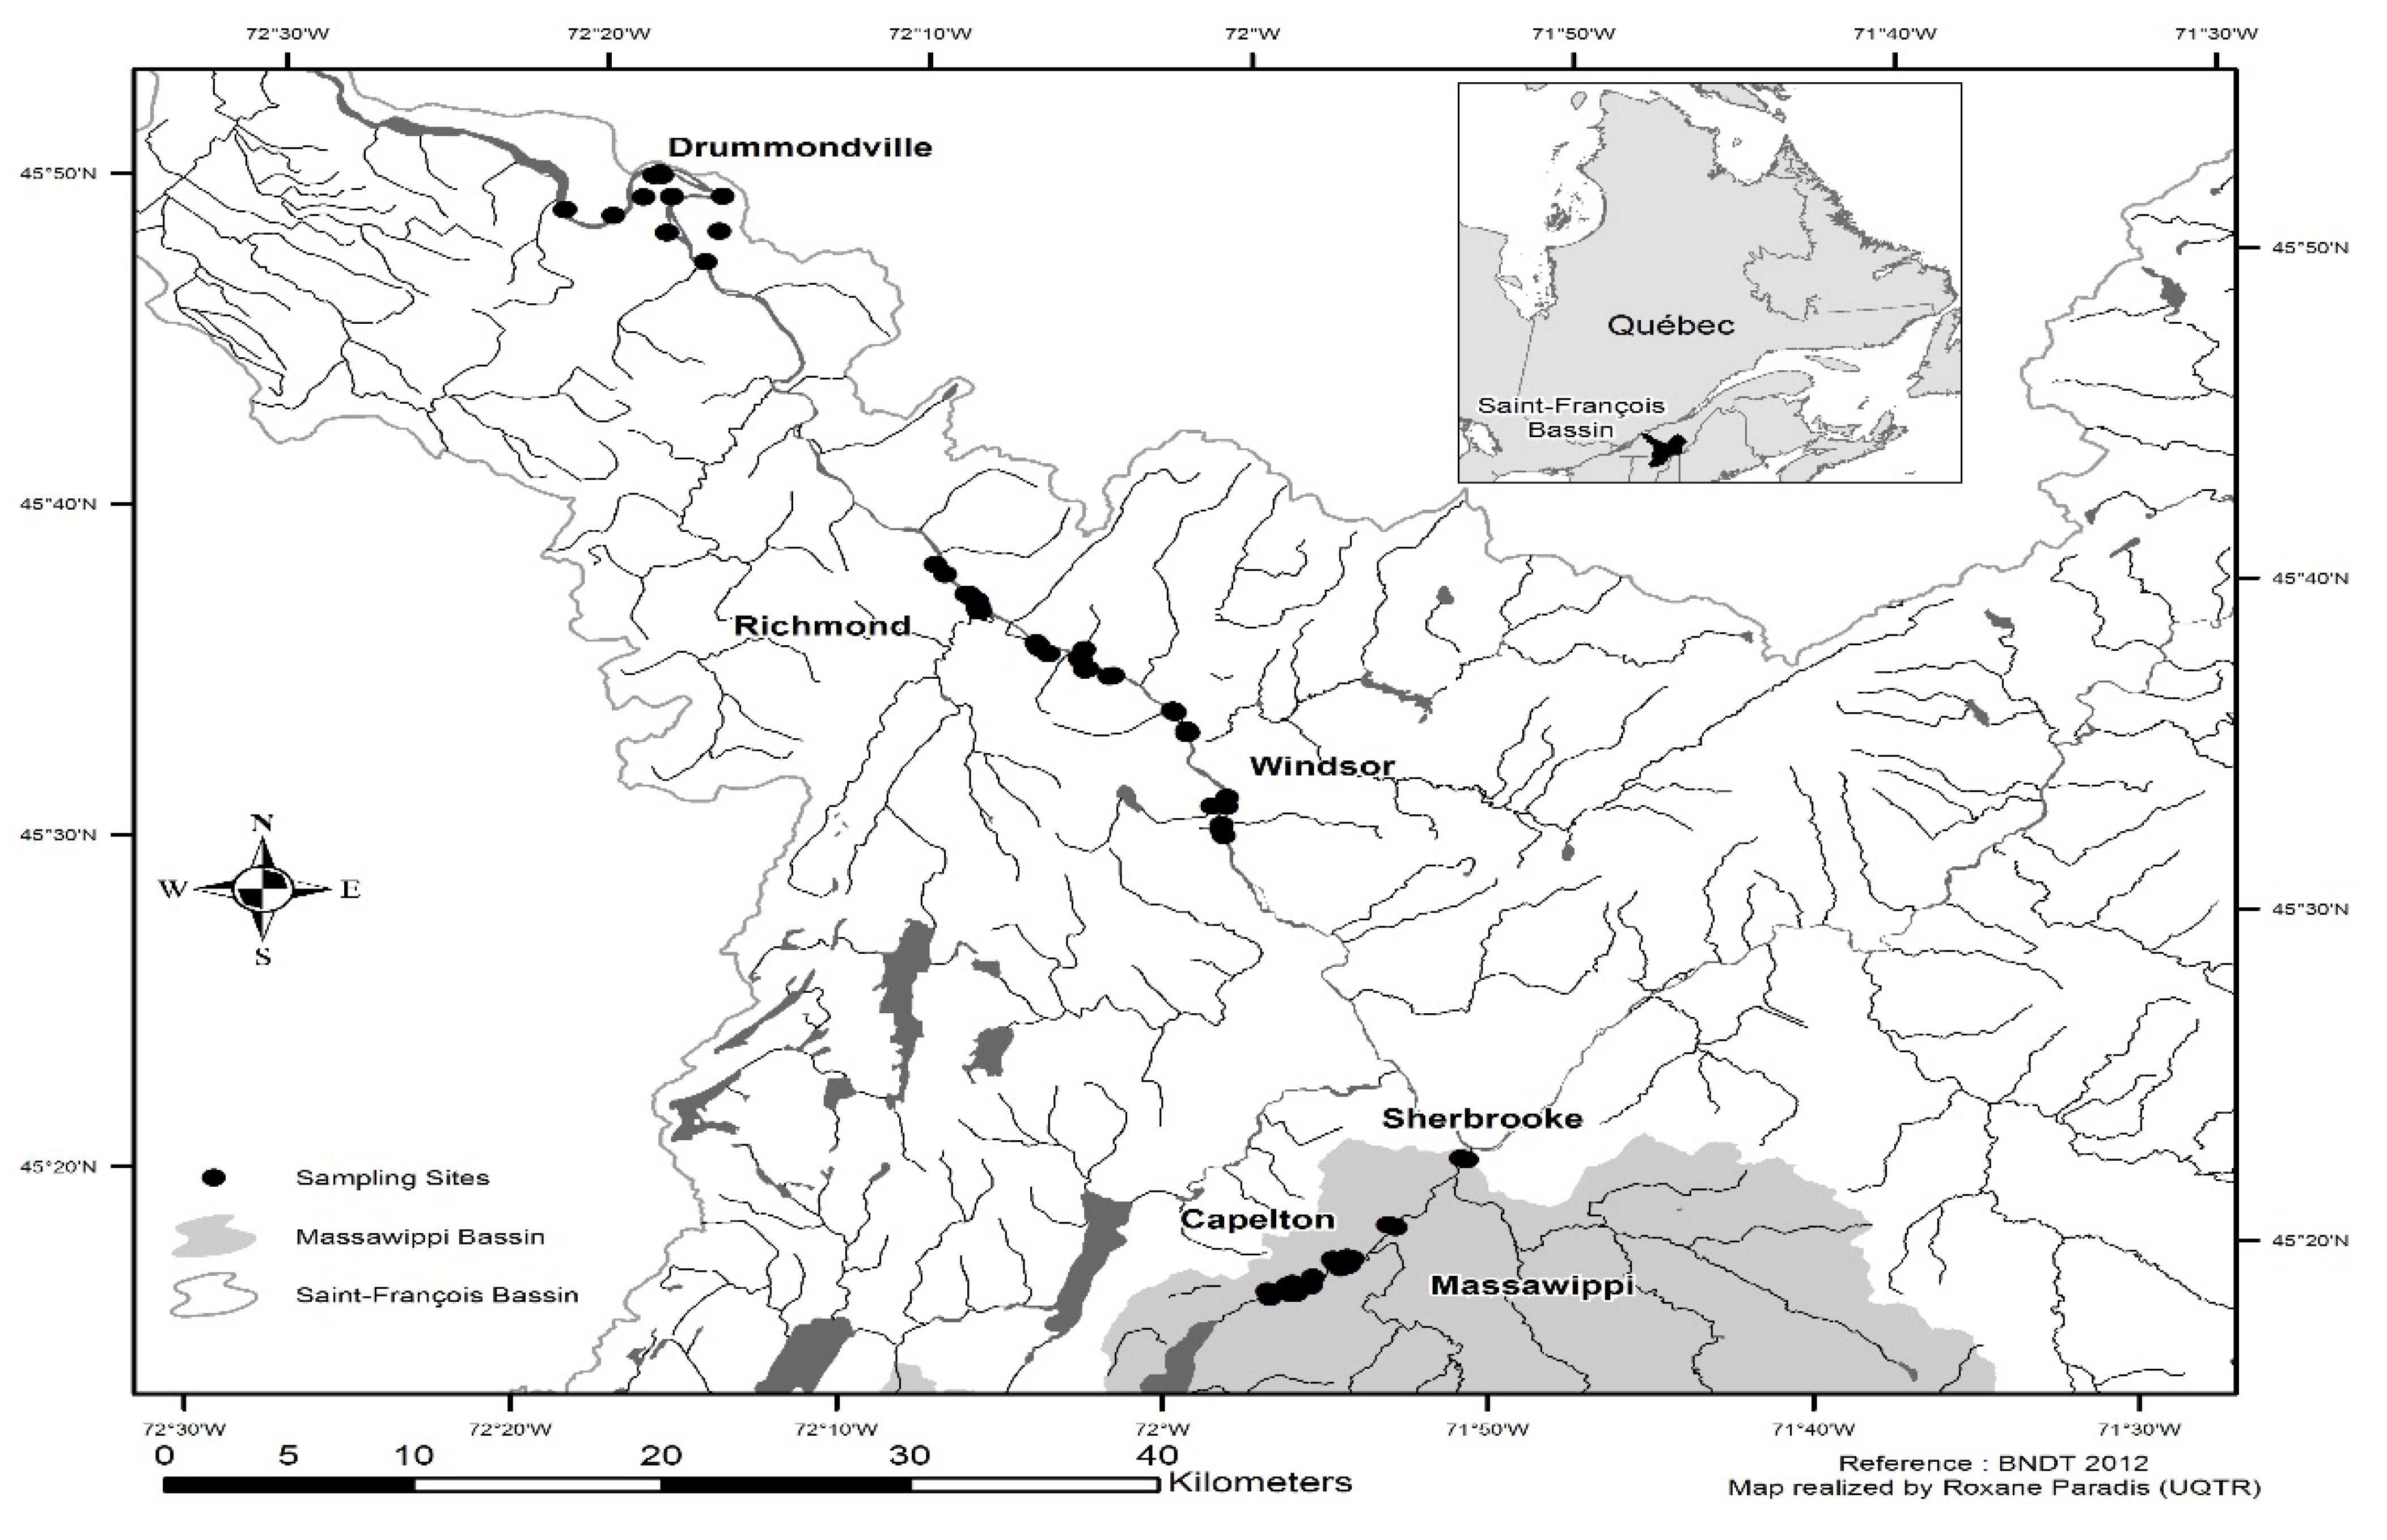
2.1. Study Area
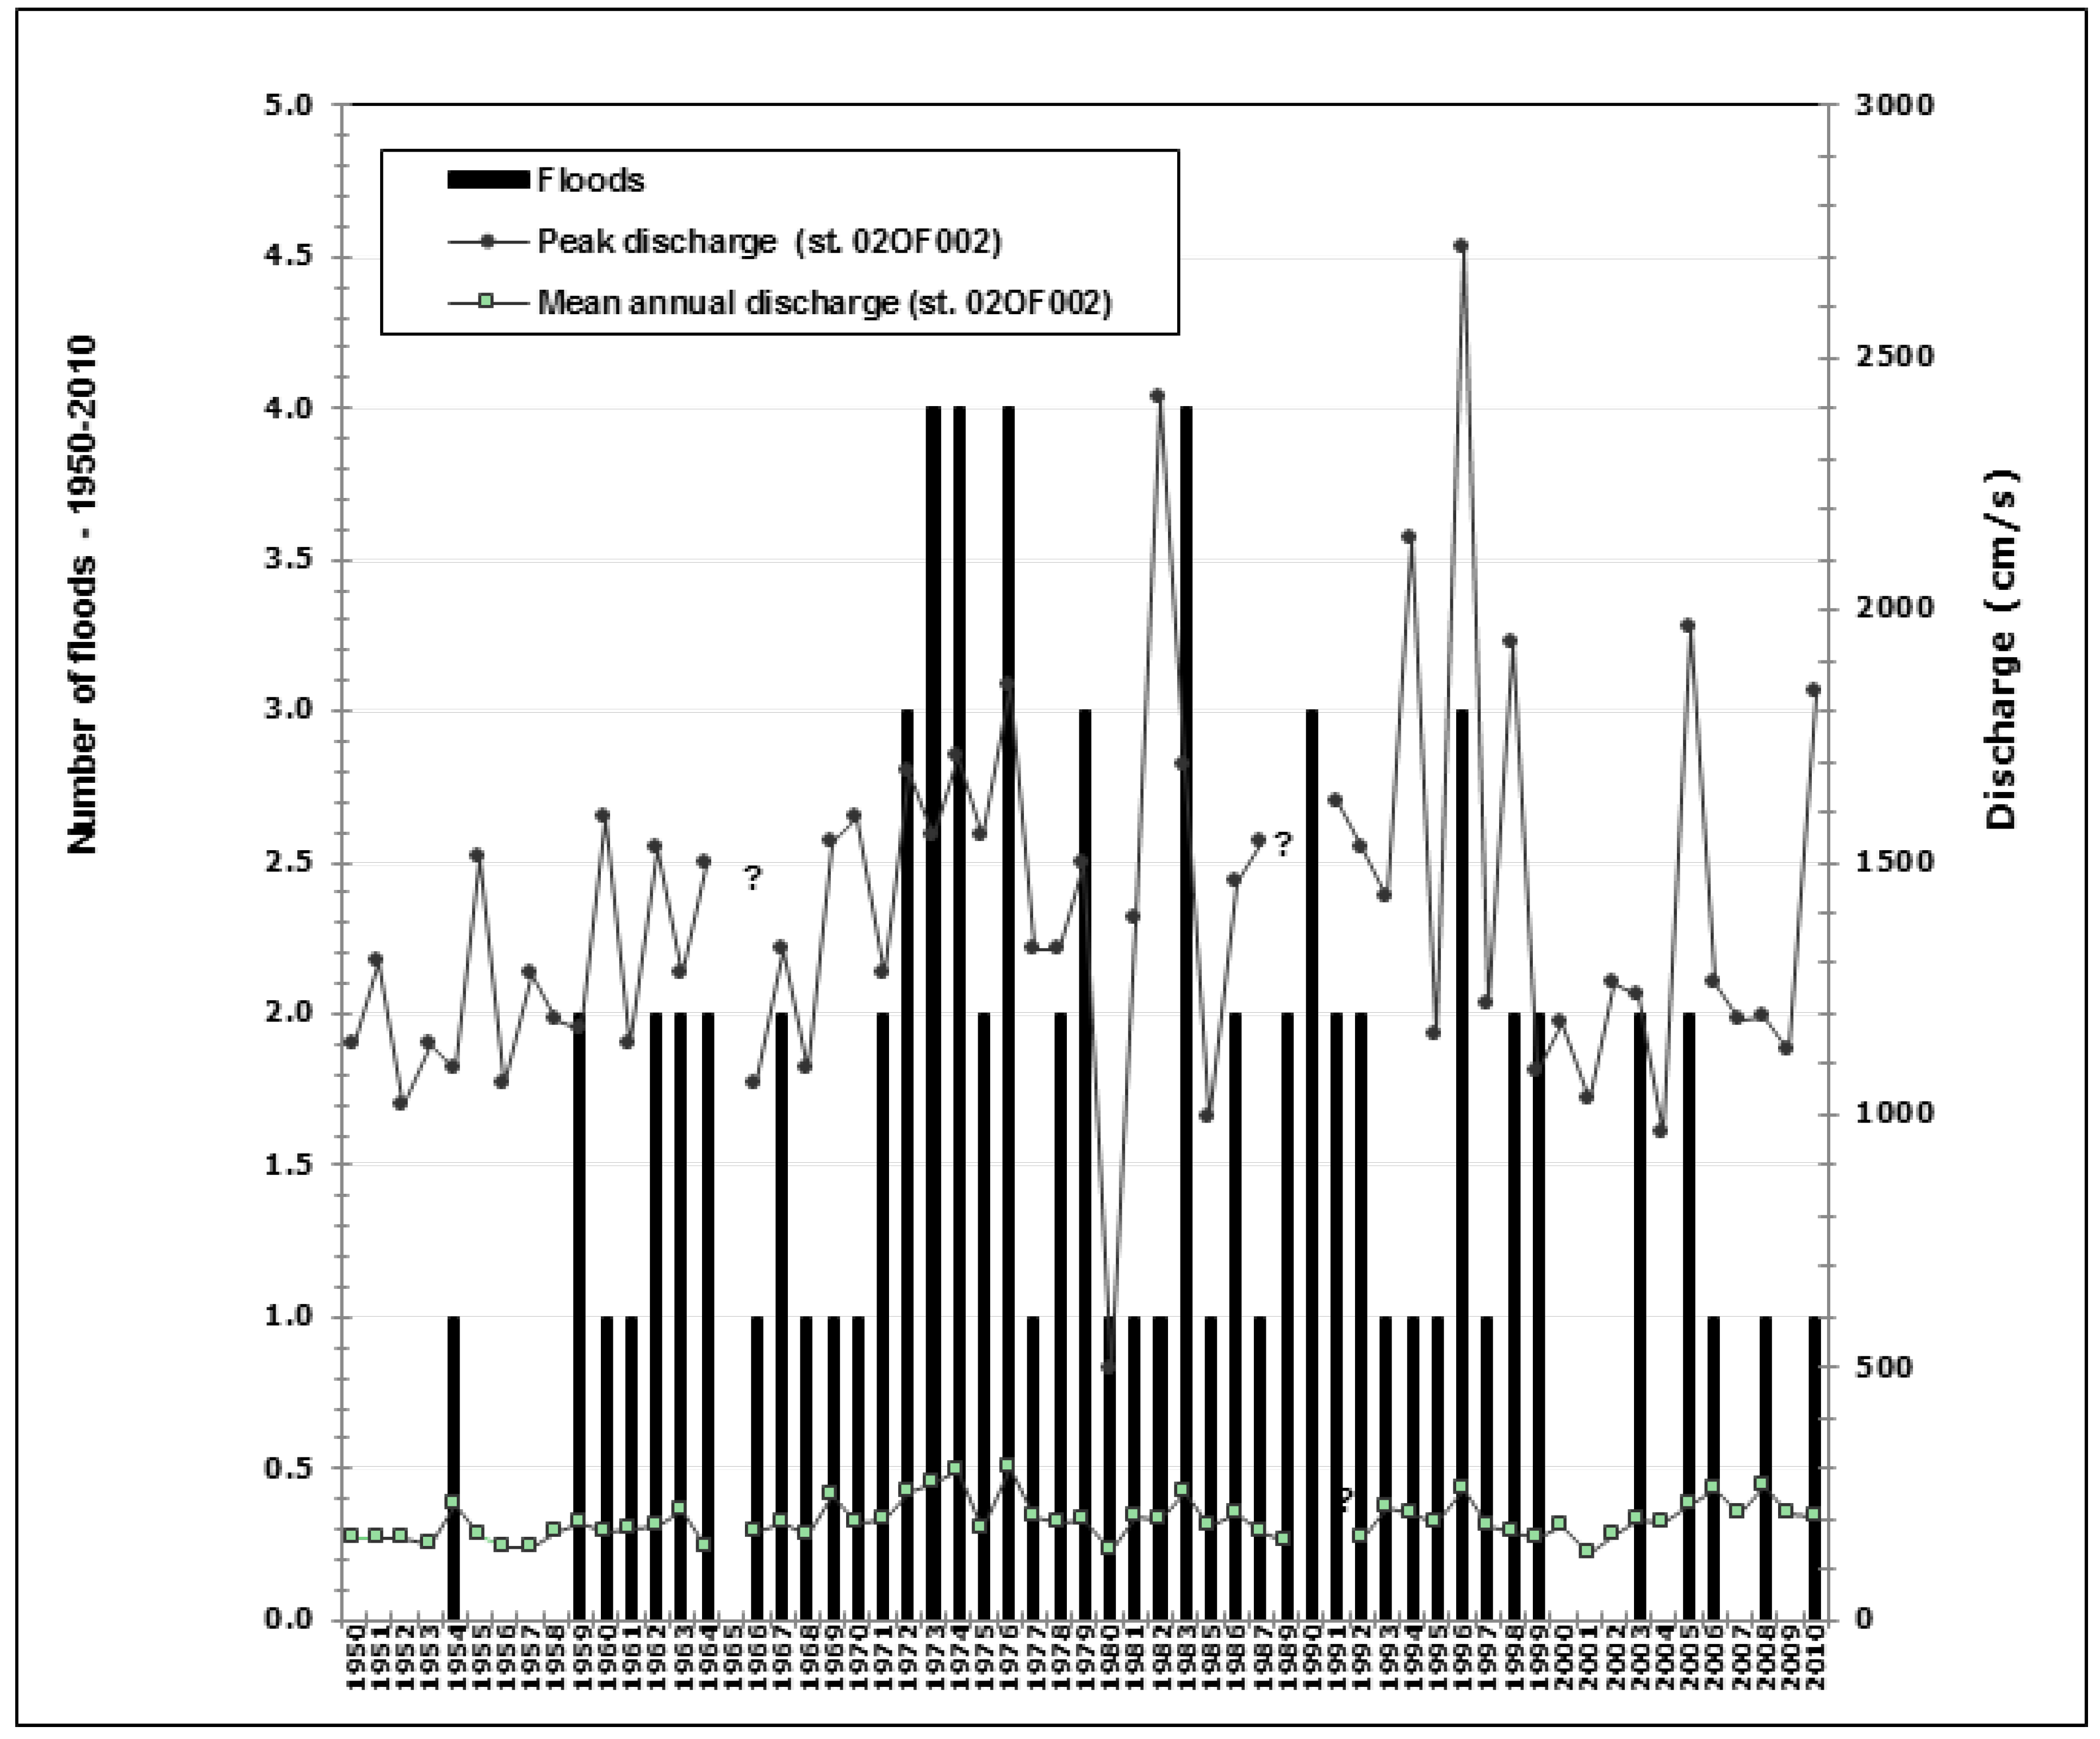
2.2. Floods and Hydrological Data

| River Sectors Massawippi (MAS) Saint-François (STF) | Massawippi (MAS) | Sherbrooke (STF) | Windsor (STF) | Richmond (STF) | Drummondville (STF) |
|---|---|---|---|---|---|
| Gauging stations | 02OE019 | 02OE005 | 02OF004 | 02OF001 | 02OF002 |
| Period observed | 1952–1996 | 1919–2011 | 1936–1972 | 1915–1965 | 1960–2010 |
| Mean channel width (m) | 30 | 140 | 180 | 180 | 260 |
| Mean channel height (m) | 1–1.5 | 1–1.5 | 1–2 | 1–2 | 1–3 |
| River bed (depth in m) | 1.5–4 | 4–8 | 4–6 | 3–5 | 4–8 |
| Mean annual discharge (m3/s) | 10 | 101 | 165 | 183 | 205 |
| Peak discharge (m3/s) | 135 | 1553 | 2080 | 2080 | 2719 |
| Flood occurrence (return period) | 37 | 61 | 27 | 44 | _ |
| Land uses: Farmlands (%) | 29.1 | 37.0 | 22.6 | 46.0 | |
| Forest areas (%) | 68.5 | <31.0 | 69.7 | 47.1 | |
| Urban areas (%) | 0.8 | 31.3 | 0.8 | 3.6 | |
| Biophysical variables | MAS Sector | STF Sector | |||||
|---|---|---|---|---|---|---|---|
| Variable | Variable Description | Flood Recurrence (0–20 years) | Flood Recurrence (20–100 years) | Outside of the Floodplains | Flood Recurrence (0–20 years) | Flood Recurrence (20–100 years) | Outside of the Floodplains |
| Slope (%) | Classes defined by System of Soil classification [47] Nearly level (0%–2%) | 64.3% | 59.1% | 9.9% | 78.6% | 85.7% | 17.6% |
| Very gentle to gentle slopes (2.5%) | 14.3% | 30.6% | – | 10.7% | – | – | |
| Gentle to moderate slopes (5%–10%) | 7.1% | 10.3% | 10.1% | 3.6% | 7.2% | 5.9% | |
| Strong to very strong slopes (>10%) | 14.3% | – | 80.0% | 7.1% | 7.1% | 76.5% | |
| Micro-topography | Succession of mounds and troughs (MT); presence of bars (B); narrow channel (NC); Gully; (G); Outcrop (O) | MT, B, NC | MT | G | MT, B, NC | MT | G, O |
| Drainage | Classes defined by System of Soil classification [47] Very good to good | 7.1% | 6.9% | 70.1% | 78.6% | 71.9% | 70.5% |
| Good to moderate | 21.4% | 20.5% | 40.0% | 14.2% | 14.3% | 17.5% | |
| Bad to very bad | 71.4% | 72.6% | 9.9% | 7.2% | 14.1% | 12.0% | |
| Water table level | L: less than 1 meter deep | L: 3.6% | L: 5.3% | L: – | L: 8.9% | L: 5.3% | L: 8.8% |
| G: greater than 1 meter deep | G: 96.4% | G: 94.7% | G: – | G: 91.1% | G: 94.7% | G: 91.2% | |
| Soil texture | L: loam; LS: loamy sand; SL: sandy loam; SiL: Silt loam; S: sand. CS: coarse sand. FS: fine sand. System of Soil classification [47] | L, LS, SL, FS | L, LS, SL, FS | S, CS, LS, SL | L, SL, SL | L, LS, SL, FS, S | S, CS, LS, SL |
| Particle size (%) | Clay (>5%) | 4.3% | 5.2% | 5.3% | 2.5% | 2.6% | 2.5% |
| Sand (>50%) | 32.6% | 27.7% | 32.4% | 46.8% | 46.8% | 51.4% | |
| Silt (>60%) | 63.1% | 67.1% | 62.3% | 50.7% | 50.6% | 46.1% | |
| Soil pH (CaCl2) | 3.5–4.5 | 35.7% | 57.4% | 79.9% | 21.4% | 57.1% | 100% |
| 4.5–5.5 | 57.2% | 42.6% | 20.1% | 39.3% | 35.8% | – | |
| 5.5–6.5 | 7.1% | – | – | 39.3% | 7.1% | – | |
| Soil biomass (litter) | 0–1 cm | 66.7% | 40.6% | 19.9% | 82.1% | 36.7% | 17.6% |
| 1–3.5 cm | 27.1% | 50.0% | 30.1% | 14.3% | 63.3% | 23.5% | |
| >3.5 cm | 6.2% | 9.4% | 50.0% | 3.6% | – | 58.9% | |
| Deciduous vs. coniferous | Proportion of deciduous trees in quadrat (200 m2) by zones and sectors | 78.6% | 79.6% | 70.1% | 90.2% | 80.4% | 27.8% |
| Density of trees | Average density of trees in quadrat (200 m2) by zones and sectors | 24.1 | 30.8 | 32.5 | 23.1 | 30.8 | 32.5 |

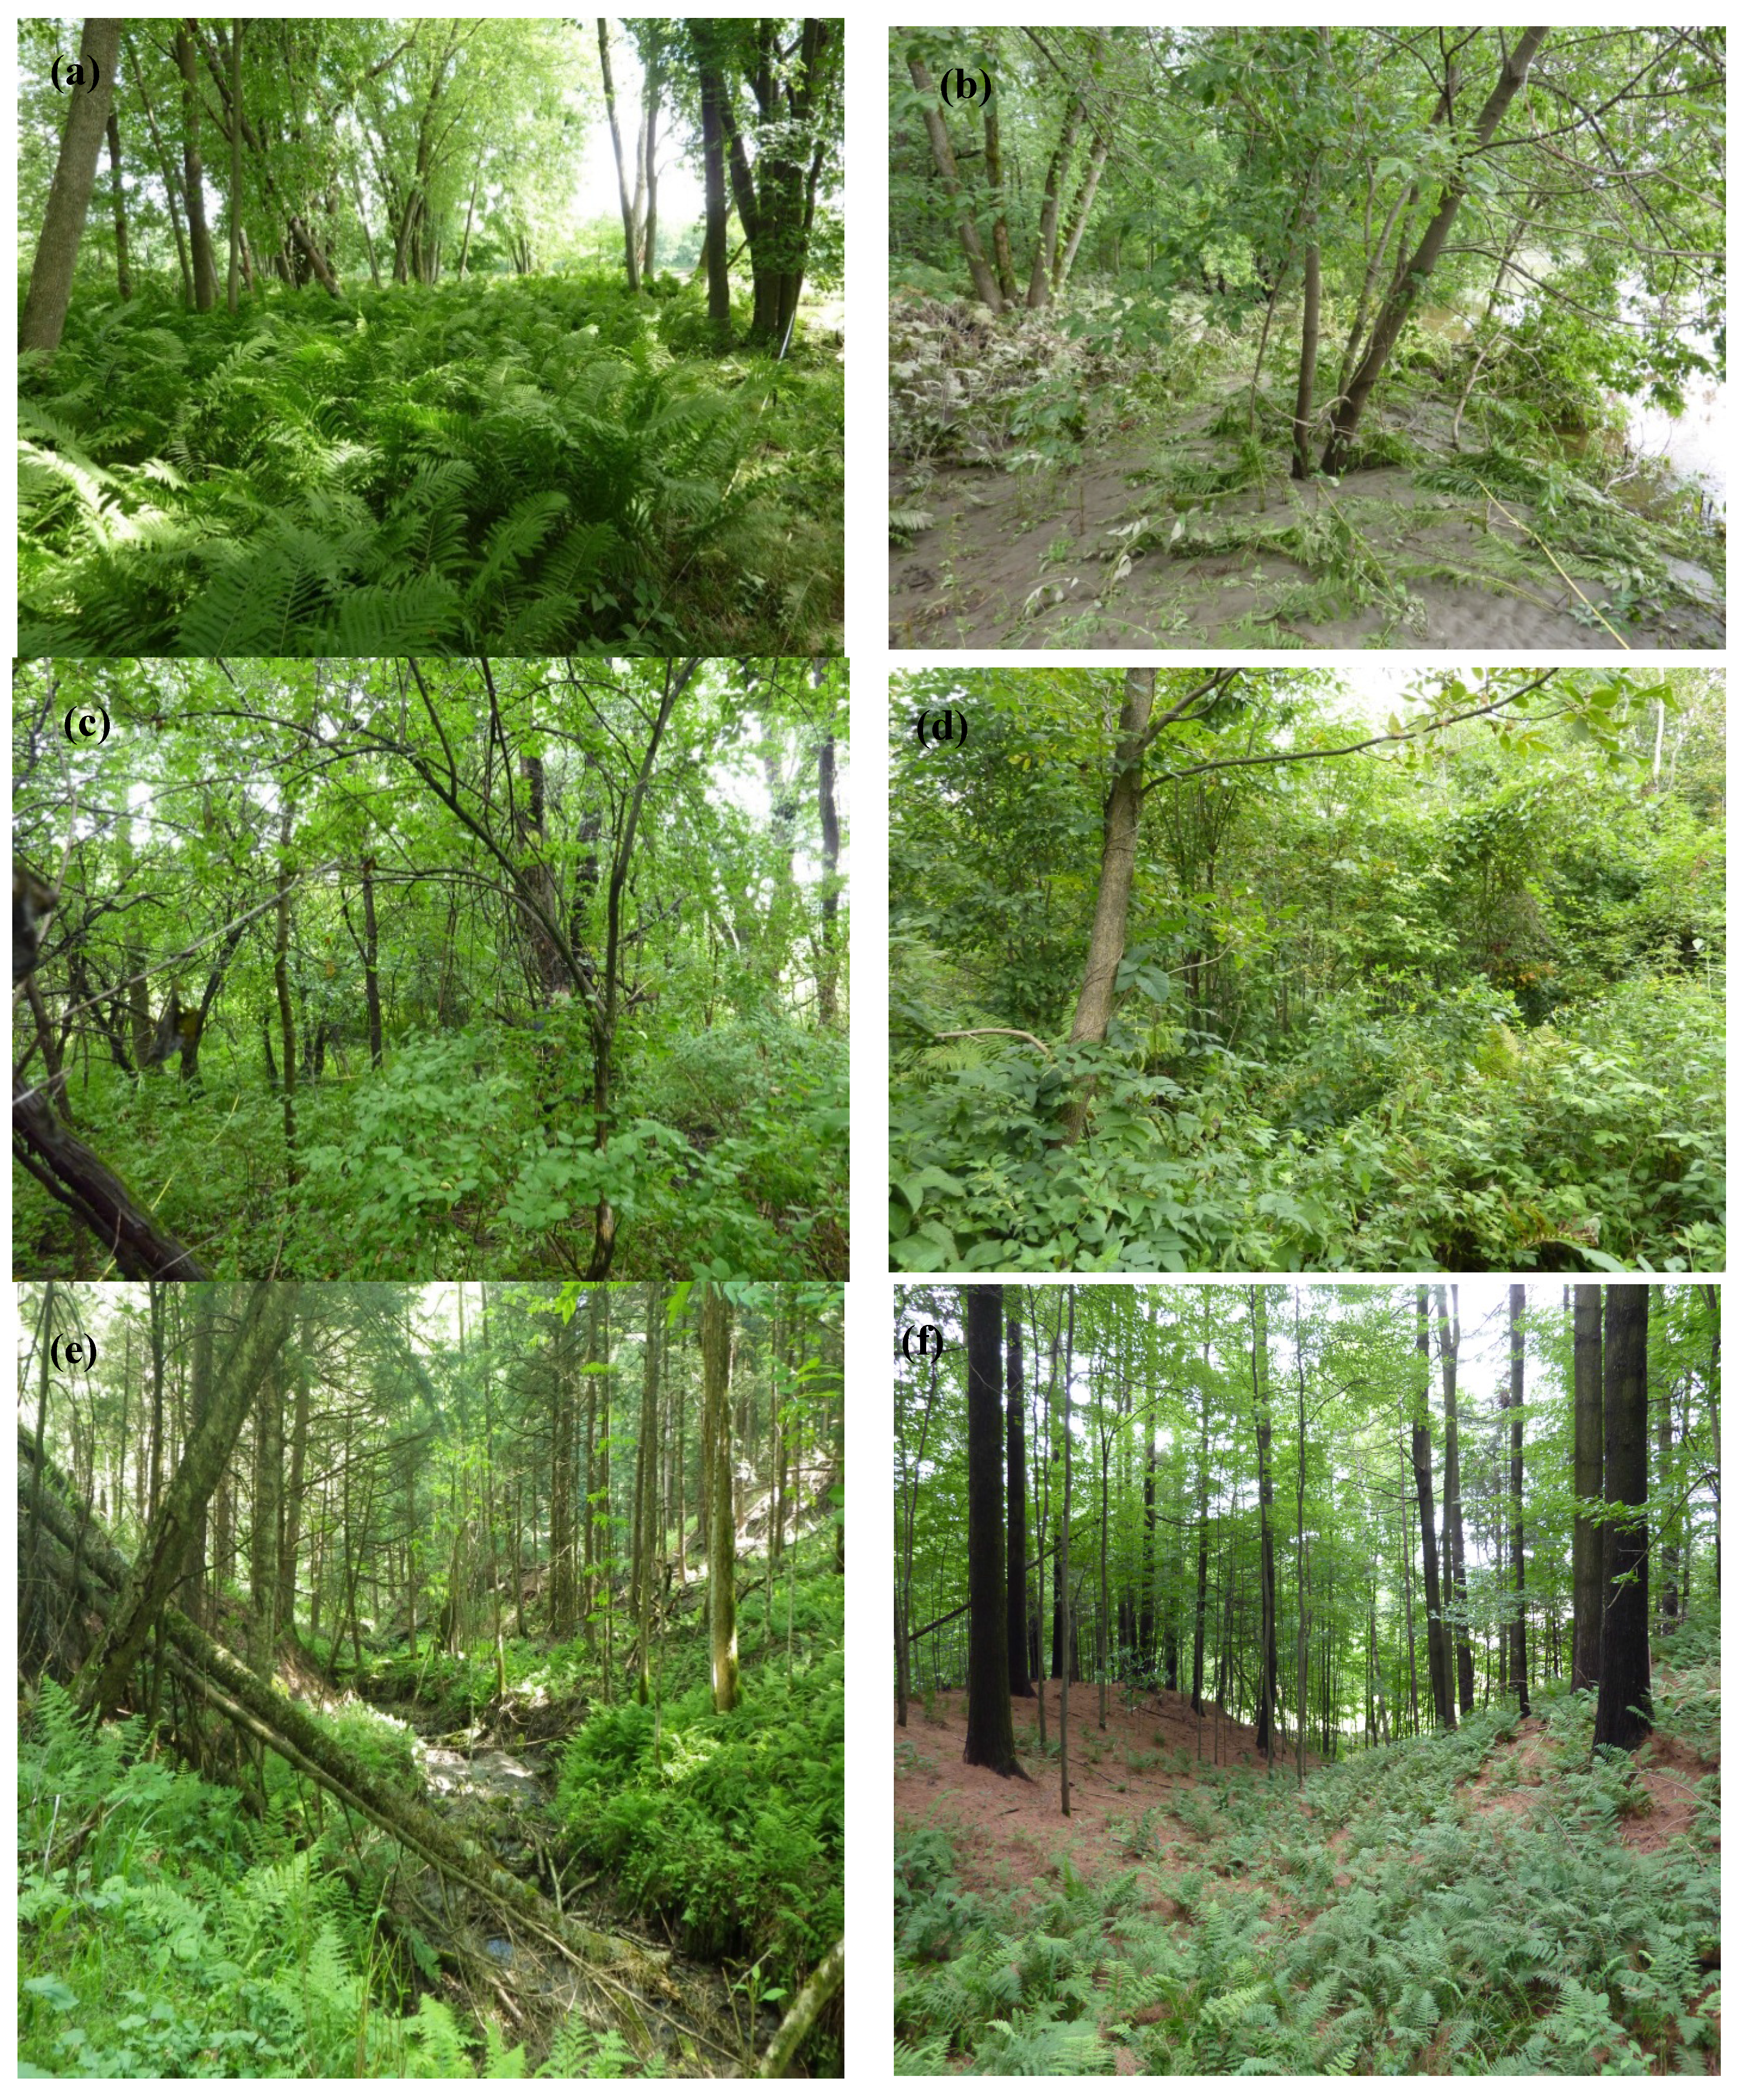
2.3. Field Sampling
2.4. Statistical Analysis
3. Results
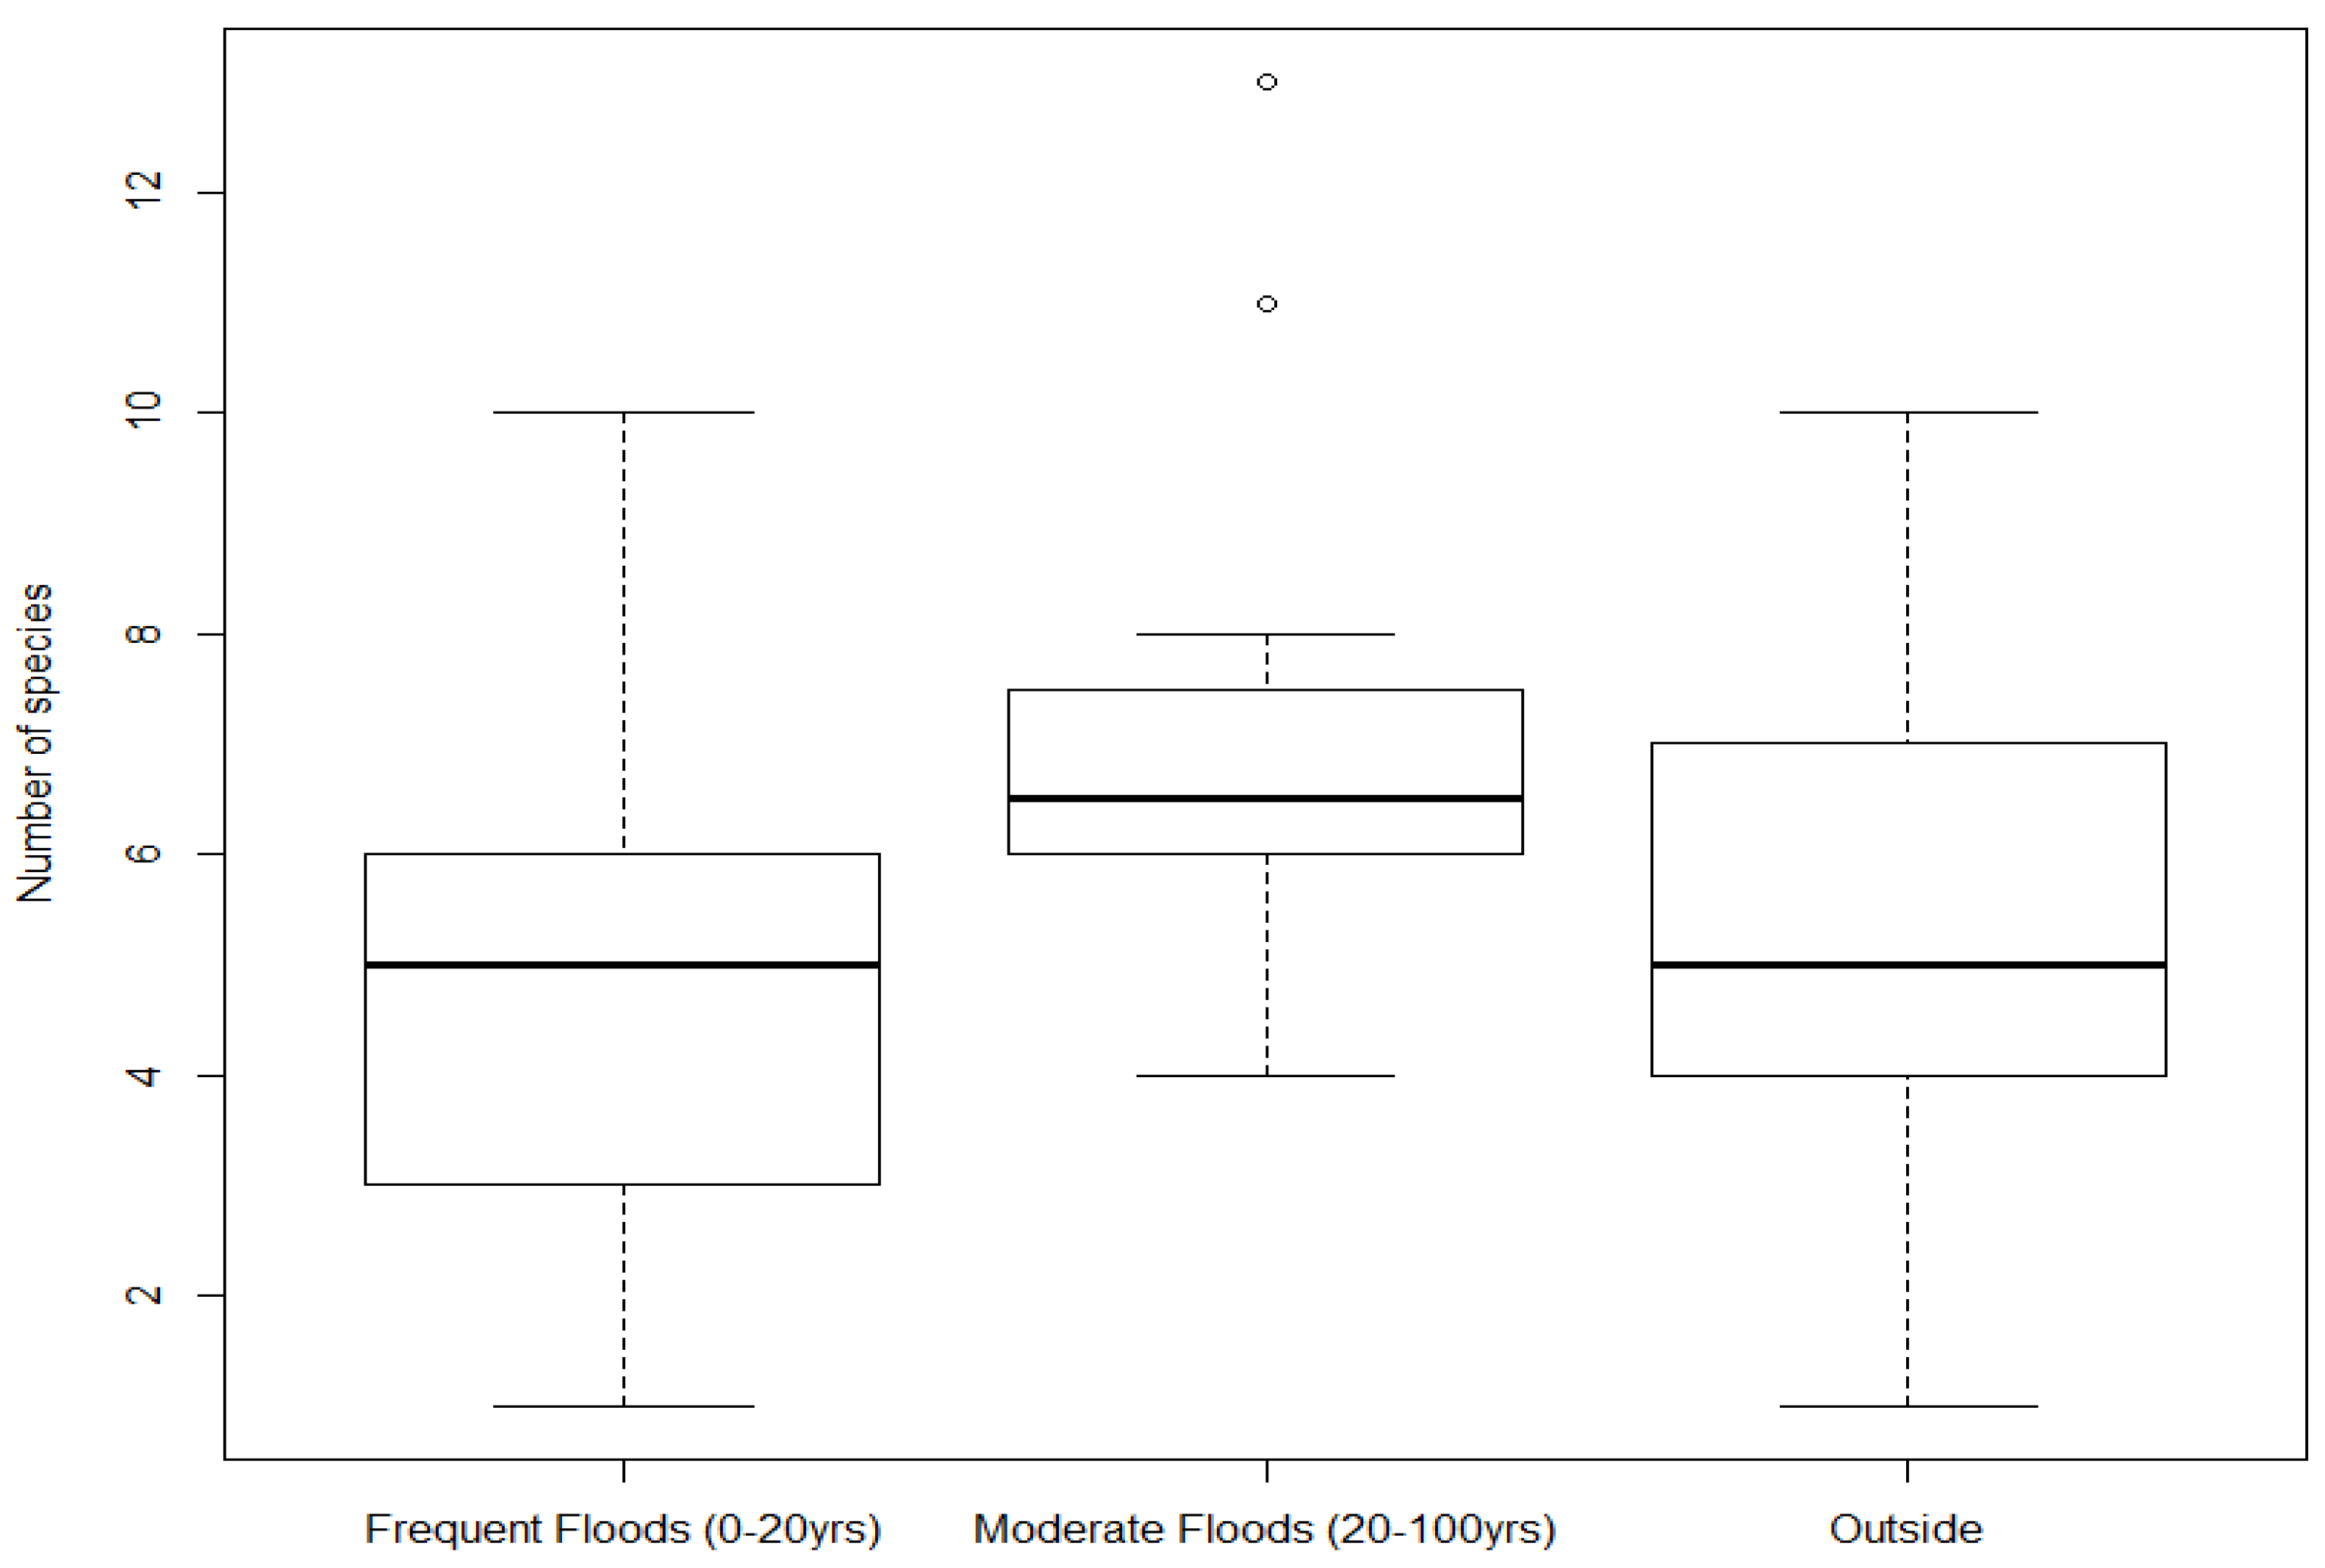
3.1. Species Richness
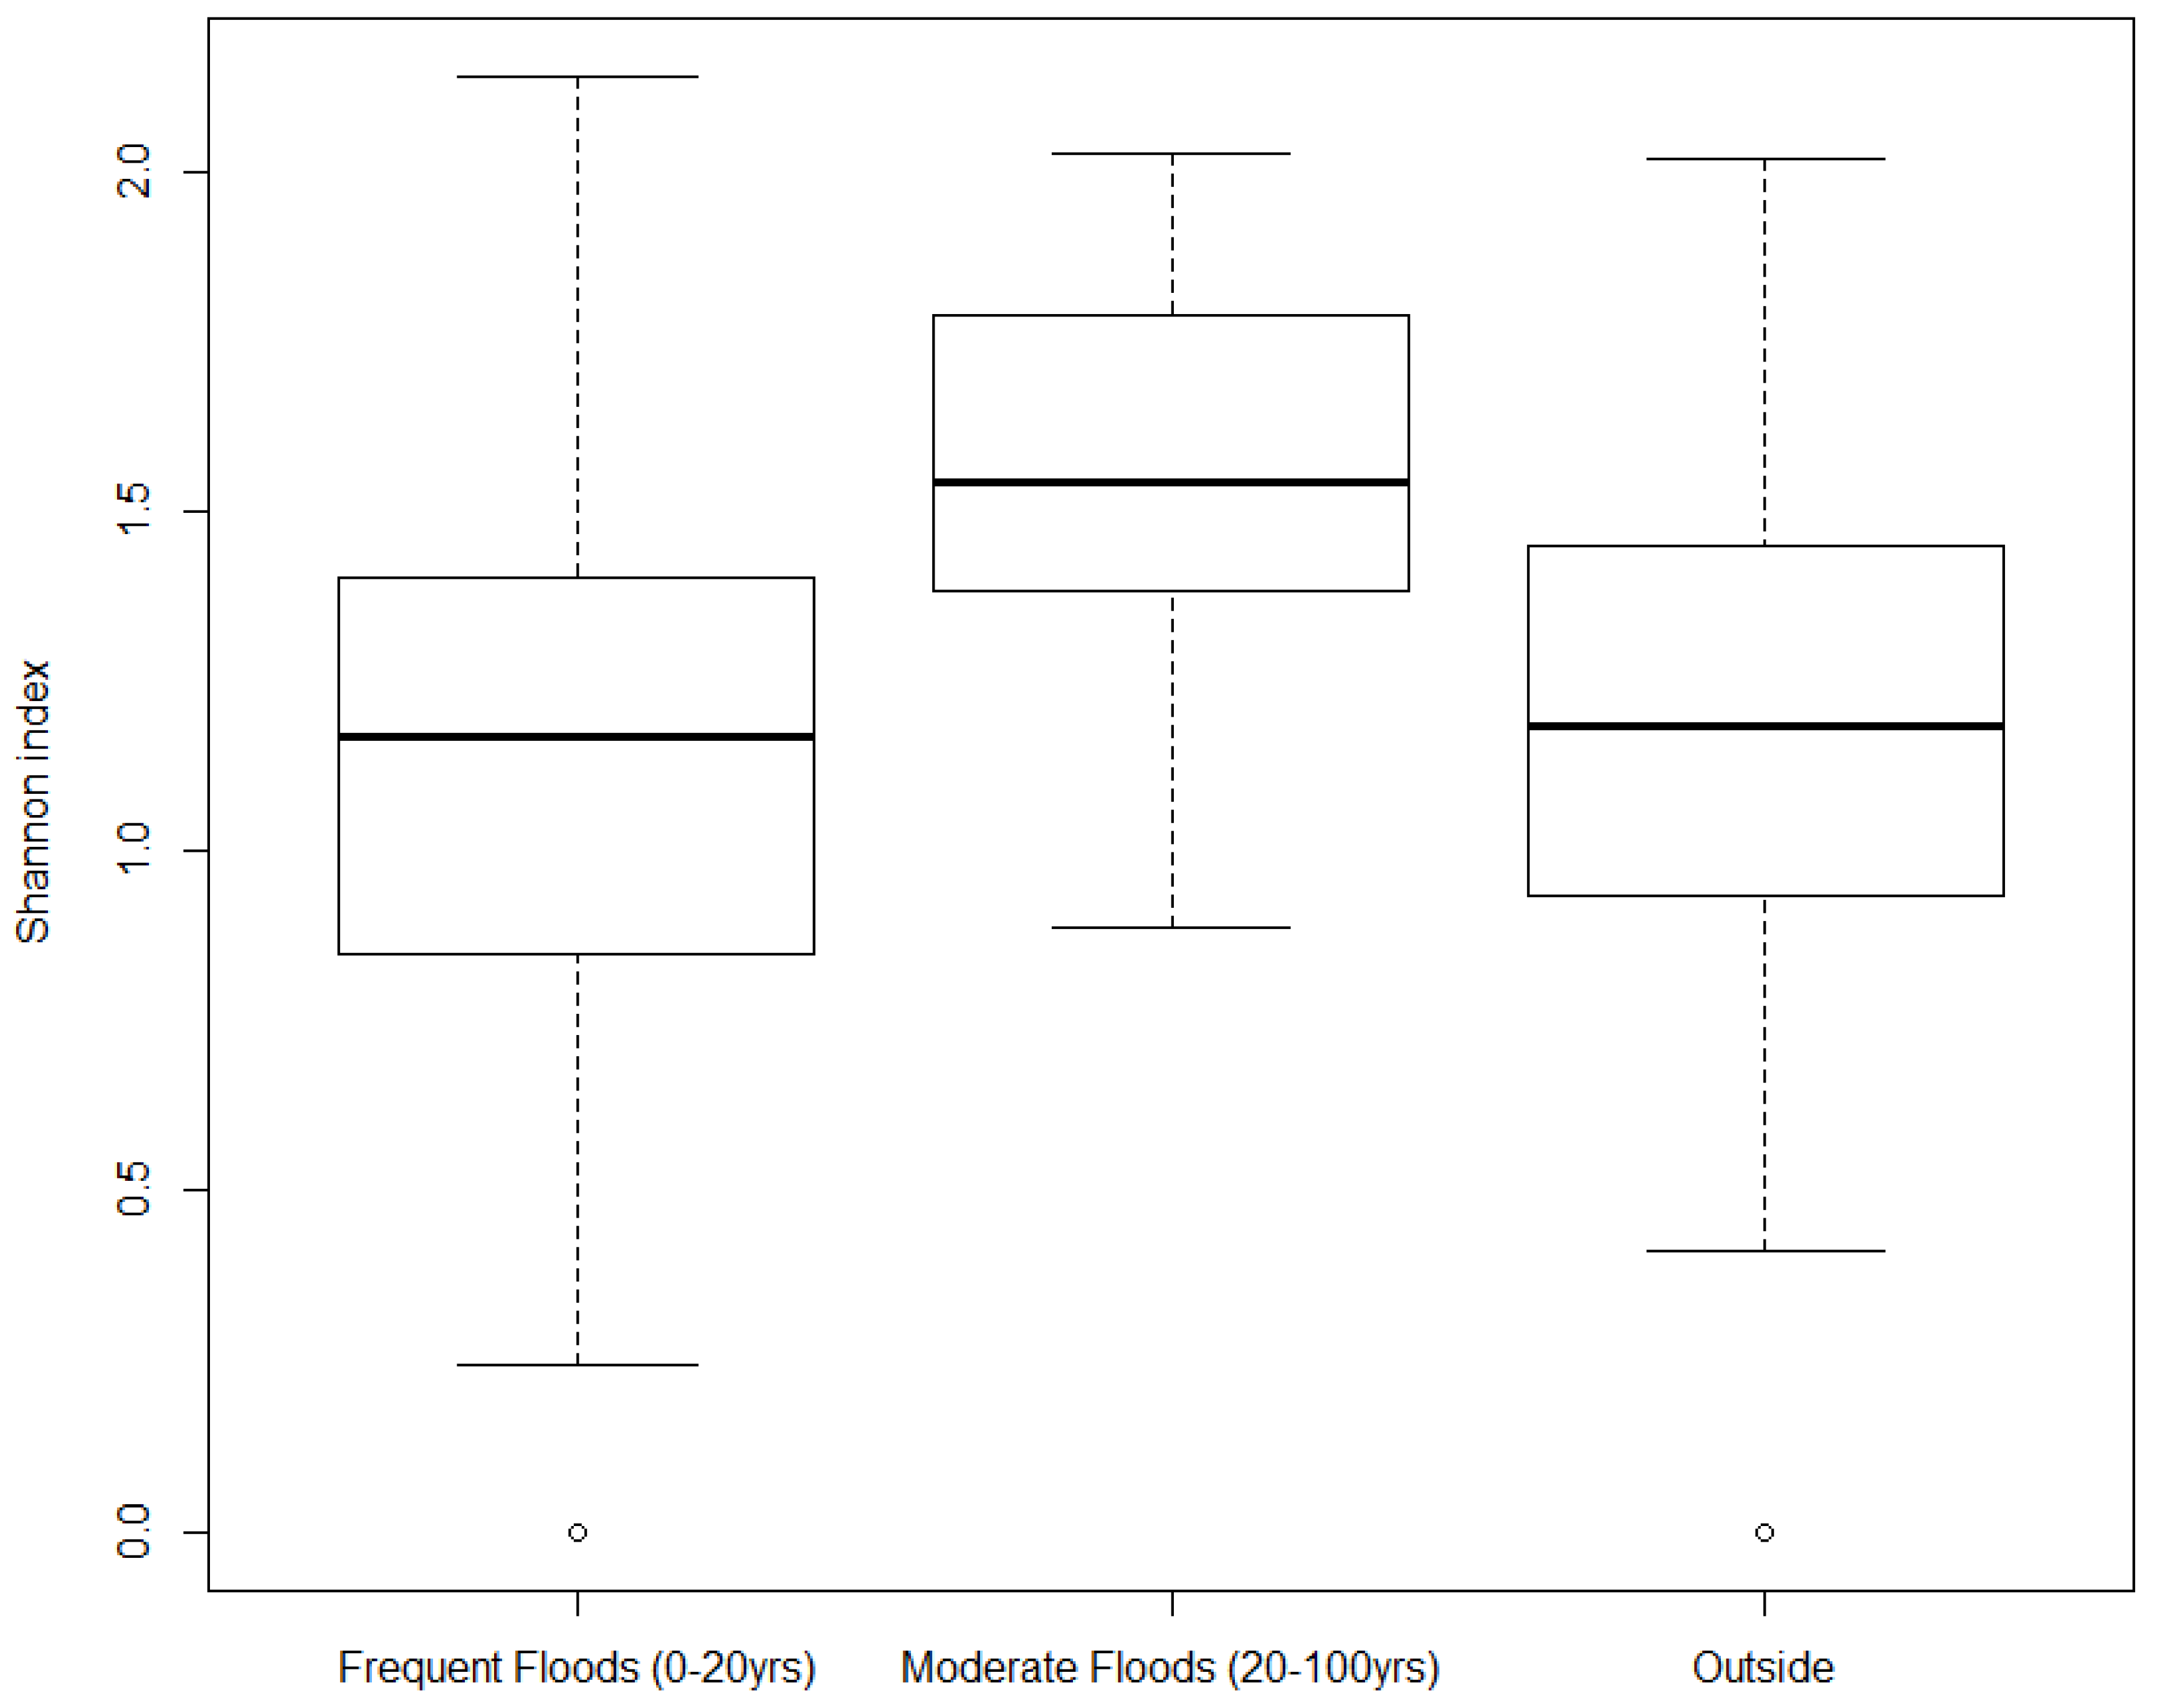
3.2. Biodiversity Index and Beta Diversity
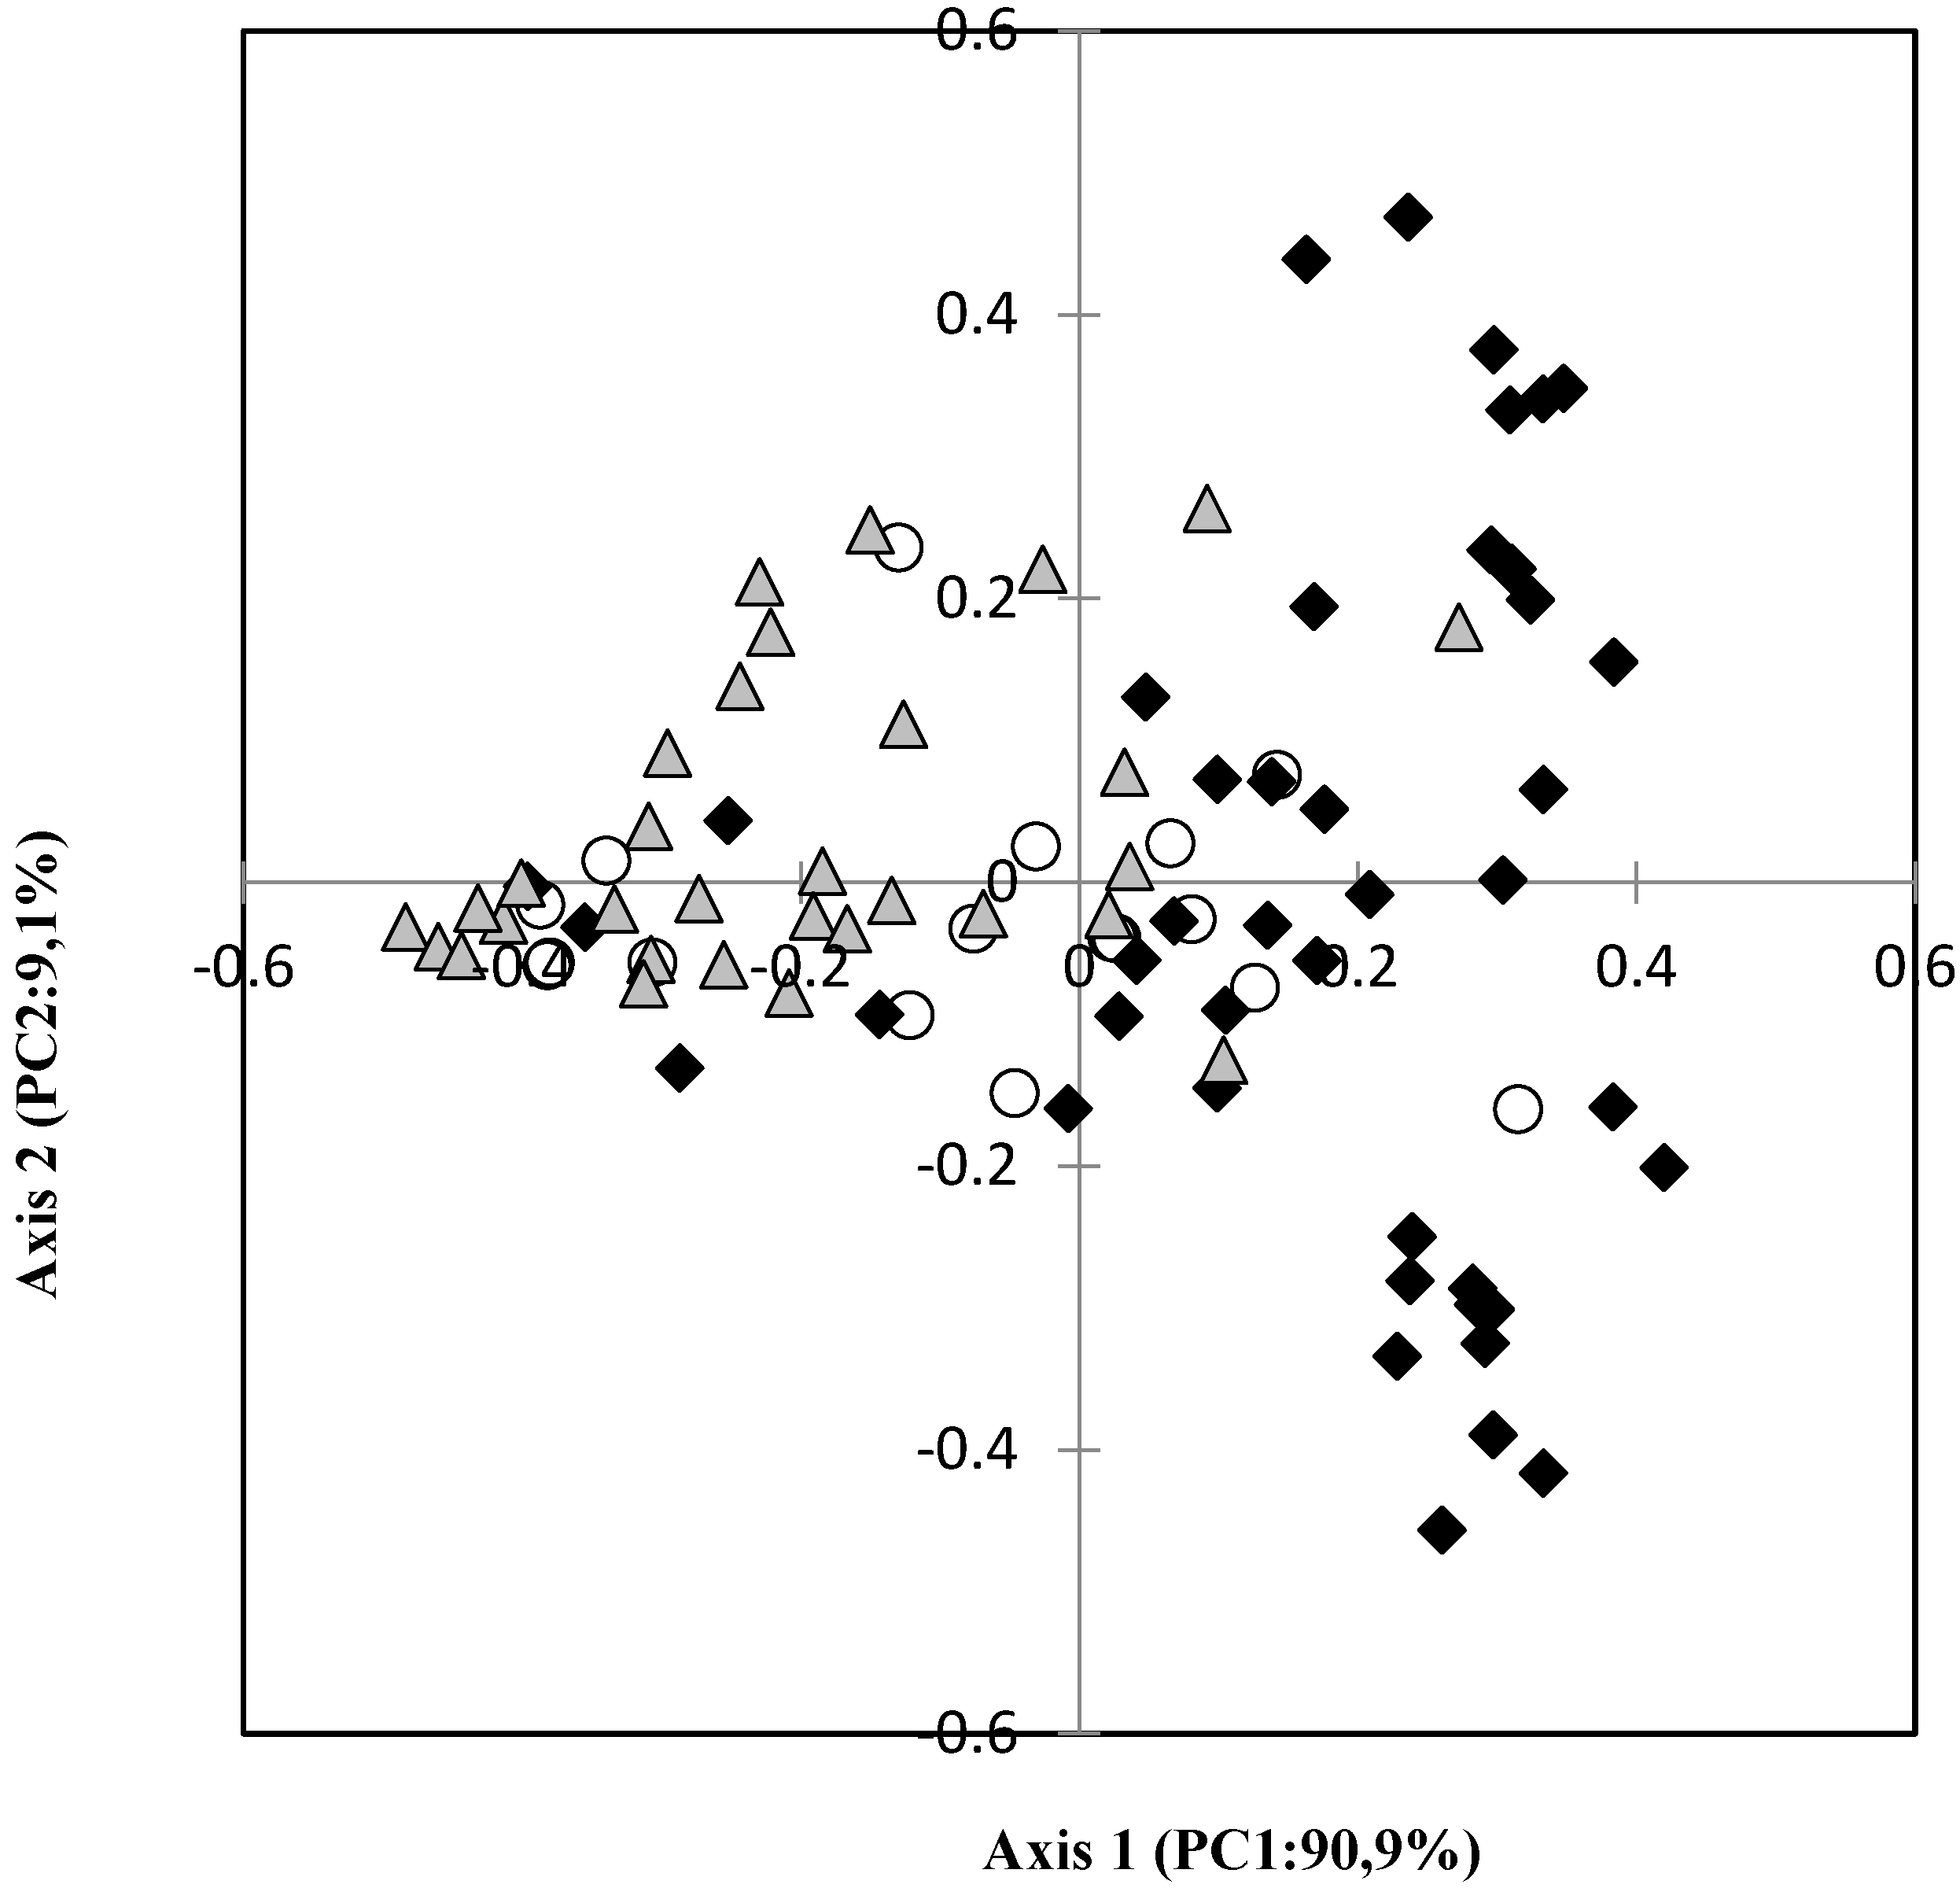
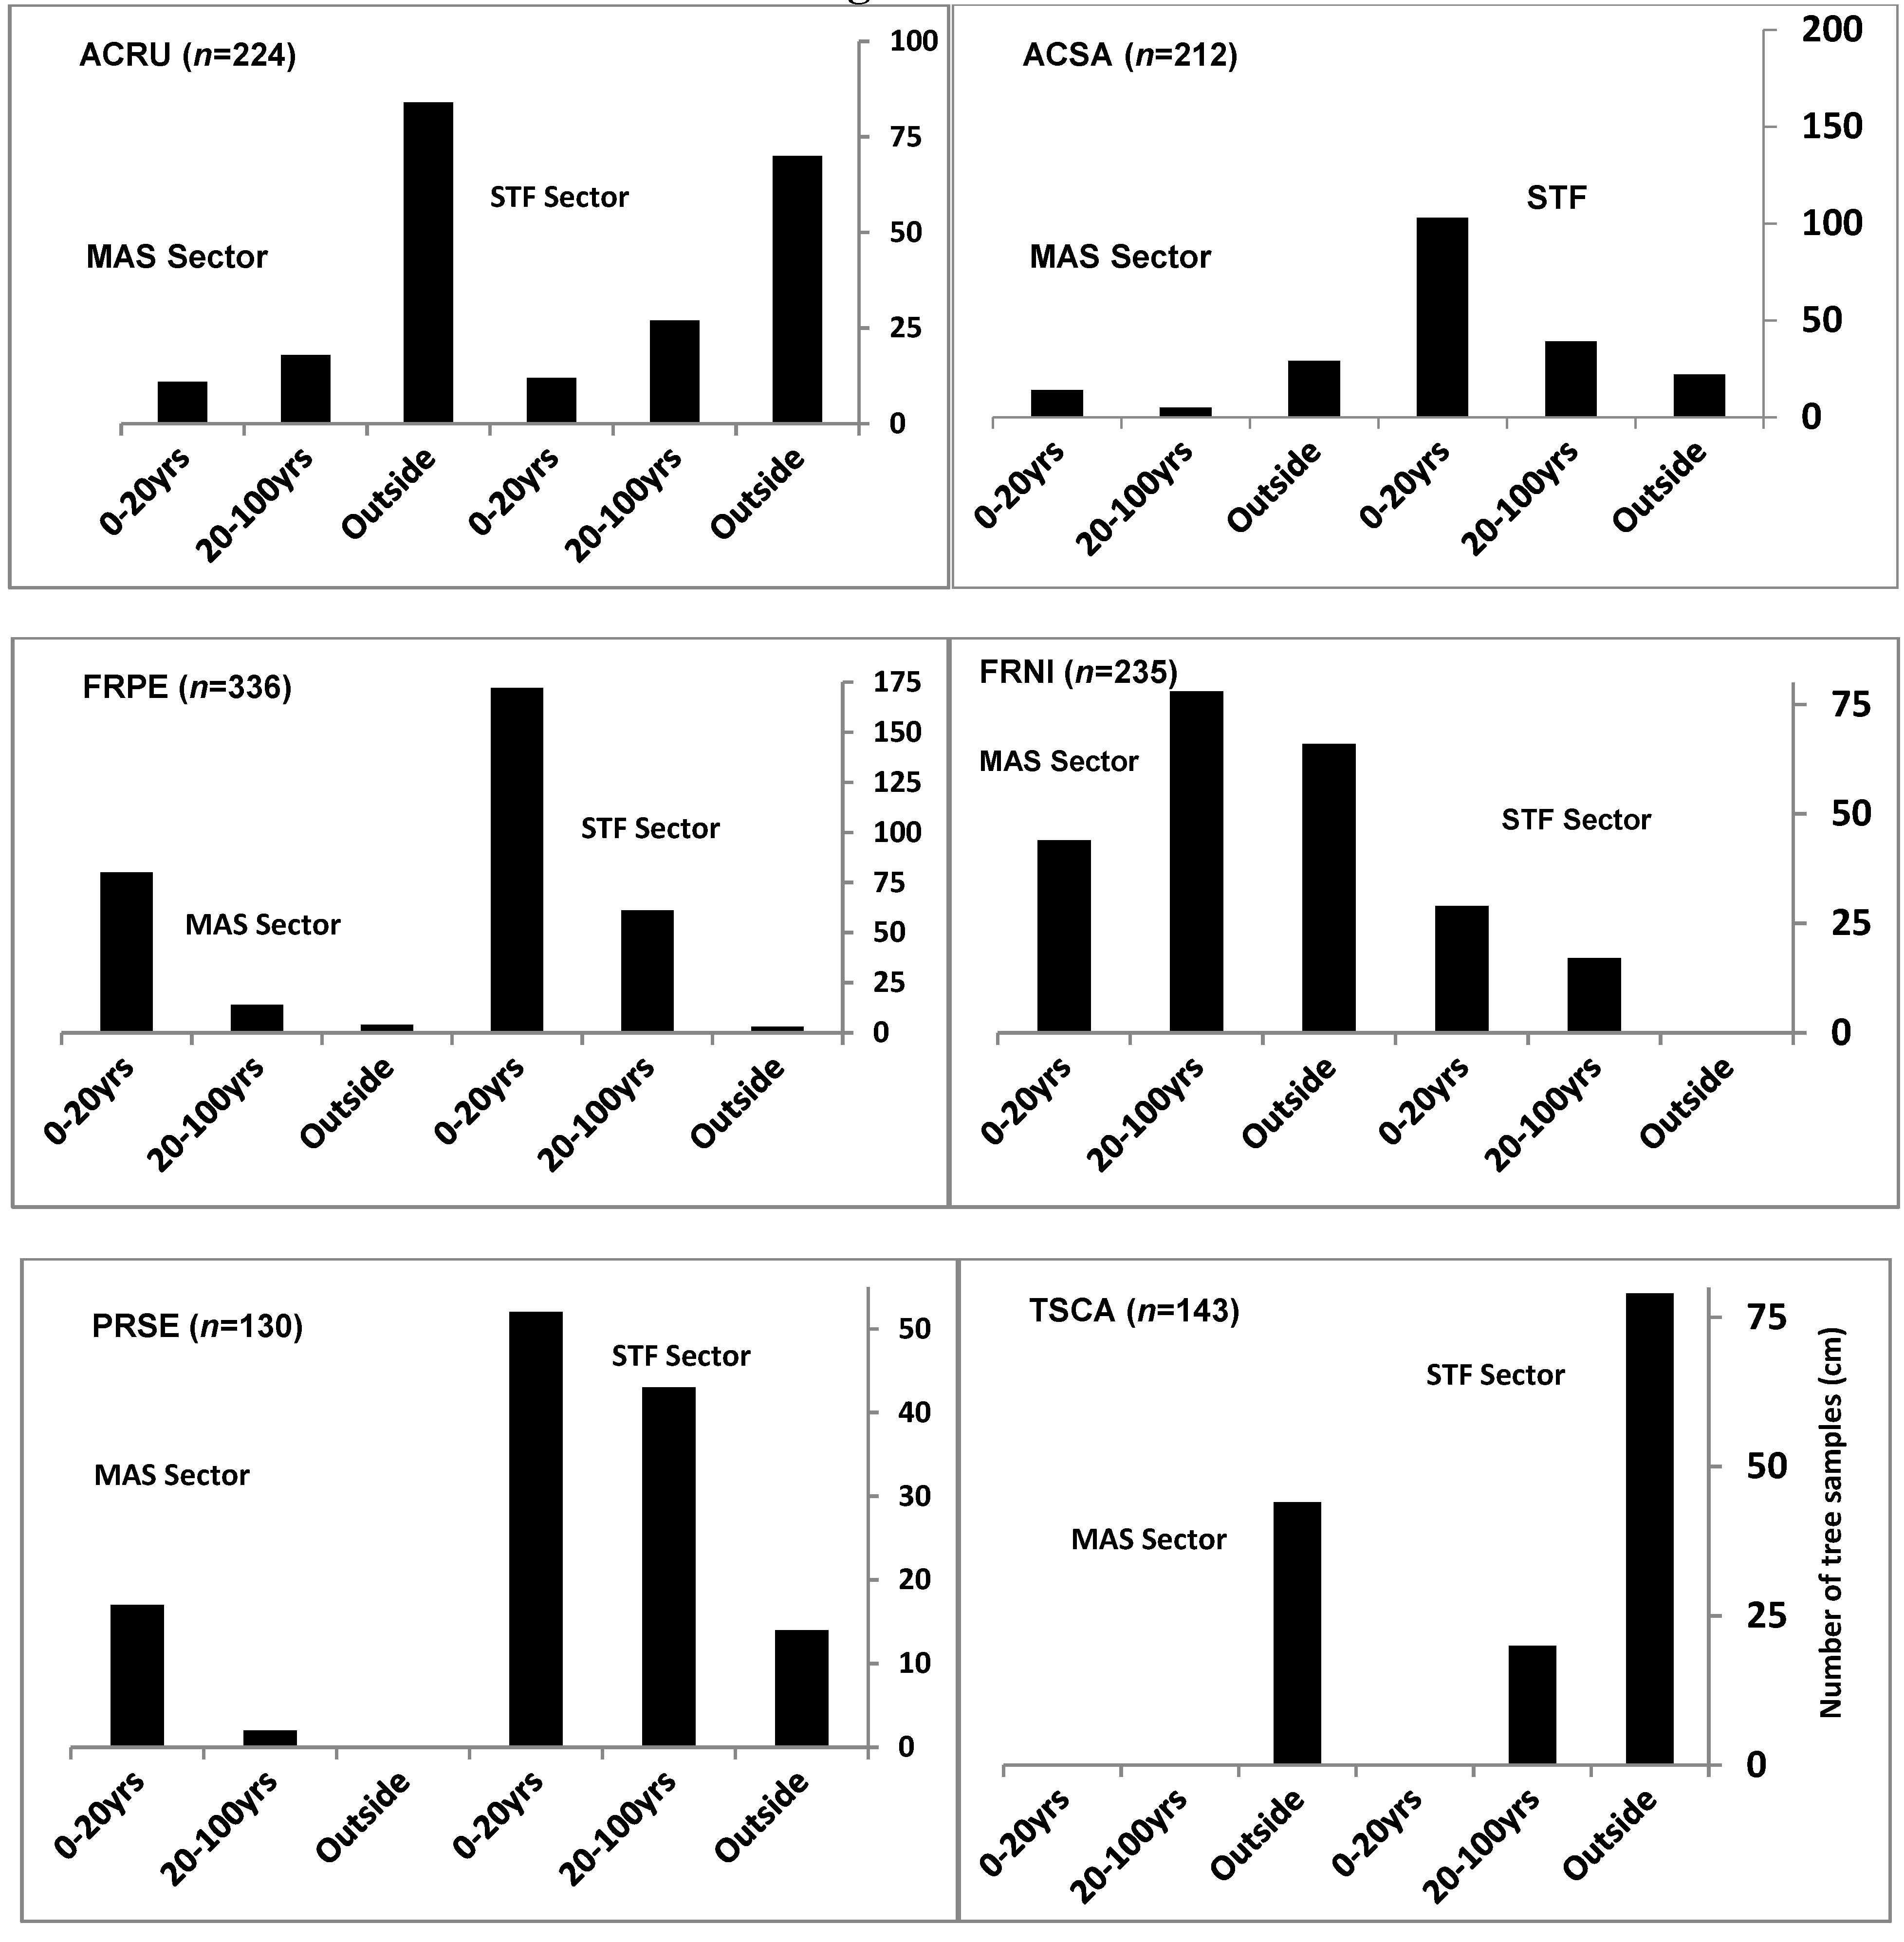
3.3. Distribution of Tree Species

4. Discussion
4.1. Composition and Species Diversity
| Dominant Tree Species | Total Tree Stems | Relative Density a (%) | Tree Diameter min-max (cm) | Tree Diameter (<10 cm) | Tree Diameter (10–30 cm) | Tree Diameter (>30 cm) | ||||||||||||
|---|---|---|---|---|---|---|---|---|---|---|---|---|---|---|---|---|---|---|
| FFz | MFz | NFz | FFz | MFz | NFz | FFz | MFz | NFz | FFz | MFz | NFz | FFz | MFz | NFz | FFz | MFz | NFz | |
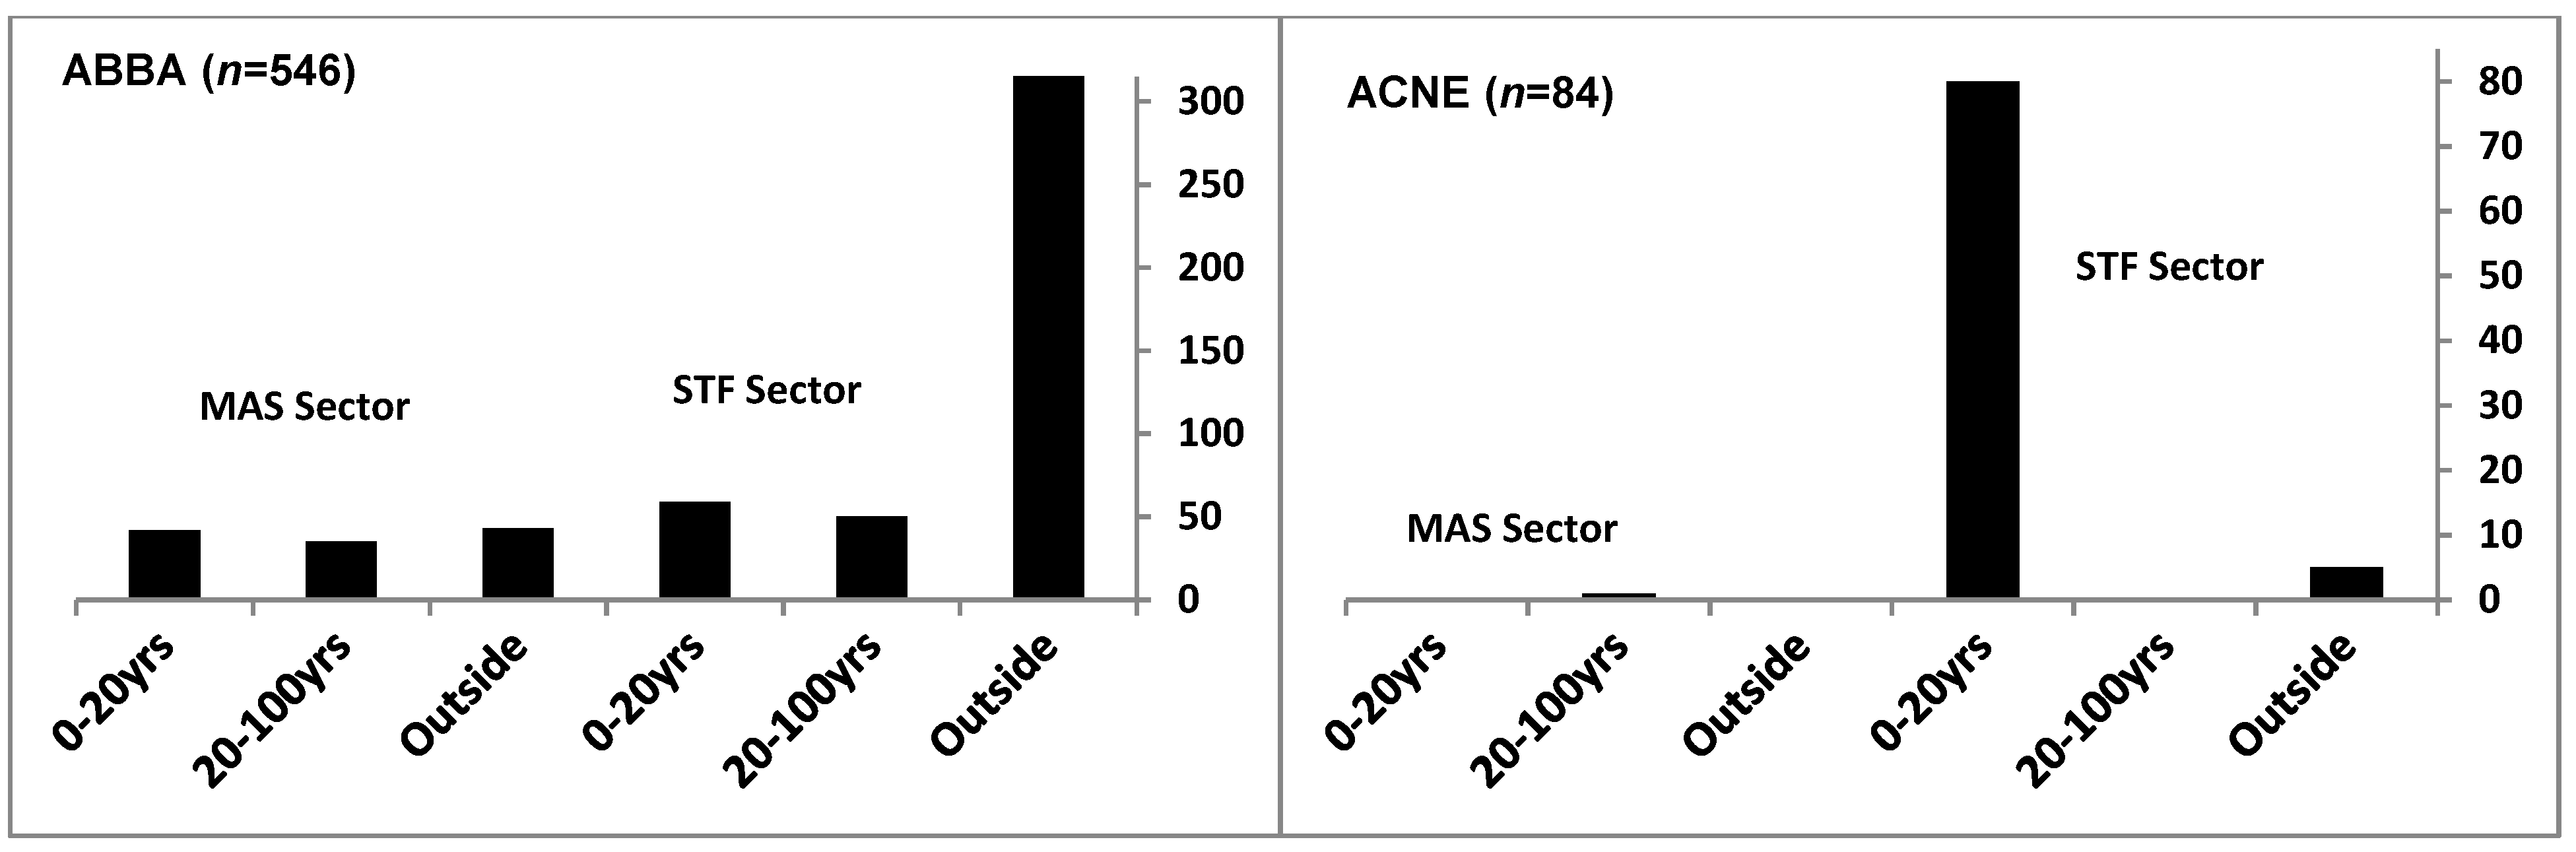
| Abies balsamea | 101 | 87 | 358 | 3.8 | 3.3 | 13.6 | 1.4–37.2 | 0.5–39.8 | 0.5–30.5 | 87 | 46 | 242 | 11 | 39 | 115 | 3 | 2 | 1 |
| Acer negundo | 81 | 3 | – | 3.1 | 0.1 | – | 1.2–54.0 | 14.9–34.7 | 13.4–26.9 | 33 | – | – | 35 | 2 | – | 13 | 1 | – |
| Acer rubrum | 28 | 35 | 161 | 1.1 | 1.3 | 6.1 | 1.7–39.0 | 1.2–44.9 | 0.5–56.1 | 11 | 13 | 74 | 12 | 19 | 83 | 5 | 2 | 3 |
| Acer saccharum | 117 | 44 | 51 | 4.4 | 1.8 | 1.9 | 0.6–72.0 | 0.7–47.5 | 1.2–59.0 | 92 | 28 | 26 | 21 | 12 | 21 | 4 | 4 | 4 |
| Betula alleghaniensis | 42 | 34 | 22 | 1.6 | 1.3 | 0.8 | 1.3–40.0 | 2.0–29.0 | 9.0–36.0 | 18 | 19 | 1 | 21 | 15 | 19 | 3 | – | 2 |
| Betula populifolia | 18 | 17 | 2 | 0.7 | 0.6 | 0.1 | 3.2–15.7 | 3.7–18.3 | 12.7–15.9 | 11 | 9 | – | 7 | 8 | 2 | – | – | – |
| Carpinus caroliniana | – | 61 | – | – | 2.3 | – | – | 0.9–12.3 | – | – | 59 | – | – | 2 | – | – | – | – |
| Fraxinus nigra | 74 | 95 | 66 | 2.8 | 3.6 | 2.5 | 1.2–42.6 | 1.0–25.3 | 1.2–11.8 | 41 | 70 | 65 | 31 | 25 | 1 | 2 | – | – |
| Fraxinus pennsylvanica | 252 | 76 | 8 | 9.6 | 2.9 | 0.3 | 0.2–58.4 | 0.4–52.9 | 0.4–40.0 | 174 | 20 | 19 | 79 | 2 | 4 | 13 | – | – |
| Pinus strobus | – | – | 31 | – | – | 1.2 | – | – | 2.0–66.2 | – | – | 1 | – | – | 8 | – | – | 22 |
| Populus tremuloides | 67 | 18 | 11 | 2.5 | 0.7 | 0.4 | 1.8–21.5 | 7.3–37.2 | 4.0–37.6 | 60 | 3 | 2 | 7 | 10 | 6 | 0 | 5 | 3 |
| Prunus serotina | 71 | 45 | 14 | 2.7 | 1.7 | 0.5 | 0.9–39.0 | 2.7–57.5 | 5.0–41.0 | 41 | 8 | 2 | 27 | 30 | 10 | 3 | 7 | 2 |
| Thuya occidentalis | 32 | 10 | 15 | 1.2 | 0.4 | 0.6 | 4.2–36.0 | 4.7–36.1 | 7.1–33.5 | 5 | 2 | 3 | 20 | 5 | 9 | 7 | 3 | 3 |
| Tilia americana | 39 | 13 | – | 1.5 | 0.5 | – | 2.0–54.7 | 1.30–27.2 | – | 22 | 6 | – | 16 | 7 | – | 1 | – | – |
| Tsuga canadensis | – | 20 | 123 | – | 0.7 | 4.7 | – | 1.5–18.3 | 1.2–42.8 | – | 5 | 45 | – | 15 | 67 | – | – | 11 |
| Ulmus rubra | 56 | 8 | 7 | 2.1 | 0.3 | 0.3 | 0.9–42.2 | 0.9–29.7 | 1.6–16.8 | 38 | 3 | 4 | 17 | 5 | 3 | 1 | – | – |
| Total | 978 | 566 | 869 | – | – | – | – | – | – | 633 | 291 | 484 | 304 | 196 | 348 | 55 | 24 | 51 |
4.2. Tree Forest Structure
5. Conclusions
Acknowledgments
Author Contributions
Appendix
| Tree Species | Species Code | Total Tree Stems | Tree Species | Species Code | Total Tree Stems | ||||
|---|---|---|---|---|---|---|---|---|---|
| Flood zones (FFz and MFz) and no-flood zones (NFz) | FFz | MFz | NFz | FFz | MFz | NFz | |||
| Abies balsamea (L.) Mill. | ABBA | 101 | 87 | 358 | Ostrya virginiana Mill. | OSVI | – | 3 | 13 |
| Acer negundo L. | ACNE | 81 | 3 | – | Picea glauca (Moench) | PIGL | – | 4 | 1 |
| Acer saccharinum L. | ACRI | 16 | 1 | – | Picea mariana (Mill.) | PIMA | 1 | 1 | 3 |
| Acer rubrum L. | ACRU | 28 | 35 | 161 | Picea rubens Sarg. | PIRU | – | 9 | 9 |
| Acer saccharum Marsh. | ACSA | 117 | 44 | 51 | Pinus strobus L. | PIST | – | – | 31 |
| Betula alleghaniensis Britt. | BEAL | 42 | 34 | 22 | Populus balsamifera L. | POBA | 3 | 7 | – |
| Betula papyrifera Marsh. | BEPA | 2 | 4 | 13 | Populus deltoides Bartr. | PODE | 1 | 4 | 3 |
| Betula populifolia Marsh. | BEPO | 18 | 17 | 2 | Populus grandidentata Michx. | POGR | 3 | 4 | 6 |
| Carpinus caroliniana Walt. | CACA | – | 61 | – | Populus tremuloides Michx. | POTR | 67 | 18 | 11 |
| Cornus altenifolia L. | COAL | 3 | – | – | Prunus serotina Ehrh. | PRSE | 71 | 45 | 14 |
| Corylus cornuta Marsh. | COCO | – | 2 | – | Quercus rubra L. | QURU | – | 9 | 3 |
| Fagus grandifolia Ehrh. | FAGR | 1 | 13 | 10 | Salix sp. | SALI | 3 | 1 | – |
| Fraxinus americana L. | FRAM | – | 11 | 5 | Thuja occidentalis L. | THOC | 32 | 10 | 15 |
| Fraxinus nigra Marsh. | FRNI | 74 | 95 | 66 | Tilia americana L. | TIAM | 39 | 13 | – |
| Fraxinus pennsylvanica Marsh. | FRPE | 252 | 76 | 8 | Tsuga canadensis (L.) Carr. | TSCA | 0 | 20 | 123 |
| Juglans cinerea L. | JUCI | – | 1 | – | Ulmus americana L. | ULAM | 6 | 5 | – |
| Larix laricina (Du Roi) Koch | LALA | 2 | 3 | – | Ulmus rubra Mühl. | ULRU | 56 | 8 | 7 |
| Malus pumila Mill. | MAPU | 4 | – | – | Unknown | UKN | 10 | 5 | 12 |
| Total of trees | 741 | 487 | 696 | 292 | 166 | 251 | |||
| Number of tree species | 14 | 16 | 10 | 12 | 17 | 14 | |||
Conflicts of Interest
References
- Amoros, C.; Bornette, G.; Henry, C. A vegetation-based method for ecological diagnosis of riverine wetlands. Environ. Manag. 2000, 25, 211–227. [Google Scholar] [CrossRef]
- Palmer, M.A.; Lettenmaier, D.P.; Poff, N.L.; Postel, S.L.; Richter, B.; Warner, R. Climate change and river ecosystems: Protection and adaptation options. Environ. Manag. 2009, 44, 1053–1068. [Google Scholar] [CrossRef]
- Cooper, D.J.; Andersen, D.C.; Chimner, R.A. Multiple pathways for woody plant establishment on floodplains at local to regional scales. J. Ecol. 2003, 91, 182–196. [Google Scholar] [CrossRef]
- Blöschl, G.; Ardoin-Bardin, S.; Bonell, M.; Dorninger, M.; Goodrich, D.; Gutknecht, D.; Matamoros, D.; Merz, B.; Shand, P.; Szolgay, J. At what scales do climate variability and land cover change impact on flooding and low flows? Hydrol. Proc. 2007, 21, 1241–1247. [Google Scholar] [CrossRef]
- Eckhardt, K.U.; Ulbrich, U. Potential impacts of climate change on groundwater recharge and streamflow in a central European low mountain range. J. Hydrol. 2003, 284, 244–252. [Google Scholar] [CrossRef]
- Van der Nat, D.; Tockner, K.; Edwards, P.J.; Ward, J.V.; Gurnell, A.M. Habitat change in braided flood plains (Tagliamento, NE-Italy). Fresh Biol. 2003, 48, 1799–1812. [Google Scholar] [CrossRef]
- Barnett, T.P.; Pierce, D.W.; Hidalgo, H.G.; Bonfils, C.; Santer, B.D.; Das, T.; Bala, G.; Wood, A.W.; Nozawa, T.; Mirin, A.A.; et al. Human-induced changes in the hydrology of the western United States. Science 2008, 319, 1080–1083. [Google Scholar] [CrossRef]
- Camporeale, C.; Perucca, E.; Ridolfi, L.; Gurnell, A.M. Modeling the interactions between river morphodynamics and riparian vegetation. Rev. Geophr. 2013, 51, 379–414. [Google Scholar]
- Battaglia, L.L.; Sharitz, R.R. Responses of floodplain forest species to spatially condensed gradients: A test of the flood-shade tolerance trade off hypothesis. Oecologia 2006, 147, 108–118. [Google Scholar] [CrossRef] [PubMed]
- Bornette, G.; Tabacchi, E.; Hupp, C.; Puijalon, S.; Rostan, J.C. A model of plant strategies in fluvial hydrosystems. Fresh. Biol. 2008, 53, 1692–1705. [Google Scholar] [CrossRef]
- Ward, J.V.; Tockner, K.; Arscott, D.B.; Claret, C. Riverine landscape diversity. Fresh. Biol. 2002, 47, 517–539. [Google Scholar] [CrossRef]
- Bendix, J.; Cowell, C.M. Disturbance and riparian tree establishment in the Sespe Wilderness, California, USA. Phys. Geogr. 2013, 34, 149–158. [Google Scholar]
- Rodríguez-González, P.M.; Campelo, F.; Albuquerque, A.; Rivaes, R.; Ferreira, M.T.; Santos Pereira, J. Sensitivity of black alder (Alnus glutinosa [L.] Gaertn.) growth to hydrological changes in wetland forests at the rear edge of the species distribution. Plant Ecol. 2014, 215, 233–245. [Google Scholar]
- Mouw, J.E.B.; Stanford, J.A.; Alaback, P.B. Influences of flooding and hyporheic exchange on floodplain plant richness and productivity. River Res. Appl. 2009, 25, 929–945. [Google Scholar] [CrossRef]
- Charron, I.; Johnson, E.A. The importance of fires and floods on tree ages along mountainous gravel-bed streams. Ecol. Appl. 2006, 16, 1757–1770. [Google Scholar] [CrossRef] [PubMed]
- Turner, M.G.; Gergel, S.E.; Dixon, M.D.; Miller, J.R. Distribution and abundance of trees in floodplain forests of the Wisconsin River: Environmental influences at different scales. J. Veg. Sci. 2014, 15, 729–738. [Google Scholar] [CrossRef]
- Rivaes, R.P.; Rodriguez-Gonzalez, P.M.; Ferreira, M.T.; Pinheiro, A.N.; Politti, E.; Egger, G.; Garcia-Arias, A.; Frances, F. Modeling the evolution of riparian woodlands facing climate change in three European rivers with contrasting flow regimes. PLoS ONE 2014, 9, e110200. [Google Scholar] [CrossRef] [PubMed]
- Gilvear, D.; Willby, N. Channel dynamics and geomorphic variability as controls on gravel bar vegetation, River Tummel, Scotland. River Res. Appl. 2006, 22, 457–474. [Google Scholar] [CrossRef]
- Pollock, M.; Naiman, R.; Hanley, T. Plant species richness in riparian wetlands-a test of biodiversity theory. Ecology 1998, 79, 94–105. [Google Scholar]
- Bendix, J. Stream power influence on southern Californian riparian vegetation. J. Veg. Sci. 1999, 10, 243–252. [Google Scholar] [CrossRef]
- Nilsson, C.; Grelsson, G.; Johansson, M.; Sperens, U. Patterns of plant species richness along riverbanks. Ecology 1989, 70, 77–84. [Google Scholar] [CrossRef]
- Cook, H.F. Floodplain nutrient and sediment dynamics on the Kent Stour. J. Water Environ. 2007, 21, 173–181. [Google Scholar] [CrossRef]
- Bailey, S.E.; Guimond, J.K. Aboveground biomass and nutrient limitation in relation to river connectivity in Montane floodplain marshes. Wetlands 2009, 29, 1243–1254. [Google Scholar] [CrossRef]
- Brovelli, A.; Batlle-Aguilar, J.; Barry, D.A. Analysis of carbon and nitrogen dynamics in riparian soils: Model development. Sci. Total Environ. 2012, 429, 231–245. [Google Scholar] [CrossRef] [PubMed]
- Rokosch, A.E.; Bouchard, V.; Fennessy, S.; Dick, R. The use of soil parameters as indicators of quality in forested depressional wetlands. Wetlands 2009, 29, 666–677. [Google Scholar] [CrossRef]
- Asaeda, T.; Pattiyage, I.; Gomes, A.; Takeda, E. Spatial and temporal tree colonization in a midstream sediment bar and the mechanisms governing tree mortality during a flood event. River Res. Appl. 2010, 26, 960–976. [Google Scholar] [CrossRef]
- Barrett, R.; Nielsen, D.L.; Croome, R. Association between the plant between the plant communities of floodplain wetlands, water regime and wetland type. River Res. Appl. 2010, 26, 866–876. [Google Scholar] [CrossRef]
- Hamdan, M.A.; Asada, T.; Hassan, F.M.; Warner, B.G.; Douabul, A.A.; al-Hilli, M.R.A.; Alwan, A.A. Vegetation response to Re-flooding in the Mesopotamian Wetlands, South Irak. Wetlands 2010, 30, 177–188. [Google Scholar] [CrossRef]
- Bendix, J.; Hupp, C.R. Hydrological and geomorphological impacts on riparian plant communities. Hydrol. Proces. 2000, 14, 2977–2990. [Google Scholar] [CrossRef]
- Tanentzap, A.J.; Lee, W.G.; Schulz, K.A.C. Niches drive peaked and positive relationships between diversity and disturbance in natural ecosystems. Ecosphere 2013, 4, 133. [Google Scholar] [CrossRef]
- Roxburgh, S.H.; Shea, K.; Wilson, J.B. The intermediate disturbance hypothesis: Patch dynamics and mechanisms of species coexistence. Ecology 2004, 85, 359–371. [Google Scholar] [CrossRef]
- Friedman, J.M.; Auble, G.T.; Andrews, E.D.; Kittel, G.; Madole, R.F.; Griffin, E.R.; Allred, T.M. Transverse and longitudinal variation in woody riparian vegetation along a Montane River. West North Am. Nat. 2006, 66, 78–91. [Google Scholar] [CrossRef]
- Hupp, C.R.; Rinaldi, M. Riparian vegetation patterns in relation to fluvial landforms and channel evolution along selected rivers of Tuscany (Central Italy). Ann. Assoc. Am. Geogr. 2007, 97, 12–30. [Google Scholar] [CrossRef]
- Franklin, S.C.; Kupfer, J.A.; Pezeshki, S.R.; Gentry, R.; Smith, R.D. Complex effects of channelization and levee construction on western Tennessee floodplain forest function. Wetlands 2009, 29, 451–464. [Google Scholar] [CrossRef]
- Drouin, A.; Saint-Laurent, D.; Lavoie, L.; Ouellet, C. High-Precision elevation model to evaluate the spatial distribution of soil organic carbon in active Floodplains. Wetlands 2011, 31, 1151–1164. [Google Scholar] [CrossRef]
- Saint-Laurent, D.; Lavoie, L.; Drouin, A.; St-Laurent, J.; Ghaleb, B. Floodplain sedimentation rates, soil properties and recent flood history in southern Québec. Glob. Planet. Chang. 2010, 70, 76–91. [Google Scholar] [CrossRef]
- Berthelot, J.S. Structure et Évolution des Peuplements Riverains en Fonction des Zones de Récurrence D’inondation (Bassin Centre-sud du Québec). Master’s Thesis, Département des Sciences de l’Environnement, Université du Québec à Trois-Rivières, Québec, QC, Canada, 2014. [Google Scholar]
- EC-MEF (Environment Canada and Ministry of Environment of Québec). Flood Risk Map : Saint-François River, Quebec. Government of Canada and Ministry of Environment, Québec. Designated areas as subject to recurrent and severe flooding. 1982. Available online: http://www.ec.gc.ca/eau-water/default.asp?lang=En&n=09DACE2F-1 (accessed on 7 March 2014).
- CEHQ (Centre D’expertise Hydrique du Québec) (2013). Cartographie des Zones de Risques d’inondation. Ministère du Développement Durable, de la Faune et des Parcs. 2013. Available online: http://www.cehq.gouv.qc.ca/zones-inond/cartographie/ (accessed on 12 March 2014).
- Lavoie, L.; Saint-Laurent, D.; St-Laurent, J. Pedological and sedimentological analyses of alluvial soils and paleosols on floodplain terraces. Can. J. Soil Sci. 2006, 86, 813–826. [Google Scholar] [CrossRef]
- Castonguay, S.; Saint-Laurent, D. Reconstructing Reforestation: Changing Land Use Patterns along the Saint-François River in the Eastern Townships. In Method and Meaning in Canadian Environmental History; MacEachern, A., Turkel, E.J., Eds.; Th. Nelson: Toronto, ON, Canada, 2009; pp. 273–292. [Google Scholar]
- Bélanger, D.; Grenier, F.; Poulin, C. Évolution de la Rivière Saint-François par le Profil, l’occupation des Rives, la Sédimentation et l’érosion; Rapport d’analyse et documents cartographiques; Université de Sherbrooke: Sherbrooke, QC, Canada, 2001; p. 35. [Google Scholar]
- Desmeules, J. Bassin Versant de la Saint-François: Ressources Humaines; Ministère des Richesses naturelles; Direction Générale des Eaux: Québec, QC, Canada, 1977; p. 98. [Google Scholar]
- PRDITT (Plan Régional de Développement Intégré des Ressources Naturelles et du Territoire). Portrait de la Forêt Naturelle du Centre-du-Québec. Available online: http://www.cre.centre-du-quebec.qc.ca/client/uploads/317/103942213210642.pdf (accessed on 10 April 2014).
- Ville de Sherbrooke. Schéma D’aménagement et de Développement Révisé. Règlement no. 875. Avril 2013. Available online: http://www.ville.sherbrooke.qc.ca/fileadmin/fichiers/Planification/Sch%C3%A9ma%20-%20Version%2015%20avril%20adopt%C3%A9e.pdf (accessed on 16 September 2014).
- Cogesaf (Conseil de Gouvernance de l’eau des Bassins Versants de la Rivière Saint-François). Analyse du Bassin Versant de la Rivière Saint-François. 2006. Available online: http://cogesaf.qc.ca/analyse-du-bassin-versant-de-la-riviere-saint-francois/ (accessed on 20 September 2014).
- Government of Canada. Canadian System of Soil Classification, 3rd ed.Soil Classification Working Group, Research Branch, Agriculture and Agri-Food Canada, Publication 1646; Government of Canada: Ottawa, ON, Canada, 1998.
- Saint-Laurent, D.; Gervais-Beaulac, V.; Berthelot, J.S. Variability of soil properties in different flood-risk zones and link with hydroclimatic changes (Southern Québec, Canada). Geoderma 2014, 214–215, 80–90. [Google Scholar] [CrossRef]
- Saint-Laurent, D.; Mesfioui, M.; Evin, G. Hydroclimatic variability and relation with flood events (Southern Québec, Canada). Water Res. 2009, 36, 43–56. [Google Scholar] [CrossRef]
- R Development Core Team. A Language and Environment for Statistical Computing; R Foundation for Statistical Computing: Vienna, Austria, 2011. [Google Scholar]
- Biswas, S.R.; Mallik, A.U. Disturbance effects on species diversity and functional diversity in riparian and upland plant communities. Ecology 2010, 91, 28–35. [Google Scholar] [CrossRef] [PubMed]
- Lorimer, C.G. Age structure and disturbance history of a southern Appalachian virgin forest. Ecology 1980, 61, 1169–1184. [Google Scholar] [CrossRef]
- Frey, B.R.; Ashton, M.S.; McKenna, J.J.; Ellum, D.; Finkral, A. Topographic and temporal patterns in tree seedling establishment, growth, and survival among masting species of southern New England mixed-deciduous forests. For. Ecol. Manag. 2007, 245, 54–63. [Google Scholar] [CrossRef]
- Stella, J.C.; Battles, J.J.; Orr, B.K.; McBride, J.R. Synchrony of seed dispersal, hydrology and local climate in a semi-arid river reach in California. Ecosystems 2006, 9, 1200–1214. [Google Scholar] [CrossRef]
- Mahoney, J.M.; Rood, S.B. Streamflow requirements for cottonwood seedling recruitment—An integrative model. Wetlands 1998, 18, 634–645. [Google Scholar] [CrossRef]
- Denslow, J.S.; Battaglia, L.L. Stand composition and structure across a changing hydrologic gradient: Jean Lafitte National Park. Wetlands 2002, 22, 738–752. [Google Scholar] [CrossRef]
- Wharton, C.H.; Kitchens, W.M.; Pendleton, E.C.; Sipe, T.W. The ecology of bottomland hardwood swamps of the southeast: A community profile. FWS/OBS 1982, 81, 37. [Google Scholar]
- Goodburn, J.M.; Lorimer, G.G. Population structure in old-growth and managed northern hardwoods: An examination of the balanced diameter distribution concept. For. Ecol. Manag. 1999, 118, 11–29. [Google Scholar] [CrossRef]
- Foster, D.R. Disturbance history, community organization and vegetation dynamics of the old-growth Pisgah forest, southwestern New Hamphire, USA. J. Ecol. 1988, 76, 105–134. [Google Scholar] [CrossRef]
- Brady, N.C.; Weil, R.R. The Nature and Properties of Soils, 14th ed.; Prentice Hall: Upper Saddle River, NJ, USA, 2007. [Google Scholar]
© 2015 by the authors; licensee MDPI, Basel, Switzerland. This article is an open access article distributed under the terms and conditions of the Creative Commons Attribution license (http://creativecommons.org/licenses/by/4.0/).
Share and Cite
Berthelot, J.-S.; Saint-Laurent, D.; Gervais-Beaulac, V.; Présent, A. A Comparison of the Composition and Diversity of Tree Populations along a Hydrological Gradient in Floodplains (Southern Québec, Canada). Forests 2015, 6, 929-956. https://doi.org/10.3390/f6040929
Berthelot J-S, Saint-Laurent D, Gervais-Beaulac V, Présent A. A Comparison of the Composition and Diversity of Tree Populations along a Hydrological Gradient in Floodplains (Southern Québec, Canada). Forests. 2015; 6(4):929-956. https://doi.org/10.3390/f6040929
Chicago/Turabian StyleBerthelot, Jean-Sébastien, Diane Saint-Laurent, Vernhar Gervais-Beaulac, and Aurélien Présent. 2015. "A Comparison of the Composition and Diversity of Tree Populations along a Hydrological Gradient in Floodplains (Southern Québec, Canada)" Forests 6, no. 4: 929-956. https://doi.org/10.3390/f6040929