Article

Carbon Storage and Allocation Pattern in Plant Biomass among Different Forest Plantation Stands in Guangdong, China

1
Key Laboratory of Vegetation Restoration and Management of Degraded Ecosystems, South China Botanical Garden, Chinese Academy of Sciences, Xingke Road 723, Tianhe District, Guangzhou 510650, China
2
University of Chinese Academy of Sciences, Beijing 100049, China
*
Authors to whom correspondence should be addressed.
Forests 2015, 6(3), 794-808; https://doi.org/10.3390/f6030794
Submission received: 17 November 2014 / Revised: 11 March 2015 / Accepted: 16 March 2015 / Published: 19 March 2015

Abstract

:
In order to understand how carbon storage and allocation patterns vary among plantation types, we estimated carbon allocation between above- and below-ground compartments in four subtropical plantations and a naturally recovered shrubland (as a control). Results indicated that the carbon storage and allocation pattern varied greatly among forest types and was highly dependent on specific traits of trees and understory vegetation. The fast-growing species, such as Eucalyptus urophylla, accumulated more carbon in plant biomass. The biomass carbon was about 1.9- and 2.2-times greater than the 10-species mixed plantation and Castanopsis hystrix plantations, respectively. Meanwhile, the plantations sequestered 1.5- to 3-times more carbon in biomass than naturally recovered shrubland. The carbon allocation pattern between above- and below-ground compartments also varied with plantation type and stand age. The ratio of tree root carbon to tree aboveground carbon decreased with stand age for Eucalyptus urophylla and the 10-species mixed plantation. In contrast, the ratio increased for Acacia crassicarpa. Our data suggested that planting the fast-growing species in the degraded land of subtropical China was an effective choice in terms of carbon sequestration. The information about carbon allocation patterns was also valuable for decision making in sustainable forest management and climate change mitigation.

1. Introduction

In recent centuries, the concentration of atmospheric CO2 has increased to 380 ppm, mainly due to human activities [1]. As a means of carbon sequestration, afforestation plays a vital role in alleviating the CO2 emission [2]. The carbon storage capacity of forest ecosystems has been the focus of significant research [3]. In the last two decades, the carbon sequestration function of forest systems has been significantly increased in China [4]. The plantation forests contributed about 80% of the total forest carbon sink increment of China [5]. The area of plantations in China was about 6.9 × 10⁷ ha and accounted for about one third of the world’s plantation area [6]. Most of these plantations are still immature [7] and show a substantial potential for carbon sequestration [8]. Carbon sinks in southern China accounted for more than 65% of the national carbon sinks [9].
Carbon sequestration could be affected by plantation types and stand ages [10]. It is urgent to assess the effects of forest types on carbon sequestration and carbon allocation in the subtropical region. Traditionally, “space-for-time substitution” and model simulation were the most frequently used approaches in previous studies that focused on carbon storage in different forest chronosequences [11]. However, the inaccuracy of the model and spatial heterogeneity greatly increased the uncertainty of results based on such methods [12]. Therefore, monitoring the forest dynamics of carbon sequestration for a longer term is an alternative approach and is necessary.
Carbon allocation in above- and below-ground components of plants is one of the key processes of carbon cycling. The rate of carbon sequestration in above- and below-ground compartments is not coupled [13]. For example, total belowground carbon allocation of a Eucalyptus saligna plantation was observed to decline with stand age [14], but the underlying mechanism of carbon allocation was still poorly understood. Van der Werf and Nagel [15] suggested that carbon allocation to shoots and roots was mediated by nitrogen supply via regulating cytokinins and sucrose production. Most studies on carbon allocation in trees were conducted by using empirical, allometric and evolution-based modelling methods [16]. However, the studies regarding the carbon storage and allocation pattern among different plantation types are still scarce. Such information is vital to improve the estimation of the forest carbon budget and to provide the basis for forest management at a regional scale.
Currently, the most common tree species used for plantations in southern China are Eucalyptus spp. and Acacia spp. [17]. They are generally cultivated in monocultures. The increased demand for high-quality timber and ecological services has resulted in the cultivation of valuable mixed plantations with native broad-leaved plant species [18,19]. In the current study, the plantations include: Eucalyptus urophylla monoculture (EU), Acacia crassicarpa monoculture (AC), Castanopsis hystrix monoculture (native species, CH), the mixed plantation of 10 native species (MX) and a naturally recovered shrubland as the control (NS).
This study aimed to assess how the carbon storage and allocation varied with the five vegetation types (EU, AC, CH, MX and NS) in southern China. We used inventory data to estimate carbon stocks in above- and below-ground compartments, including trees, shrubs, herbs, forest floors and roots. We attempted to test the following hypotheses: (1) plantations of fast-growing exotic species accumulate more carbon in the plant biomass than those of native species; (2) plantations sequester more carbon in the plant biomass than the naturally recovered shrubland; and (3) carbon allocation patterns change with tree species and stand age.

2. Methods

2.1. Study Area

This study was conducted at the Heshan National Field Research Station of Forest Ecosystem (112°50′ E, 22°34′ N), Guangdong Province, China. This region has a typical subtropical monsoon climate with a distinct wet (from April to September) and dry season (from October to March) [20]. The mean annual precipitation is 1688 mm, and the mean annual temperature is 22.3 °C from 2005 to 2012. The soil is classified as an Ultisol developed from sandstone [21]. In 2005, a Pinus massoniana monoculture with an area of 50 ha was cut, and the residues were burned. Four types of tree plantations and an unplanted control were established after the burning without soil ripping. Each treatment had three replicated plots (total 15 plots), and the area of each plot was about 1 ha. All plots were randomly distributed in the 50-ha study area [20]. All plantations were planted with a spacing of 2 m × 3 m (about 1650 trees per hectare). Understory vegetation was highly dominated by Diranopteris dichotoma, and other common understory herbaceous species included: Blechnum orientale and Miscanthus sinensis and shrubs, such as Rhodomyrtus tomentosa, Melastoma candidum, Gardenia jasminoides and Ilex asprella var. asprella.

2.2. Field Inventory

2.2.1. Biomass Inventory of Trees and Shrubs

In 2005, a permanent quadrat plot of 900 m2 (30 m by 30 m) was established in the center of each of the three replications for each plantation type. Vegetation inventories were conducted in 2006, 2008, 2009 and 2011, corresponding to 1 year, 3 years, 4 years and 6 years after plot establishment in these plantations. We measured the height of each plant, tree DBH (diameter at breast height) and the basal diameter of all shrubs at each inventory. Each plant with a diameter at breast height (DBH) of more than 1 cm was marked and numbered in 2011.
We selected 5 to 12 standard trees with different DBH classes for each key species. The DBH classes were categorized by every 4 cm. In each DBH class, the number of standard trees was decided according to the proportion of the numbers of plant at the same DBH class in all plants. The aboveground materials of the trees were sorted into stems, branches and leaves. The roots of sampled trees from 0–60 cm were dug out and examined. Fresh weight for each component of the sample tree was measured separately on site. Then, we randomly selected some representative stems, branches, leaves and roots, and they were taken back to the laboratory and oven-dried at 75 °C to constant weight after recording their fresh weight in the field. Subsequently, the water content for each component was determined. The dry weight for each component was calculated according to the total fresh weight of the corresponding component and its water content.
Based on the measurements for standard trees, we estimated the dry weight of biomass for each plantation by allometric regression equations for trees and shrubs.
Y = a × (D2 × H)b
where a and b are statistic parameters and D and H are the DBH (cm) and height (m), respectively. The equations and summary statistics are in Table 1.
Table 1. Allometric regression equations and the statistics.
PlantSpeciesAboveground biomassRoot biomassNumber of sampled plants
Regression equationR2Regression equationR2
Trees (DBH >1 cm or height >1.5 m)Eucalyptus urophyllay = 0.1691x0.74720.9462y = 0.1723x0.5630.894212
Acacia crassicarpay = 0.4171x0.62010.9750y = 0.0562x0.67250.914112
Liquidambar formosanay = 0.2894x0.74050.8598y = 0.136x0.6730.78509
Michelia maudiaey = 0.1419x0.96940.9932y = 0.064x0.64640.71395
Manglietia glaucay = 0.6355x0.47510.8123y = 0.0635x0.66280.89949
Tsoongiodendron odorumy = 0.1466x0.83090.9367y = 0.0442x0.72560.88467
Machilus chinensisy = 1.1447x0.5820.9500y = 0.3663x0.50810.96937
Cinnamomum bodinieriy = 0.376x0.51710.8521y = 0.1017x0.68830.87148
Michelia macclureiy = 0.201x0.80130.8022y = 0.038x0.79990.85939
Cinnamomum burmanniiy = 0.9665x0.30150.7535y = 0.3376x0.24020.84465
Castanopsis hystrixy = 0.2926x0.71620.9555y = 0.1017x0.59410.82389
Litsea glutinosay = 0.1518x0.74350.8130y = 0.0337x0.79130.75008
Castanopsis fissay = 0.3778x0.6140.8782y = 0.0718x0.70440.95485
Elaeocarpus japonicusy = 0.0938x0.85890.7841y = 0.0289x0.84690.67125
Litsea cubebay = 0.0497x1.05290.8348y = 0.0019x1.50240.75496
Pinus massonianay = 0.0245x1.02090.9711y = 0.0126x0.90240.96855
Trees (DBH <1 cm and height <1.5 m)Liquidambar formosanay = 0.0407x0.91470.9879y = 0.0336x0.770.99975
Castanopsis hystrixy = 0.1388x0.70960.9457y = 0.0013x1.23650.98715
Machilus chinensisy = 0.0587x0.90820.9991y = 0.0319x0.76310.99305
Michelia macclureiy = 0.0039x1.44350.9629y = 0.002x1.23230.91925
Litsea glutinosay = 0.0227x1.01250.9319y = 0.0022x1.23590.83816
Castanopsis fissay = 0.0506x0.8990.9724y = 0.0082x0.99530.98445
Elaeocarpus japonicusy = 0.1316x0.69590.7827y = 0.0423x0.68270.69455
Litsea cubebay = 0.0043x1.36070.9080y = 0.0004x1.51830.75977
ShrubsMallotus apeltay = 0.1004x0.40180.7590y = 0.0364x0.36760.64668
Rhaphiolepis indicay = 0.0402x0.94710.6695y = 0.0055x1.11220.89878
Gardenia jasminoidesy = 0.0556x0.96360.8814y = 0.0295x0.59910.66357
Cassia toray = 0.0267x1.30750.9649y = 0.0117x1.16520.89557
Rhodomyrtus tomentosay = 0.4571x0.73460.6964y = 0.2144x0.88130.62707
Melastoma candidumy = 0.063x0.8300.8260y = 0.042x0.3580.69407
Ilex asprellay = 0.1569x0.58990.8355y = 0.0498x0.62480.819211
Clerodendrum fortunatumy = 0.0351x0.76750.9201y = 0.0092x0.66730.839312
Note: In regression equations, the x stands for the square of the diameter at breast height (cm) multiplied by the plant height (m). When the diameter at breast height is less than 1 cm and the height is less than 1.5 m, the diameter at breast height is replaced as the basal diameter.
Aboveground biomass refers to the sum of the dry weight of stems, branches and leaves; belowground biomass refers to dry root weight; and the total carbon storage refers to the sum of tree total carbon storage, shrub total carbon storage, herb total carbon storage and forest floor carbon storage in this study. The bark was not removed from stems or branches, and all branches were included in aboveground biomass.

2.2.2. Measurements of Herbaceous Biomass and Forest Floor Mass

Measurements of herbaceous biomass and forest floor mass were carried out in the 6th year. In order to avoid destroying the quadrats, we randomly selected three typical 1 m × 1 m sub-plots just outside of the quadrat and harvested all above- and below-ground biomass and forest floor mass (n = 9 sub-plots for each plantation). All samples of herbs and the forest floor were taken back to the laboratory and oven-dried at 65 °C to constant weight for biomass estimation. Samples of the above- and below-ground components were ground and sieved in the laboratory for subsequent physiochemical analysis.

2.2.3. Measurement of Soil Carbon Content

Surface soil samples were collected at the same time in the 6th year. The soils were sampled with a corer (3.0 cm in diameter) at 0–10 cm depths from five randomly selected locations in each plot. Five cores of the same depth from each plot were combined to form one composite sample. Three composite soil samples per quadrat were taken for the same depth. Plant residues and roots were removed. Soils were then sieved with a 2-mm sieve and taken back to the laboratory for physicochemical analysis. Soil organic carbon was determined with the traditional potassium dichromate oxidation method [22].

2.2.4. Calculation of Carbon Stocks

To convert biomass to carbon storage, we assumed a constant carbon content of 50% for trees and shrubs [23]. Carbon contents in herbs and the forest floor were analyzed by the traditional potassium dichromate oxidation method [22]. We determined the carbon storages in vegetation by multiplying carbon content with dry biomass amount.

2.3. Statistical Analysis

The tree total carbon storage and shrub total carbon storage were analyzed by repeated measure ANOVA with plantation types as the between-subjects factor and stand age as the within-subject factor, followed by one-way ANOVAs analyses at the same stand age. One-way ANOVAs were used to compare the effects of plantation types on herb total carbon storage, total aboveground carbon of living plant, total root carbon of living plant, forest floor carbon storage, total carbon storage, proportion of total living plant carbon storage and soil properties (e.g., pH, soil organic carbon (SOC), total nitrogen (TN) and C:N ratio). Data were reciprocally or square-root transformed when required to meet the assumptions of normality and the homogeneity of variance. Multiple comparison analyses (LSD) were used after one-way ANOVAs. Statistical significance was determined at p < 0.05. All analyses were performed with SPSS software (SPSS. Inc, Chicago, IL, USA).

3. Results

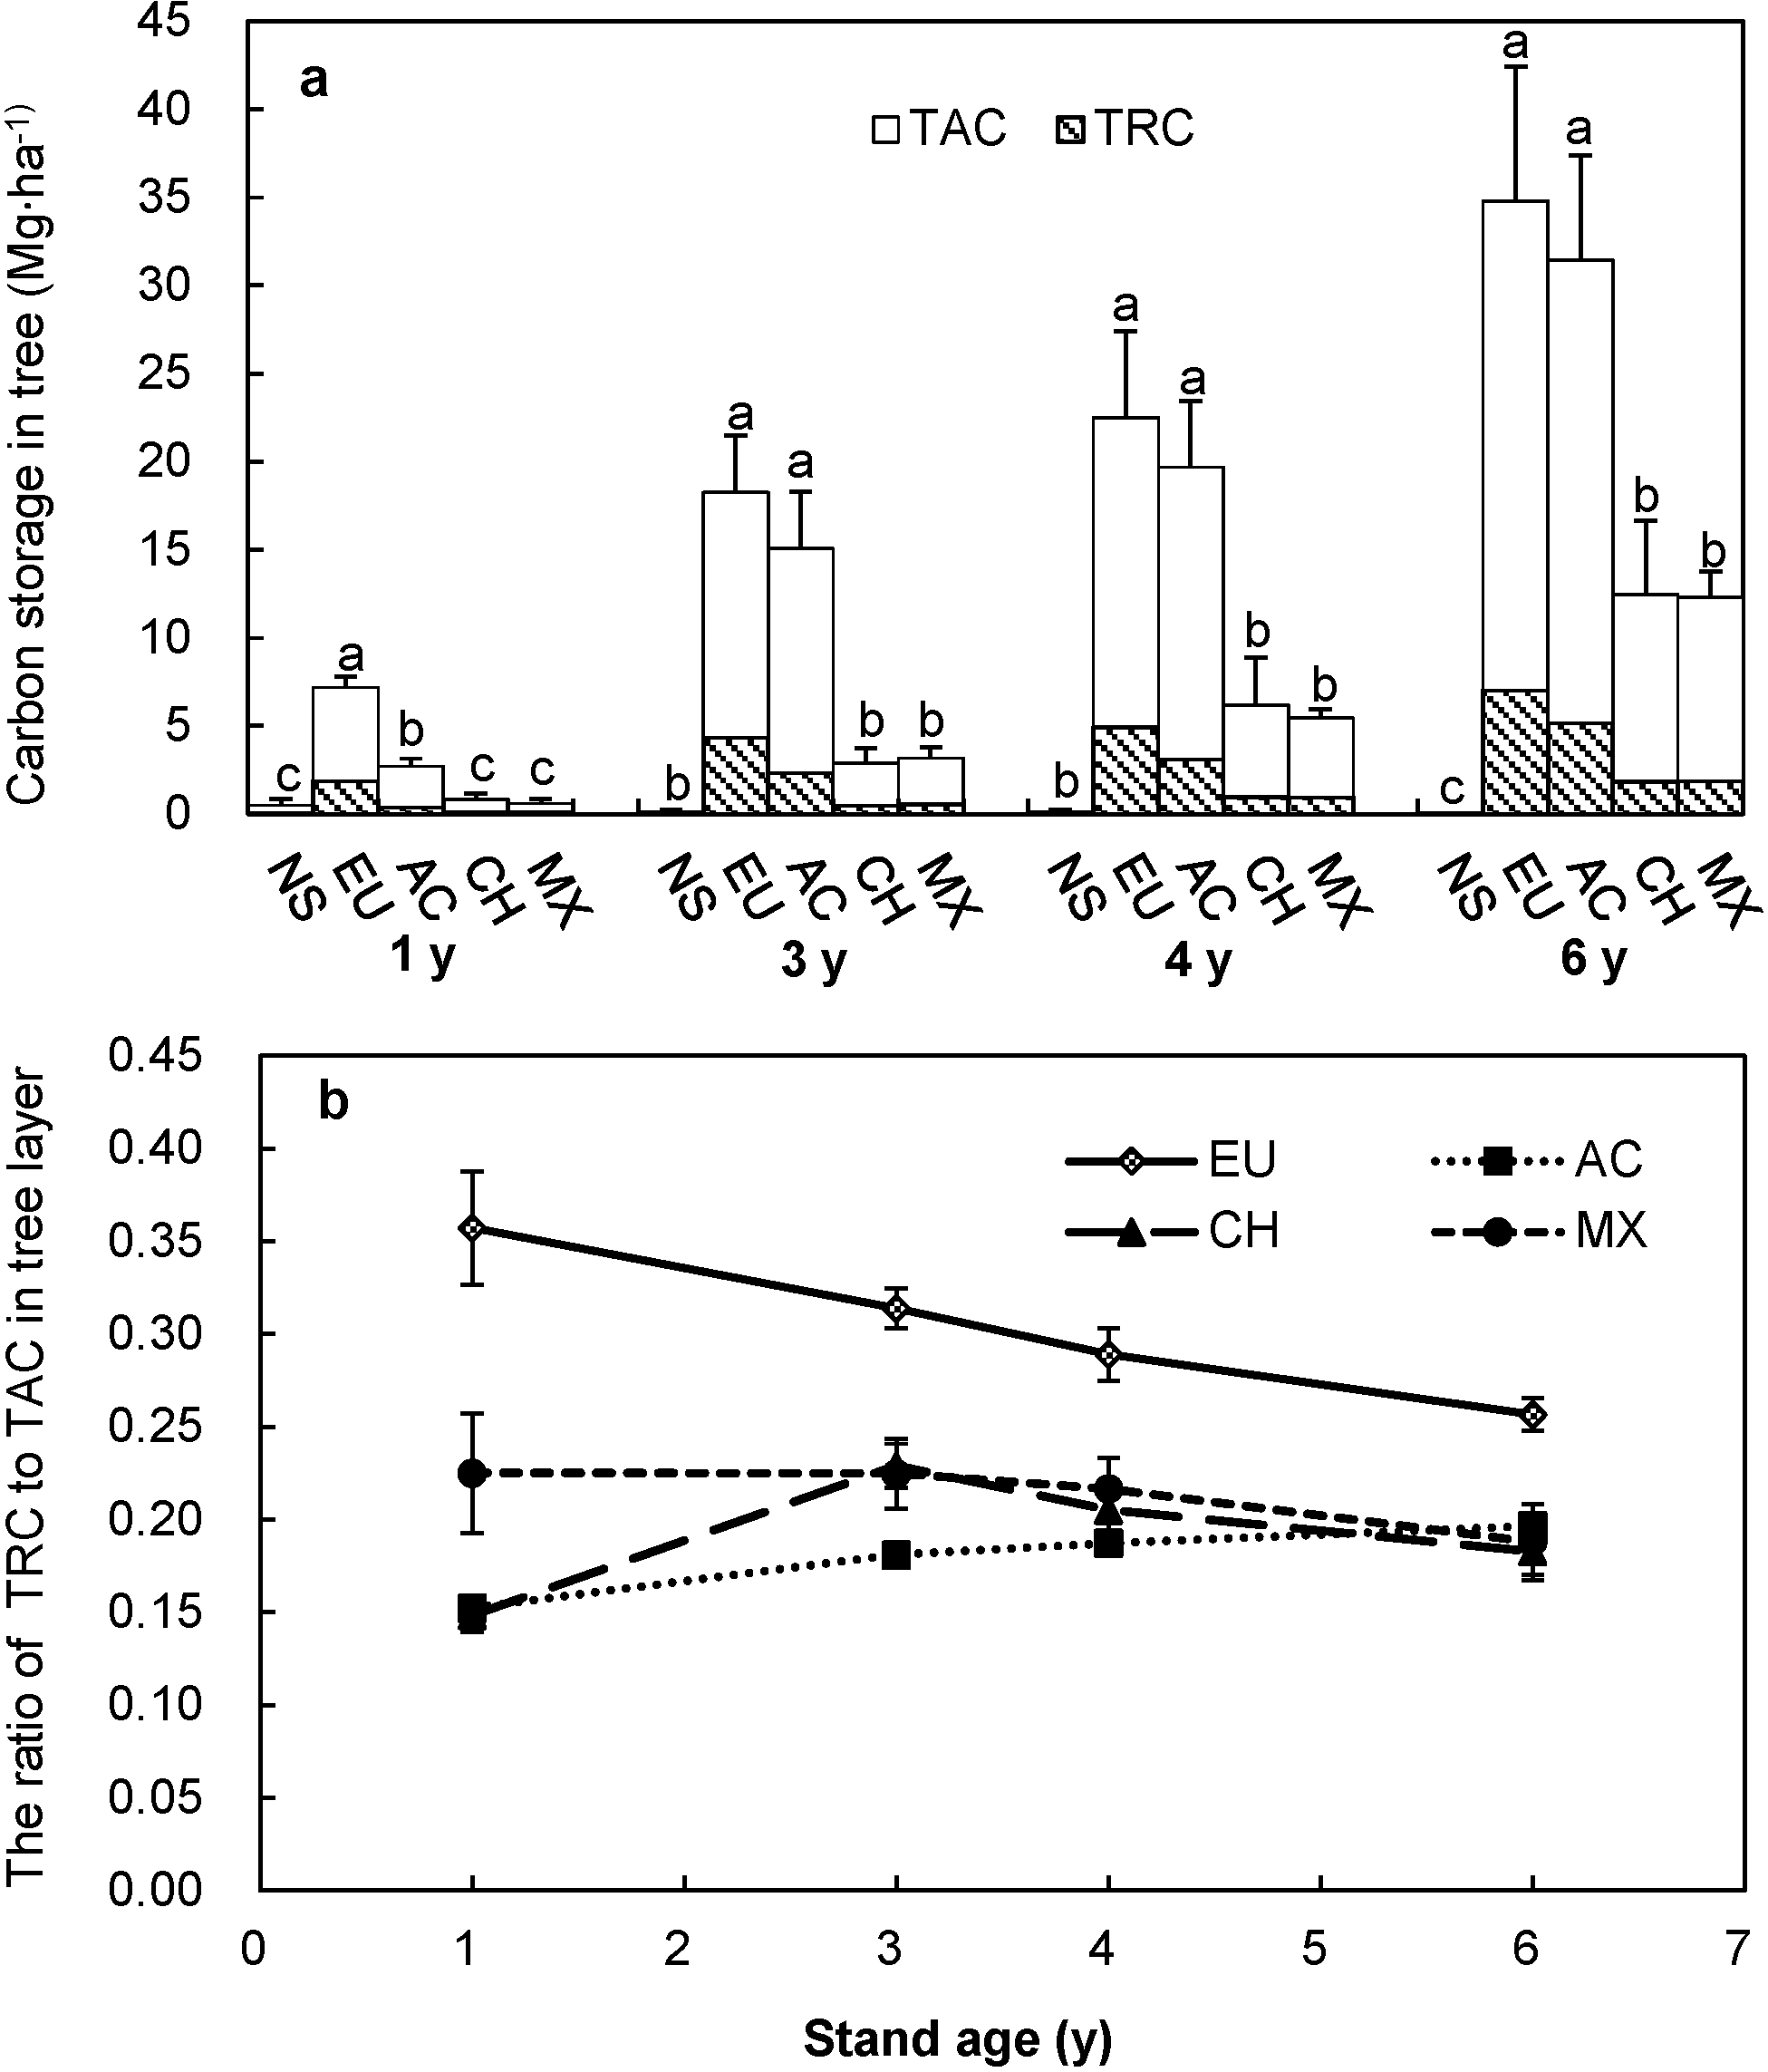
3.1. Carbon Storage of Trees

The total carbon storage in tree biomass at the studied plantations increased linearly with increasing stand age (Figure 1a). The mean carbon sequestration rate for EU, AC, CH and MX were 5.52, 5.74, 2.32 and 2.34 Mg·ha−1·yr−1 from the first year to the sixth year, respectively. The total carbon storage in tree biomass in NS, which was mainly composed of natural regenerated trees, was significantly lower than those in other plantations (repeated measure ANOVA, plantation types: p < 0.001). The fast-growing tree species Eucalyptus urophylla and Acacia crassicarpa plantations accumulated more carbon in their biomass than other plantations of the same age. Castanopsis hystrix and the mixed plantation of 10 species accumulated carbon in tree biomass at a similar level (p > 0.05). There was no significant difference between EU and AC in tree carbon storage with, an exception during the first year. The discrepancy of carbon storage among plantations decreased as the stand age increased. The carbon storage in EU was about 1.2-, 6.4- and 5.8-times that of AC, CH and MX in the three-year-old stand, but it decreased to 1.1-, 2.8- and 2.7-times in the six-year-old stand, respectively. Likewise, the carbon storage in AC was about 5.3- and 4.8-times greater than in CH and MX in the three-year-old stand, but it decreased to 2.5- and 2.5-times in the six-year-old stand, respectively.
The carbon allocation between the above- and below-ground components varied with plantation type (Figure 1b). For EU and MX, the ratio of tree root carbon to tree aboveground carbon decreased with increasing stand age. However, the ratio of tree root carbon to tree aboveground carbon increased with increasing stand age for AC, and the ratio increased at the beginning, but then decreased for CH.
Figure 1. (a) Carbon storage in the tree layer along a reforestation chronosequence (1 y; 3 y; 4 y; 6 y) among plantation types; (b) The ratio of tree root carbon (TRC) to tree aboveground carbon (TAC) in the tree layer along a reforestation chronosequence (1 y; 3 y; 4 y; 6 y) among plantation types. Notes: naturally recovered shrubland (NS), Eucalyptus urophylla monoculture (EU), Acacia crassicarpa monoculture (AC), Castanopsis hystrix monoculture (CH) and mixed plantation of 10 species (MX). Values are the means + SE, n = 3. Repeated measure ANOVAs were used for tree total carbon storage. One-way ANOVAs were used for plantation types at a given year. Different lowercase letters indicated significant differences among plantations at the p = 0.05 level.
Forests 06 00794 g001

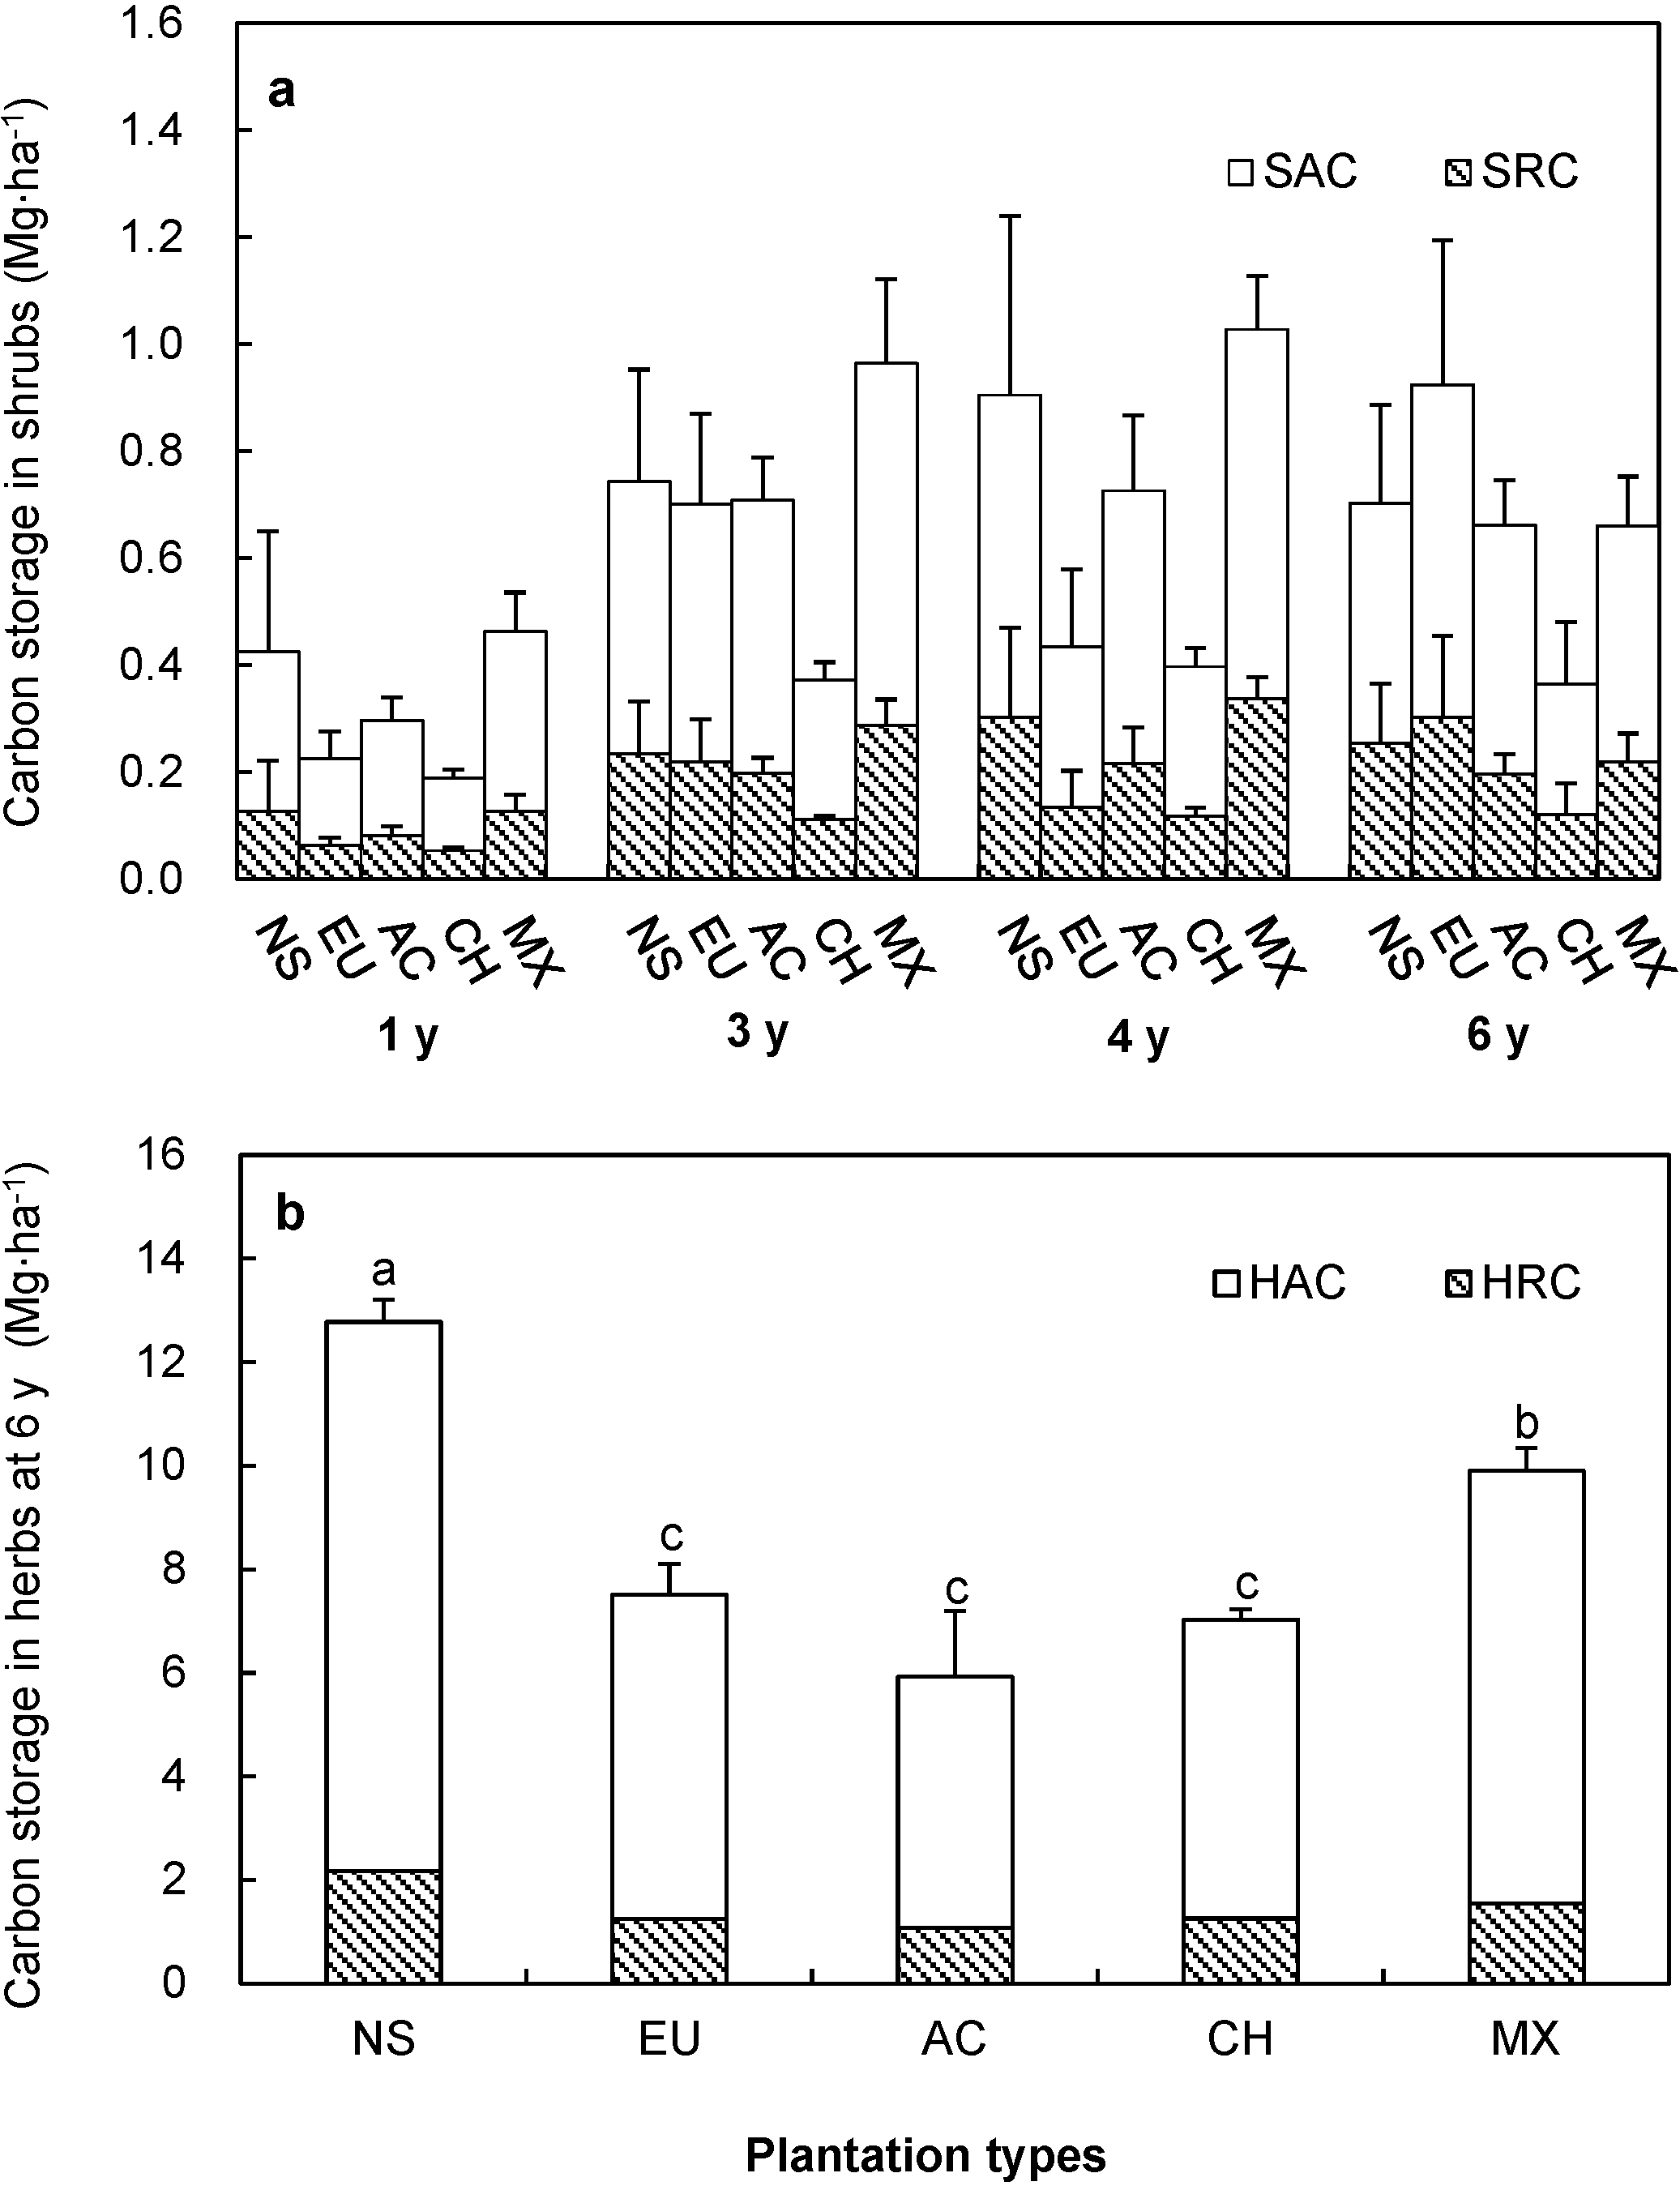
3.2. Carbon Storage of Shrubs

The shrub total carbon storage ranged from 0.19 Mg·ha−1 in one-year-old CH plantation to 1.03 Mg·ha−1 in four-year-old MX plantation (Figure 2a). There was no obvious difference in the carbon storage of shrubs between NS and the plantations at the same stand age. Overall, the shrubs’ total carbon storage in CH plantation was lower than that in other plantations of the same age, although the differences were not statistically significant (p > 0.05).
The shrub total carbon storage was the lowest in one-year-old plantations, but this was only significant for CH and MX (p < 0.05). No significant differences in shrub total carbon storage were found among 3-, 4- and 6-year-old plantations with different species compositions.
Figure 2. (a) Understory shrub carbon storage and allocation along a reforestation chronosequence (1 y; 3 y; 4 y; 6 y) among plantation types; (b) Understory herb carbon storage and allocation at 6 y among plantation types. Note: SAC, SRC, HAC and HRC stand for shrub aboveground carbon, shrub root carbon, herb aboveground carbon and herb root carbon. Values are means + SE, n = 3. Repeated measure ANOVAs were used for shrub total carbon storage. One-way ANOVAs were used for herb total carbon storage. Different lowercase letters indicate significant differences of herb total carbon storage among plantations at the p = 0.05 level. See Figure 1 for the abbreviations.
Forests 06 00794 g002

3.3. Carbon Storage of Herbs

The total carbon storage of herbs for all plantations was only measured in the six-year-old stand. Significant differences in total carbon storage of herbs were observed among vegetation types (p < 0.05) (Figure 2b). These differences mainly resulted from the differences in herb aboveground carbon (HAC) among vegetation types. The carbon storage of herbs in NS (12.8 Mg·ha−1) was higher than that in all plantations. On the other hand, the carbon storage of herbs in MX (9.9 Mg ha−1) was higher than that in all monoculture plantations of EU (7.5 Mg·ha−1), AC (5.9 Mg·ha−1) and CH (7.0 Mg·ha−1).

3.4. Carbon Storage of Forest Floor Mass

The carbon storage of the forest floor was measured in the six-year-old stand. Significant differences (p < 0.05) in carbon storage of forest floor mass were found among plantation types (Table 2). The carbon storage of the forest floor in NS (1.5 Mg·ha−1) was the lowest among all plantations. The carbon storage of the forest floor in AC (6.4 Mg·ha−1) was obviously higher than that in EU, CH and MX plantations (3.33, 4.80 and 2.92 Mg·ha−1, respectively).
Table 2. Total carbon storage and allocation at 6 years of age among different plantation types. Different lowercase letters indicate significant differences among plantation types at the p = 0.05 level. Values are the means ± SE, n = 3.
PlantationsTotal Living Plant Carbon (Mg·ha−1)Forest Floor Carbon (Mg·ha−1)Total Carbon Storage (Mg·ha−1)
Total Aboveground CarbonTotal Roots Carbon
NS11.05 ± 0.20b2.43 ± 0.53b1.48 ± 0.36c14.96 ± 1.09b
EU34.64 ± 6.46a8.57 ± 1.70a3.33 ± 0.95bc46.54 ± 8.93a
AC31.54 ± 4.16a6.45 ± 0.64a6.41 ± 1.31a44.40 ± 5.90a
CH16.63 ± 3.73b3.23 ± 0.51b4.80 ± 0.30ab24.67 ± 4.04b
MX19.21 ± 1.41b3.66 ± 0.12b2.92 ± 0.52bc25.78 ± 1.14b
Note: See Figure 1 for the abbreviations.

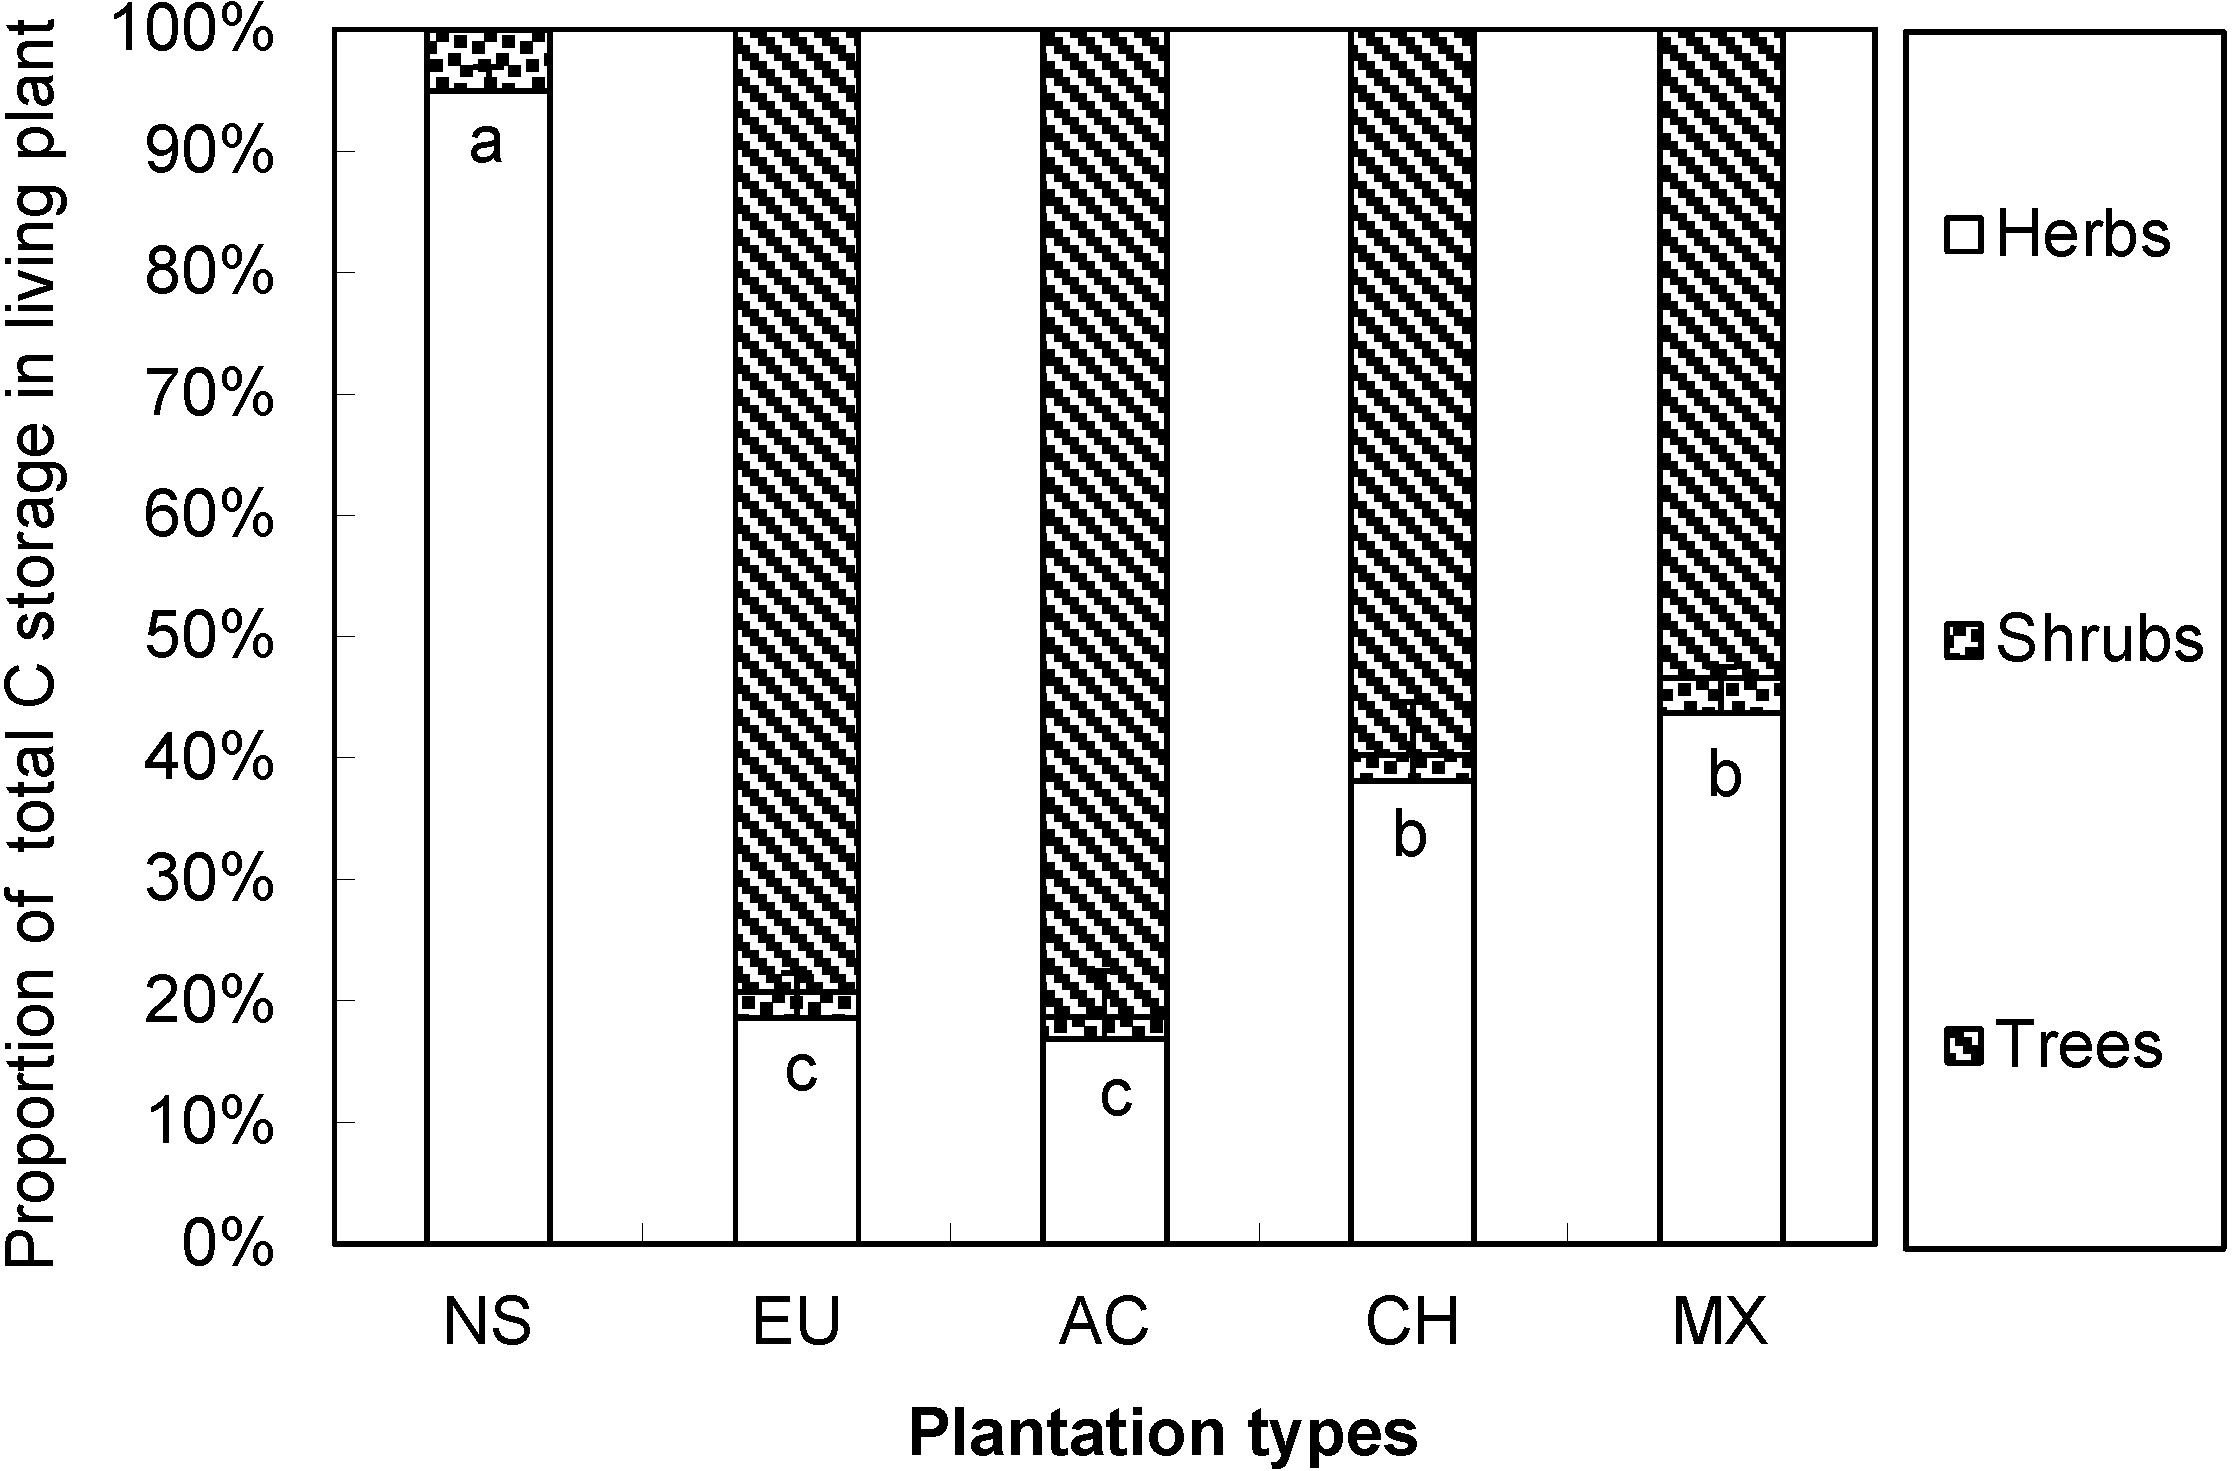
3.5. Carbon Storage and Allocation in Six-Year-Old Plantations

The total carbon storage of total living plant carbon plus forest floor carbon (FFC) was significantly different among plantation types at six years of age (Table 2). The total carbon storages in EU and AC (46.54 Mg·C·ha−1 and 44.40 Mg·C·ha−1, respectively) were significantly higher than those in NS, CH and MX (14.96 Mg·C·ha−1, 24.67 Mg·C·ha−1 and 25.78 Mg·C·ha−1, respectively) (p < 0.05). However, there were no significant difference in total carbon storage between EU and AC, neither among CH, MX and NS. The observed differences in total carbon storage mainly resulted from the variation in aboveground total plant biomass carbon among vegetation types. The contributions of shrubs and herbs to plant carbon storage at the plantation sites varied from 18.66% in AC to 46.58% in MX (Figure 3). The carbon allocation to trees and herbs was significantly different among plantations (Figure 3; p < 0.01). The percentage of carbon allocated to trees was highest in EU, and it was higher in AC and CH than in MX and NS. However, the ratio of plant root carbon to plant aboveground carbon storage was not significantly different among plantations (p > 0.05), and it ranged from 0.19 to 0.25. Table 3 shows the soil physical and chemical properties at the first 10 cm of the soil layer in the six-year-old stand age at the study site. There was no significant difference among plantations for measured soil properties (Table 3).
Figure 3. Proportion of trees, shrubs and herbs in total living plant carbon storage among plantations. Values are the means + SE, n = 3. Different lowercase letters indicate significant differences in the percentage of trees and herbs’ total carbon storage among plantations for at the p = 0.05 level. See Figure 1 for the abbreviations.
Forests 06 00794 g003
Table 3. Comparison of surface soil physical and chemical properties (0–10 cm) among plantation types at 6 years of age.
PlantationspHSOC(g/kg)TN(g/kg)C:N ratio
CK4.01 ± 0.04a21.70 ± 1.73a1.24 ± 0.12a18.99 ± 4.44a
EU3.95 ± 0.02a21.16 ± 5.71a1.24 ± 0.31a17.01 ± 0.28a
AC3.95 ± 0.10a24.20 ± 1.42a1.38 ± 0.10a16.29 ± 1.75a
CH3.98 ± 0.03a24.86 ± 2.88a1.41 ± 0.20a17.78 ± 0.75a
MX3.96 ± 0.04a23.00 ± 0.52a1.47 ± 0.27a16.47 ± 1.93a
Note: SOC, soil organic carbon (g kg−1 dry soil); TN, soil total nitrogen (g·kg−1 dry soil); C:N, the ratio of total soil organic carbon to total nitrogen. Different lowercase letters indicated significant differences among plantations at the p = 0.05 level. See Figure 1 for the abbreviations.

4. Discussion

4.1. Variation of Total Carbon Storage Induced by Tree Traits among Vegetation Types

In the present study, the total carbon storage in plantations was higher than naturally recovered vegetation (NS), and this difference mainly resulted from carbon storage in the tree layer. EU and AC sequestrated more carbon in tree biomass than CH and MX, which was mainly induced by tree traits, such as higher maximum net photosynthetic rate (Pmax) per unit forest land area (Pmax multiply by leaf area index). The Pmax per unit forest land area of EU, AC, CH and MX was 31.8, 36.9, 16.0 and 21.9 μmol·m−2 s−1, respectively [24,25]. It was also reported that EU and AC have the characteristics of high biomass accumulation and high carbon storage capacity [26], and CH and MX have the characteristics of slow growth at the early stage, but fast growth between seven years old and 12 years old [27]. The plant total carbon storage of naturally recovered shrubland (NS) was lowest among the other plantations in the present study, although there was no obvious difference among CH, MX and NS. Plantations established on degraded tropical sites can greatly accelerate more carbon sequestration in biomass than the naturally recovered shrubland, especially fast-growing tree species. Therefore, fast-growing tree species, such as EU and AC, are selected preferentially for quick restoration.

4.2. Substantial Contribution of Understory Plants to Total Carbon Storage in Plantations

Understory herbs and shrubs are important components of subtropical forest ecosystems, which play an important role in maintaining soil nutrients and decomposer organisms [28,29]. Meanwhile, there is a great potential for understory plants in terms of carbon sequestration [30]. Wan [31] pointed out that understory plants could contribute about 20% of carbon sequestration in eucalyptus plantations. Yang et al. [32] also reported that the contribution of understory plants varied with plantation types. However, in the present study, there was no difference in the carbon storage of shrubs between the vegetation types. The carbon storage of herbs was only measured in six-year-old plantations, which showed that MX accumulated significantly more carbon than monoculture plantations, EU, AC or CH. We found that the contribution of the sum of shrubs and herbs to total carbon storage of AC and MX was 18.7% and 46.6%, which was greater than that reported in other studies [33,34]. The greater contribution of understory vegetation to total carbon storage was mainly attributed to higher resource availability, such as light under younger plantations. Previous studies from the same site demonstrated that understory plants also functioned as a facilitator of the overstory trees [35]. Therefore, understory plants play an important role as a carbon sink and key functional group, especially in subtropical plantations at the early stage.

4.3. The Carbon Allocation Pattern Determined by Aboveground Plant Biomass

The proportion of different compartments to total plant carbon storage was influenced by tree traits. In the present study, the proportions of carbon allocated to tree biomass of EU and AC were higher than those of CH and MX, but the proportion to herbal biomass of NS was the highest of the other plantations. The root carbon storage was only 16%~20% of total plant carbon storage. Therefore, at the early stage, the carbon allocation to each compartment was controlled by tree species traits to a large extent.
The amount of carbon allocation to above- and below-ground compartment varied with tree species [36,37]. As indicated by our data, the carbon allocations of aboveground and belowground in trees were different among plantation types and changed with stand age. We postulated two possible causes for such difference in the carbon storage pattern among species. First, plant physiological characteristics, such as photosynthetic capacity and light use efficiency, vary with plant age [38]. In the present study, the ratio of root carbon of trees to aboveground biomass carbon of trees (RCT/ACT) decreased with increasing stand age for EU and MX. This result was consistent with Xue [39]. The value of the ratio also fell within the ranges reported by Genet et al. [40]. However, this ratio increased with the stand age for AC. The ratio for CH was similar to that reported in the previous studies [41], which increased at the beginning, but decreased later with plant age. Second, belowground competition for nutrients varied with plant age [42]. For example, the fertilization of potassium (K) and sodium (Na) changed the fraction of carbon allocated belowground [43]. At different stand ages, the nutrient requirements of different tree species were different. It was reported that soil nutrient supply was affected by tree species and specific functional traits [44]. The difference in soil moisture or soil nutrient status (Table 3) might have caused the different carbon allocation to the tree compartment [45].
Overall, all three hypotheses we proposed were supported by our results, namely: plantations of fast-growing, exotic species accumulate more carbon than those of native species; plantations sequester more carbon in the plant biomass than naturally recovered vegetation; and carbon allocation patterns change with tree species and stand age. The Eucalyptus industry may potentially facilitate ecological services, such as carbon sequestration, as well as improving the economy.

5. Conclusions

Our data demonstrated that total carbon storage increased in plantations compared to naturally recovered shrubland. Plantations with fast-growing tree species, such as EU and AC, had larger carbon storages than other plantation types, indicating that EU and AC would be appropriate plantation species for increasing carbon sequestration in the southern subtropical region in China, where the soil is highly weathered. The understory showed a great contribution to plant carbon storage, illustrating that herbs and shrubs should be considered when estimating the carbon sequestration capability in subtropical plantation ecosystems. Meanwhile, the carbon allocation patterns of above- and below-ground were mainly influenced by tree species traits. Our findings have important implications for the tree species selection of reforestation in terms of carbon sequestration and are valuable for decision making in sustainable forest management.

Acknowledgments

We thank Jie Zhao, Jianping Wu, Weixin Zhang and Dr. Yuanhu Shao for their help in preparing the manuscript. We would like to thank the anonymous referees for constructive comments and suggestions on the manuscript. We also thank Dr. Michiel Op De Beeck for language improvement. This study was financially supported by the Strategic Priority Research Program of the Chinese Academy of Sciences (XDA05070301) and National Natural Science Foundation of China (31210103920, U1131001).

Author Contributions

Shenglei Fu, Yuanqi Chen and Xi-an Cai designed the experiment. Yuanqi Chen, Xi-an Cai, Xinquan Rao, Zhanfeng Liu, Xiaoling Wang, Chenfei Liang, Yongbiao Lin and Lixia Zhou performed the experiments and collected the data. Yuanqi Chen and Zhanfeng Liu analyzed the data. Yuanqi Chen, Zhanfeng Liu, Shenglei Fu and Xi-an Cai contributed to writing the manuscript.

Conflicts of Interest

The authors declare no conflict of interest.

References

  1. IPCC. IPCC Four Assessment Report. In Climate Change 2007: Impacts, Adaptation and Vulnerability; Cambridge University Press: Cambridge, UK, 2007; p. 34. [Google Scholar]
  2. Hunter, I. Above ground biomass and nutrient uptake of three tree species (Eucalyptus camaldulensis, Eucalyptus grandis and Dalbergia sissoo) as affected by irrigation and fertiliser, at 3 years of age, in southern India. For. Ecol. Manag. 2001, 144, 189–199. [Google Scholar] [CrossRef]
  3. Davis, M.R.; Allen, R.B.; Clinton, P.W. Carbon storage along a stand development sequence in a New Zealand Nothofagus forest. For. Ecol. Manag. 2003, 177, 313–321. [Google Scholar] [CrossRef]
  4. Zhang, X.Q.; Xu, D.Y. Potential carbon sequestration in China’s forests. Environ. Sci. Policy 2003, 6, 421–432. [Google Scholar] [CrossRef]
  5. Fang, J.Y.; Guo, Z.D.; Piao, S.L.; Chen, P.A. The estimating of terrestrial vegetation carbon sink in China between 1981 and 2000. Sci. China Earth Sci. 2007, 50, 1341–1350. [Google Scholar] [CrossRef]
  6. State Forestry Administration. The main results of the 8th national forest resources inventory (from 2009 to 2013). 2014. Available online: http://www.forestry.gov.cn/main/65/content-659670.html (accessed on 3 April 2014). [Google Scholar]
  7. Huang, L.; Liu, J.Y.; Shao, Q.Q.; Xu, X.L. Carbon sequestration by forestation across China: Past, present, and future. Renew. Sust. Energ. Rev. 2012, 16, 1291–1299. [Google Scholar] [CrossRef]
  8. Pregitzer, K.S.; Euskirchen, E.S. Carbon cycling and storage in world forests: Biome patterns related to forest age. Glob. Chang. Biol. 2004, 10, 2052–2077. [Google Scholar] [CrossRef]
  9. Piao, S.L.; Fang, J.Y.; Ciais, P.; Peylin, P.; Huang, Y.; Sitch, S.; Wang, T. The carbon balance of terrestrial ecosystems in China. Nature 2009, 458, 1009–1013. [Google Scholar] [CrossRef] [PubMed]
  10. Wei, Y.W.; Li, M.H.; Chen, H.; Lewis, B.J.; Yu, D.B.; Zhou, L.; Zhou, W.M.; Fang, X.M.; Zhao, W.; Dai, L.M. Variation in carbon storage and its distribution by stand age and forest type in boreal and temperate forests in northeastern China. PLoS One 2013, 8, e72201. [Google Scholar] [CrossRef] [PubMed]
  11. Law, B.E.; Thornton, P.E.; Irvine, J.; Anthoni, P.M.; Tuyl, S.V. Carbon storage and fluxes in ponderosa pine forests at different developmental stages. Glob. Chang. Biol. 2001, 7, 755–777. [Google Scholar] [CrossRef]
  12. Meilby, H.; Helles, F. A general model for assessment of the carbon sequestration potential of afforestation projects. New For. 2011, 42, 383–396. [Google Scholar] [CrossRef]
  13. Raich, J.W.; Clark, D.A.; Schwendenmann, L.; Wood, T.E. Aboveground tree growth varies with belowground carbon allocation in a tropical rainforest environment. PLoS One 2014, 9, e100275. [Google Scholar] [CrossRef] [PubMed]
  14. Giardina, C.P.; Ryan, M.G. Total belowground carbon allocation in a fast-growing Eucalyptus plantation estimated using a carbon balance approach. Ecosystems 2002, 5, 487–499. [Google Scholar] [CrossRef]
  15. Van der Werf, A.; Nagel, O.W. Carbon allocation to shoots and roots in relation to nitrogen supply is mediated by cytokinins and sucrose: Opinion. Plant Soil 1996, 185, 21–32. [Google Scholar] [CrossRef]
  16. Mäkelä, A. On guiding principles for carbon allocation in eco-physiological growth models. Tree Physiol. 2012, 32, 644–647. [Google Scholar] [CrossRef] [PubMed]
  17. Zhang, H.; Guan, D.S.; Song, M.W. Biomass and carbon storage of Eucalyptus and Acacia plantations in the Pearl River Delta, South China. For. Ecol. Manag. 2012, 277, 90–97. [Google Scholar] [CrossRef]
  18. Hvistendahl, M. Turing over a new leaf in China’s forests. Science 2012, 337, 26–27. [Google Scholar] [CrossRef] [PubMed]
  19. He, Y.J.; Li, Z.Y.; Chen, J.; Liu, Y.; Liu, D.P.; Wu, S.F.; Qin, Y.S.; Xu, Z.J. Sustainable management of planted forests in China: comprehensive evaluation, development recommendation and action framework. Chin. For. Sci. Technol. 2008, 7, 1–15. [Google Scholar]
  20. Wang, F.M.; Zhu, W.X.; Xia, H.P.; Fu, S.L.; Li, Z.A. Nitrogen mineralization and leaching in the early stages of a subtropical afforestation in southern China. Restor. Ecol. 2010, 18, 313–322. [Google Scholar] [CrossRef]
  21. IUSS Working Group WRB. World Reference Base for Soil Resources 2006, 2nd ed.; World Soil Resources Reports No.103; FAO: Rome, Italy, 2006; p. 67. [Google Scholar]
  22. Lu, R.K. Method of Analysis in Soil and Agrochemistry; Agricultural Press: Beijing, China, 1999; pp. 31–33. (In Chinese) [Google Scholar]
  23. Baishya, R.; Barik, S.K.; Upadhaya, K. Distribution pattern of aboveground biomass in natural and plantation forests of humid tropics in northeast India. Trop. Ecol. 2009, 50, 295–304. [Google Scholar]
  24. Yu, S.Q. Soil respiration of five plantations in south China. Master’s Degree, South China Botanical Garden, Chinese Academy of Sciences, Guangzhou, 6 July 2014. [Google Scholar]
  25. Zhang, J.G.; Fu, S.L.; Wen, D.Z.; Zhang, L.L. Relationships of key leaf traits of 16 woody plant species in low subtropical China. J. Trop. Subtrop. Bot. 2009, 17, 395–400. (In Chinese) [Google Scholar]
  26. Chen, D.M.; Zhang, C.L.; Wu, J.P.; Zhou, L.X.; Lin, Y.B.; Fu, S.L. Subtropical plantations are large carbon sinks, evidence from two monoculture plantations in South China. Agric. For. Meteorol. 2011, 151, 1214–1225. [Google Scholar] [CrossRef]
  27. Tang, J.X.; Bai, L.H.; Guo, W.F.; Cai, D.X. Preliminary study on growth regularity of Castanopsis hystrix plantation. J. Central South Univ. For. Technol. 2012, 32, 51–60. (In Chinese) [Google Scholar]
  28. Liu, Z.F.; Wu, J.P.; Zhou, L.X.; Lin, Y.B.; Fu, S.L. Effect of understory fern (Dicranopteris dichotoma) removal on substrate utilization patterns of culturable soil bacterial communities in subtropical Eucalyptus plantations. Pedobiologia 2012, 55, 7–13. [Google Scholar] [CrossRef]
  29. Zhao, J.; Wang, X.L.; Shao, Y.H.; Xu, G.L.; Fu, S.L. Effects of vegetation removal on soil properties and decomposer organisms. Soil Biol. Biochem. 2011, 43, 954–960. [Google Scholar] [CrossRef]
  30. Chastain, R.A., Jr.; Currie, W.S.; Townsend, P.A. Carbon sequestration and nutrient cycling implications of the evergreen understory layer in Appalachian forests. For. Ecol. Manag. 2006, 231, 63–77. [Google Scholar] [CrossRef]
  31. Wan, S.Z. The Effects of Forest Management on Carbon Allocation in Eucalyptus Plantation. Ph.D. Degree, South China Botanical Garden, Chinese Academy of Sciences, Guangzhou, China, 6 July 2014. [Google Scholar]
  32. Yang, K.; Guan, D.S. Biomass distribution and its functioning of forest understory vegetation. Chin. J. Ecol. 2006, 25, 1252–1256. (In Chinese) [Google Scholar]
  33. Fang, Y.T.; Mo, J.M.; Huang, Z.L.; Ouyang, X.J. Carbon accumulation and distribution in Pinus massoniana and Schima superba mixed forest ecosystem in Dinghushan Biosphere Reserve. J. Trop. Subtrop. Bot. 2003, 11, 47–52. (In Chinese) [Google Scholar]
  34. Zhou, C.Y.; Wei, X.H.; Zhou, G.Y.; Yan, J.H.; Wang, X.; Wang, C.L.; Liu, H.G.; Tang, X.L.; Zhang, D.Q. Impacts of a large-scale reforestation program on carbon storage dynamics in Guangdong, China. For. Ecol. Manag. 2008, 255, 847–854. [Google Scholar] [CrossRef]
  35. Wan, S.Z.; Zhang, C.L.; Chen, Y.Q.; Zhao, J.; Wang, X.L.; Wu, J.P.; Zhou, L.X.; Lin, Y.B.; Liu, Z.F.; Fu, S.L. The understory fern Dicranopteris Dichotoma facilitates the overstory Eucalyptus trees in subtropical plantations. Ecosphere 2014, 5, 1–12. [Google Scholar]
  36. Raich, J.W.; Nadelhoffer, K.J. Belowground carbon allocation in forest ecosystems: Global trends. Ecology 1989, 70, 1346–1354. [Google Scholar] [CrossRef]
  37. Shibistova, O.; Yohannes, Y.; Boy, J.; Richter, A.; Wild, B.; Watzka, M.; Guggenberger, G. Rate of belowground carbon allocation differs with successional habit of two Afromontane trees. PLoS One 2012, 7, e45540. [Google Scholar] [CrossRef] [PubMed]
  38. Walcroft, A.S.; Whitehead, D.; Kelliher, F.M.; Arneth, A.; Silvester, W.B. The effects of long-term, partial shading on growth and photosynthesis in Pinus radiate D. Don trees. For. Ecol. Manag. 2002, 163, 51–163. [Google Scholar] [CrossRef]
  39. Xue, P. Growth and biomass of six-year-old Eucalyptus urophylla plantation in Leizhou forestry bureau. Eucalypt Sci. Technol. 2009, 26, 18–21. (In Chinese) [Google Scholar]
  40. Genet, H.; Bréda, N.; Dufréne, E. Age-related variation in carbon allocation at tree and stand scales in beech (Fagus sylvatica L.) and sessile oak (Quercus petraea (Matt.) Liebl.) using a chronosequence approach. Tree Physiol. 2010, 30, 177–192. [Google Scholar] [CrossRef] [PubMed]
  41. Huang, Q.N. Investigation on the growth law and biomass of Castanopsis hystrix natural forest. J. Fujian For. Sci. Technol. 1998, 25, 20–23. (In Chinese) [Google Scholar]
  42. Yan, E.R.; Wang, X.H.; Huang, J.J. Shifts in plant nutrient use strategies under secondary forest succession. Plant Soil. 2006, 289, 187–197. [Google Scholar] [CrossRef]
  43. Epron, D.; Laclau, J.P.; Almeida, J.C.; Goncalves, J.L.M.; Ponton, S.; Sette, C.R., Jr.; Delgado-Rojas, J.S.; Bouillet, J.P.; Nouvellon, Y. Do changes in carbon allocation account for the growth response to potassium and sodium applications in tropical Eucalyptus plantations? Tree Physiol. 2011, 32, 667–679. [Google Scholar] [CrossRef] [PubMed]
  44. Richards, A.E.; Forrester, D.I.; Bauhus, J.; Schere-lorenzen, M. The influence of mixed tree plantations on the nutrition of individual species: A review. Tree Physiol. 2010, 30, 1192–1208. [Google Scholar] [PubMed]
  45. Peichl, M.; Arain, M.A. Allometry and partitioning of above- and belowground tree biomass in an age-sequence of white pine forests. For. Ecol. Manag. 2007, 253, 68–80. [Google Scholar]

