Article

Influence of Tree Spacing on Soil Nitrogen Mineralization and Availability in Hybrid Poplar Plantations

1
Co-Innovation Center for Sustainable Forestry in Southern China, Nanjing Forestry University, Nanjing 210037, China
2
College of Forestry, Henan University of Science and Technology, Luoyang 471023, China
3
Department of Plant and Soil Sciences, Oklahoma State University, Stillwater, OK 74048, USA
*
Author to whom correspondence should be addressed.
Forests 2015, 6(3), 636-649; https://doi.org/10.3390/f6030636
Submission received: 26 January 2015 / Revised: 14 February 2015 / Accepted: 25 February 2015 / Published: 4 March 2015
(This article belongs to the Special Issue Nitrogen and Phosphorus Nutrition of Trees and Forests)

Abstract

:
Nitrogen (N) availability and mineralization are key parameters and transformation processes that impact plant growth and forest productivity. We hypothesized that suitable plantation spacing can lead to enhanced soil N mineralization and nitrification, which in turn promote tree growth. Studies were conducted to evaluate seasonal patterns of soil inorganic N pools as well as rates of nitrification and N mineralization of three soil layers under four tree spacing treatments. Results showed tree spacing significantly affected annual net N mineralization, whereas inorganic N content in surface soils was significantly affected by tree spacing only during the growing season. The total annual cumulative net N mineralization ranged from 80.3–136.0 mg·kg−1 in the surface soils (0–20 cm), whereas the cumulative net N mineralization of 6 × 6 m and 4.5 × 8 m spacings was 65% and 24% higher than that of the 5 × 5 m, respectively. In general, tree spacing would affect N availability in soil by altering N mineralization rates, while high annual N mineralization was found in soils of low density plantations, with higher rates in square spacing than rectangular spacing. The obtained results suggest that suitable spacing could lead to enhanced N mineralization, but seasonal variation of soil N mineralization may not only be directly related to plantation productivity but also to understory vegetation productivity.

1. Introduction

Initial spacing is an important determinant of site utilization and subsequent selection and harvesting options [1]. Planting density and tree spacing not only strongly affect soil nutrient dynamics, aboveground biomass production, and crown characteristics [2,3,4] but also wood quality [5]. Previous researches suggested that height, diameter at breast height (DBH) and survival of planted trees were affected by density and spacing with DBH being the most sensitive and height being the least sensitive to variations in density [6,7]. Kang et al. [8] found that yield, wood quality, and pulp fiber properties of jack pine were improved through stand density regulation. However, recent forest management practices have been focusing mostly on issues surrounding biodiversity and nutrient status [9]. Changes of forest structure can lead to different forest environments and understory vegetation. Some studies suggested that a suitable spacing treatment of various plantations such as red pine and spruce was vital in optimizing nutrient dynamics such as the nitrogen (N) mineralization process in support of optimal plant growth [10]. Therefore, understanding impact of tree spacing treatment on soil nutrient dynamics is important in developing effective forest management practices for sustainable production.
Of nutrients essential for plant growth, N is frequently the most limiting in terrestrial ecosystems [11,12]. Nitrogen availability and mineralization are key parameters and transformation processes that impact plant growth and forest productivity. Mineralization of soil organic N has been shown to be fundamentally linked with productivity in most ecosystems [13,14,15]. With more than 90% of soil N in organic forms, N availability to plants and soil inorganic N contents, such as NO3 and NH4+ are largely governed by mineralization processes [16]. Some of the released NH4+ may be oxidized to NO3 through well recognized nitrification processes which may result in N loss from the ecosystem if plants cannot take up the formed NO3 timely. Therefore, both nitrification and N mineralization are key processes influencing N availability in soils, which are in turn being influenced by substrate quality and accessibility, as well as abiotic factors such as soil moisture, temperature, and pH [17,18]. Although N mineralization and nitrification processes and their governing factors have been well evaluated and documented, understanding their impact to forest ecosystem requires targeted effort that is tailored to meet the needs of specific terrestrial ecosystems under evaluation.
In recent years, there has been growing interest in poplar production in China, due to its ability to adapt to a wide range of growth environments, its responsiveness to tree breeding and silviculture, as well as its high timber yield. In the past decades, more than 7.0 million ha poplar plantations have been established in China that serve as wood resources [19]. Such practices have not only promoted economic development in the region, but have also facilitated ecosystem improvements. Plantation density and spacing affect the growing resources available to each tree and the size and form of logs available at harvest [20]. However, long-term effects of planting spacing and density management on soil nutrient dynamics remain unclear and deserve attention for the practices to be sustainable. It is generally recognized that improved synchrony between N supply and demand will increase N use efficiency and decrease offsite N transport from agricultural systems. In this study, we hypothesized that suitable stand structure (such as density and spacing) could lead to enhanced nitrification and N mineralization in soils, which would result in increased N availability and improved plant growth. The main objective of this study was to investigate the effects of planting density and tree spacing on soil N transformation and availability in the poplar plantations.

2. Materials and Methods

2.1. Site Description and Plantation Establishment

The experiment was conducted at Chenwei forest farm located in Jiangsu, China (33°16′ N, 118°21′ E). This area is under a semi-humid region in mid-latitude warm zones with long-periods of sunshine duration and plentiful rainfall. The mean annual precipitation is 972.5 mm, occurring mostly from June to August. The mean annual sunshine duration is 2250–2350 h and mean annual temperature is 14.4 °C which varies from −7 °C in January to 28 °C in July. The soil is a Gley soil with clay loam texture derived from lacustrine sediments. The main understory plant species includes Echinochloa crusgalli, Youngia japonica, Geranium wilfordii, Duchesnea indica, and Herba Cirsii.
Poplar plantations were established in March 2007 by using one-year old seedlings of clone “Nanlin-95”, a hybrid of clone I-69 (Populus deltoides Bartr. cv. “Lux”) × clone I-45 (P. × euramericana (Dode) Guineir cv. I-45/51′) bred by Nanjing Forestry University, China. Four levels of spacing (6 × 6, 4.5 × 8, 5 × 5, and 3 × 8 m), including two rectangles and two squares, were evaluated. Spacing 4.5 × 8 and 6 × 6 m were of the same density (278 stems·ha−1), while spacings of 3 × 8 and 5 × 5 m were also regarded as of the same density (400 stems·ha−1). Three replicates of each treatment were randomly arranged in 12 plots which were established at the same topographic position with each plot about 1200–1800 m2 (50 trees per plot).
Five years following the plantation establishment, three soil subsamples and each at three layers (0–5, 5–10, and 10–20 cm) were taken from each plot in May 2012. At each plot, three sampling points were randomly selected 2.5–4 m from the base of a tree trunk to minimize the direct physical and chemical influences of roots [21]. A total of 108 soil samples at a time were collected from the four treatments. The obtained basic properties of soils for each treatment are shown in Table 1.
Table 1. Basic properties of soils in the poplar plantation following five years of tree spacing treatment *.
Spacing (m)Soil Layer (cm)SOC (g·kg−1)TN (g·kg−1)SOC:TNpHBulk Density (g·cm−1)
6 × 60–531.41.116.47.11.10
5–1021.20.622.37.21.19
10–2013.90.614.27.41.28
4.5 × 80–526.10.916.17.01.13
5–1016.40.519.57.01.21
10–2012.00.416.27.31.35
5 × 50–523.90.915.67.11.19
5–1018.10.522.87.31.24
10–2013.50.515.97.41.34
3 × 80–522.91.112.77.01.22
5–1014.20.613.97.11.36
10–2011.00.513.67.31.39
* SOC = Soil organic carbon and TN = Total nitrogen; pH was determined in soil:water = 1:2.5.

2.2. Soil N Mineralization and Sample Collection

Soil N mineralization was determined using the resin core method and through in situ soil incubation [22,23] based on the assumption that N mineralization rates are similar inside and outside a sample core. Briefly, soil cores were prepared by hammering sharp-edged PVC tubes into soil layers 0–5, 5–10, and 10–20 cm. The PVC tubes were internal diameter (ID) × height (H) = 5 × 5 cm for soil layers 0–5 and 5–10 cm, and ID × H = 5 × 10 cm for soil layer 10–20 cm. Resin layers (mixture of Dowex 50W-X8 cation and Dowex l-X8 anion exchange resins) were placed above and below the soil cores using separate PVC tubes (ID × H = 5 × 2 cm). The resin tube was covered with a 0.8 mm pore-diameter nylon mesh on top to allow gas, water and nutrients exchange, and mesh with a 0.3 mm pore-diameter nylon mesh on bottom to prevent resin loss during incubation. Nitrogen input from rainfall and litter decomposition could be absorbed by the above resin layer, while N leached from the soil core could be captured by the resin layer below.
Three sub-plots were established randomly within each plot for resin-core incubation. On 10 May 2012, following clipping and removing plants and litter, sharp-edged PVC tubes were driven into three soil layers (0–5, 5–10, and 10–20 cm) to sample soil cores and make resin-soil core combinations within each sub-plot. The resin-soil core combinations were then re-buried and incubated in situ. After 3 months, the resin-soil core combinations were retrieved for chemical analysis, and additional new resin-soil core combinations were prepared and incubated again for the next 3-months. The procedure was repeated at a 3-month interval (from 10 May to 10 August 2012 (A); from 10 August to 10 November 2012 (B); from 10 November 2012 to 10 February 2013 (C); and from 10 February to 10 May 2013 (D)) continuously over the following year. Additional soil cores were sampled in adjacent locations simultaneously at each time for the quantification of soil initial ammonium and nitrate-N contents. The collected soil and tube samples were transported to the laboratory and stored at 4 °C until analysis.

2.3. Soil Chemical Analysis and Data Calculation

Soil ammonium and nitrate-N levels were determined by adding 2 M KCl [23], followed by shaking for an hour on a reciprocal shaker and filtration with Whatman-Xinhua filter paper before quantifying NH4+-N and NO3-N using a Flow Injection Autoanalyzer (Bran+Luebbe, Hamburg, Germany). The resin bags were washed with distilled water and dried at room temperature (28–32 °C). Resin NH4+-N and NO3-N were removed by shaking the resin bags with 2 M KCl for 12 h.
Soil moisture content was determined by oven drying at 105 °C for 48 h. Soil pH was measured in a soil-water suspension (soil:water = 1:2.5) using an automatic titrator (SH/T0983, Changsha, China). Soil bulk density was determined using the core method [24] using three undisturbed soil cores per plot, collected randomly from each soil layer using cylindrical cores. Total N was determined by wet-digestion, following by quantification using a Flow Injection Auto-analyzer (Bran+Luebbe, Hamburg, Germany).
Soil nitrification and N mineralization were estimated based on N levels in the resin and in soils before and after incubation. Net N mineralization rates during each incubation period were calculated from differences of inorganic N concentrations between initial and incubated samples. Similarly, net N nitrification rates were calculated from differences of NO3-N concentrations between initial and incubated samples. Net N mineralization and nitrification rates during each incubation period were calculated as follows:
RM = (Tm1 − Tm0t−1, RN = (Tn1 − Tn0t−1
Tm1 = Sm1 + Rm1, Tn1 = Sn1 + Rn1
where RM (mg·kg−1·day−1) is the net N mineralization rate, and RN (mg·kg−1·day−1) is the net nitrification rate. Tm1 and Tm0 (mg·kg−1) represent total inorganic N (sum of NH4+-N and NO3-N) concentrations after and before incubation, respectively; Tn1 and Tn0 (mg·kg−1) represent total NO3-N concentrations after and before incubation; and t is the number of incubation days. Sm1 and Rm1 (mg·kg−1) are the total inorganic N (NH4+-N and NO3-N) concentrations in the soil and resin samples; while Sn1 and Rn1 (mg·kg−1) are the NO3-N concentrations in the soil and resin samples.
Annual net N mineralization and nitrification were estimated by summing the results from four incubation periods in the year [25]. Nitrogen content in the experiment area (kg N·ha−1) was estimated based on mean inorganic N concentrations in the top 20 cm surface soils and mean soil bulk density (kg·m−3) over this soil layer.

2.4. Statistical Analysis

All results are expressed on an oven-dry mass basis and reported as mean (±standard deviation) of three field replications. One-way ANOVA was used to determine the significance in the detected differences between soil inorganic N concentrations, nitrification rate, net N mineralization rate, or cumulative mineralized N among the four tree spacing treatments for each soil layer. Significant differences between spacing treatments and measured times were tested using two-way ANOVA (spacing, time frame and the interaction) and Duncan’s test with significance at p = 0.05. All analyses were performed using SPSS 10.0 statistical software package (SPSS Inc., Chicago, IL, USA).

3. Results

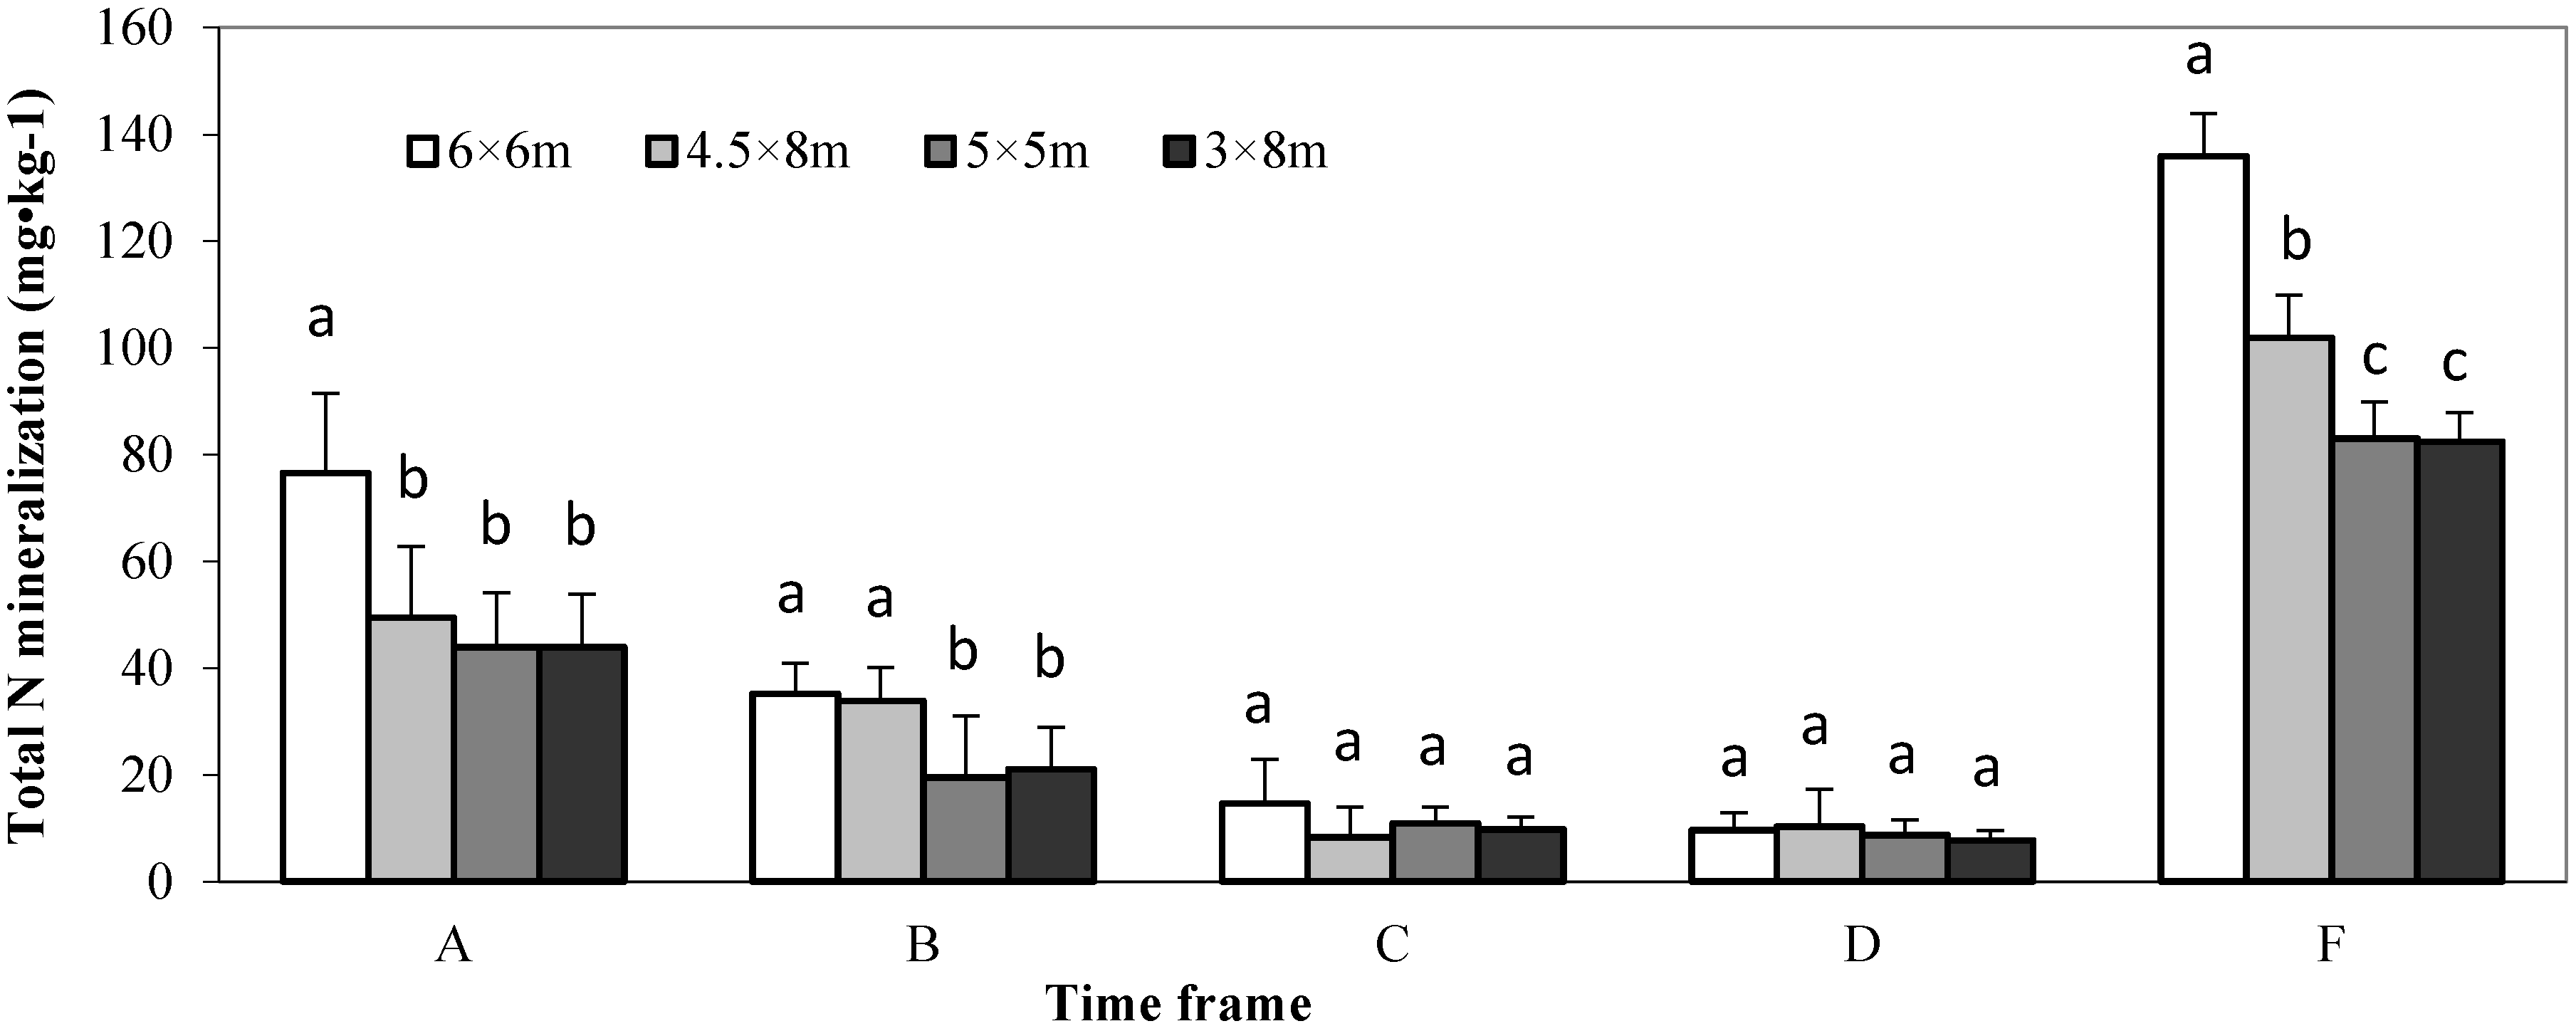
3.1. Nitrogen Mineralization and Nitrification

Seasonal variation in net N mineralization (RM) and nitrification rate (RN) in soils under different spacing plantations are shown in Table 2. Tree spacing treatments and time frames significantly affected RN and RM values (Table 3, p < 0.05), and a significant interaction between tree spacing treatments and time frames was also detected except for the soil of 0–5 cm depth. Seasonal variation patterns of nitrification and mineralization rates were similar for the three soil layers tested (Table 2), with higher rates detected in 0–5 cm soil layers. The mean net RN in the surface soil (0–20 cm), where four tree spacings averaged within time frames, followed the order of 0.57 mg·kg−1·day−1 in time frame A (from 10 May to 10 August 2012), >0.26 mg·kg−1·day−1 in time frame B (from 10 August to 10 November 2012), >0.16 mg·kg−1·day−1 in time frame D (from 10 February to 10 May 2013),>0.13 mg·kg−1·day−1 time frame C (from 10 November 2012 to 10 February 2013), while the mean net RM was ranked as time frame A (0.58 mg·kg−1·day−1) > B (0.30 mg·kg−1·day−1) > C (0.12 mg·kg−1·day−1) > D (0.10 mg·kg−1·day−1).
Table 2. Mean nitrification and mineralization rates measured in four time frames (from 10 May 2012 to 10 May 2013) at three soil layers under different tree spacing treatments (Mean ± SD) *.
Time FrameSpacing (m)N Nitrification Rate (mg·kg−1·day−1)N Mineralization Rate (mg·kg−1·day−1)
0–5 cm5–10 cm10–20 cm0–5 cm5–10 cm10–20 cm
A6 × 60.40 ± 0.11 a0.24 ± 0.05 a0.18 ± 0.08 a0.40 ± 0.11 a0.25 ± 0.14 a0.18 ± 0.08 a
4.5 × 80.31 ± 0.15 a,b0.14 ± 0.04 b0.08 ± 0.03 b,c0.32 ± 0.15 a,b0.14 ± 0.05 a0.08 ± 0.04 b
5 × 50.22 ± 0.07 b0.14 ± 0.08 b0.11 ± 0.03 b0.23 ± 0.07 b0.14 ± 0.08 a0.11 ± 0.03 a,b
3 × 80.26 ± 0.05 b0.16 ± 0.05 b0.05 ± 0.02 c0.27 ± 0.05 b0.16 ± 0.05 a0.04 ± 0.02 b
B6 × 60.14 ± 0.03 a0.14 ± 0.02 a0.07 ± 0.09 a0.16 ± 0.03 a0.15 ± 0.01 a0.08 ± 0.05 a,b
4.5 × 80.13 ± 0.02 a0.11 ± 0.05 a,b0.09 ± 0.01 a0.15 ± 0.02 a0.13 ± 0.07 a,b0.09 ± 0.01 a
5 × 50.08 ± 0.06 a0.07 ± 0.06 b0.02 ± 0.01 b0.10 ± 0.10 a0.06 ± 0.04 b0.03 ± 0.03 b
3 × 80.09 ± 0.03 a0.08 ± 0.04 a,b0.03 ± 0.02 b0.11 ± 0.03 a0.09 ± 0.05 a,b0.04 ± 0.03 a,b
C6 × 60.09 ± 0.04 a0.06 ± 0.06 a0.04 ± 0.02 a0.08 ± 0.04 a0.05 ± 0.05 a0.02 ± 0.01 a
4.5 × 80.08 ± 0.04 a0.04 ± 0.02 a0.02 ± 0.01 a0.05 ± 0.02 a0.04 ± 0.01 a0.003 ± 0.00 a
5 × 50.05 ± 0.02 a0.04 ± 0.03 a0.02 ± 0.01 a0.06 ± 0.01 a0.05 ± 0.02 a0.001 ± 0.00 a
3 × 80.05 ± 0.01 a0.03 ± 0.03 a0.01 ± 0.01 a0.05 ± 0.01 a0.04 ± 0.01 a0.01 ± 0.01 a
D6 × 60.10 ± 0.06 a0.04 ± 0.02 a,b0.02 ± 0.02 a0.06 ± 0.04 a0.03 ± 0.02 a0.01 ± 0.01 a
4.5 × 80.11 ± 0.03 a0.07 ± 0.02 a0.02 ± 0.00 a0.07 ± 0.01 a0.03 ± 0.01 a0.01 ± 0.00 a
5 × 50.06 ± 0.03 a0.05 ± 0.01 a,b0.02 ± 0.01 a0.04 ± 0.02 a0.03 ± 0.02 a0.02 ± 0.01 a
3 × 80.10 ± 0.03 a0.03 ± 0.02 b0.02 ± 0.01 a0.06 ± 0.04 a0.02 ± 0.01 a0.005 ± 0.00 b
* A: 10 May–10 August 2012; B: 10 August–10 November 2012; C: 10 November 2012–10 February 2013; D: 10 February–10 May 2013. Different letters indicate significant differences between spacing treatments of the same soil layer sampled within the same time frame according to Duncan’s test (p < 0.05).
For all of the three soil layers, RN under 6 × 6 m tree spacing was significantly higher than other three spacing treatments tested at the time frame from 10 May to 10 August 2012, whereas there was no significant difference in RN values among spacing treatments at other testing periods. For example, in the 5–10 cm layer the RN under the 6 × 6 m stand achieved 0.24 mg·kg−1·day−1 , which was 71.4%, 71.4%, and 50.0% higher than those of 4.5 × 8 m, 5 × 5 m, and 3 × 8 m, respectively. The mean net RN in the surface soil (0–20 cm), for which the four time frames were averaged within each tree spacing treatment, followed the order of 6 × 6 m spacing (0.38 mg·kg−1·day−1) > 4.5 × 8 m spacing (0.30 mg·kg−1·day−1) > 5 × 5 m spacing (0.22 mg·kg−1·day−1) ≥ 3 × 8 m spacing (0.22 mg·kg−1·day−1).
Table 3. ANOVA for nitrification and mineralization rates in soils under different tree spacing sampled at different time frames.
Soil Layer (cm)FactorN Nitrification RateN Mineralization Rate
F valuepF valuep
0–5Spacing39.04<0.00134.87<0.001
Time frame3.870.0183.110.040
Spacing × Time frame0.950.4970.730.681
5–10Spacing43.70<0.00138.18<0.001
Time frame4.620.0095.850.003
Spacing × Time frame2.670.0202.410.032
10–20Spacing58.32<0.00141.60<0.001
Time frame13.27<0.00110.31<0.001
Spacing × Time frame6.17<0.0015.65<0.001
Similar to soil net RN, RM value measured in the 0–5 cm soil layer under 6 × 6 m tree spacing was higher than other spacing treatments tested at time frame A (Table 2), which was also significantly higher than those of the same spacing treatment but at different time frames. The mean net RM in the surface soil (0–20 cm), for which the four time frames were averaged within each tree spacing treatment, followed the order of 6 × 6 m spacing (0.37 mg·kg−1·day−1) > 4.5 × 8 m spacing (0.29 mg·kg−1·day−1) > 5 × 5 m spacing (0.22 mg·kg−1·day−1) ≥ 3 × 8 m spacing (0.22 mg·kg−1·day−1).
In the time frame A, cumulative N mineralized in the surface soils under 6 × 6 m treatment was significantly higher than the other tested spacing treatments (Figure 1). It was clearly detected that high tree density led to significant reduction in cumulative N mineralization in timeframe B. However, there was no significant difference with respect to N mineralization among spacing treatments within time frames of C and D. Cumulative N mineralization in soils of low density plots was generally higher than those of high density (Figure 1).When summing up data from different tested time frames, total annual cumulative net N mineralization was significantly different in the soils under different tree spacing treatments. The total annual cumulative net N mineralization ranged from 80.3–136.0 mg·kg1 in the surface soils, while total annual cumulative net N mineralization of 6 × 6 m and 4.5 × 8 m spacings was 65% and 24% higher than that of the 5 × 5 m, respectively.

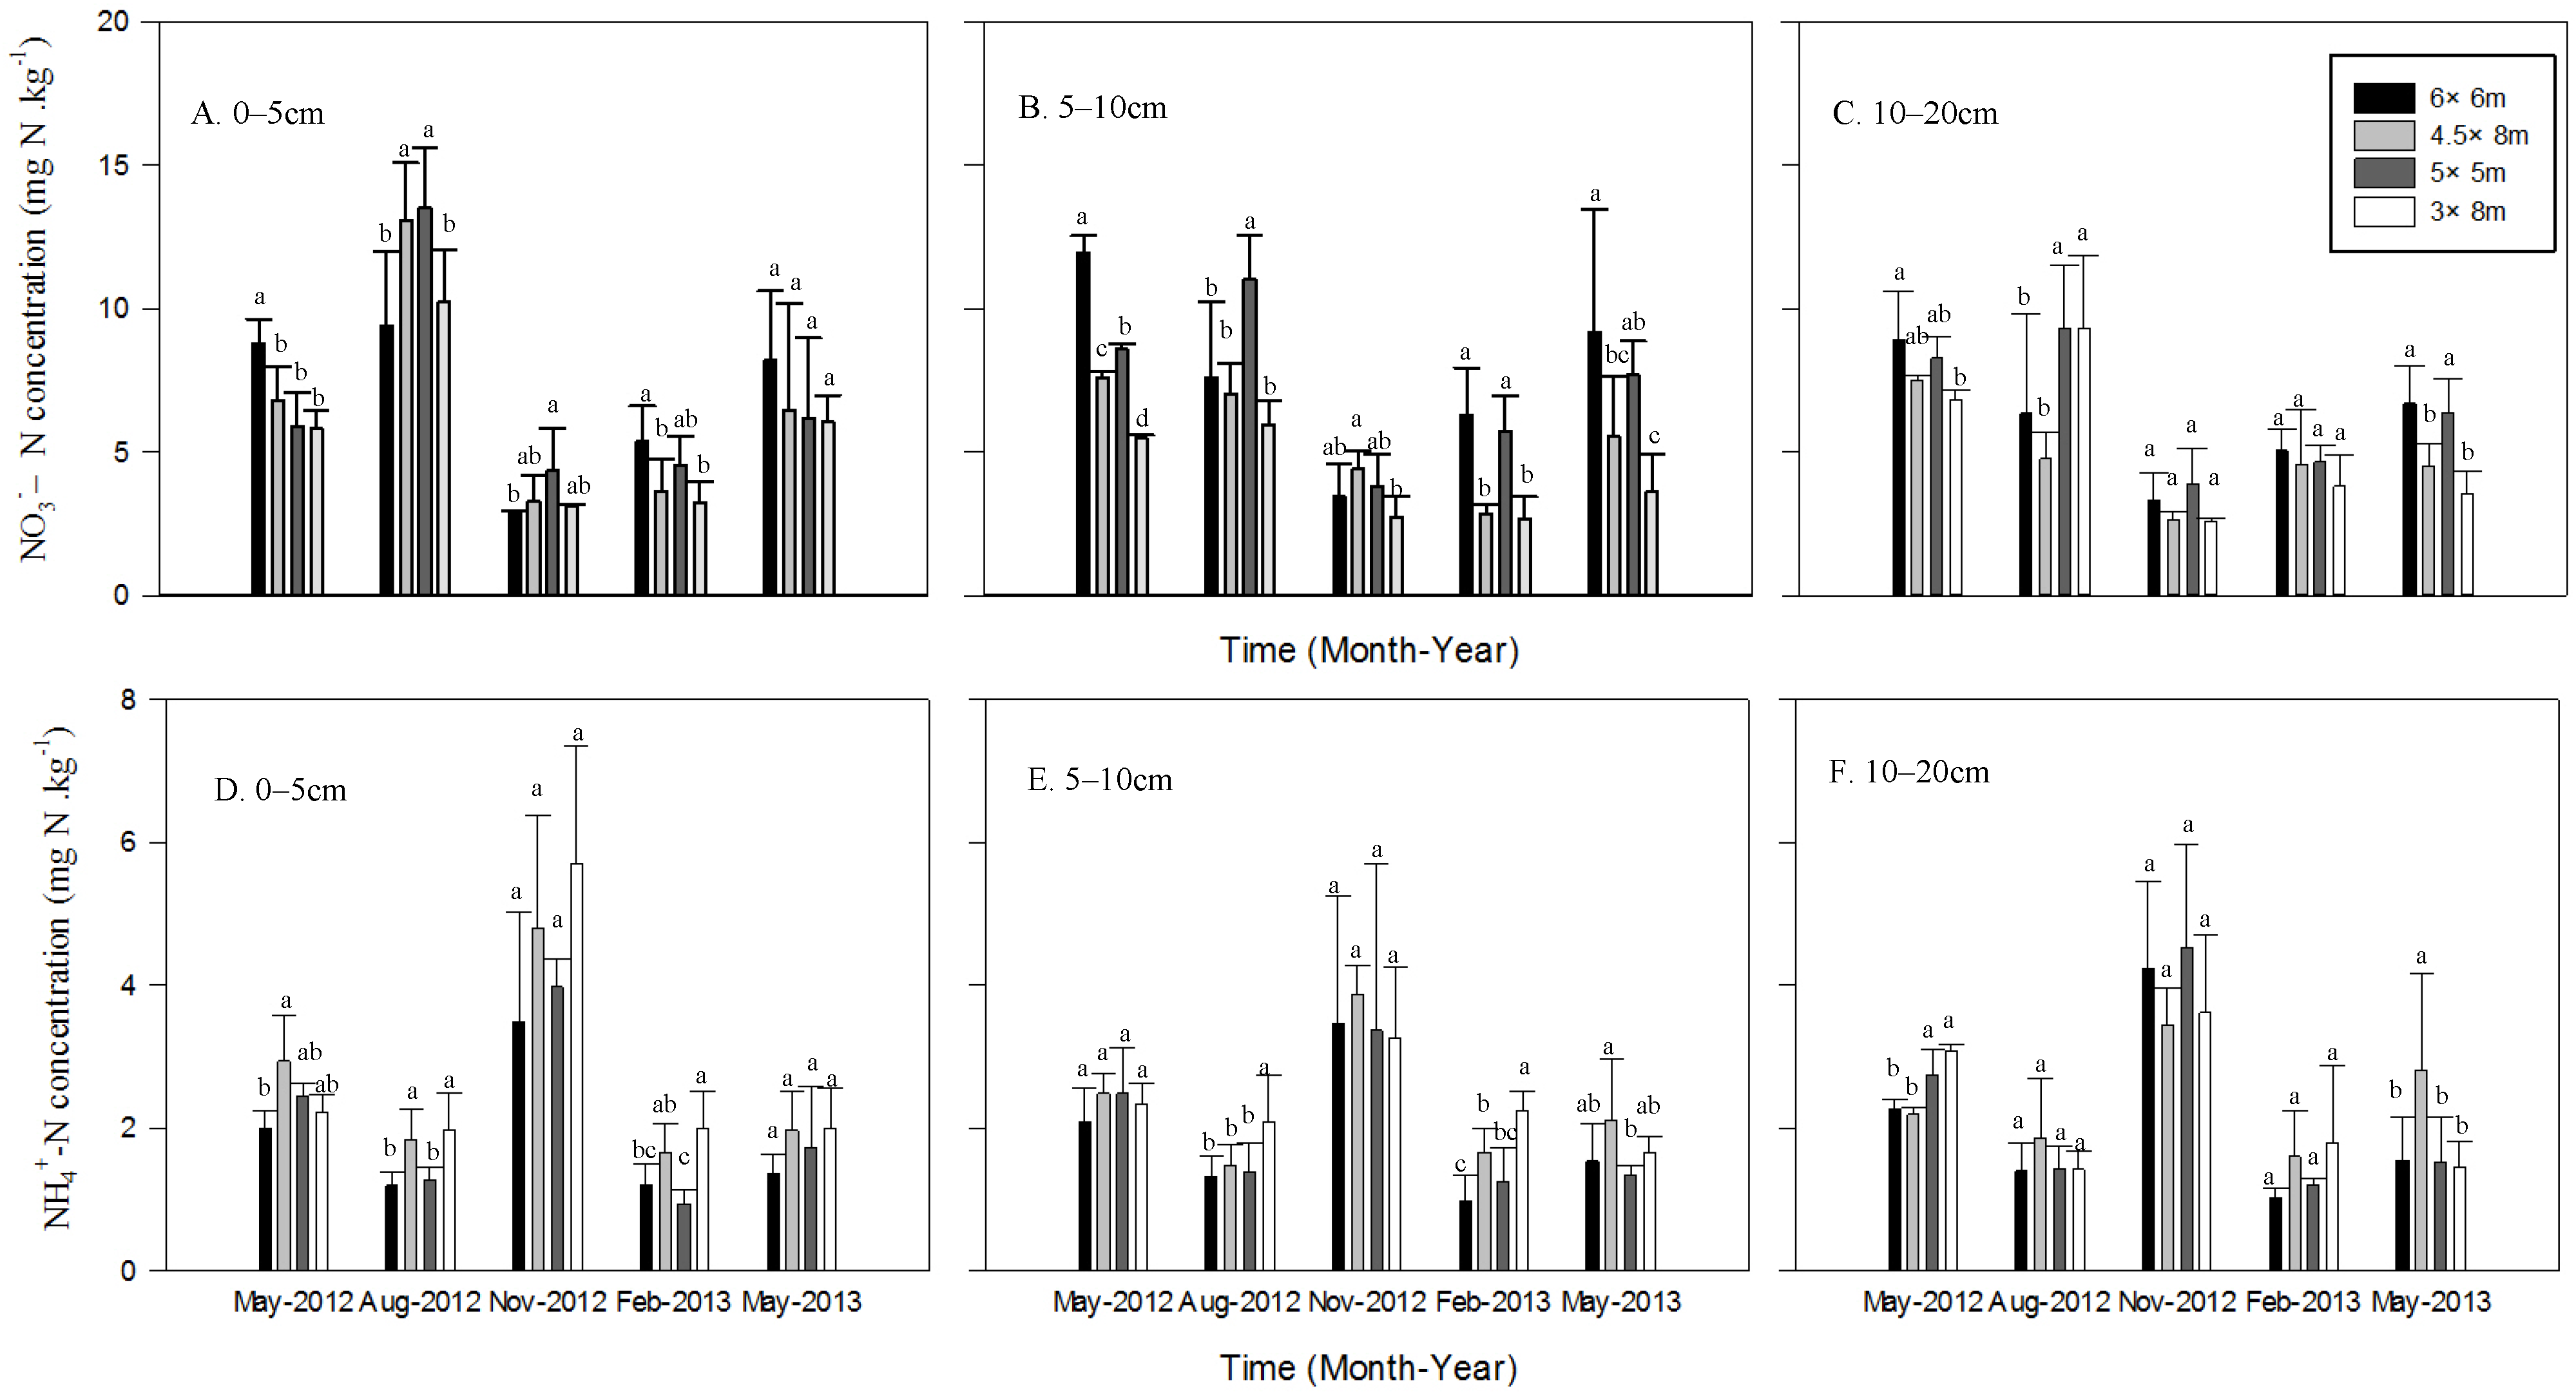
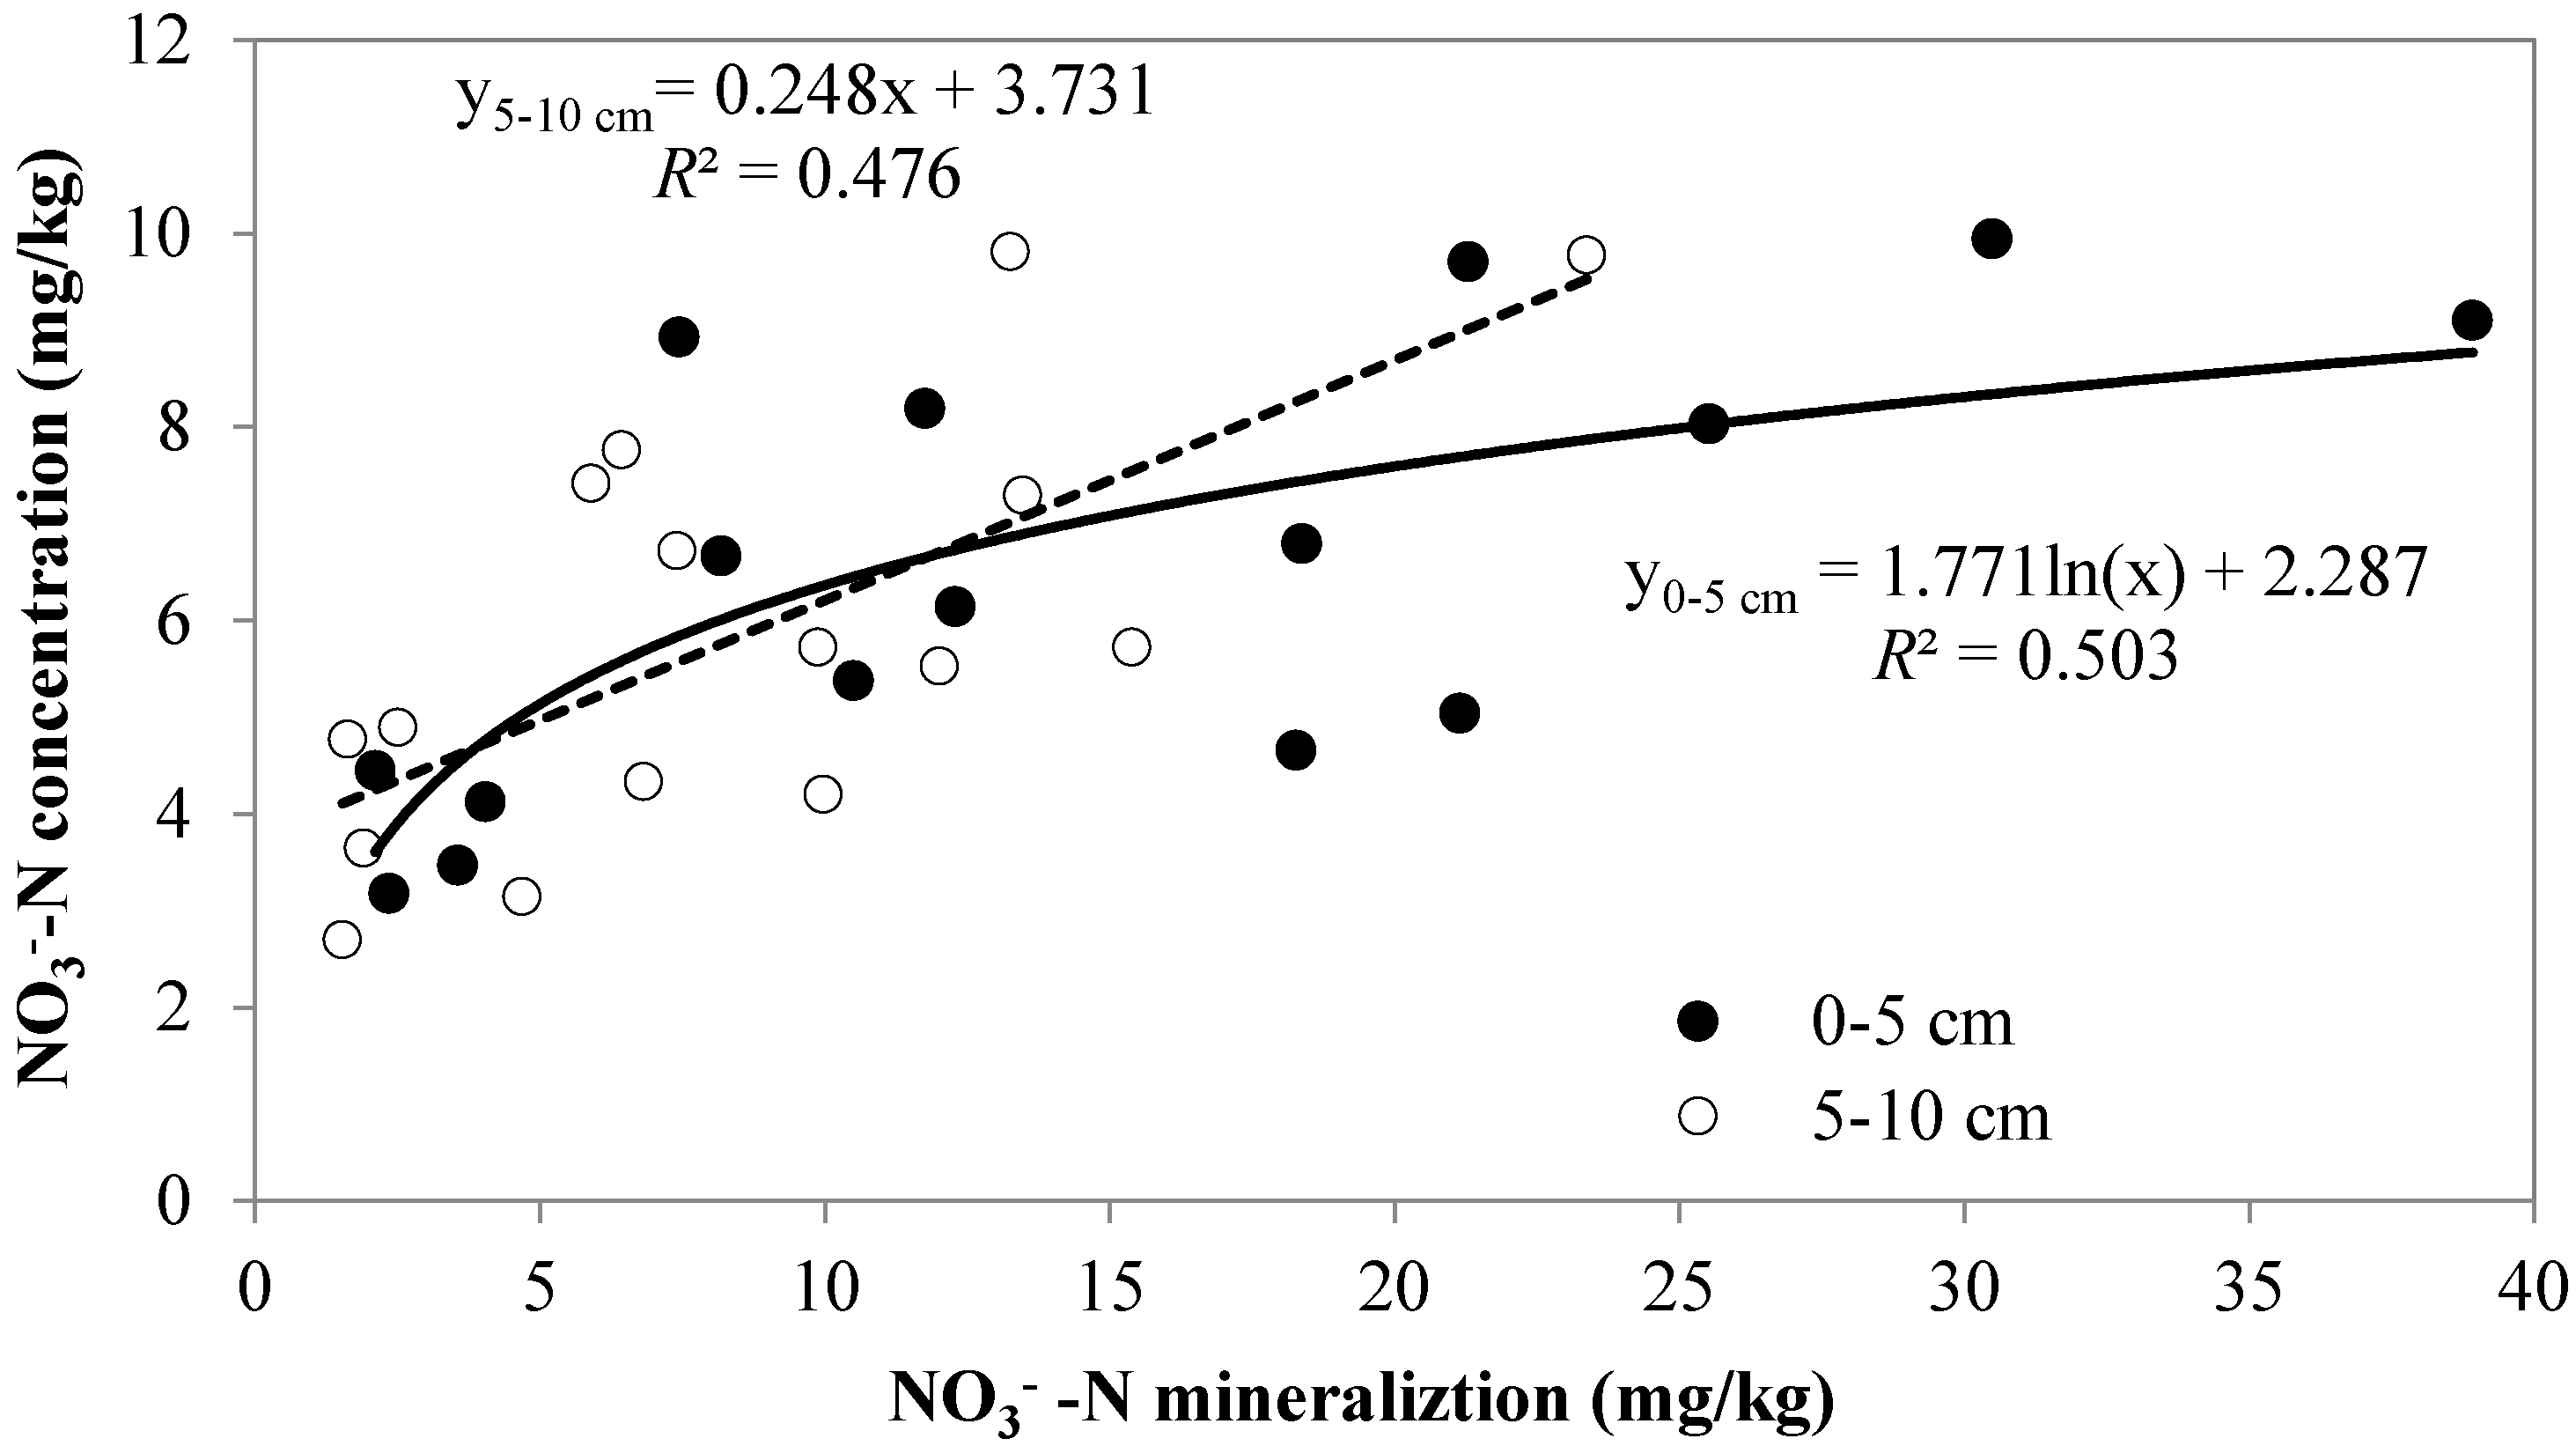
3.2. Soil Inorganic N Concentration

Concentrations of soil NO3-N and NH4+-N in soils of different layers varied with sampling time and tree spacing treatment (Figure 2). In the 0–5 cm soil layer, temporal variation of NO3-N concentrations was similar under different spacing treatments, with the highest concentration detected in August and the lowest in November (Figure 2A). However, there were considerable variations with respect to temporal variation among soils of different depths. In general, mean NO3-N concentrations in the samples taken in May and August of 2012 were higher than other sampling times tested. Of spacing treatments tested, variation trend in NO3-N concentrations in soils was not consistent across sampling times. In most case, a significant difference in NO3-N concentrations was detected among the four tree spacings at the same soil layer and the same sampling time (Figure 2A–C). Temporal variations of soil NH4+-N concentrations were somewhat different from those observed for soil NO3-N (Figure 1D–F). Overall, concentrations of NH4+-N in the three soil layers were by average significantly higher in November 2012 than all other sampling times tested.
Figure 1. Nitrogen mineralized at the specified time frames (A: 10 May to 10 August 2012; B: 10 August to 10 November 2012; C: 10 November 2012 to 10 February 2013; D: 10 February to 10 May 2013; F: 10 May 2012 to 10 May 2013) in soils under different spacing treatments. Different letters indicate significant differences between four spacing treatments at the same time frame (p < 0.05).
Forests 06 00636 g001
Figure 2. Dynamics of inorganic N concentration in various soil depths (0–5, 5–10, and 10–20 cm) of different tree spacing treatments at different sampling times in poplar plantations. Different letters indicate significant differences between four spacing treatments at the same time (p < 0.05).
Forests 06 00636 g002

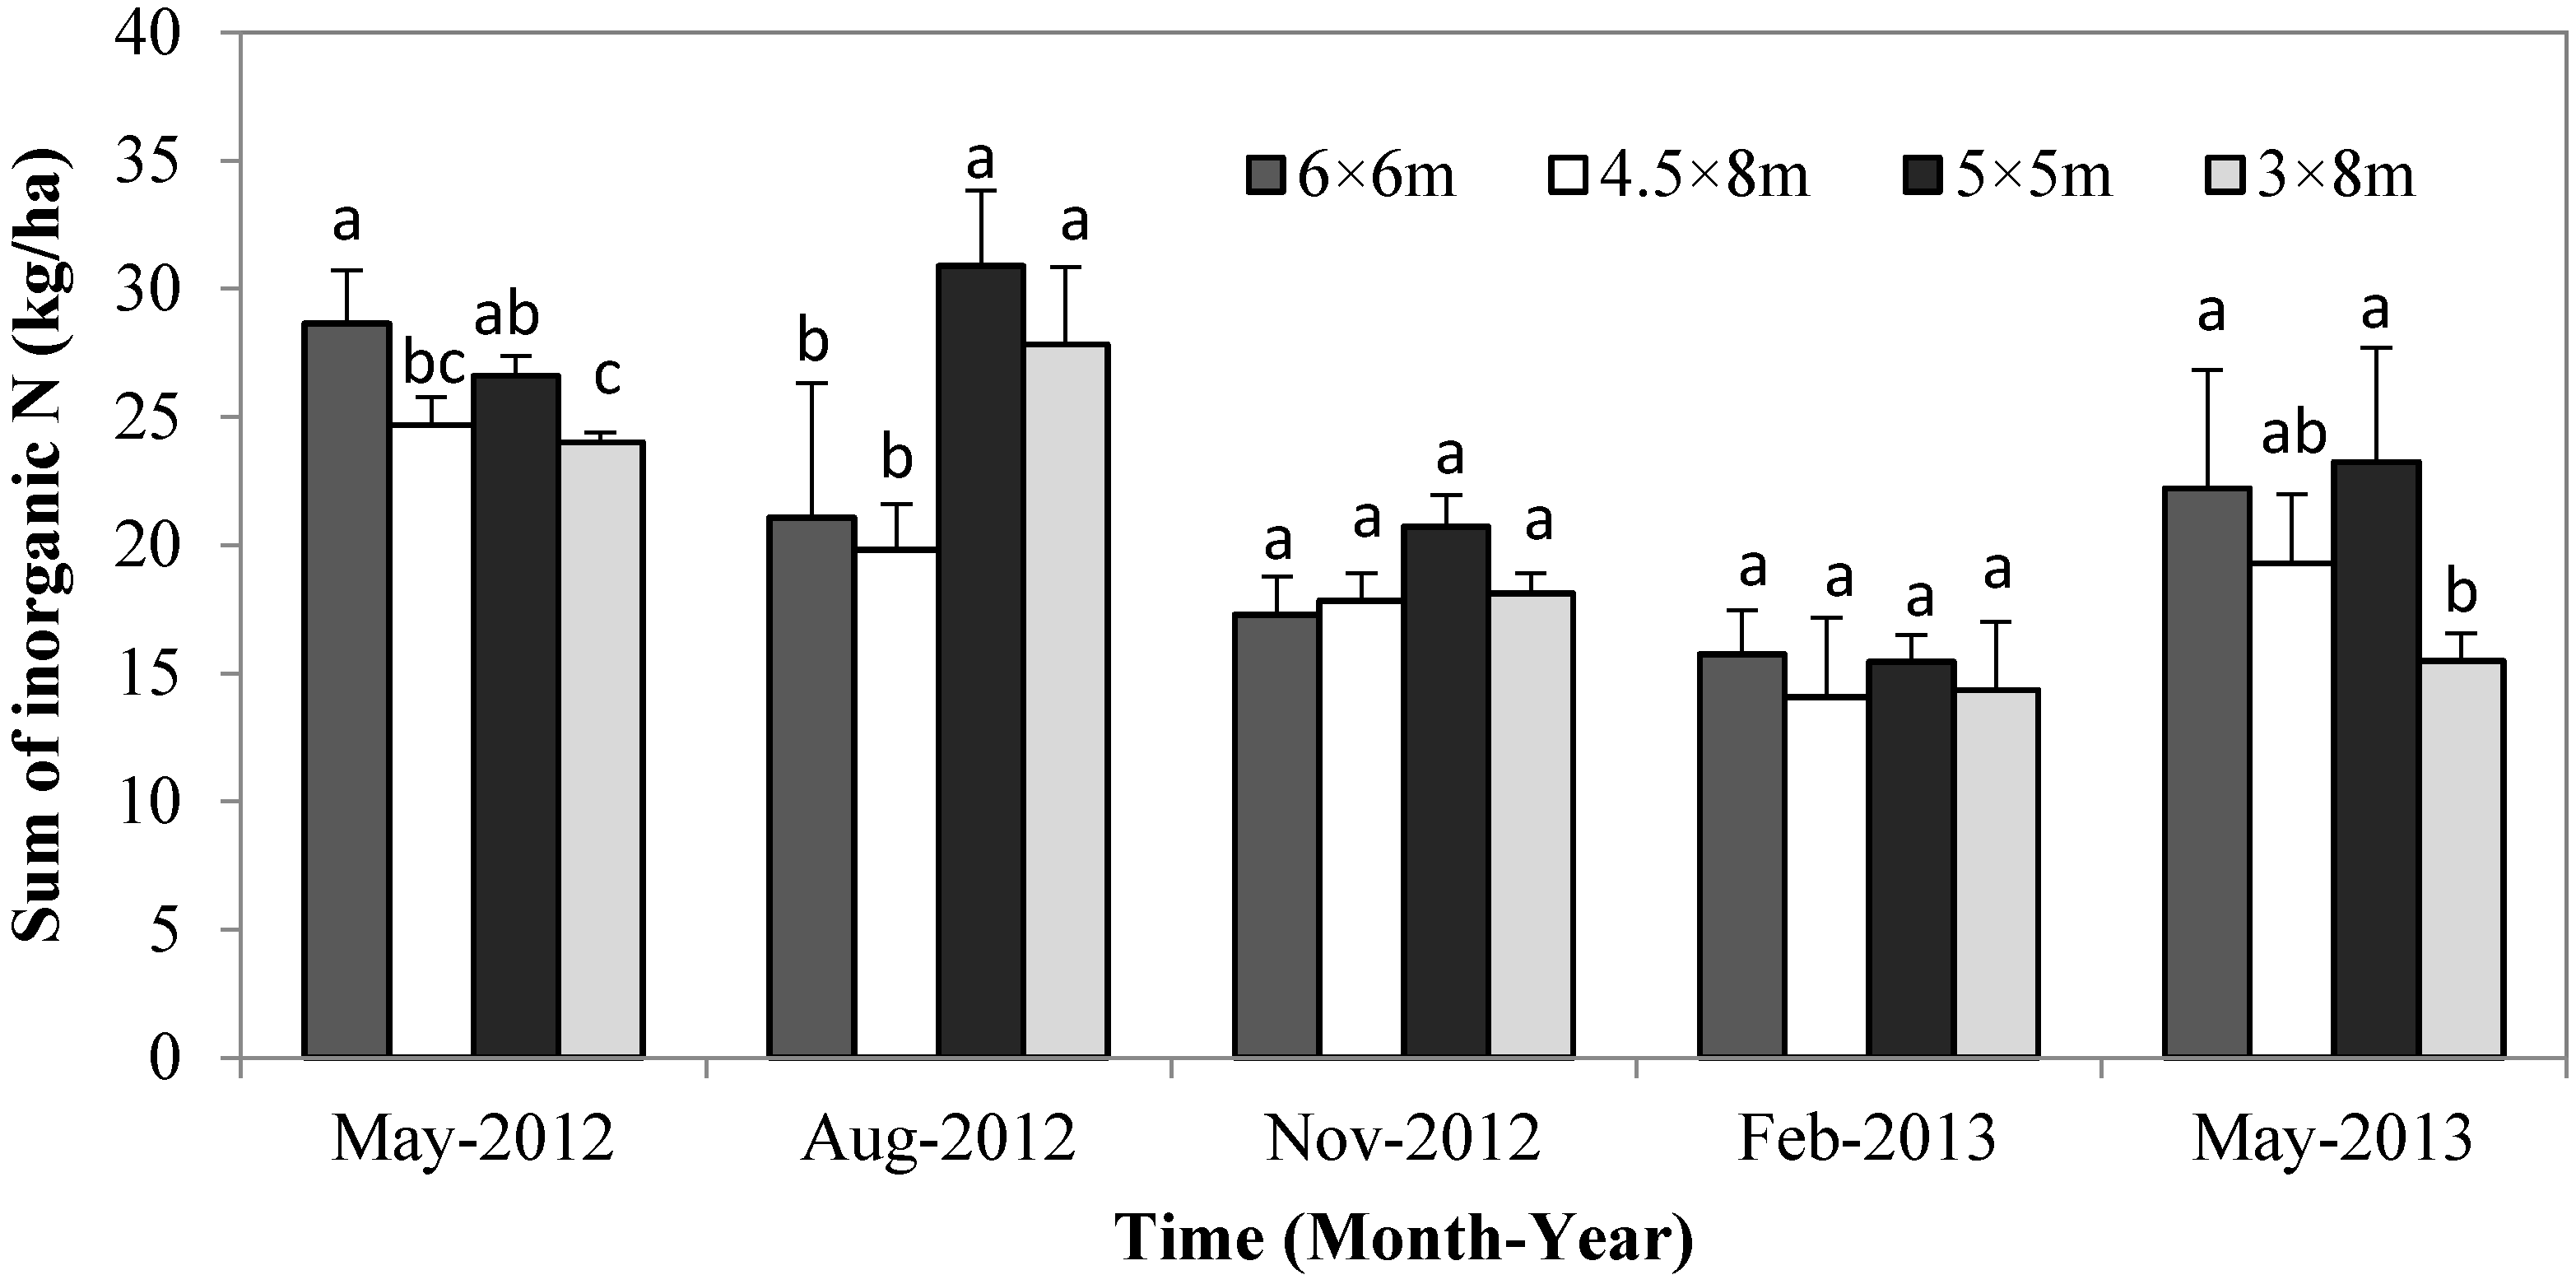
3.3. Soil Inorganic N Content

Temporal variations of inorganic N content in surface soil (0–20 cm) are shown in Figure 3. Overall, the soil inorganic N content in the growing seasons was higher than in the non-growing seasons, and tree spacing had a significant effect on inorganic N content in the surface soil during the growing season (Figure 3, p < 0.05). However, there was a slight difference in this seasonal dynamics among the four tree spacings (Figure 3). For example, the highest content of soil inorganic N appeared in May 2012 for larger spacing plantations (6 × 6 m and 4.5 × 8 m), but occurred in August 2012 for the lower spacings (5 × 5 m and 3 × 8 m). Moreover, the soil inorganic N content in the plantations of square spacings (6 × 6 m and 5 × 5 m) was higher than the rectangular spacings (4.5 × 8 m and 3 × 8 m). During the growing seasons, inorganic N content of the surface soil under the plantation with 6 × 6 m spacing was 12.7% greater than the 4.5 × 8 m spacing, while 19.9% higher in the 5 × 5 m spacing than in the 3 × 8 m spacing.
Figure 3. Total inorganic nitrogen content in surface soil (0–20 cm) under different tree spacing treatments at different sampling times.
Forests 06 00636 g003

4. Discussion

4.1. Dynamics of Inorganic N and N Mineralization

Data from this study showed that inorganic N content in the surface soil was higher in the spring and summer seasons and decreased in the later parts of the growing season (in early November 2012), inconsistent with the result of Pajuste and Frey [15], who reported that mineral N in soils of boreal Scots pine and Norway spruce stands was greatest during spring, but decreased as the growing season progressed. Similar temporal variation in mineral N availability in Silver birch stands and grasslands were also reported by Uri et al. [26].
Soil N mineralization exhibited spatial and temporal variations, especially seasonal variations [14,27,28,29]. However, it was not clear whether and how the rate of N mineralization in soil is related to the growing periods of trees above-ground. Most studies suggest that N mineralization was enhanced during the growing season [14,30], which was, in part, attributed to higher temperature coupled with greater soil moisture in the growing season [31,32]. Zhang et al. [33] found that 85% of total annual nitrification and 90% of annual N mineralization took place during the growing season. Data from this study also showed that nitrification and N mineralization during the growing season was higher than the dormant period and the peak rates of N mineralization and nitrification were observed during the period of relatively high soil temperature and moisture (during time frame A, Table 2). Overall, the rates of N mineralization and accumulation of NO3-N appeared to follow seasonal patterns of temperature and rainfall. However, compared to time frame A, the N mineralization rate in the time frame B decreased significantly possibly in part because of the reduction of rainfall (only half of the time frame A) even if the air temperature was similar between time frames A and B (Figure 4), supporting the fact that the dynamics of N mineralization are also significantly influenced by soil water content [14]. These findings suggest that the temporal pattern of soil N mineralization relates directly to environmental factors and changing ecosystem productivity throughout the year.
Figure 4. Monthly variation of rainfall and air temperature at the study site during experimental periods.
Forests 06 00636 g004

4.2. Effects of Tree Spacing on Soil N Availability

Results from this study indicated that mean nitrification rate and N mineralization rates in soils under low tree density were higher than those of high tree density (Table 2). The main reason could be the difference in canopy closure among the four tree spacings, which would alter microclimate, understory diversity, litter quality and decomposition rates and finally influence N cycling and availability in the soil [34,35]. However, our results indicated that the NO3-N mineralization had a positive relationship with NO3-N concentration in the soil, and the values of correlation coefficient R2 were 0.503 and 0.476 for soils of 0–5 cm and 5–10 cm depth, respectively (Figure 5), suggesting that tree spacing would affect N availability in soil by altering N mineralization rates.
Generally the higher ecosystem activity and greater plant biomass during the middle and later parts of the growing season increase the demands for available N in the soil [36]. In this study, the inorganic N contents in the growing season were higher than the non-growing season (Figure 3), possibly because of the higher microbial activity and nutrient turnover in the growing season [37,38]. However, inorganic N content in soils sampled in August 2012 under lower tree density was much lower than that of higher density treatments in the present study, confirming that available N in forest soils is often strongly influenced by N uptake by forest vegetation rather than microbial N mineralization and immobilization [39]. Our previous study indicated that understory Shannon index, understory biomass, and concentration of N, P, K, and Mg in understory were much greater in low density plantations (6 × 6 m and 4.5 × 8 m) than in high density stands (5 × 5 m and 3 × 8 m) during the growing season [9]. We only investigated inorganic N content in the surface soil (0–20 cm) in the present study, and no consistent tendency in inorganic N content of the soil was observed at the five sampling times for different tree spacings. However, most of the poplar root systems were distributed in soil of 20–40 cm depth [40], therefore, an investigation of deeper soil layer (20–50 cm) is required in order to demonstrate the effects of tree spacings on N availability in the poplar plantations.
Figure 5. The relationship between soil NO3-N concentration (y) and NO3-N mineralization (x) in various soil depths (n = 16).
Forests 06 00636 g005

5. Conclusions

Seasonal variations of inorganic N content in surface soil (0–20 cm) were detected during the research period, with a higher content in the growing seasons and a lower content in the non-growing seasons. However, a significant variation of inorganic N content in surface soil among the different tree spacings was only observed during the growing season. Tree spacing significantly affected annual net N mineralization, and generally a high annual N mineralization appeared in the soils of low density plantations. However, annual net N mineralization in the soil was higher in square spacing than in rectangular spacing when initial planting density was the same or similar. Seasonal variation patterns of nitrification and mineralization rates were similar in the three soil layers tested, with higher rates detected in the 0–5 cm soil layers. The results obtained suggest that suitable spacing could lead to enhanced N mineralization and soil N availability, but seasonal variation of soil N mineralization may be directly related to plantation productivity.

Acknowledgments

This work was funded by National Basic Research Program of China (973 Program) (2012CB416904) and the Priority Academic Program Development of Jiangsu Higher Education Institutions (PAPD), as well as by the Natural Science fund for colleges and universities in Jiangsu Province (BK2011821). The authors would like to thank Hao Song and Xingjian Dun from Nanjing Forestry University for their contribution and assistance.

Author Contributions

Shengzuo Fang and Luozhong Tang conceived and designed the experiments. Yafei Yan carried out field work, data analysis and prepared the manuscript. Ye Tian and Luozhong Tang contributed to field work and data analysis. Yafei Yan and Dao Ngoc Chuong contributed to the chemical analysis of soil. Shengzuo Fang and Shiping Deng supervised the study, did additional data analysis and reviewed and edited the work.

Conflicts of Interest

The authors declare no conflict of interest.

References

  1. Smith, G.; Brennan, P. First thinning in sub-tropical eucalypt plantations grown for high-value solidwood products: A review. Aust. For. 2006, 69, 305–312. [Google Scholar] [CrossRef]
  2. Armstrong, A.; Johns, C.; Tubby, I. Effects of spacing and cutting cycle on the yield of poplar grown as an energy crop. Biomass Bioenergy 1999, 17, 305–314. [Google Scholar] [CrossRef]
  3. Benomar, L.; DesRochers, A.; Larocque, G.R. Comparing growth and fine root distribution in monocultures and mixed plantations of hybrid poplar and spruce. J. For. Res. 2013, 24, 247–254. [Google Scholar] [CrossRef]
  4. Fang, S.Z.; Xu, X.Z.; Lu, S.X.; Tang, L.Z. Growth dynamics and biomass production in short-rotation poplar plantations: 6-Year results for three clones at four spacings. Biomass Bioenergy 1999, 17, 415–425. [Google Scholar] [CrossRef]
  5. Cassidy, M.; Palmer, G.; Smith, R.G.B. The effect of wide initial spacing on wood properties in plantation grown Eucalyptus pilularis. New For. 2013, 44, 919–936. [Google Scholar] [CrossRef]
  6. Benomar, L.; DesRochers, A.; Larocque, G.R. The effects of spacing on growth, morphology and biomass production and allocation in two hybrid poplar clones growing in the boreal region of Canada. Trees 2012, 26, 939–949. [Google Scholar] [CrossRef]
  7. Debell, D.S.; Harrington, C.A.; Clendenen, G.W.; Zasada, J.C. Tree growth and stand development of four Populus clones in large monoclonal plots. New For. 1997, 14, 1–18. [Google Scholar] [CrossRef]
  8. Kang, K.Y.; Zhang, S.Y.; Mansfield, S.D. The effects of initial spacing on wood density, fibre and pulp properties in jack pine (Pinus banksiana Lamb.). Holzforschung 2004, 58, 455–463. [Google Scholar] [CrossRef]
  9. Yan, Y.F.; Fang, S.Z.; Tian, Y.; Song, H.; Dun, X.J. The response of understory plant diversity and nutrient accumulation to stand structure of poplar plantation. Chin. J. Ecol. 2014, 33, 1170–1177. [Google Scholar]
  10. Oh, T.K.; Cho, M.G.; Chung, J.M.; Jung, H.; Jeon, K.S.; Moon, H.S.; Lee, S.J.; Shinogi, Y. Effect of thinning intensity on soil nitrogen dynamics in Pinus densiflora stand. J. Fac. Agric. Kyushu. Univ. 2012, 57, 473–479. [Google Scholar]
  11. LeBauer, D.S.; Treseder, K.K. Nitrogen limitation of net primary productivity in terrestrial ecosystems is globally distributed. Ecology 2008, 89, 371–379. [Google Scholar] [CrossRef] [PubMed]
  12. Vitousek, P.M.; Howarth, R.W. Nitrogen limitation on land and in the sea: How can it occur? Biogeochemistry 1991, 13, 87–115. [Google Scholar] [CrossRef]
  13. Fang, S.Z.; Xie, B.D.; Liu, D.; Liu, J.J. Effects of mulching materials on nitrogen mineralization, nitrogen availability and poplar growth on degraded agricultural soil. New For. 2011, 41, 147–162. [Google Scholar] [CrossRef]
  14. Gelfand, I.; Yakir, D. Influence of nitrite accumulation in association with seasonal patterns and mineralization of soil nitrogen in a semi-arid pine forest. Soil Biol. Biochem. 2008, 40, 415–424. [Google Scholar] [CrossRef]
  15. Pajuste, K.; Frey, J. Nitrogen mineralization in podzol soils under boreal Scots pine and Norway spruce stands. Plant Soil 2003, 257, 237–247. [Google Scholar] [CrossRef]
  16. Wong, M.T.F.; Nortcliff, S. Seasonal fluctuations of native available N and soil management implications. Fertil. Res. 1995, 42, 13–26. [Google Scholar] [CrossRef]
  17. Booth, M.S.; Stark, J.M.; Rastetter, E. Controls on nitrogen cycling in terrestrial ecosystems: A synthetic analysis of literature data. Ecol. Monogr. 2005, 75, 139–157. [Google Scholar] [CrossRef]
  18. Vitousek, P.M.; Hättenschwiler, S.; Olander, L.; Allison, S. Nitrogen and nature. Ambio 2002, 31, 97–101. [Google Scholar] [PubMed]
  19. Fang, S.Z.; Zhai, X.C.; Wan, J.; Tang, L.Z. Clonal variation in growth, chemistry and calorific value of new poplar hybrids at nursery stage. Biomass Bioenergy 2013, 54, 303–311. [Google Scholar] [CrossRef]
  20. Thomas, D.; Henson, M.; Joe, B.; Boyton, S.; Dickson, R. Review of growth and wood quality of plantation grown Eucalyptus dunnii Maiden. Aust. For. 2009, 72, 3–11. [Google Scholar] [CrossRef]
  21. Sariyildiz, T.; Anderson, J.M.; Kucuk, M. Effects of tree species and topography on soil chemistry, leaf litter quality, and decomposition in Northeast Turkey. Soil Biol. Biochem. 2005, 37, 1695–1706. [Google Scholar] [CrossRef]
  22. Binkley, D.; Aber, J.; Pastor, J.; Nadelhoffer, K. Nitrogen availability in some Wisconsin forests: Comparisons of resin bags and on-site incubations. Biol. Fertil. Soils 1986, 2, 77–82. [Google Scholar] [CrossRef]
  23. Shibata, H.; Urakawa, R.; Toda, H.; Inagaki, Y.; Tateno, R.; Koba, K.; Nakanishi, A.; Fukuzawa, K.; Yamasaki, A. Changes in nitrogen transformation in forest soil representing the climate gradient of the Japanese archipelago. J. For. Res. 2011, 16, 374–385. [Google Scholar] [CrossRef]
  24. Klute, A. Methods of Soil Analysis. Part 1—Physical Mineralogical Methods; INC; American Society of Agronomy: Madison, WI, USA, 1986; pp. 363–375. [Google Scholar]
  25. Trindade, H.; Coutinho, J.; Jarvis, S.; Moreira, N. Nitrogen mineralization in sandy loam soils under an intensive doublecropping forage system with dairy-cattle slurry applications. Eur. J. Agron. 2001, 15, 281–293. [Google Scholar] [CrossRef]
  26. Uri, V.; Lohmus, K.; Kund, M.; Tullus, H. The effect of land use type on net nitrogen mineralization on abandoned agricultural land: Silver birch stand versus grassland. For. Ecol. Manag. 2008, 255, 226–233. [Google Scholar] [CrossRef]
  27. Pandey, C.B.; Rai, R.B.; Singh, L. Seasonal dynamics of mineral N pools and N mineralization in soils under homegarden trees in South Andaman, India. Agrofor. Syst. 2007, 71, 57–66. [Google Scholar] [CrossRef]
  28. Wei, X.R.; Shao, M.A.; Fu, X.L.; Göran, I.; Yin, X.Q. The effects of land use on soil N mineralization during the growing season on the northern Loess Plateau of China. Geoedroma 2011, 160, 590–598. [Google Scholar] [CrossRef]
  29. Yan, E.R.; Wan, X.H.; Guo, M.; Zhong, Q.; Zhou, W.; Li, Y.F. Temporal patterns of net soil N mineralization and nitrification through secondary succession in the subtropical forests of eastern China. Plant Soil 2009, 320, 181–194. [Google Scholar] [CrossRef]
  30. Zhou, L.S.; Huang, J.H.; Lü, F.M.; Han, X. Effects of prescribed burning and seasonal and interannual climate variation on nitrogen mineralization in a typical steppe in Inner Mongolia. Soil Biol. Biochem. 2009, 41, 796–803. [Google Scholar] [CrossRef]
  31. Ehrenfeld, J.G.; Han, X.G.; Parsons, W.F.J.; Zhu, W.X. On the nature of environmental gradients: Temporal and spatial variability of soils and vegetation in the New Jersey pinelands. J. Ecol. 1997, 85, 785–798. [Google Scholar] [CrossRef]
  32. Zhu, W.X.; Carreiro, M.M. Temporal and spatial variations in nitrogen transformations in deciduous forest ecosystems along an urban-rural gradient. Soil Biol. Biochem. 2004, 36, 267–278. [Google Scholar] [CrossRef]
  33. Zhang, X.L.; Wang, Q.B.; Li, L.H.; Han, X.G. Seasonal variations in nitrogen mineralization under three land use types in a grassland landscape. Acta Oecol. 2008, 3, 322–330. [Google Scholar] [CrossRef]
  34. Tan, X.; Chang, S.X.; Comeau, P.G.; Wang, Y.H. Thinning effects on microbial biomass, N mineralization, and tree growth in a mid-rotation fire-origin lodgepole pine stand in the lower foothills of Alberta, Canada. For. Sci. 2008, 54, 465–474. [Google Scholar]
  35. Merila, P.; Smolander, A.; Strommer, R. Soil nitrogen transformations along a primary succession transect on the land-uplift coast in Western Finland. Soil Biol. Biochem. 2002, 34, 373–385. [Google Scholar] [CrossRef]
  36. Binkley, D.; Hart, S. The components of nitrogen availability assessments in forest soils. Adv. Soil Sci. 1989, 10, 57–116. [Google Scholar]
  37. Nadelhoffer, K.J.; Giblin, A.E.; Shaver, G.R.; Laundre, J.A. Effects of temperature and substrate quality on element mineralization in six arctic soils. Ecology 1991, 72, 242–253. [Google Scholar] [CrossRef]
  38. Schmidt, I.K.; Jonasson, S.; Michelsen, A. Mineralization and microbial immobilization of N and P in arctic soils in relation to season, temperature and nutrient amendment. Appl. Soil Ecol. 1999, 11, 147–160. [Google Scholar] [CrossRef]
  39. McKinley, D.C.; Rice, C.W.; Blair, J.M. Conversion of grassland to coniferous woodland has limited effects on soil nitrogen cycle processes. Soil Biol. Biochem. 2008, 40, 2627–2633. [Google Scholar] [CrossRef]
  40. Fang, S.Z.; Xie, B.D.; Liu, J.J. Soil nutrient availability, poplar growth and biomass production on degraded agricultural soil under fresh grass mulch. For. Ecol. Manag. 2008, 255, 1802–1809. [Google Scholar] [CrossRef]

