Abstract
The mixed Chinese fir (Cunninghamia lanceolata (Lamb.) Hook.), Masson’s pine (Pinus massoniana Lamb.), and hardwood forest is a major forest type in China and of national and international importance in terms of its provision of both timber and ecosystem services. However, over-harvesting has threatened its long-term productivity and sustainability. We examined the impacts of timber harvesting intensity on soil physical and chemical properties 10 and 15 years after cutting using the research plots established with a randomized block design. We considered five treatments, including clear cutting and low (13.0% removal of growing stock volume), medium (29.1%), high (45.8%), and extra-high (67.1) intensities of selective cutting with non-cutting as the control. The impact on overall soil properties derived from principal component analysis showed increasing with a rise in cutting intensity, and the most critical impact was on soil nutrients, P and K in particular. Soil nutrient loss associated with timber harvesting even at a low cutting intensity could lead to nutrient deficits in this forest although most of the soil physical properties could be recovered under the low and medium intensities of cutting. These results indicate that clear cutting and the selective cutting of extra-high and high intensities should be avoided in this type of forest in the region.
1. Introduction
Soil is critical to maintaining the productivity and sustainability of forest ecosystems. On the one hand, soil physically supports trees and is a source of moisture and nutrients for tree growth. On the other hand, when trees grow a great deal of litter is generated, returning nutrients to soil to improve its fertility through decomposition. Timber harvesting impacts soil, typically decreasing soil evapotranspiration and increasing soil compaction, temperature, and its diurnal fluctuation [1,2]. If not properly executed, timber harvesting could lead to undesirable consequences including soil erosion and forest degradation [3,4].
A considerable amount of work has been done to assess the impact of timber harvesting on forest soil. Over-harvesting could have significant undesirable ecological consequences including losses in biodiversity and soil quality [5]. In recent years, much attention has been paid to understanding the impacts of timber harvesting on soil physical and chemical properties in general and on soil fertility in particular. Many studies have reported that timber harvesting deteriorates soil physical and chemical properties, including losses of organic matter, N (nitrogen), P (phosphorus), K (potassium), and minerals [6,7,8,9,10,11]; reductions in soil water holding capacity and porosity [12]; and increases in soil bulk density, soil erosion, and forest degradation [13,14,15,16,17]. Some others have explored the effects of forest cutting on biodiversity. Timber harvesting is a disturbance to a forest ecosystem. High-intensity disturbances can cause adverse impacts on biodiversity and soil erosion, whereas low- and medium-intensity disturbances may benefit biodiversity over a long time period [18,19,20,21]. Most of these studies, however, focus on plantation forests and short- or intermediate-term effects of timber harvesting partially because of a lack of long-term data. In addition, most of them examine the impact on individual soil properties instead of overall soil properties. Thus, there is a need to uncover the impact of timber harvest on overall soil properties in mixed forests over a longer period.
The mixed Chinese fir (Cunninghamia lanceolata (Lamb.) Hook.), Masson’s pine (Pinus massoniana Lamb.), and hardwood forest is a major forest type in China, covering approximately 66 million ha [10]. This forest type is an important source of timber and various ecosystem services including carbon storage, biodiversity, and water regulation [22]. It is estimated that this forest type has supplied 40% of total timber volume harvested in China and 33 million tonnes of carbon storage [10]. Given the vital role of China in global forest products markets and forest conservation [23], maintaining the long-term productivity and sustainability of this forest is important to China and the world alike. Increases in China’s domestic timber supply from its sustainably managed forests would reduce its timber imports, alleviating the pressure on global forest conservation. However, this mixed natural forest is under great pressure in a large part due to over-harvesting over the past several decades, which has caused its degradation affecting its ability to sustainably provide timber and ecosystem services. Hence, increased efforts have been made to protect this forest as part of the National Natural Forest Conservation Program in China [24]. These efforts include shifting timber harvests from natural forests to plantations [10], thus providing an opportunity to adopt less intensive timber harvesting methods in this mixed natural forest. How different timber harvesting intensities will affect forest soil and ecosystem services, however, is not well understood.
This study aims to examine the impacts of timber harvesting intensity on soil in this mixed Chinese fir, Masson’s pine, and hardwood forest in the southeastern China. We focus on the impacts on both physical and chemical properties of soil 10 and 15 years after the cutting. By focusing on the impacts on a mixed forest over a longer period, we intend to enrich the existing literature that is centered on the short-term effects of timber harvest on forest plantations. Additionally, we employ principal component analysis (PCA) to assess the aggregate effects of cutting intensity on overall soil physical and chemical properties. Because timber harvesting alters several soil properties simultaneously and these properties tend to interact with one another, it is important to disclose the aggregate effects jointly. Finally, we probe the impacts across a wide spectrum of cutting intensities, ranging from non-cutting (the benchmark) to clear cutting. As such, our results can aid in determining the optimal timber harvesting intensity for this major forest type in the region. Given the geographically wide spread of this forest and other similar forests, our findings would also have implications beyond the study region.
2. Materials and Methods
2.1. Study Site
The study site was on the Dayuan Forest Farm, Jianou County, Fujian Province, southern China (117°58′45″–118°57′11″ E, 26°38′54″–27°20′26″ N). It is located between two mountains with the Wuyi Mountains on the northwest and the Jiufeng Mountains on the southeast. The research plots were established within sub-compartments 17, 18, and 19 in compartment 84 (Figure 1). The experiment site is characterized as low mountain hilly terrain. The elevation of the site ranges from 600 to 800 m with a slope of 25–34°. This area has a subtropical maritime monsoon climate. The mean annual temperature is 15 °C–17 °C, and annual precipitation is 1890 mm. According to United States Department of Agriculture (USDA) soil taxonomy, the soil on the study site is classified as oxisol.
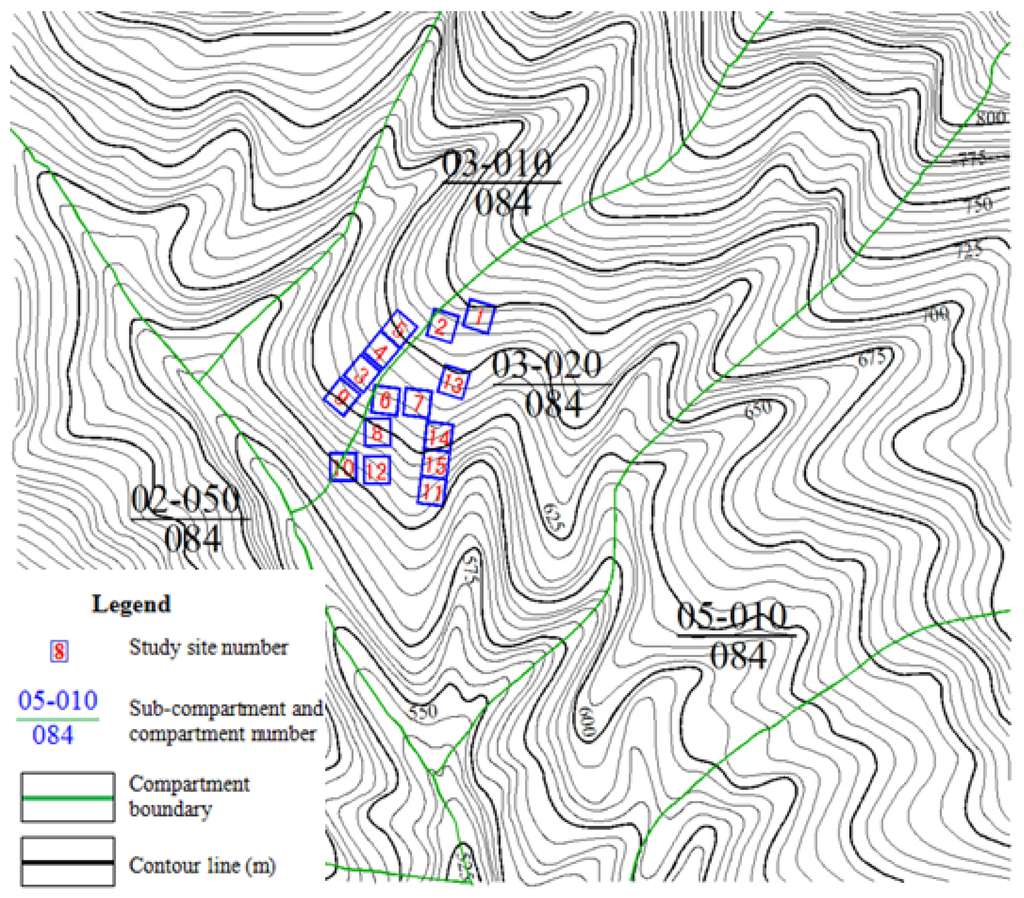
Figure 1.
Study site.
Main tree species in the natural forest are Castanopsis eyrei (Champ. ex Benth.) Tutch., Castanopsis carlesii (Hemsl.) Hayata, Daphnipyllum oldhamii (Hemsl.) K. Rosenthal, Schima superba Gardner and Champ., and Pinus massoniana Lamb. Shrub species on the site include Adinandra millettii Hook. and Arn., Lithocarpus glaber (Thumb.) Nakai, Engelhardtia fenzelii Merr., Symplocos congesta Benth., Eurya nitida Korth., and Rhaphiolepis indica (L.) Lindl. Ex Ker Gawl. Underground herbaceous and liana species are dominated by Dicranopteris dichotoma (Thunb.) Bernh., Smilax china L., Woodwardia japonica (L.f.) Sm., Hicriopteris chinensis (Rosenst.) Ching, and Gahnia tristis Nees. More details about the characteristics of this forest can be found in [2].
2.2. Plot Establishment and Measurements
The experiment plots (20 m × 20 m) were established using a randomized block design. Blocking factors included topology, soil, and initial forest stand conditions. There were five treatments including four selective cutting intensities and clear cutting with non-cutting as the control. Four selective cutting intensities were low intensity (13.0% removal of growing stock volume), medium intensity (29.1%), high intensity (45.8%), and extra-high intensity (67.1%) (Table 1). The plots were established in March 1996 with three replications for each treatment.
Selective cuttings were executed in accordance with the technical requirements established by the single tree selection method [25]. Defective and inferior trees were cut out first, followed by removing over-mature and some mature trees to create a healthy and vigorous forest stand that resembled the original species composition in the forest and the target stand density under each cutting intensity. The cutting operation consisted of chainsaw cutting, on-site delimbing and bucking, skidding by human shoulder, and collecting and utilizing branches of >5 cm in diameter. This logging method is a common practice in the region. Prior to the cutting, forest stand conditions on the sites of these plots were the same with a 90% crown closure [26]. These plots were measured immediately before their establishment in March 1996 and after their establishment in November 1996. In July 2006 (10 years after the cutting) and August 2011 (15 years after the cutting), they were measured again. The characteristics of the forest stands in the treatment plots before and immediately after the cutting are shown in Table 1.

Table 1.
Stand characteristics of treatment plots.
| Cutting Intensity | Stand Density (No. of trees/ha) | Volume of Growing Stock (m3/ha) | Cutting Intensity (% of Growing Stock Volume) | Mean DBH (cm) | |||
|---|---|---|---|---|---|---|---|
| Pre-Cutting | Post-Cutting | Pre-Cutting | Post-Cutting | Pre-Cutting | Post-Cutting | ||
| Low | 1592 | 1533 | 258.5 | 224.7 | 13.0 | 17.3 | 16.7 |
| Medium | 2866 | 2275 | 286.6 | 211.8 | 29.1 | 16.0 | 14.4 |
| High | 1875 | 1617 | 245.5 | 133.7 | 45.8 | 15.7 | 13.5 |
| Extra-high | 2008 | 1350 | 201.3 | 64.8 | 67.1 | 14.7 | 9.6 |
| Clear cutting | 1125 | 0 | 206.3 | 0 | 100 | 15.9 | 0 |
2.3. Soil Sampling and Testing
Because the influence of harvesting on soil is primarily on surface soil, only the surface soil layers between 0 and 10 cm and between 10 and 20 cm were sampled. The sampling was executed according to the national standard for collecting and preparing forest soil samples [27]. Each soil sample was taken respectively from the upper, middle, and lower sections of the slope in each plot. For the purposes of testing physical properties, the soil samples were kept in their original soil shapes by putting them into aluminum boxes to prevent them from being squeezed and becoming deformed. For the purposes of analyzing soil chemical properties, the samples were put inside plastic bags, sealed and labeled. The three soil samples from the upper, middle, and lower sections of the slope in each plot were evenly mixed and air-dried; and then the mixed soil was used for lab analysis [25]. Thus, the soil testing results represented the average value from the upper, middle, and lower sections of the slop in each plot.
Soil physical properties analyzed here included soil bulk density, aggregates, porosity, and water holding capacity because they are important indicators of soil structure. Likewise, common indicators of soil chemical properties such as organic matter, nitrogen (N), phosphorus (P), and potassium (K) were considered in this study.
Analyses of soil physical and chemical properties were performed according to the national standard/protocol [28]. Soil aggregate stability was tested using the mechanical screening method (LY/T 1226-1999) [29]; water holding capacity was assessed via the cutting ring method (LY/T 1215-1999) [30]; organic matter was measured with the potassium dichromate oxidation-external heating method (LY/T 1237-1999) [31]; total phosphorus was analyzed with the perchloric acid-sulfuric acid-soluble Mo-Sb colorimetry method (LY/T 1232-1999) [32]; rapidly available phosphorus was extracted with the hydrochloric acid-ammonium fluoride extraction method (LY/T 1233-1999) [33]; total nitrogen was estimated with the perchloric acid-sulfuric acid digestion diffusion absorption method (LY/T 1228-1999) [34]; water-soluble nitrogen was quantified with the alkaline hydrolysis-diffusion absorption method (LY/T 1229-1999) [35]; total potassium was tested with the sodium hydroxide alkali fusion-flame photometry method (LY/T 1234-1999) [36]; rapidly available potassium was gauged with the ammonium acetate extraction-flame photometry method (LY/T 1236-1999) [37]. More details about the soil testing procedures can also be found in [38]. The means of these test results for a given cutting intensity were used to represent its impacts on soil physical and chemical properties.
2.4. Data Analysis
With the data derived from field measurements and laboratory analyses, we calculated the percentage change in soil physical and chemical properties under different cutting intensity relative to non-cutting. That is, we computed the R-score [7,26] as follows:
where Sij is the mean value of soil property i at the sites with cutting intensity j; Sio is the mean value of soil property i in the non-cutting plots. The percentage change (R-score) reflects the change in soil properties at a specific cutting intensity when compared to non-cutting some (10 and 15) years after the cutting. Additionally, one-way ANOVA was performed to compare the impacts of cutting intensity on overall soil properties.
We were particularly interested in the aggregate impacts of cutting intensity on overall soil properties, which called for multivariate analysis. However, possible correlations among different variables (soil properties) in the model posed statistical complications [39]. To overcome this challenge, we adopted principal component analysis.
Using the estimated principal components, we further calculated the weighted index value of impacts of cutting intensity on overall soil physical and chemical properties [40]:
where F is the aggregate impact score of cutting intensity on overall soil properties; ƞj is the contribution rate of the jth PC (Fj) with
3. Results
3.1. Impacts on Individual Soil Physical Properties
Table 2 shows the measurements of soil physical properties at the harvest sites under different cutting intensities, 10 and 15 years after the cutting. All these indicators showed certain variation tendency over time, suggesting that soil physical properties could be at least partially restored over time. Among these physical properties, the percentage of damaged structural aggregates declined dramatically from 10 years to 15 years after the cutting. Under the low and medium intensities of selective cuttings, damaged structural aggregates 10 years after the cutting fell to 12.4% and 11.9%, respectively. However, 15 years after the cutting, the corresponding figure reduced to 3.2% and 2.7%, respectively. Soil bulk density also showed further decline from 10 to 15 years after the cutting under all cutting intensities.
Soil water holding capacity also decreased with an increase in cutting intensity (Table 2). An increase in cutting intensity led to an increase in soil bulk density and a reduction in porosity, thus reducing soil permeability and water transferring and holding capacity.
According to the R-scores (Table 3), under the low and medium cutting intensities, most of the soil physical properties were able to be restored to their levels at the non-cutting sites in 10 years; under the high cutting intensity, most of the soil physical properties could be restored in 15 years; under the extra-high cutting intensity and clear cutting, almost all the soil physical properties could not be fully recovered even 15 years after the cutting.
Table 2.
Means and standard deviations of soil physical properties 10 and 15 years after cutting.
| Cutting Intensity | Soil Bulk Density (g·cm−3) | >0.25 mm Water-Stable Aggregates (%) | Damaged Structural Aggregates (%) | Max Water Holding Capacity (%) | Min Water Holding Capacity (%) | Capillary Water Holding Capacity (%) | Total Porosity (%) | Capillary Porosity (%) | Non-Capillary Porosity (%) |
|---|---|---|---|---|---|---|---|---|---|
| 10 years after cutting | |||||||||
| Non-cutting | 1.23 (0.21) a | 70.7 (1.7) | 12.38 (0.22) | 45.4 (5.1) | 29.3 (0.1) | 34.4 (1.9) | 54.77 (1.7) | 41.5 (0.3) | 13.2 (1.2) |
| Low | 1.05 (0.13) | 71.9 (3.5) | 11.89 (0.18) | 59.2 (5.2) | 39.3 (2.2) | 43.0 (1.5) | 62.3 (1.3) | 44.9 (1.5) | 19.9 (1.7) |
| Medium | 1.18 (0.04) | 73.1 (2.6) | 9.62 (0.05) | 51.3 (3.8) | 32.8 (1.0) | 38.7 (1.1) | 60.0 (0.9) | 45.3 (1.2) | 14.8 (0.2) |
| High | 1.24 (0.16) | 68.6 (1.4) | 13.51 (0.72) | 43.9 (1.6) | 28.4 (0.9) | 34.2 (0.7) | 53.6 (0.7) | 41.8 (0.7) | 11.8 (0.4) |
| Extra-high | 1.28 (0.21) | 67.0 (2.6) | 14.05 (1.16) | 41.8 (1.0) | 25.0 (0.3) | 34.1 (0.9) | 53.2 (0.4) | 43.2 (0.9) | 10.0 (0.5) |
| Clear cutting | 1.35 (0.33) | 64.7 (1.4) | 17.78 (1.87) | 37.0 (2.3) | 22.2 (1.3) | 31.0 (1.0) | 49.8 (0.6) | 41.7 (0.4) | 8.1 (0.8) |
| 15 years after cutting | |||||||||
| Non-cutting | 1.11 (0.06) | 68.8 (1.5) | 3.22 (0.01) | 46.4 (4.8) | 28.3 (0.1) | 31.0 (1.4) | 50.2 (0.9) | 33.2 (0.8) | 14.3 (1.0) |
| Low | 0.99 (0.07) | 69.3 (3.7) | 2.71 (0.01) | 51.7 (5.4) | 30.5 (1.2) | 36.4 (2.2) | 53.6 (0.8) | 38.0 (1.2) | 17.1 (0.7) |
| Medium | 1.06 (0.08) | 70.5 (2.2) | 2.18 (0.02) | 50.2 (3.2) | 30.2 (0.4) | 36.1 (1.0) | 52.7 (0.6) | 36.8 (0.5) | 15.3 (1.8) |
| High | 1.08 (0.02) | 71.7 (1.0) | 2.43 (0.04) | 49.3 (4.6) | 29.9 (0.7) | 35.8 (0.9) | 52.4 (1.6) | 39.5 (0.3) | 14.8 (0.4) |
| Extra-high | 1.18 (0.26) | 67.1 (2.1) | 4.95 (0.03) | 44.8 (3.9) | 25.6 (0.2) | 29.6 (0.1) | 48.1 (0.2) | 39.2 (0.4) | 13.7 (0.4) |
| Clear cutting | 1.20 (0.35) | 64.5 (0.9) | 4.99 (0.06) | 41.6 (4.3) | 24.7 (0.6) | 27.8 (0.2) | 46.9 (0.8) | 38.4 (0.2) | 12.6 (1.7) |
a Figures inside parentheses are standard deviations.
Table 3.
Percentage changes in soil physical properties due to different cutting intensities relative to non-cutting.
| Soil Property | Cutting Intensity (10 Years after Cutting) | Cutting Intensity (15 Years after Cutting) | ||||||||
|---|---|---|---|---|---|---|---|---|---|---|
| Low | Medium | High | Extra-High | Clear Cutting | Low | Medium | High | Extra-High | Clear Cutting | |
| Soil bulk density | −14.3 | −3.6 | 1.1 | 4.4 | 9.9 | −10.6 | −5.2 | −3.2 | 5.8 | 7.8 |
| >0.25 mm water-stable aggregates | 1.8 | 3.5 | −3.0 | −5.2 | −8.5 | 0.7 | 2.5 | 4.3 | −2.5 | −6.3 |
| Damaged structural aggregates | −3.9 | −22.3 | 9.1 | 13.5 | 43.6 | −15.9 | −32.3 | −24.3 | 53.5 | 54.9 |
| Max water holding capacity | 30.6 | 13.1 | −3.3 | −7.8 | −18.4 | 11.4 | 8.2 | 6.2 | −3.4 | −10.3 |
| Min water holding capacity | 33.9 | 11.9 | −3.2 | −14.9 | −24.4 | 7.7 | 6.7 | 5.5 | −9.7 | −12.9 |
| Capillary water holding capacity | 25.1 | 12.5 | −0.6 | −1.0 | −9.9 | 17.6 | 16.7 | 15.6 | −4.5 | −10.2 |
| Total porosity | 13.7 | 9.6 | −2.1 | −2.9 | −9.0 | 6.7 | 5.1 | 4.3 | −4.2 | −6.6 |
| Capillary porosity | 8.1 | 9.0 | 0.6 | 4.1 | 0.3 | 14.4 | 10.7 | 18.8 | 17.9 | 15.7 |
| Non-capillary porosity | 50.7 | 11.5 | −10.7 | −24.8 | −38.5 | 19.7 | 7.0 | 3.9 | −4.2 | −11.8 |
Table 4.
Percentage change in soil physical properties between 10 and 15 years after cutting.
| Cutting Intensity | Soil Bulk Density | >0.25 mm Water-Stable Aggregates | Damaged Structural Aggregates | Max Water Holding Capacity | Min Water Holding Capacity | Capillary Water Holding Capacity | Total Porosity | Capillary Porosity | Non-Capillary Porosity |
|---|---|---|---|---|---|---|---|---|---|
| Non-cutting | −9.3 | −2.7 | −73.9 | 2.3 | −3.4 | −10.0 | −8.3 | −20.1 | 7.7 |
| Low | −5.3 | −3.7 | −77.2 | −12.8 | −22.3 | −15.4 | −13.9 | −15.5 | −14.5 |
| Medium | −10.8 | −3.6 | −77.3 | −2.2 | −8.0 | −6.6 | −12.2 | −18.9 | 3.4 |
| High | −13.2 | 4.7 | −81.9 | 12.3 | 5.3 | 4.7 | −2.3 | −5.6 | 25.3 |
| Extra-high | −8.2 | 0.1 | −64.8 | 7.2 | 2.4 | −13.2 | −9.6 | −9.4 | 37.2 |
| Clear cutting | −11.1 | −0.3 | −71.9 | 12.4 | 11.3 | −10.3 | −5.9 | −7.8 | 54.6 |
Recovery or deterioration rates of soil physical properties also displayed some difference across cutting intensities. For instance, damaged structural aggregates and >0.25 mm water-stable aggregates recovered at a slower pace under the extra-high cutting intensity and clear cutting than under non-cutting between 10 and 15 years after the cutting, whereas these two properties restored faster under the low and medium cutting intensities than under non-cutting. However, maximum and minimum soil water holding capacities deteriorated faster under the low and medium cutting intensities than under non-cutting, whereas they recovered under the extra-high cutting intensity and clear cutting between 10 and 15 years after the cutting. Similarly, non-capillary porosity deteriorated at a lower rate under the low and medium cutting intensities but recovered faster under the high and extra-high cutting intensities and clear cutting than under non-cutting (Table 4).
Hence, although soil physical properties damaged by timber harvesting showed some recovery over time, clear cutting and selective cutting of high and extra-high intensities could lead to long-term damage to some soil physical properties. The most likely long-term damage would be to water holding capacity and porosity.
3.2. Impacts on Individual Soil Chemical Properties
In general, soil chemical properties tended to deteriorate with an increase in cutting intensity (Table 5 and Table 6). Soil organic matter, total N, hydrolysis N, and total P were able to be restored 10 years after the cutting under the low and medium cutting intensities and 15 years after the cutting under the high cutting intensity. It would take longer than 15 years for these chemical properties to be restored to their levels at the non-cutting sites under the extra-high cutting intensity and clear cutting if it would be possible. An increase in cutting intensity reduced canopy interception during the rainy season and caused more severe surface runoff and soil erosion, thus reducing soil fertility [41,42]. The measurements of all soil chemical properties under the extra-high intensity of selective cutting and clear cutting were lower than those at the non-cutting sites even 15 years after the cutting. This suggests that clear cutting and selective cutting of extra-high intensity could cause N deficits in this type of forest in the region.
Available P and K and total K could not be fully recovered 15 years after the cutting; even worse, they further declined from 10 years to 15 years after the cutting. The deterioration in total K and available P and K over time was partially attributable to their uptakes by trees during the time period. The reduced litterfall as trees were harvested could also contribute to soil nutrient loss [43,44,45]. Additionally, eluviation of K made it easier to get lost in the soil after cutting than other nutrients [46,47,48]. Hence, P and K deficits could be a problem in this forest even at a low cutting intensity.
Table 5.
Means and standard deviations of soil chemical properties 10 and 15 years after cutting.
| Cutting Intensity | Organic Matter (g·kg−1) | Total N (g·kg−1) | Hydrolysis N (mg·kg−1) | Total P (g·kg−1) | Available P (mg·kg−1) | Total K (g·kg−1) | Available K (mg·kg−1) |
|---|---|---|---|---|---|---|---|
| 10 years after cutting | |||||||
| Non-cutting | 25.1 (0.4) a | 0.95 (0.02) | 86.8 (14.5) | 0.092 (0.002) | 3.52 (0.02) | 54.29 (0.63) | 124.4 (3.7) |
| Low | 25.6 (1.2) | 0.99 (0.08) | 93.9 (14.4) | 0.106 (0.010) | 3.23 (0.02) | 53.02 (0.67) | 105.3 (4.1) |
| Medium | 25.2 (0.5) | 0.97 (0.10) | 93.1 (17.5) | 0.108 (0.010) | 3.05 (0.03) | 49.70 (0.12) | 86.1 (4.3) |
| High | 22.8 (1.0) | 0.84 (0.10) | 78.1 (9.8) | 0.091 (0.005) | 2.38 (0.06) | 38.60 (0.09) | 74.2 (2.8) |
| Extra-high | 20.1 (0.4) | 0.77 (0.05) | 75.5 (7.1) | 0.090 (0.003) | 1.78 (0.07) | 36.18 (0.51) | 63.3 (3.8) |
| Clear cutting | 18.7 (0.7) | 0.65 (0.06) | 56.8 (1.7) | 0.089 (0.001) | 1.53 (0.03) | 34.97 (0.09) | 47.9 (1.9) |
| 15 years after cutting | |||||||
| Non-cutting | 23.0 (0.4) | 0.97 (0.01) | 80.4 (12.8) | 0.080 (0.004) | 1.47 (0.01) | 17.37 (0.05) | 81.2 (3.4) |
| Low | 25.3 (1.0) | 1.07 (0.05) | 93.2 (11.7) | 0.091 (0.006) | 0.54 (0.05) | 13.44 (0.09) | 79.1 (1.7) |
| Medium | 25.0 (0.4) | 1.01 (0.11) | 85.8 (10.6) | 0.087 (0.003) | 0.45 (0.06) | 8.91 (0.03) | 74.0 (3.4) |
| High | 24.6 (0.4) | 0.99 (0.07) | 83.6 (13.1) | 0.085 (0.007) | 0.42 (0.03) | 8.90 (0.08) | 51.2 (2.3) |
| Extra-high | 21.4 (0.5) | 0.84 (0.05) | 76.6 (12.3) | 0.067 (0.008) | 0.35 (0.04) | 6.51 (0.08) | 48.0 (2.3) |
| Clear cutting | 18.1 (0.3) | 0.72 (0.04) | 74.9 (3.6) | 0.060 (0.003) | 0.31 (0.04) | 5.80 (0.06) | 37.5 (1.1) |
a Figures inside parentheses are standard deviations.
Table 6.
Percentage changes in soil chemical properties due to different cutting intensities relative to non-cutting.
| Soil Property | 10 Years after Cutting | 15 Years after Cutting | ||||||||
|---|---|---|---|---|---|---|---|---|---|---|
| Low | Medium | High | Extra-High | Clear Cutting | Low | Medium | High | Extra-High | Clear Cutting | |
| Organic matter | 1.9 | 0.4 | −9.2 | −19.9 | −25.5 | 10.0 | 8.7 | 6.9 | −6.9 | −21.3 |
| Total N | 4.2 | 2.1 | −11.6 | −18.9 | −31.6 | 10.3 | 4.1 | 2.1 | −13.4 | −25.8 |
| Hydrolysis N | 8.3 | 7.3 | −10.0 | −13.1 | −34.6 | 15.9 | 6.7 | 4.0 | −4.7 | −6.8 |
| Total P | 15.2 | 17.4 | −1.1 | −2.2 | −3.3 | 13.8 | 8.8 | 6.3 | −16.9 | −25.0 |
| Available P | −8.2 | −13.4 | −32.4 | −49.4 | −56.5 | −63.3 | −69.7 | −71.4 | −76.2 | −78.9 |
| Total K | −2.3 | −8.5 | −28.9 | −33.4 | −35.6 | −22.6 | −48.7 | −48.8 | −62.5 | −66.6 |
| Available K | −15.3 | −30.7 | −40.4 | −49.1 | −61.5 | −2.6 | −8.8 | −36.9 | −40.8 | −53.9 |
3.3. Impacts on Overall Soil Properties
3.3.1. Comparison of Impacts of Cutting Intensity
The descriptive statistics of impacts of cutting intensity on overall soil physical and chemical properties are shown in Table 7. According to the ANOVA results (Table 8), cutting intensity had a significant impact on overall soil properties both 10 and 15 years after the cutting at the 5% significance level.
Table 7.
Descriptive statistics of impacts of cutting intensity on overall soil properties.
| Cutting Intensity | N | Mean | Std. Error | 95% Confidence Interval for Mean | |
|---|---|---|---|---|---|
| Lower Bound | Upper Bound | ||||
| 10 years after cutting | |||||
| Non-cutting | 16 | 40.50 | 8.82 | 21.70 | 59.30 |
| Low | 16 | 48.30 | 6.86 | 33.69 | 62.92 |
| Medium | 16 | 36.57 | 7.73 | 20.10 | 53.04 |
| High | 16 | 32.12 | 6.66 | 17.92 | 46.33 |
| Extra-high | 16 | 19.20 | 4.38 | 9.87 | 28.53 |
| Clear cutting | 16 | 20.89 | 4.37 | 11.58 | 30.19 |
| Total | 96 | 32.93 | 2.86 | 27.26 | 38.60 |
| 15 years after cutting | |||||
| Non-cutting | 16 | 36.31 | 7.57 | 20.19 | 52.43 |
| Low | 16 | 42.31 | 6.65 | 28.13 | 56.49 |
| Medium | 16 | 30.64 | 7.24 | 15.20 | 46.078 |
| High | 16 | 29.17 | 6.76 | 14.76 | 43.58 |
| Extra-high | 16 | 16.74 | 4.10 | 8.01 | 25.48 |
| Clear cutting | 16 | 17.50 | 4.12 | 8.72 | 26.28 |
| Total | 96 | 28.78 | 2.65 | 23.51 | 34.05 |
Table 8.
ANOVA results on the impacts of cutting intensity on overall soil properties.
| Sum of Squares | df | Mean Square | F | p-Value | |
|---|---|---|---|---|---|
| 10 years after cutting | |||||
| Between Groups | 10,257.65 | 5 | 2051.53 | 2.880 | 0.019 |
| Within Groups | 64,111.62 | 90 | 712.35 | ||
| Total | 74,369.27 | 95 | |||
| 15 years after cutting | |||||
| Between Groups | 8,247.82 | 5 | 1649.56 | 2.650 | 0.028 |
| Within Groups | 56,014.02 | 90 | 622.38 | ||
| Total | 64,261.84 | 95 | |||
3.3.2. Principal Component Analysis
Aggregate impacts of cutting intensity on overall soil physical and chemical properties were measured with an aggregate impact score, a weighted average calculated using the first and second principal components (F1 and F2). Because the first and second principal components explain over 85% and 90% of total variability for 10 and 15 years after the cutting, respectively (Table 9), the aggregate impact score well reflects the effects of different cutting intensities on overall soil physical and chemical properties.
Table 9.
Eigenvalue and variability explained by principal components.
| Item | 10 Years after Cutting | 15 Years after Cutting | ||
|---|---|---|---|---|
| F1 a | F2 | F1 | F2 | |
| Eigenvalue | 9.36 | 5.19 | 7.84 | 5.87 |
| Variability explained (%) | 58.50 | 32.41 | 48.97 | 36.71 |
| Cumulative variability explained (%) | 58.50 | 90.91 | 48.97 | 85.68 |
a F1 and F2 are the first and second principal components, respectively.
The eigenvector coefficients of soil properties for the first and second principal components are presented in Table 10. Their absolute values reflect the relative importance/contribution of each soil property to the aggregate impact score. Based on the contribution of each soil property to the aggregate impact score of cutting intensity under the first principal component (F1), the top three properties were X15 (total K), X16 (available K), and X14 (available P) 10 years after the cutting, and X14 (available P), X15 (total K), and X16 (available K) 15 years after the cutting, respectively.
Table 10.
Eigenvector coefficients for the first and second principal components.
| Variable | Variable Description | 10 Years after Cutting | 15 Years after Cutting | ||
|---|---|---|---|---|---|
| F1 | F2 | F1 | F2 | ||
| X1 | Soil bulk density | −0.449 | 0.864 | −0.371 | 0.864 |
| X2 | >0.25 mm water-stable aggregates | 0.786 | 0.530 | 0.772 | 0.150 |
| X3 | Damaged structural aggregates | 0.561 | 0.530 | 0.926 | 0.179 |
| X4 | Max water holding capacity | −0.649 | 0.757 | −0.477 | 0.785 |
| X5 | Min water holding capacity | −0.445 | 0.867 | 0.671 | 0.720 |
| X6 | Capillary water holding capacity | −0.824 | 0.555 | −0.830 | 0.015 |
| X7 | Total porosity | −0.721 | 0.642 | −0.294 | 0.942 |
| X8 | Capillary porosity | −0.875 | −0.073 | 0.473 | −0.274 |
| X9 | Non-capillary porosity | −0.301 | 0.870 | −0.556 | 0.814 |
| X10 | Organic matter | 0.878 | 0.427 | 0.428 | 0.822 |
| X11 | Total N | 0.852 | 0.521 | 0.599 | 0.792 |
| X12 | Hydrolysis N | 0.664 | 0.709 | −0.740 | 0.619 |
| X13 | Total P | −0.894 | 0.083 | 0.589 | 0.782 |
| X14 | Available P | 0.951 | 0.254 | 0.994 | 0.033 |
| X15 | Total K | 0.990 | 0.022 | 0.969 | −0.097 |
| X16 | Available K | 0.964 | 0.196 | 0.945 | 0.034 |
Similarly, under the second principal component (F2), the top three properties were X9 (non-capillary porosity), X5 (minimum water holding capacity), and X1 (soil bulk density) 10 years after the cutting, and X7 (total porosity), X1 (soil bulk density), and X10 (organic matter) 15 years after the cutting, respectively (Table 10). Therefore, the first principal component mainly accounted for the impact of cutting intensity on soil chemical properties while the second principal component largely accounted for the impact on soil physical properties.
Table 11 shows the aggregate impacts of cutting intensity on overall soil properties. According to the aggregate impact scores, for both 10 and 15 years after the cutting the largest impact was clear cutting, followed by extra-high, high, medium, and low intensities of selective cutting. In other words, the impact on overall soil properties increased with an increase in cutting intensity.
Table 11.
Aggregate impacts of cutting intensity on overall soil physical and chemical properties.
| Cutting Intensity | Principle Components | Comprehensive Evaluation Score | Rank | |
|---|---|---|---|---|
| F1 | F2 | |||
| 10 years after cutting | ||||
| Low | −4.333 | 1.588 | −2.021 | 5 |
| Medium | −2.035 | −1.383 | −1.639 | 4 |
| High | 1.421 | −2.563 | 0.001 | 3 |
| Extra-high | 1.960 | −0.670 | 0.929 | 2 |
| Clear cutting | 2.990 | 3.023 | 2.729 | 1 |
| 15 years after cutting | ||||
| Low | −3.861 | 2.022 | −1.148 | 5 |
| Medium | −1.406 | −1.072 | −1.082 | 4 |
| High | −0.066 | −2.702 | −1.024 | 3 |
| Extra-high | 2.333 | −1.294 | 0.667 | 2 |
| Clear cutting | 3.001 | 3.046 | 2.588 | 1 |
4. Discussion
Our results showed that cutting intensity had a significant impact on overall soil physical and chemical properties. In general, soil bulk density increases, but soil organic matter, porosity, and water holding capacity decrease as cutting intensity increases, echoing the results reported in the literature [49,50,51,52]. Likewise, an increase in cutting intensity (even a low intensity of selective cutting relative to non-cutting) could cause loss in soil nutrients (N, P, and K), which is parallel to the finding of existing studies [46,51,52,53].
In addition to confirming existing findings, our study shed new light on the aggregate impact of cutting intensity on overall soil properties. Via PCA, we found that the first principal component was exclusively associated with soil nutrients, which explained most variation in the impact of cutting intensity, and that the second principal component was solely linked to soil physical properties. Thus, the greatest concern about high intensity cutting in this forest would be soil nutrient loss (P and K loss in particular), followed by the negative impacts on soil physical properties. Loss in soil nutrients would diminish long-term soil productivity if without nutrient replenishment such as fertilizer application, leading to forest degradation.
Moreover, the recovery of soil properties impacted by timber harvesting is a slow process. It would take longer for overall soil properties to recover as cutting intensity rises. This was not only because a higher intensity of cutting would cause greater damage to soil properties, but also because the recovery rate of soil properties would slow down more quickly or sooner with an increase in cutting intensity. As such, additional time within a cutting period may not be very helpful in restoring soil properties damaged by a high intensity of cutting, and some soil properties may not be fully restored if cutting intensity is too high.
Given the rising demand for timber, complete elimination of timber harvesting from this forest seems unrealistic. With all the above impacts in mind, if timber harvesting from this forest has to continue to some extent, cutting intensity should be maintained at a level not higher than the medium intensity. Moreover, nutrient replenishment via proper application of fertilizers may be viable in assisting forest regeneration or restoration in the region.
Our study focuses on the impact of cutting intensity on soil physical and chemical properties. Future studies can probe the effect of cutting intensity on forest growth and structure instead of soil properties, which will provide direct measurements of impacts on forest productivity, diversity, and resilience. Additionally, coordinated multiple-regional studies can help explore the impact of other forcing such as environmental conditions together with timber harvesting intensity. Finally, studies that target longer-term impacts (for example, multiple cutting periods for selective cutting and multiple rotations for clear cutting) would be invaluable in disclosing the consequences of timber harvesting on the long-term productivity and sustainability of the forest ecosystem.
5. Conclusions
We examined the impact of timber harvesting intensity on soil physical and chemical properties in a mixed coniferous and broadleaf forest (a mixed Chinese fir, Masson’s pine, and broadleaf forest) in the southeastern China 10 and 15 years for the cutting. We considered five treatments—low, medium, high, and extra-high intensities of selective cutting and clear cutting—with non-cutting as the control. We analyzed the impacts of cutting intensity on both individual and overall soil properties. In terms of impacts on individual soil properties, the low and medium intensities of selective cutting did not cause a much greater impact on most soil physical properties than non-cutting while the impact on soil chemical properties augmented with an increase in cutting intensity. In terms of aggregate impacts on overall soil physical and chemical properties, an increase in cutting intensity enlarged the impact.
These findings have important implications for sustainable management of the mixed natural forest in the study region and beyond. First, most soil physical properties damaged by the low and medium intensities of selective cutting in the forest could be restored within 10 or 15 years after the cutting. However, the extra-high cutting intensity and clear cutting would cause stronger damage to soil aggregates, water holding capacity, and porosity, which could not be fully recovered even 15 years after the cutting. Second, even the low cutting intensity would cause a negative impact on soil chemical properties, and the impact would intensify with an increase in cutting intensity. The main impact would be the loss of soil nutrients, P and K in particular. Nutrient loss would become more evident over time as tree growth absorbs nutrients. Hence, timber harvesting even at a low cutting intensity could cause long-term nutrient deficits and forestland degradation in this forest in the region. Third, given the impacts of cutting intensity on both individual and overall soil properties, clear cutting and the high and extra-high intensities of selective cutting in this type of forest in the region should be avoided. These cutting intensities would cause long-term negative impacts on soil physical and chemical properties, adversely affecting the long-term productivity and sustainability of the forest.
Acknowledgments
This study was supported in part by grants from the National Natural Science Foundation of China (30972359 and 31070567) and the University Development Foundation of Fujian Agriculture and Forestry University (113-612014018). We also would like to thank the two anonymous reviewers for their valuable comments and suggestions which helped improve this paper.
Author Contributions
Xin-nian Zhou was the project director, designed the study, and wrote the initial version of the manuscript. Yuan Zhou and Cheng-jun Zhou contributed to field experiment, data collection and analysis, and manuscript writing. Zhi-long Wu, Li-feng Zheng, and Xi-sheng Hu participated in data collection and analysis. Han-xian Chen contributed to manuscript writing and data analysis. Jianbang Gan was responsible for the framing and writing of the manuscript and contributed to data analysis.
Conflicts of Interest
The authors declare no conflict of interest.
References
- Mariani, L.; Chang, S.X.; Kabzems, R. Effects of tree harvesting, forest floor removal, and compaction on soil microbial biomass, microbial respiration, and N availability in a boreal aspen forest in British Columbia. Soil Biol. Biochem. 2006, 38, 1734–1744. [Google Scholar] [CrossRef]
- Zhang, Z.X.; Zhou, X.N.; Chen, Y.F.; Gao, S.; Lin, H.M. Effect of clear-cutting on soil physical and chemical properties in plantation forestlands of different slopes and forest stands. Chin. J. Eco-Agric. 2008, 16, 693–700. [Google Scholar]
- Mazur, M.; Mitchell, C.J.; Eckley, C.S.; Eggert, S.L.; Kolka, R.K.; Sebestyen, S.D.; Swain, E.B. Gaseous mercury fluxes from forest soils in response to forest harvesting intensity: A field manipulation experiment. Sci. Total Environ. 2014, 496, 678–687. [Google Scholar] [CrossRef] [PubMed]
- Achat, D.L.; Deleuze, C.; Landmann, G.; Pousse, N.; Ranger, J.; Augusto, L. Quantifying consequences of removing harvesting residues on forest soils and tree growth: A meta-analysis. For. Ecol. Manag. 2015, 348, 124–141. [Google Scholar] [CrossRef]
- Zaman, M.A.; Osman, K.T.; Haque, S.S. Comparative study of some soil properties in forested and deforested areas in Cox’s Bazar and Rangamati Districts, Bangladesh. J. For. Res. 2010, 21, 319–322. [Google Scholar] [CrossRef]
- Ganeshamurthy, A.N. Soil changes following long-term cultivation of pulses. J. Agric. Sci. 2009, 147, 699–706. [Google Scholar] [CrossRef]
- Liu, M.H.; Dong, X.B.; Guo, H.; Meng, K.H.; Fan, Y.T. Change in soil physical and chemical properties of low-quality forest stands in the Xiaoxing’an mountain after alteration by logging. J. Northeast For. Univ. 2010, 38, 36–38. [Google Scholar]
- Adekiya, A.O.; Ojeniyi, S.O.; Agbede, T.M. Soil physical and chemical properties and cocoyam yield under different tillage systems in a tropical alfisol. Exp. Agric. 2011, 47, 477–488. [Google Scholar] [CrossRef]
- Dong, W.T.; Lu, M.H.; Wei, D.S.; Xu, T.G.; Liu, Z.L. Fuzzy mathematics-based method of comprehensive evaluation of soil fertility and application. Resour. Dev. Market 2011, 27, 511–513. [Google Scholar]
- Liu, M.H. Study on the 8th national forest inventory from multiple perspectives. For. Econ. 2014, 5, 3–15. [Google Scholar]
- Zhang, Y.; Zeng, X.L.; Dong, X.B. Grey clustering evaluation of soil nutrients of a low-quality forest in the Xiaoxing’an mountain at different cutting intensities. J. Northeast For. Univ. 2014, 42, 21–24. [Google Scholar]
- Rab, M.A. Soil physical and hydrological properties following logging and slash burning in the Eucalyptus regnans forest of southeastern Australia. For. Ecol. Manag. 1996, 84, 159–176. [Google Scholar] [CrossRef]
- Aust, W.M.; Fristoe, T.C.; Gellerstedt, P.A.; Giese, L.B.; Miwa, M. Long-term effects of helicopter and ground-based skidding on site properties and stand growth in a tupelo-cypress wetland. For. Ecol. Manag. 2006, 226, 72–79. [Google Scholar] [CrossRef]
- Yang, X.J.; Wang, H.Y.; Liu, L.; Li, X.; Ren, L.N. Evaluation of soil fertility quality under different forest stands in over-logged forest region, northeast China. Eco Environ. Sci. 2012, 21, 1553–1560. [Google Scholar]
- You, H.M.; He, D.J.; Liu, J.S.; Cai, C.T.; You, W.B.; Xiao, S.H. Effect of covering with fallen logs on soil physicochemical property of Tsuga longibracteata forest in Tianbaoyan national nature reserve. J. Plant Resour. Environ. 2013, 22, 18–24. [Google Scholar]
- Crumsey, J.M.; Monie, J.L.; Vogel, C.S.; Nadelhoffer, K.J. Historical patterns of exotic earthworm distributions inform contemporary associations with soil physical and chemical factors across a northern temperate forest. Soil Biol. Biochem. 2014, 68, 503–514. [Google Scholar] [CrossRef]
- Gourley, C.P.; Sale, P.G. Chemical and physical amelioration of subsoils has limited production benefits for perennial pastures in two contrasting soils. Soil Till. Res. 2014, 144, 41–52. [Google Scholar] [CrossRef]
- Qiu, R.H.; Chen, H.; Zhou, L.X. Effects of selective cutting on the forest structure and species diversity of evergreen broad-leaved forest in northern Fujian, southern China. For. Stud. China 2006, 8, 16–20. [Google Scholar] [CrossRef]
- Sharma, C.M.; Baduni, N.P.; Gairola, S.; Ghildiyal, S.K.; Suyal, S. Effects of slope aspects on forest compositions, community structures and soil properties in natural temperate forests of Garhwal Himalaya. J. For. Res. 2010, 21, 331–337. [Google Scholar] [CrossRef]
- Chen, Q.; Zhao, Y.S.; Xin, Y.; Han, X.C.; Xia, X.Y.; Han, C.H. Plant species diversity and correlation with soil factors after vegetation restoration in burned areas of the great Xing’an mountains. Bull. Soil Water Conserv. 2012, 32, 61–65. [Google Scholar]
- Pan, S.L.; Gu, B.; Li, J.X. Soil-property and plant diversity of highway rocky slopes. Acta Ecol. Sin. 2012, 32, 6404–6411. [Google Scholar]
- Yu, X.X.; Qin, Y.S.; Chen, L.H.; Liu, S. The forest ecosystem services and their valuation of Beijing mountain areas. Acta Ecol. Sin. 2002, 22, 783–786. [Google Scholar]
- Zhang, J.; Gan, J. Who will meet China’s demand for imported forest products? World Dev. 2007, 35, 2150–2160. [Google Scholar] [CrossRef]
- Liu, J.G.; Li, S.X.; Ouyang, Z.Y.; Tam, C.; Chen, X.D. Ecological and socioeconomic effects of China’s policies for ecosystem services. Proc. Natl. Acad. Sci. USA 2007, 105, 9477–9482. [Google Scholar] [CrossRef] [PubMed]
- Zhou, X.N.; Qiu, R.H.; Yang, Y.S.; He, Z.M.; Lin, H.M. Effect of different harvesting methods on soil physical and chemical properties. Sci. Silv. Sin. 1998, 34, 18–25. [Google Scholar]
- Qin, Y.H.; Xie, D.T.; Wei, C.F.; Yang, J.H.; Qu, M. Study on responses of soil ecological environment to impacts of tourist activities. J. Soil Water Conserv. 2006, 20, 61–65. [Google Scholar]
- Zheng, L.F.; Zhou, X.N.; Wu, Z.L.; Luo, C.J.; Cai, R.T.; Lin, H.M. Analysis on soil physic-chemical properties of a natural forest 10 years after high intensity cutting. For. Res. 2008, 21, 106–109. [Google Scholar]
- Zhang, W.R. Methods of Soil Location Study in Forestry; Forestry Publishing House: Beijing, China, 1984. [Google Scholar]
- Forestry Industry Standards of China. Determination of Forest Soil Micro-Aggregates (LY/T 1226-1999); Chinese Academy of Forestry Sciences: Beijing, China, 1999. [Google Scholar]
- Forestry Industry Standards of China. Determination of Forest Soil Water-Related Physical Properties (LY/T 1215-1999); Chinese Academy of Forestry Sciences: Beijing, China, 1999. [Google Scholar]
- Forestry Industry Standards of China. Determination of Organic Matter in Forest Soil and Calculation Carbon-nitrogen Ratio (LY/T 1237-1999); Chinese Academy of Forestry Sciences: Beijing, China, 1999. [Google Scholar]
- Forestry Industry Standards of China. Determination of Total Phosphorus in Forest Soil (LY/T 1232-1999); Chinese Academy of Forestry Sciences: Beijing, China, 1999. [Google Scholar]
- Forestry Industry Standards of China. Determination of Available Phosphorus in Forest Soil (LY/T 1233-1999); Chinese Academy of Forestry Sciences: Beijing, China, 1999. [Google Scholar]
- Forestry Industry Standards of China. Determination of Total Nitrogen in Forest Soil (LY/T 1228-1999); Chinese Academy of Forestry Sciences: Beijing, China, 1999. [Google Scholar]
- Forestry Industry Standards of China. Determination of Hydrolysable Nitrogen in Forest Soil (LY/T 1229-1999); Chinese Academy of Forestry Sciences: Beijing, China, 1999. [Google Scholar]
- Forestry Industry Standards of China. Determination of Total Potassium in Forest Soil (LY/T 1234-1999); Chinese Academy of Forestry Sciences: Beijing, China, 1999. [Google Scholar]
- Forestry Industry Standards of China. Determination of Available Potassium in Forest Soil (LY/T 1236-1999); Chinese Academy of Forestry Sciences: Beijing, China, 1999. [Google Scholar]
- Zhou, X.N.; Qiu, R.H. A study on the selective cutting of natural forests in Fujian Province. J. Fujian For. 1992, 19, 56–60. [Google Scholar]
- Melquiades, F.L.; Andreoni, L.S.; Thomaz, E.L. Discrimination of land-use types in a catchment by energy dispersive X-ray fluorescence and principal component analysis. Appl. Radiat. Isot. 2013, 77, 27–31. [Google Scholar] [CrossRef] [PubMed]
- Chen, J.; Zhang, C. Applications of multivariate statistical analysis in the evaluation of soil fertility under different land uses. Acta Agric. Jiangxi 2009, 21, 97–99. [Google Scholar]
- Zhou, X.N.; Cai, R.T.; Wu, Z.L.; Zheng, L.F.; Chen, J.T.; Lin, H.M.; Zhou, C.J. Comprehensive evaluation of a natural secondary forest 10 years after cutting based on a multi-objective decision model. J. Mt. Sci. 2010, 28, 540–544. [Google Scholar]
- Zhou, X.N.; Lai, A.H.; Zhou, C.J.; Wu, Z.L.; Liu, F.W.; Su, C.M. Advances in ecological logging of mountain forest. J. For. Environ. 2015, 35, 185–192. [Google Scholar]
- Gan, J.; Smith, C.T. Integrating biomass and carbon values with soil productivity loss in determining forest residue removals. Biofuels 2010, 1, 539–546. [Google Scholar] [CrossRef]
- Powers, R.F.; Scott, D.A.; Sanchez, F.G.; Voldseth, R.A.; Page-Dumroese, D.; Elioff, J.D.; Stone, D.M. The North American long-term soil productivity experiment: Findings from the first decade of research. For. Ecol. Manag. 2005, 220, 31–50. [Google Scholar] [CrossRef]
- Preston, C.M.; Mead, D.J. Long-term recovery in the soil profile of 15N from Douglas-fir needles decomposing in the forest floor. Can. J. For. Res. 1995, 25, 833–837. [Google Scholar] [CrossRef]
- Liu, W.Y.; Fox, J.D.; Xu, Z.F. Leaf litter decomposition of canopy trees, bamboo and moss in a montane moist evergreen broad-leaved forest on Ailao Mountain, Yunnan, southwest China. Ecol. Res. 2000, 15, 435–447. [Google Scholar] [CrossRef]
- Chen, G.S.; Hu, T.X.; Huang, L.H.; Tang, T.Y.; Tu, L.H.; Luo, S.H. Study on water conservation function of litter and surface soil of different bamboo plantations in rainy areas of West China. J. Soil Water Conserv. 2008, 22, 159–162. [Google Scholar]
- Jiang, P.K.; Qian, X.B.; Yu, S.Q.; Li, S.R.; Jiang, W.R.; Jiang, L.Y. Investigation and analysis on litter and soil under natural secondary forests in Qiandaohu Lake area. J. Zhejiang For. Coll. 1999, 16, 260–264. [Google Scholar]
- Lu, Y.C. Natural Forest Management Theory and Practice; Science Press: Beijing, China, 2006. [Google Scholar]
- Rab, M.A. Recovery of soil physical properties from compaction and soil profile disturbance caused by logging of native forest in Victorian Central Highlands, Australia. For. Ecol. Manag. 2004, 191, 329–340. [Google Scholar] [CrossRef]
- Makineci, E.; Demir, M.; Comez, A.; Yilmaz, E. Effects of timber skidding on chemical characteristics of herbaceous cover, forest floor and topsoil on skidroad in an oak (Quercus petrea L. ) forest. J. Terramechanics 2007, 44, 423–428. [Google Scholar] [CrossRef]
- Jennings, T.N.; Smith, J.E.; Cromack, K., Jr.; Sulzman, E.W.; McKay, D.; Caldwell, B.A.; Beldin, S.I. Impact of postfire logging on soil bacterial and fungal communities and soil biogeochemistry in a mixed-conifer forest in central Oregon. Plant Soil 2012, 350, 393–411. [Google Scholar] [CrossRef]
- Hu, Y.C.; Li, X.J.; Fang, Y.D.; Liu, X.R.; Zhong, W.J. Spatial-temporal variance of reclamation soil physical and chemical character in opencast mine region. J. Coal Sci. Eng. 2009, 15, 399–403. [Google Scholar] [CrossRef]
© 2015 by the authors; licensee MDPI, Basel, Switzerland. This article is an open access article distributed under the terms and conditions of the Creative Commons by Attribution (CC-BY) license (http://creativecommons.org/licenses/by/4.0/).