Article

Community Monitoring of Carbon Stocks for REDD+: Does Accuracy and Cost Change over Time?

by Søren Brofeldt 1,*, Ida Theilade 2, Neil D. Burgess 3,4, Finn Danielsen 5, Michael K. Poulsen 1, Teis Adrian 1, Tran Nguyen Bang 6, Arif Budiman 7, Jan Jensen 2, Arne E. Jensen 1, Yuyun Kurniawan 8, Simon B. L. Lægaard 2, Zhao Mingxu 9, Meine Van Noordwijk 10, Subekti Rahayu 10, Ervan Rutishauser 11, Dietrich Schmidt-Vogt 8,12, Zulfira Warta 7 and Atiek Widayati 10
1
Nordic Agency for Development and Ecology (NORDECO), Skindergade 23, DK-1159 Copenhagen K, Denmark
2
Institute of Food and Resource Economics, Faculty of Science, University of Copenhagen, Rolighedsvej 25, DK-1958 Frederiksberg C, Denmark
3
UNEP-World Conservation Monitoring Centre, 219 Huntington Road, Cambridge, CB3 0DL, UK
4
Center for Macroecology, Evolution and Climate, Natural History Museum of Denmark, Universitetsparken 15, DK-2100, Denmark
5
Nordisk Fond for Miljø og Udvikling, Skindergade 23-III, DK-1159 Copenhagen K, Denmark
6
Department of Environmental Management, Vietnam National University of Agriculture (VNUA), Trau Quy town, Gia Lam district, Hanoi, Vietnam
7
WWF-Indonesia (World Wildlife Foundation Indonesia), Gedung Graha Simatupang Tower 2 Unit C, Jalan LetJen TB Simatupang, Jakarta 12540, Indonesia
8
WWF-Indonesia (World Wildlife Foundation Indonesia), Kutai Barat Program, Jl. Pattimura RT. IX, Busur, Barong Tongkok - Kutai Barat, East Kalimantan, Indonesia
9
Key Laboratory of Biodiversity and Biogeography, Kunming Institute of Botany, Chinese Academy of Sciences, Kunming 650201, Yunnan, China
10
World Agroforestry Centre, ICRAF Southeast Asia Regional Office, Jl. CIFOR, Situ Gede, Sindang Barang, Bogor 16680, Indonesia
11
CarboForExpert (carboforexpert.ch), 1248 Hermance, Switzerland
12
World Agroforestry Centre (ICRAF) East and Central Asia Region, c/o Kunming Institute of Botany, Kunming 650201, China
*
Author to whom correspondence should be addressed.
Forests 2014, 5(8), 1834-1854; https://doi.org/10.3390/f5081834
Submission received: 8 May 2014 / Revised: 14 July 2014 / Accepted: 16 July 2014 / Published: 30 July 2014

Abstract

:
Reducing emissions from deforestation and forest degradation in developing countries, and the role of conservation, sustainable management of forests, and enhancement of forest carbon stocks in developing countries (REDD+) is a potentially powerful international policy mechanism that many tropical countries are working towards implementing. Thus far, limited practical consideration has been paid to local rights to forests and forest resources in REDD+ readiness programs, beyond noting the importance of these issues. Previous studies have shown that community members can reliably and cost-effectively monitor forest biomass. At the same time, this can improve local ownership and forge important links between monitoring activities and local decision-making. Existing studies have, however, been static assessments of biomass at one point in time. REDD+ programs will require repeated surveys of biomass over extended time frames. Here, we examine trends in accuracy and costs of local forest monitoring over time. We analyse repeated measurements by community members and professional foresters of 289 plots over two years in four countries in Southeast Asia. This shows, for the first time, that with repeated measurements community members’ biomass measurements become increasingly accurate and costs decline. These findings provide additional support to available evidence that community members can play a strong role in monitoring forest biomass in the local implementation of REDD+.

1. Introduction

The UN Framework Convention on Climate Change (UNFCCC) introduced reducing emissions from deforestation and forest degradation (REDD) as an international fund- or credit-based mechanism for reducing carbon emissions and protecting forest ecosystems. Since the launch of the idea, REDD and its development into REDD+, has received enormous interest from developing countries as a potential source of international funding for an ailing forestry sector. To date, more than 40 developing countries have developed REDD readiness plans and initiated REDD+ ‘readiness’ activities [1].
The UNFCCC decision FCCC/CP/2010/7/Add.1. [2] at the Convention of Parties meeting 16 (COP16) in Cancún encouraged developing country Parties to contribute to climate mitigation actions in the forest sector, through the REDD+ mechanism [3]. The following activities were proposed for implementation as deemed appropriate by each Party and in accordance with their respective capabilities and national circumstances: (a) Reducing emissions from deforestation; (b) Reducing emissions from forest degradation; (c) Conserving forest carbon stocks; (d) Sustainably managing forests; and (e) Enhancing forest carbon stocks.
Thus far, most countries that have developed REDD+ readiness programs have not undertaken many of the above activities. Instead, our review of 10 REDD+ Readiness Preparation Proposals (R-PPs) shows that countries and their development assistance partners have focused on solving challenges related to quantifying forest cover changes and carbon stocks, and calculating reference emission levels within the “business as usual” scenario, or the changed scenario related to the implementation of activities under REDD+. Very few have paid attention to how REDD+ could be implemented in ways that involve local communities and to ensure their active participation [1,4,5].
Hence, despite the enormous potential of REDD+ for conservation of tropical forest ecosystems and the improvement of livelihoods for forest-dependant people [6], various concerns have been raised regarding possible negative outcomes of REDD+ activities [7,8,9,10,11,12]. One of the specific questions that have arisen in many tropical countries is how the rights of indigenous peoples and local communities over forest lands and resources will be dealt with as REDD+ programs are implemented [13,14,15]. These rights include the sharing of benefits arising from the REDD+ programs, participation in the decision-making related to the programs, and the respect for indigenous and local knowledge on forest resources [16]. Without adequate protection of these rights, there are concerns that indigenous peoples’ and local communities’ livelihoods and access to resources and culturally important areas, will be disrupted in the name of broader efforts to substantially reduce or halt deforestation [16].
Another key debate surrounding the development of REDD+ relates to costs [17,18,19]. Opportunity costs are generally considered to be the largest cost component of REDD+ and have been estimated globally and regionally [20,21]. Although opportunity costs are critical in the assessment of REDD+, the set-up, implementation, and monitoring costs of REDD+ projects may also form a significant portion of the total project costs [18,22,23,24]. Thompson et al. (2010) [19] found that on average about 20% of the total transaction costs were due to monitoring.
One of the main tools which REDD+ may employ to assess compensation and benefits to be distributed to participating communities is the monitoring of carbon stocks and identification of foregone benefits in relation to the five types of REDD+ activities. To date, REDD+ monitoring has focused on remote sensing and generally involves foreign experts and national consultants [18]. However, reliance on outside experts to set up and even run forest carbon monitoring is not only expensive [25], but may also offer an excuse for recentralization of forest governance and the exclusion of local people [13,26].
Where the aim of monitoring is to obtain forest biomass data for management decisions at the local scale, alternative monitoring approaches that involve local people are emerging [27,28,29,30,31]. It has been suggested that such approaches have considerable potential to complement professional monitoring in developing countries because they may be relatively cheap. Furthermore, community based monitoring has been shown to have positive effects on safeguarding local forest rights and forest access and to promote local involvement in decision-making [32,33]. Another benefit of forest carbon measurements by community members is that it may reduce transaction costs of the monitoring so that it is economically viable for poorer communities to become involved in carbon finance projects [34].
Locally based monitoring approaches are susceptible to various sources of bias. Problems include a risk, in the absence of careful documentation, of methods drifting over time, differences in scale, or of results reflecting long-term perceptions more than current trends [30,35]. Quantitative assessments of the accuracy of carbon stock assessments by local communities are scarce [18,36,37]. Available studies have focused on a comparison of static findings—i.e., above ground woody biomass (AGB) at a single point in time. Trends in the accuracy of forest biomass community monitoring over time has not been examined, and temporal trends in costs have been briefly investigated by one case study only [18].
The present study aims to help fill our gap in knowledge on: (i) the development in accuracy of community based monitoring of carbon stocks over consecutive years and costs of community monitoring of above-ground forest biomass over time; and (ii) the start-up costs and trend(s) in costs for community based monitoring of carbon stocks, compared to monitoring carried out by professional foresters. We hypothesized that community members involved with monitoring would learn from experience and hence the accuracy of measurements would increase over time and, simultaneously, that the costs of community monitoring would decrease over time as community monitors became more self-sufficient and would need less training.

2. Methods

2.1. Study Sites and Data Collectors

We collected new data from permanent vegetation plots in nine forest types of Indonesia, China, Laos, and Vietnam. Study sites were opportunistically chosen in the four countries. Among the selection criteria were the usage by local communities of the candidate forest sites and the potential for reduction in forest degradation.
In East Kalimantan, Indonesia, plots were established in Batu Majang Village, Kutai Barat District, in the Province of East Kalimantan, in lowland dipterocarp forest (40–500 m.a.s.l.; 400 ha). On forest margins, a few large trees were harvested by the local community, but most of this forest has remained unmanaged over the last decades [38]. The study site in China was in Manlin village in Xiangming township of Xishuangbanna Autonomous Prefecture, Yunnan Province. It comprises tropical mountain forest at 900–1200 m.a.s.l. In total, 761 ha in two forest types were surveyed; slightly disturbed forest (470 ha) and moderately disturbed forest (291 ha), including overgrown swidden fields and areas with ancient tea trees mixed with natural forest vegetation. In Laos, a site was established in Ban Sakok village, Viengthong District, Hauphan Province. It comprises hilly evergreen monsoon forest at 600–1600 m.a.s.l. In total, 162 ha in two forest types (100 ha and 62 ha) were surveyed; primary closed forest and disturbed open forest surrounded by old and new swidden fields. In Vietnam, the study sites were in Diem and Moi villages in Con Cuong District, Nghe An Province, within lowland evergreen monsoon forest between 160 and 460 m.a.s.l. In total, 314 ha in four forest types (125 ha, 104 ha, 67 ha and 18 ha) were surveyed. The degree of disturbance varied from undisturbed forest to secondary forest, severely degraded forest, and forest regrowth in former swidden fields. The study sites are described in detail in Danielsen et al. (2013a) [37].
Plots were measured independently by both community-members and professional foresters between September 2011 and May 2012 [37] and re-measured by the same teams between January and July 2013 for the present study. Representatives of the local communities helped select community participants for the monitoring based on their interest and experience with forest resources; hence, these community members are probably more skilled than the average villager. All community monitors had attended primary school, and all received 1–2 days training in methods and approaches from intermediate organizations (research organizations and non-governmental organizations (NGOs)) in the first year of measurements and a one day refresher training before second years’ measurements. In addition, the intermediate organizations supervised the community monitors in mapping forest areas and locating plots with GPS devices for 3–5 days in each study site during the first year and for 1–2 days during the second year after refresher training. The professional monitors all had academic degrees in natural sciences, and on average four years of experience in practical forest assessment.
All communities were in rural areas. The community in Kalimantan was connected to other communities only by river and relied mainly on subsistence agriculture, while the sites in China, Laos and Vietnam were connected by road. Villagers in Laos and Vietnam sold part of their agricultural produce at markets, whereas villagers in China were involved in rubber tapping in plantations and were relatively wealthier.
The forest types monitored encompassed a wide range of land tenure and usufruct rights, i.e., communal forest (Indonesia), collective forest (China), State forest (China), and State forest with user rights allocated to villagers (Laos and Vietnam).

2.2. Methods for Measurements of Forest Carbon

To measure forest biomass, we used a simplified version of the radial nested sampling methods described by Verplanke and Zahabu (2009) [39] and Hairah et al. (2011) [40] (for details see Danielsen et al., 2013 [37] Appendix S2). This method was chosen because it was considered important to keep the measuring technique as simple as possible, to reduce the potential bias due to technical error (i.e., incorrect estimation of tree-heights, incorrect demarcation of more complex plot-designs, etc.) [41]. Community members first identified the total forest area to be monitored on printed maps with the assistance of an intermediate organisation (IO). Based on available knowledge of forest history (i.e., previous logging or swidden agriculture), the community members and the staff of the IO then stratified the forest into homogenous areas (hereafter termed “stratum”) that were treated as independent entities in the monitoring.
In each stratum, the community members and IO’s staff randomly selected 15 pilot plots, where biomass stock variability was assessed. Based on this, the total number of sample plots required to estimate the average biomass stock per stratum with an error <20% was computed following Wagner et al. (2010) [42].
Based on this pre-analysis, IO’s staff randomly picked up the appropriate number of permanent sample plots (PSP) on the map. The community members, supervised by one IO staff, and the professional foresters carried out independent forest inventories at each PSP with a maximum time lag of four months. PSP were re-measured by both community members and foresters about 1.5 years after initial measurements. To optimize comparison among both measurements, the same monitoring method and materials were used. As not all community members involved in the first census were available, each team in the 2nd survey included at least two veterans from year 1. Professional foresters were in most case the same, or if not, had similar monitoring experience and education level.
The girths of all trees with girth ≥30 cm (as a proxy for diameter breast height (DBH) ≥ 10 cm) and with girth ≥100 cm (DBH ≥ 30 cm) were measured at 130 cm height from tree base within a radius of 9 m and 15 m from plot centre, respectively. In Vietnam and Laos (year 1), and all countries (year 2), each measured tree was furthermore numbered to allow a tree-to-tree comparison of girth measurement between observers. IOs entered the data into Excel and estimated the total tree AGB using Pearson’s allometric equation [43]. This allometric equation model has been widely used, notably in the context of REDD+, and is recommended by the Intergovernmental Panel on Climate Change (IPCC) guidelines [44] for estimating carbon stocks in tropical forests.
Analysis of the forest monitoring data and their costs was done in MS Excel. We used Student’s t-test on log transformed data for estimating the accuracy of the identified AGB, and Wilcoxon’s signed rank test on non-log transformed data for estimating the accuracy of plot demarcation and measurement of DBH across plots, strata and sites at a significance level of 0.05. We assumed that the forester values were more accurate than those from communities, and thus the foresters’ measurements were used as a benchmark and community monitors results were compared against this.

2.3. Methods for Calculating Costs

Costs of community-based and professionally-executed measurements were calculated using the actual costs incurred for local transport, salaries, and materials during the training, re-fresher training, and fieldwork at each study site in year 2. To eliminate the additional costs incurred for extra staff and transportation for research purposes, the costs have been calculated including one day of refreshment training and a further 2 days of supervision in all sites. To this has been added the costs for community monitoring for all days that community monitoring activities occurred. This is consistent with the methodology used for cost calculation for year 1 as presented in Danielsen et al. (2013) [37] Appendix S3. The only changes from this methodology are, (i) because of new agreements with community monitors, “food for data gatherer” has been included in the “community members salaries”; and (ii) “training and supervision” has been split up into “Transport”, “Foresters salaries” and “Accommodation” as these are the three main components of the work covered by the “Training and supervision” category in Danielsen et al. (2013) [37] Appendix S3. None of these changes impact the compatibility of the two cost calculations, and so comparison of costs across the two years is considered viable.

3. Results

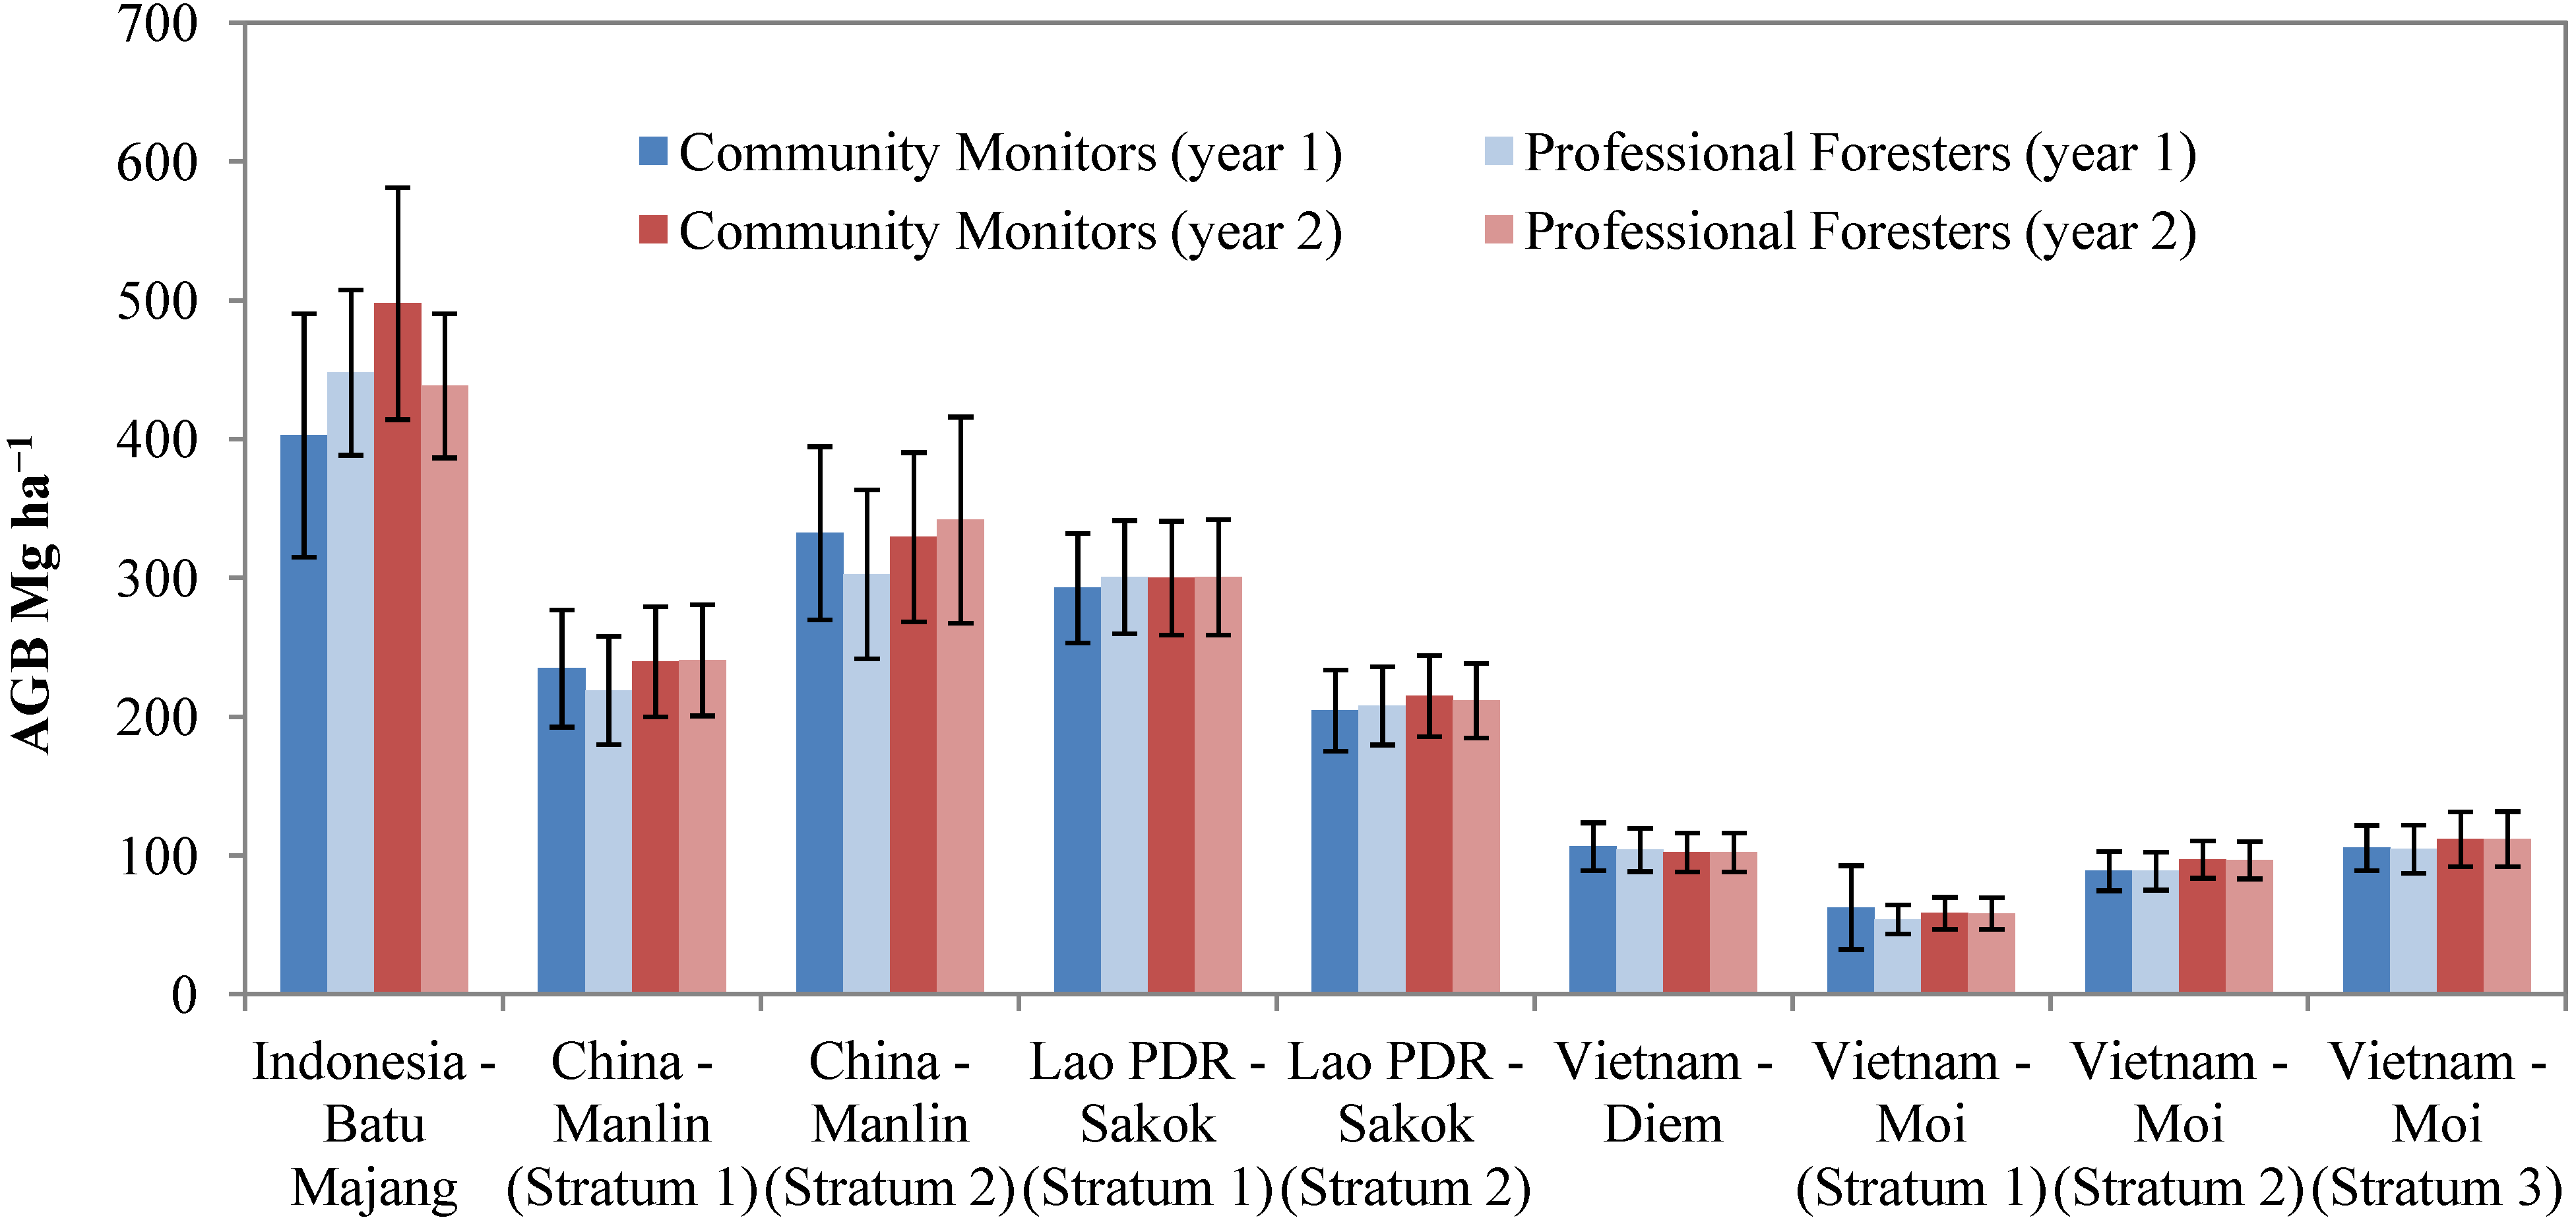
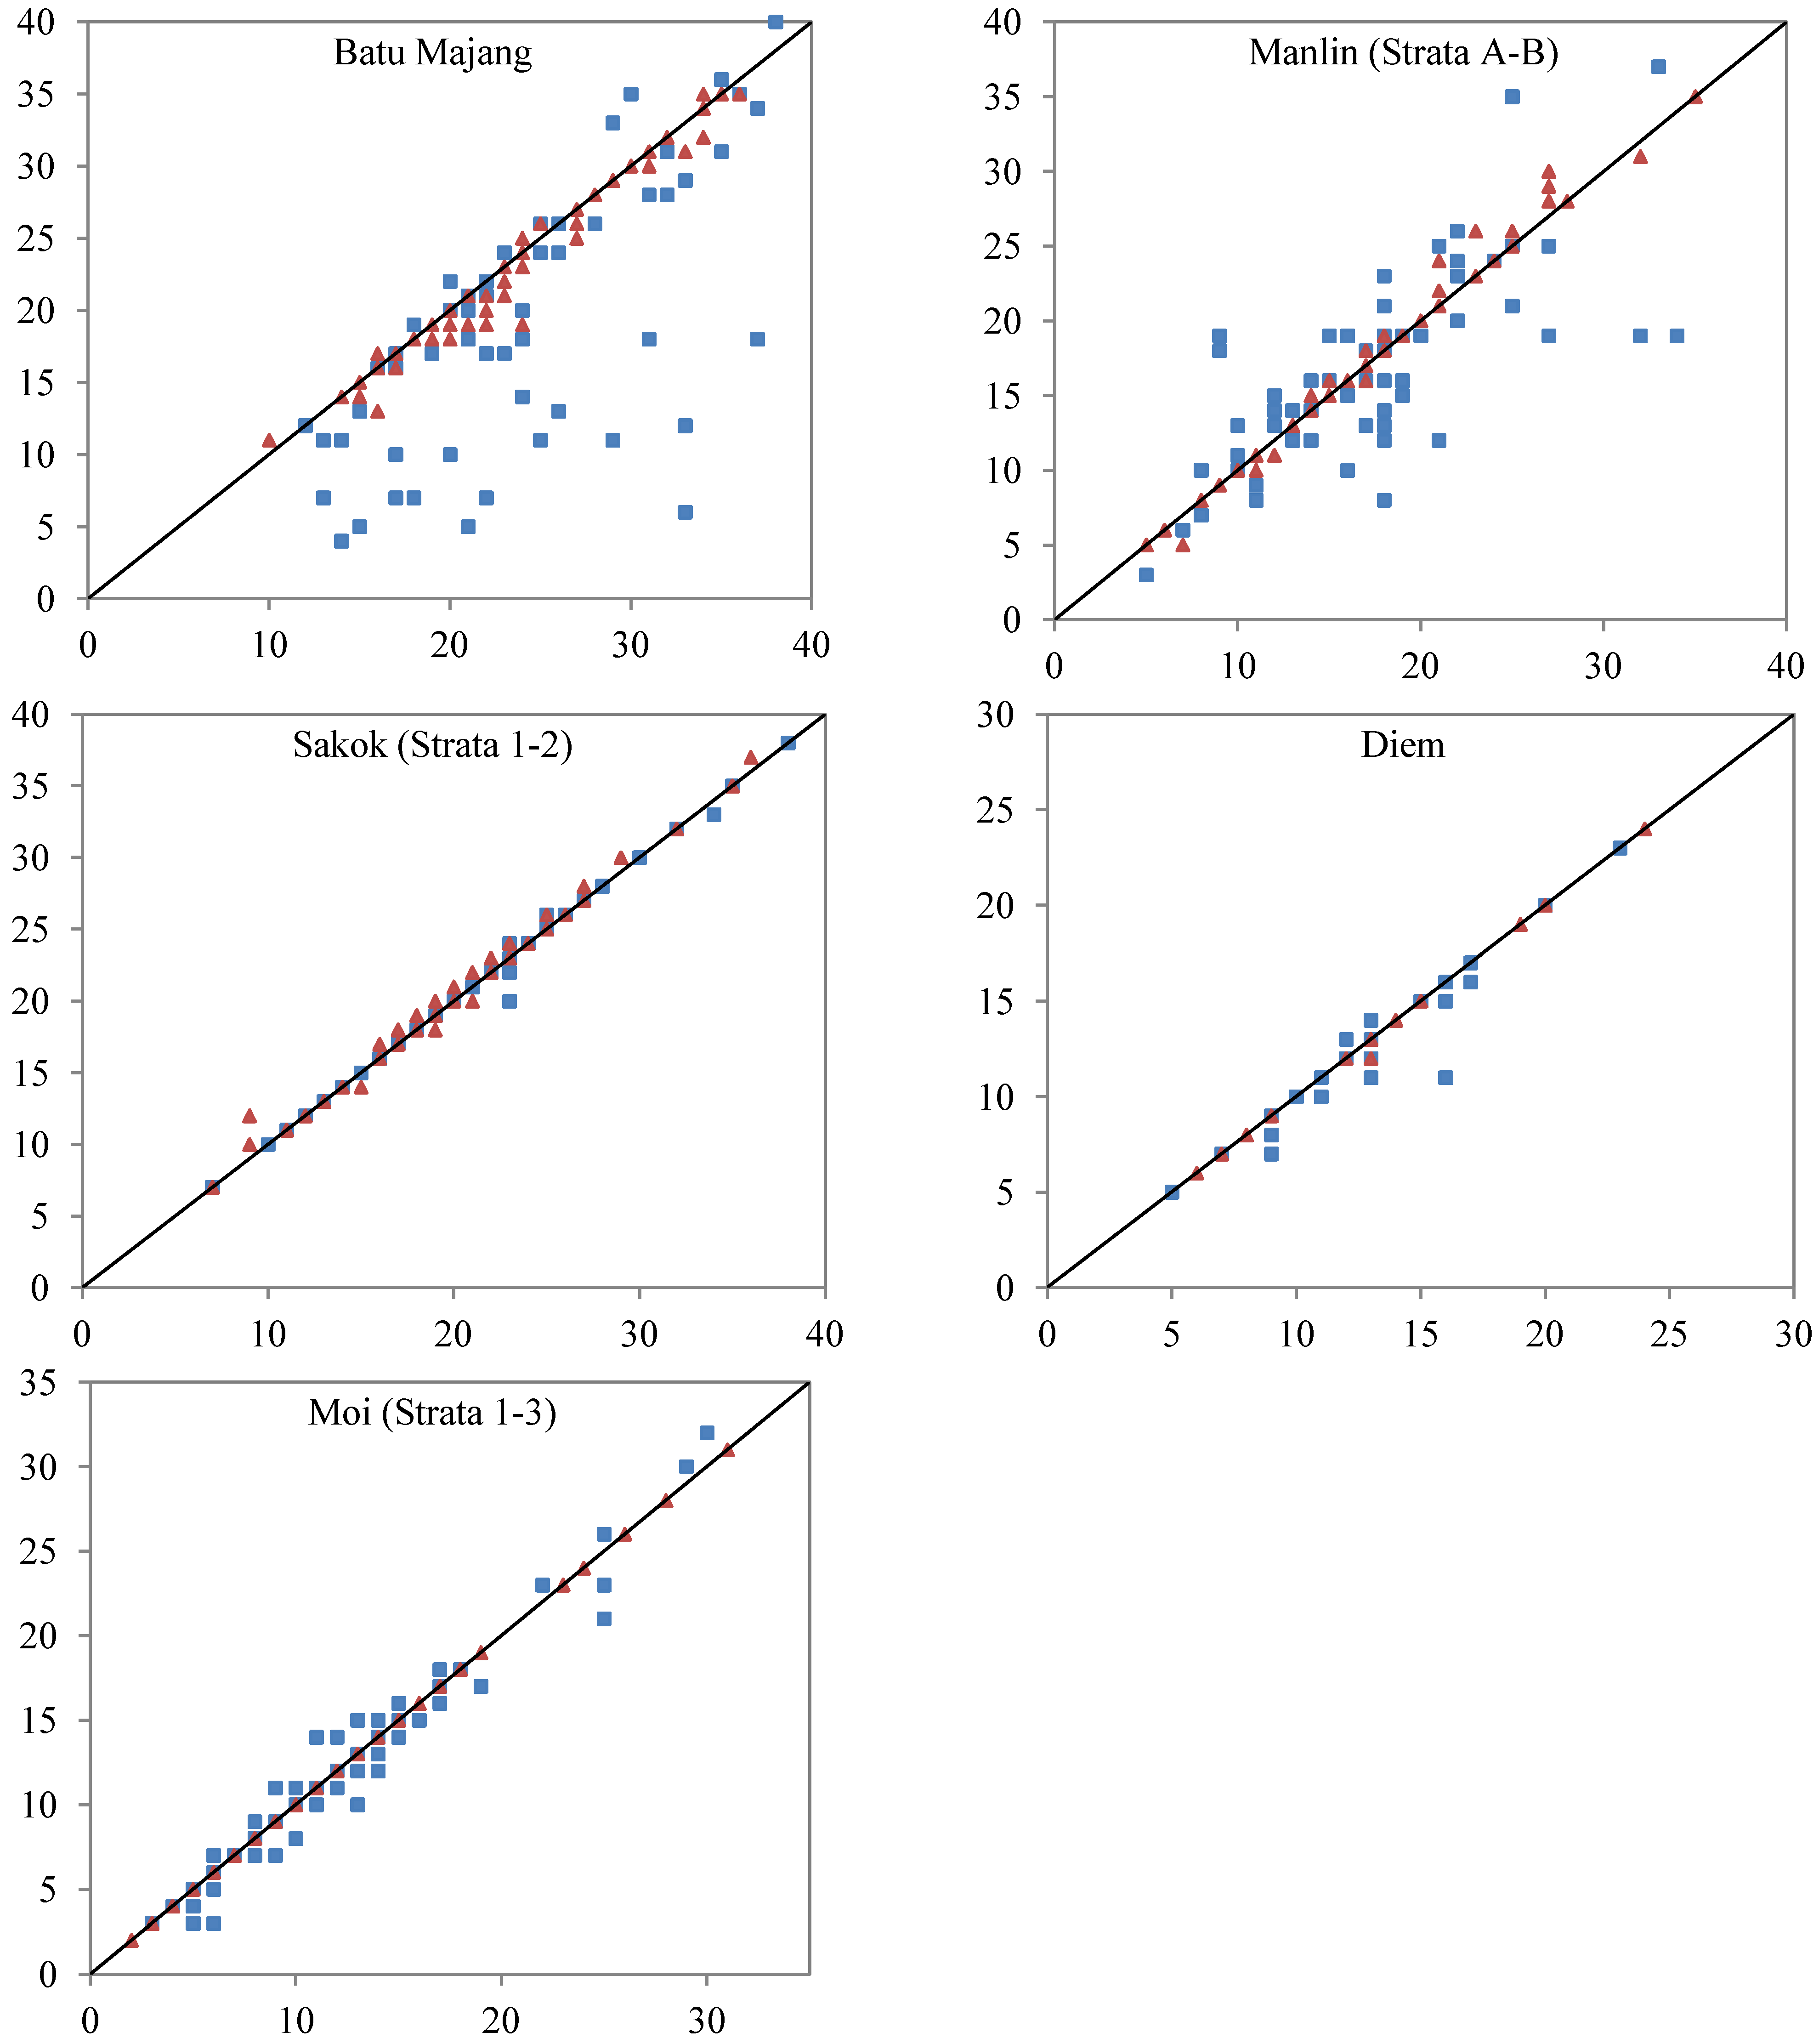
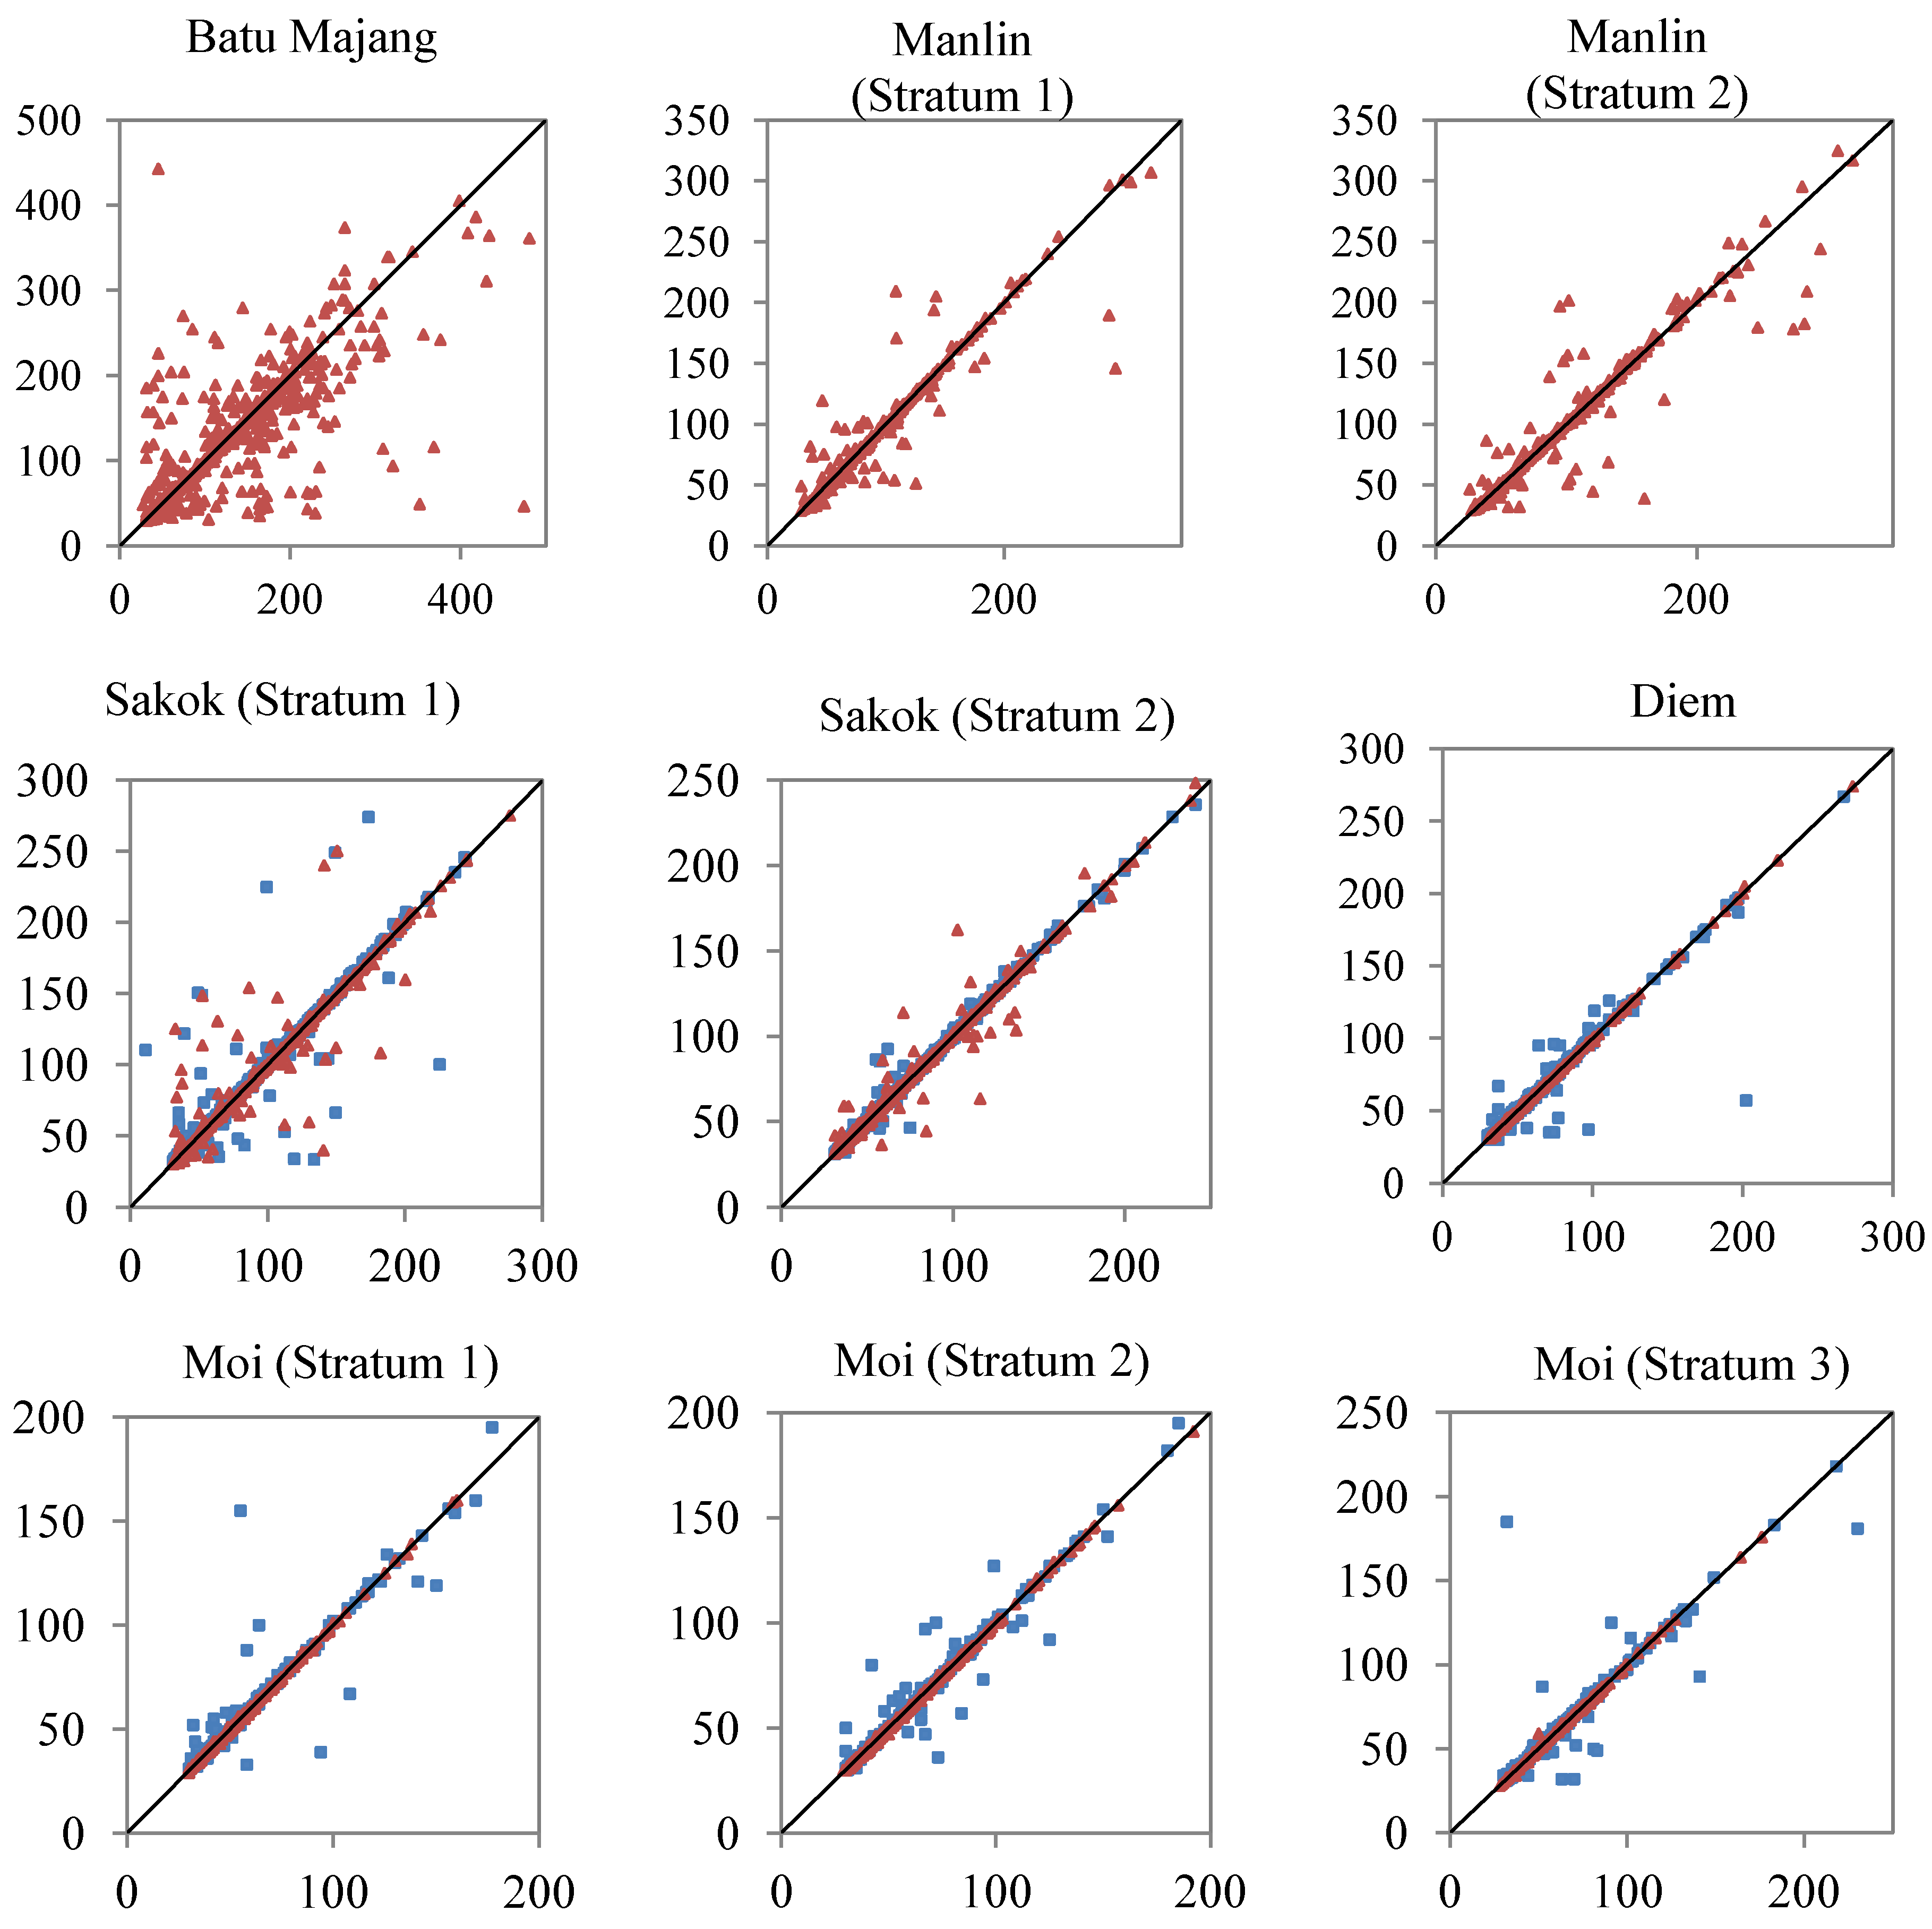
3.1. Does Accuracy of Community Measurement of Biomass Increase with Greater Experience?

We compared community and foresters estimates of biomass. The above ground woody biomass (log-transformed) at all sites was normally distributed (Shapiro-Wilk skewness > −0.8/0.8 and visual confirmation of bell curve). We found that the biomass estimates obtained by community members differed only slightly from the estimates of professional foresters (Figure 1, Table 1). Whereas this difference was statistically significant in one-third of the sites (three sites out of nine) in year 1, the following year, the difference was significant in only one site out of nine (t-test, p < 0.05, Table 1). At this site, the community and forester biomass estimates differed with <3 ton/ha suggesting a small but systematic difference in measurements at this site (Moi stratum 2).
Figure 1. The identified above-ground woody biomass as measured by community monitors (blue) and professional foresters (red) in the two separate monitoring rounds done from September 2011 to May 2012 (Dark) and again from January 2013 to July 2013 (Light); error bars represent 95% confidence limits.
Forests 05 01834 g001
Biomass calculation requires the demarcation of the right trees, i.e., only those trees inside the plot, and the measurements of tree girth. We first compared community and forester inclusion or omission of trees in plots. We found that from year 1 to year 2 the plot demarcation by community monitors improved in five out of six sites (Figure 2, Table 1). For Diem and Moi (Vietnam), community members and professional foresters included exactly the same number of trees in each plot in year 2 (from 11 to 36 trees/plot). For one site (Sakok 1), the correspondence between community members and foresters in terms of trees included per plot decreased from year 1 to year 2. For one site (Batu Majang), there was a significant difference in plot demarcation between community members and foresters both in the first and the second year. To further understand the accuracy of the community monitors estimation of AGB, we then compared community and foresters estimates of tree girth. In two countries, Laos and Vietnam, trees in plots were numbered in the first year allowing for a 1:1 comparison of tree girth measurements in two consecutive years. In these two countries, we found that from the first to the second year the accuracy in girth measurements improved substantially for five of six sites (Figure 3, Table 1). For one site (Moi stratum 2), a higher proportion of the trees were measured accurately (44% to 72%), yet we found a decreased p-value (0.36 to 0.02) at this site from the first to the second year. In the other two countries, Indonesia and China, the individual trees were not marked before the second year. Tree girth measurements can, therefore, only be compared for the second year. Here, we found no statistically significant difference in tree girth measurements between community monitors and foresters (p-value range from 0.22 to 0.72) (Table 1).
Figure 2. Relationship between the number of trees in each plot (n trees/plot) recorded by community members and foresters (with same units on y-axes as on x-axis and y = x lines; n = 289 permanent plots) over the two separate rounds of monitoring year 1 (blue square) and year 2 (red triangle); each point in the graphs represents one census of the number of trees in the plot by foresters (x-axis) and community members (y-axis).
Forests 05 01834 g002
Table 1. Measurements of aboveground biomass by community members and professional foresters in four Southeast Asian countries, with p values for total AGB estimates (matched pair t test), tree DBH measurement (Wilcoxon signed rank test), and plot demarcation (Wilcoxon signed rank test) (n = 289 permanent plots); percentages equals proportion of plots (inclusion and exclusion of trees) and trees (tree girth) where community members’ and professional foresters’ measurements matched perfectly; n.a.—not available or too few degrees of freedom for analysis.
Study SiteNo. of plotsBiomass Mean AGB
in Mg ha−1 Year 1
Biomass Mean AGB
in Mg ha−1 Year 2
Biomass estimates pTree girth (cm) pPlot demarcation (Tree inclusion and exclusion) p
CommunityForesterCommunityForesterYear 1Year 2Year 1Year 2Year 1Year 2
Batu Majang64402.9448.1497.8438.5<0.010.19n.a.0.22 (4%)<0.01 (20%)<0.01 (48%)
Manlin 130234.9219.0239.7240.80.460.96n.a.0.54 (42%)0.16 (0%)0.49 (66%)
Manlin 230332.3302.7329.5341.70.020.69n.a.0.72 (26%)0.25 (23%)>0.9 (73%)
Sakok 132292.8300.6299.9300.50.190.82<0.01 (38%)0.31 (38%)n.a. (97%)0.52 (69%)
Sakok 230204.5208.1215.0211.60.030.74<0.01 (52%)0.27 (63%)n.a. (88%)n.a. (90%)
Diem 130106.5104.1102.3102.40.490.510.59 (47%)0.78 (77%)0.02 (60%)n.a. (100%)
Moi 12762.654.058.558.30.900.470.01 (47%)0.28 (66%)0.38 (56%)n.a. (100%)
Moi 22889.088.997.296.70.910.030.36 (53%)0.02 (72%)0.05 (50%)n.a. (100%)
Moi 318105.5104.7111.9112.00.410.900.051 (54%)0.81 (78%)0.67 (22%)n.a. (100%)
Figure 3. Relationship between the DBH of individual trees recorded by community members and foresters in year 1 (blue square) and year 2 (red triangle) (with same units on y-axis as on x-axis and y = x lines; n = 289 permanent plots); each point in the graphs represents one census of a single tree DBH as measured by foresters (x-axis) and community members (y-axis); Batu Majang and Manlin Strata 1–2 does not have any measurements from the first round of monitoring (blue square) as trees were not marked individually in year 1.
Forests 05 01834 g003

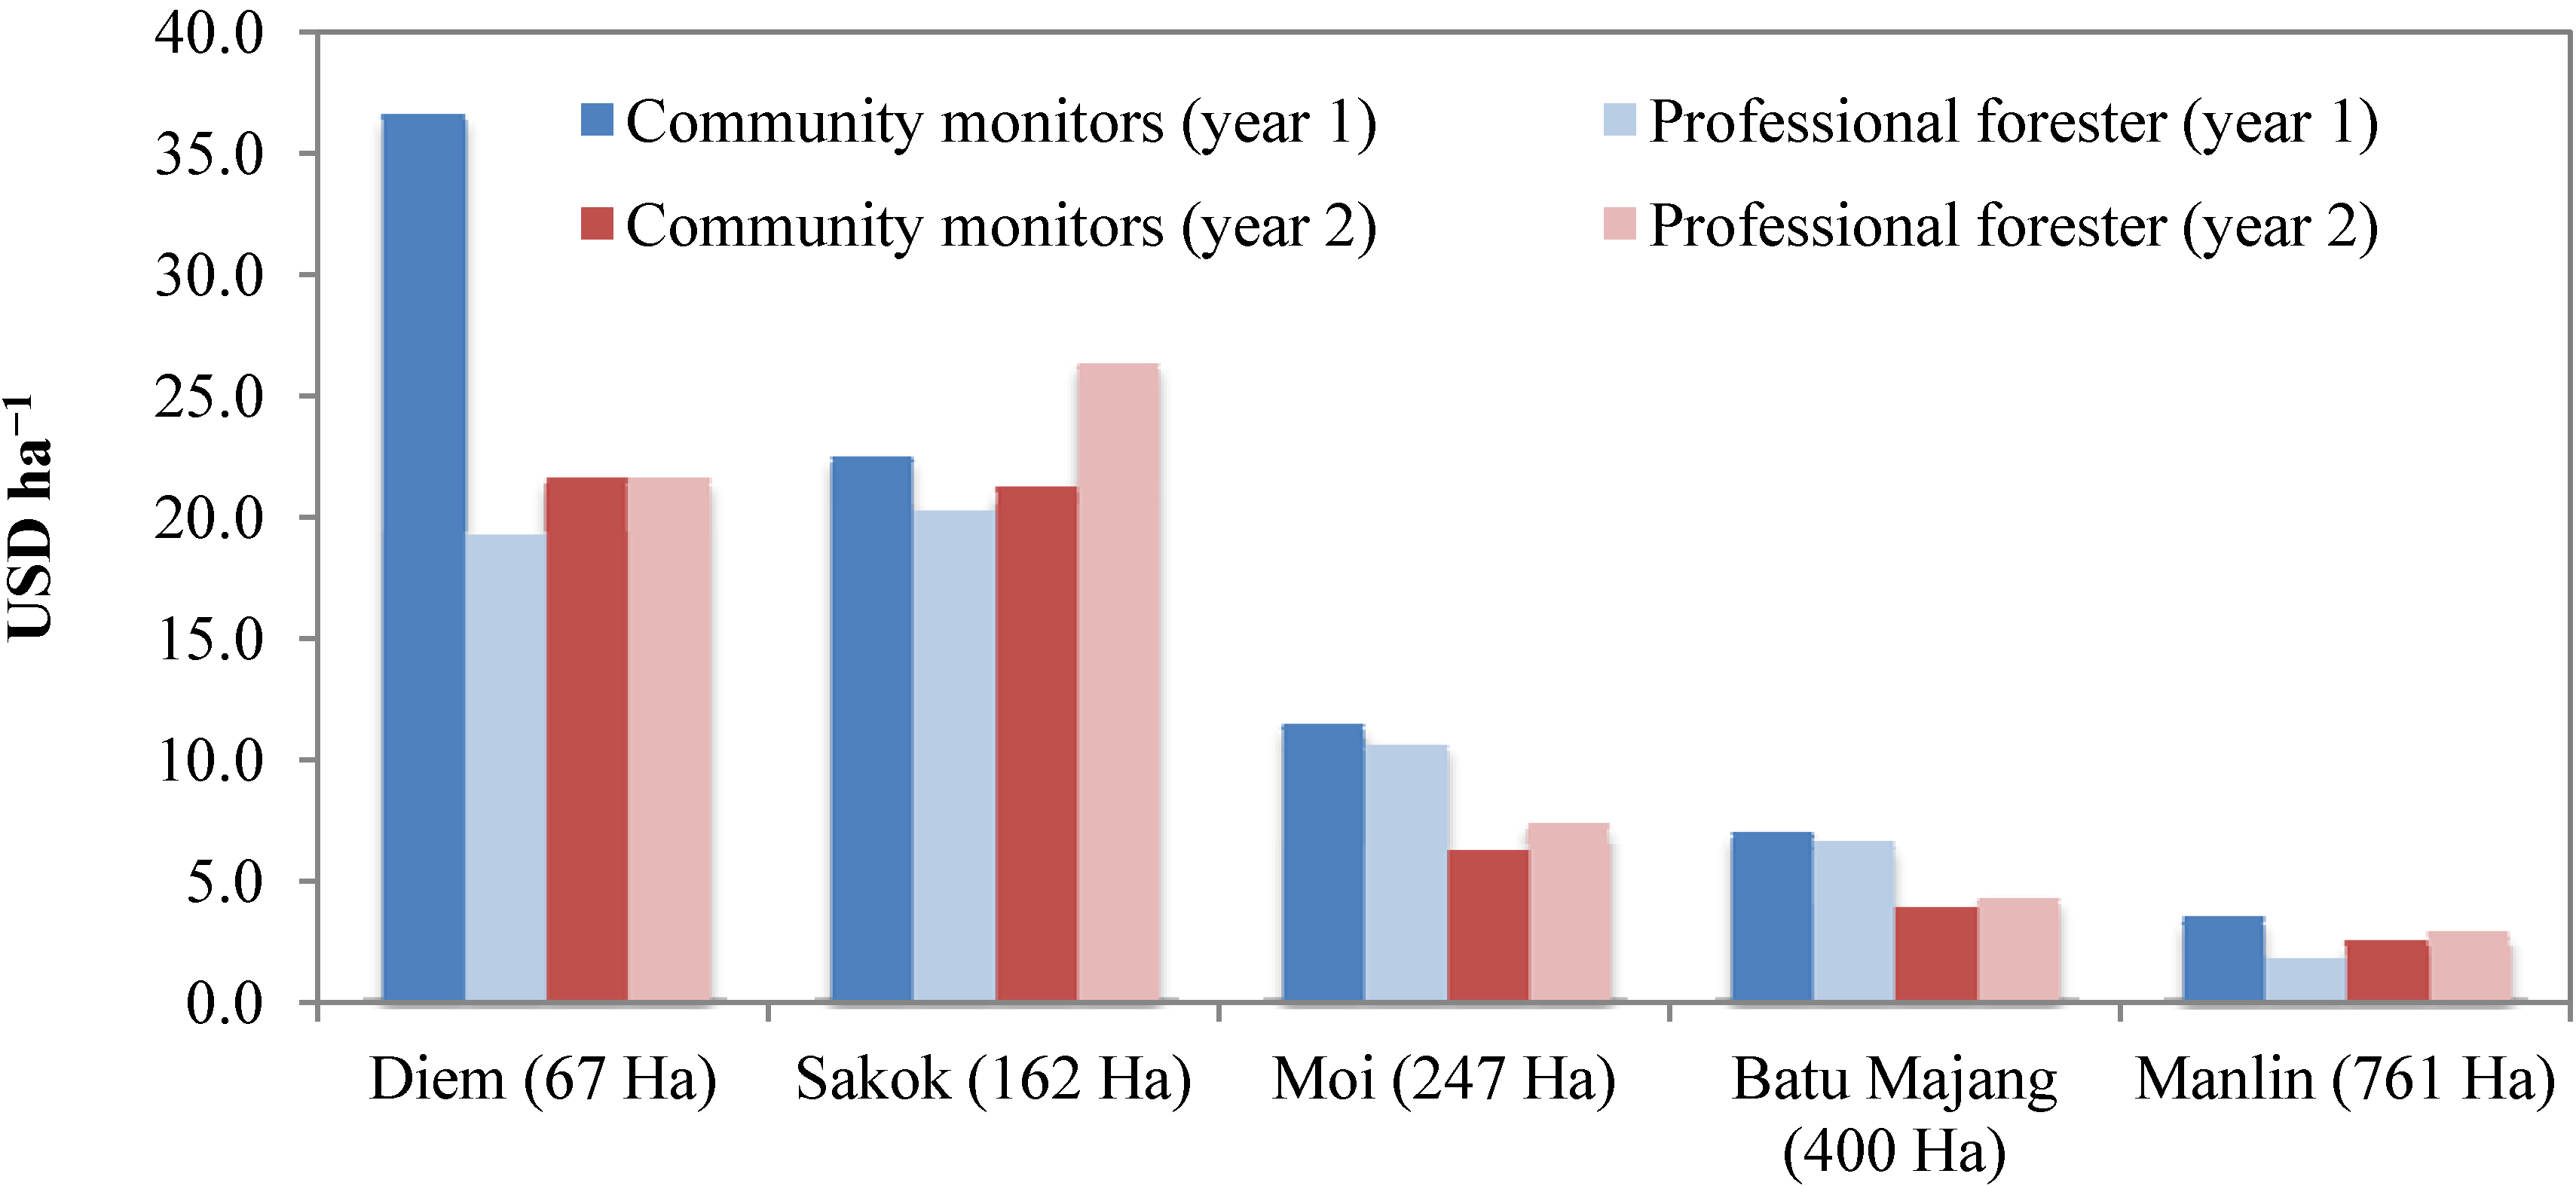
3.2. Do Costs of Community Measurement of Biomass Decrease with Greater Experience?

Our results show that transportation and salaries constitute the major element of the monitoring costs across all countries and sites, both for community members and professional foresters (62% to 90% of total costs). The cost of wages depends both on the time spent monitoring, and the pay-grade of the involved monitors. On the other hand, costs of accommodation and equipment were consistently low (10% to 38% of total costs) (Table 2).
Table 2. Cost of community (white) and professional forester (grey) surveys of biomass (AGB) in the five sites; breakdown of costs is provided for measurements year 2; the cost per plot is provided for year 1 (found in Danielsen et al. (2013) [37]) and year 2; all costs are in US$/year.
Name of siteArea (ha)Transport USD/yearCommunity members salariesForester salariesAccommodationEquipmentTotal cost
(year 2)
Cost/ha (year 1)Cost/ha
(year 2)
Batu Majang400307 (20%)540 (34%)130 (8%)195 (12%)395 (25%)15677.03.9
Batu Majang400307 (18%)462 (27%)416 (24%)144 (8%)395 (23%)17246.64.3
Manlin 1 + 2761533 (27%)870 (45%)336 (17%)144 (8%)56 (3%)19393.52.5
Manlin 1 + 2761533 (25%)528 (24%)720 (33%)336 (15%)56 (3%)21731.72.9
Sakok 1 + 21622550 (74%)360 (10%)490 (14%)0 (0%)52 (2%)345222.621.3
Sakok 1 + 21622550 (60%)140
(3%)
1540 (36%)0 (0%)52 (1%)428220.326.4
Diem671000 (69%)180 (12%)88 (6%)83 (6%)100 (7%)145136.721.6
Diem671000 (69%)90 (6%)175 (12%)83 (6%)100 (7%)144819.321.6
Moi
1–3
2471000 (65%)270 (18%)88 (6%)83 (5%)100 (6%)154111.56.2
Moi
1–3
2471000 (55%)210 (12%)315 (17%)193 (11%)100 (6%)181810.67.4
In the first year, community measurements were more expensive than those carried out by foresters across all sites. However, we found that the cost of community monitoring decreased for all sites from year 1 to year 2 by between 6 and 46 percent. In contrast, the cost of professional foresters decreased in two sites but increased for three sites from year 1 to year 2. Overall, we found that community monitoring was consistently cheaper than professional foresters’ for 4 of 5 sites in year 2 (Table 2 and Figure 4). We also found a marked decrease in the monitoring cost per hectare with increasing site areas for both community and professional foresters (Figure 4).
Figure 4. Cost USD ha−1 for community monitors and trained foresters in the monitoring year 1 and 2.
Forests 05 01834 g004

4. Discussion

4.1. Trends in Accuracy of Biomass Measurements

We find that the correspondence in biomass data between community monitors and trained foresters generally improved from the first to the second round of measurements. Hence, accuracy in community biomass estimates increased in seven of the nine forest strata. For example, the p-value, indicating the level of agreement between the separate measurements for the identified biomass in Manlin stratum 1 and 2, has increased from 0.46 to 0.96 and 0.02 to 0.69, while Sakok Stratum 2 has increased from 0.03 to 0.74 (Table 1). The improved overall correspondence between community monitors’ and professional foresters’ measurements of biomass suggests that community members capacity to monitor biomass increases with repeated measurements and added experience although discrepancies still occur.
The accuracy in community plot demarcation (inclusion and exclusion of trees) increased for 8 of 9 strata in the second year (Table 1). The decreased accuracy in tree inclusion and exclusion by community monitors in Sakok stratum 1 in the second year of measurements is believed to result from trees that were <10 cm DBH in year 1 but which should have been included in year 2 (DBH > 10 cm). The large differences between community and forester measurements in some plots in Manlin and Batu Majang (Figure 2), could have a similar explanation, or be a result of difficult terrain, dense undergrowth leading to trees being overlooked by community monitors (or foresters) and the overall extremely diverse makeup of these forests, evident in the large confidence limits shown in Figure 1. The accuracy in community measurements of tree girth increased for five of the six strata where trees were marked (Table 1).
Inaccuracies that are observed may be the result of a number of introduced biases ranging from different criteria for tree mortality, accidental omission of trees caused by thick undergrowth, steep slopes or fatigue or misunderstood or ineffective instructions. The decreased accuracy of community monitors DBH measurement in Moi stratum 2 and plot demarcation in Sakok stratum 1 in the second year (Table 1) underlines the importance of continued attention to technical errors in refreshment training, and the importance of using simple data collection approaches. A solution for identifying and mitigating this in future REDD+ activities could be to have the plot establishment and baseline monitoring done by a joint team of trained foresters and community monitors, enabling thorough training of community monitors in a supervised environment and a good baseline to compare future community based monitoring against.

4.2. Trends in Cost

The total cost of wages depends on the time and number of people involved, both influenced by the skill of the measurers, the difficulty of the task and the distances and ease of moving around in the terrain. All three of these are dynamic; the skill of the measurers is increasing (at least for community monitors); the difficulty of the task decreases as the plot network is known; and the ease of moving increases as paths are established. However, the difficulty of moving around also partially depends on the weather, which can affect the time required.
In year 2, community monitors were cheaper than trained foresters across four out of five sites. As the skill of community monitors increase, monitoring becomes faster and the requirement for supporting staff decreases, and community monitoring becomes a cost effective alternative to professional forest monitoring. Cost could decrease even further if the trained forester undertaking refresher training could be provided by the district forest office instead of, as in this study, the provincial forest office.
The monitoring cost/ha also decreases as the size of the forest area being monitored increases (Figure 4). This is in agreement with the findings of Skutch et al. (2011) [18], Danielsen et al. (2011) [36], and Böttcher et al. (2009) [45] who found that monitoring costs will depend on desired level of accuracy and size of the project area.

4.3. Relevance to REDD+ Implementation

A number of countries have already selected community forest management as part of their national REDD+ plans as reflected in many national REDD+ readiness strategies [34,46]. Moreover, text in the Subsidiary Body for Scientific and Technological Advice (SBSTA) on REDD+ methodology [2] supports “full and effective” engagement of indigenous peoples and local communities, and the contribution of their knowledge, to monitoring and reporting activities, which is recommended in the GOFC-GOLD sourcebook [47].
Considering concerns about the cost of monitoring for REDD+ [19,22,24], our findings provide support for considering community monitoring in local scale and national carbon monitoring. Our findings also underline both the feasibility of using community monitors to cost-effectively and accurately monitor forest estates, but also the importance of training and attention to limiting the number of potential technical errors when developing manuals and undertaking training.
Within community-based options for implementing REDD+, there is a need to develop community MRV protocols that maximize the involvement of local people, while also meeting REDD+ forest monitoring requirements [17]. Although a number of manuals have been developed, these vary greatly in length and scope (Table 3), reflecting a lack of agreement on methods for community monitoring of carbon. Our experience suggests that manuals should be short and need to focus on (a) effective sampling design; (b) careful establishment of sample plots; and (c) accuracy in measurements. For all these issues simplicity is important, as a simple method is easier to remember and apply consistently. However, our results and experience from the field also suggests that training remains important and re-fresher training and supervision for a day or two helps improve accuracy.
Table 3. Manuals for involvement of local or indigenous communities in the measurement of forest carbon stocks in developing countries ordered according to year of publishing (newest on top); the manual by Poulsen et al. 2013 [48] was used in the present study.
TitleFocus and UsePagesReference
Manual for participatory mapping and monitoring of forest biomass. Field manual.23Poulsen, M. et al., 2013. Theoretical framework for community-based forest monitoring. Impacts of reducing emissions from deforestation and forest degradation and enhancement of forest carbon stocks (I-REDD). FP7-ENV-2010–2014 [48].
A practical manual to plot design, tree measurement, and data collection.
Based on the Rapid Carbon Stock Appraisal (RaCSA) by ICRAF (2009).
Part I of the Manual describes how to do participatory mapping.
Part II describes how to establish participatory monitoring of forest biomass.
Part III covers the annually repeated monitoring.
Participatory Carbon Monitoring: Manual for Local People.Forest level field data collection by local households for REDD+.31Bao Huy B, Nguyen, T.H.; Sharma, B.; Nguyen, V.Q., 2013. Participatory Carbon Monitoring: Manual for Local People. SNV Holland - MBREDD+ [49].
A practical guide to plot design, tree measurement, and data collection.
Data analysis is described in a separate manual for supporting staff.
Understanding Communty-Based REDD+ A manual for indigenous communities.A general guide to participatory approaches relevant for REDD+, including forest level monitoring.207Erni C et al. Understanding Communty-Based REDD+ A manual for indigenous communities. 2011. International Work Group for Indigenous Affairs (IWGIA) and Asia Indigenous Peoples Pact
(AIPP) [50].
Focus on REDD+ community based REDD+ projects on the voluntary carbon market.
Technical Manual for Participatory Carbon Monitoring.National level field data collection by local communities including data analysis and reporting.21UN-REDD Vietnam Program. Technical Manual for Participatory Carbon Monitoring. 2011. United Nations Program for Reduced Emission from Deforestation and
Degradation [51].
Includes guidelines for both local monitoring and supporting staff.
Aimed at national carbon stock monitoring for Vietnam.
Field Guide for Forest Biomass and Carbon Estimation.Forest and landscape level field guide for plot network establishment, data collection and data analysis.53Walker, W.; A. Baccini., M.; Nepstad, N.; Horning, D.;
Knight, E.; Braun, and A. Bausch., 2011. Field Guide for Forest Biomass and Carbon Estimation. Version 1.0. Woods Hole Research Center, Falmouth, Massachusetts, USA [52].
- Not directly aimed at community monitoring, but is very detailed and suitable for training of trainers of community monitors.
Forest Carbon Stock Measurement: Guidelines for measuring carbon stocks in community-managed forests.Forest level field guide to community monitoring of carbon in Community Forests. Aimed at both community monitors and supporting staff.69Subedi, B.; Pandey, S.; Pandey, A.; Rana, E.; Bhattarai, S.; Banskota, T.; Charmakar, S.; Tamrakar, R. 2010. Forest Carbon Stock Measurement: Guidelines for measuring carbon stocks in community-managed forests. Asia Network for Sustainable Agriculture and Bioresources (ANSAB), Kathmandu, Nepal [53].
Specifically aimed to meet IPCC and VCS standards and includes field data collection, data analysis, leakage analysis and quality assurance.
Measuring Carbon Stocks Across Land use Systems: A Manual.Landscape level carbon monitoring by community monitors.129Hairiah, K.; Dewi, S.; Agus, F.; van Noordwijk, M and Rahayu, S. 2009. Measuring Carbon Stocks Across Land Use Systems: A Manual. Bogor, Indonesia. World Agroforestry Centre (ICRAF), SEA Regional Office, Brawijaya University and ICALRRD (Indonesian Center for Agricultural Land Resources Research and Development) [40].
Proposes “Rapid Carbon Stock Assessment” (RaCSA) following 6 steps. Local stakeholder input (land use, mapping, etc.)
Compiling existing information under one zoning system.
Stratificaton, sample design and GT planning
Field measuring, allometric modelling.
Ground truthing, satellite interpretation, change monitoring.
A Field Guide for Assessing and Monitoring Reduced Forest Degradation and Carbon Sequestration by Local Communities.Manual in forest level carbon monitoring including plot network establishment and field data collection.87Verplanke, J.J. and Zahabu, E., Eds. 2009: A Field Guide for Assessing and Monitoring Reduced Forest Degradation and Carbon Sequestration by Local Communities. 93 p. Project team KYOTO: Think Global, Act Local (K:TGAL). Enschede, Holland [39].
Specifically aimed at community monitors. Additional manuals available for supporting staff.
Considering firstly how important monitoring is for all five of the key activities for REDD+ proposed by the UNFCCC (2010) [3], and secondly the concerns raised over safeguarding local and indigenous communities rights over land in the REDD+ implementation process [13,14,15], it seems that the potential for community monitoring to deliver accurate and cost effective monitoring should be considered seriously when planning future national REDD+ activities as well as local REDD+ projects. This study adds to the growing consensus that local people, using participatory methods, can produce data sets that are just as accurate as those that are derived professionally [30,31]. If community monitoring is to have impacts on forest management beyond the local scale, then the community monitoring must be embedded within - or linked to - a national (or international) scheme that feeds the data up to the levels at which governments and international agencies operate [37]. We suggest that the REDD Readiness work by the UN-REDD program and the World Bank’s Forest Carbon Partnership Facility should pay more attention to the development of appropriate community based monitoring systems, and promote policies and build capacity to allow the input of locally generated data.

5. Conclusions

Our study of locally based monitoring activities in four countries in South East Asia shows that the ability of local communities to monitor the AGB in their forest increases with repetition of monitoring activities to an extent where, for eight out of nine sites, the difference between the monitoring done by professional foresters and the community monitors was statistically insignificant. Furthermore, we found that over the two separate rounds of monitoring, community monitoring became cheaper from year 1 to year 2 to the extent that in year 2 community monitoring was more cost effective than professional monitoring for four out of five sites.
In our experience much of this success was based on the focus on simple methods that community monitors were able to apply correctly and consistently with a very limited amount of training and supervision.

Acknowledgments

The work in Southeast Asia was undertaken through the project ‘Impacts of Reducing Emissions from Deforestation and Forest Degradation and Enhancing Carbon Stocks’ (I-REDD+), funded by the European Community’s Seventh Framework Programme (http:www.i-redd.eu). The participation of M.K.P. in Indonesia was funded by the Swiss Development Cooperation through the ASEAN-SWISS Partnership on Social Forestry and Climate Change. This research was also supported by Danida grant DFC 13-08KU. We would like to thank the almost 100 community members and professional foresters in Indonesia, China, Laos and Vietnam for their input into the conceptualisation of, and data gathering for this paper.

Author Contributions

Søren Brofeldt, Ida Theilade, Finn Danielsen, Michael K. Poulsen and Meine van Noordwijk designed research; Søren Brofeldt, Ida Theilade, Michael K. Poulsen, Tran Nguyen Bang, Arif Budiman, Jan Jensen, Arne E. Jensen, Yuyun Kurniawan, Simon B.L. Lægaard, Zhao Mingxu, Subekti Rahayu, Ervan Rutishauser, Dietrich Schmidt-Vogt, Zulfira Warta and Atiek Widayati facilitated or performed field research; Søren Brofeldt, Finn Danielsen, Teis Adrian and Meine van Noordwijk analysed data and commented on data analysis; and Søren Brofeldt, Ida Theilade, Finn Danielsen, Neil D. Burgess, Michael K. Poulsen and Teis Adrian wrote the paper.

Conflicts of Interest

The authors declare no conflict of interest.

References and Notes

  1. UN-REDD. Available online: http://www.un-redd.org (accessed on 2 May 2014).
  2. UNFCCC. UNFCCC/SBSTA/2011/L.25/Add.1. Framework Convention on Climate Change, Subsidiary Body for Scientific and Technological Advice (SBSTA), Methodological guidance for activities relating to reducing emissions from deforestation and forest degradation and the role of conservation, sustainable management of forests and enhancement of forest carbon stocks in developing countries; Draft conclusions proposed by the Chair, Thirty-fifth session Durban, 28 November to 3 December 2011; UNFCCC: Bonn, Germany.
  3. UNFCCC. Cancun Agreement. Decision 1/CP.16. Available online: http://unfccc.int/files/meetings/cop_16/application/pdf/cop16_lca.pdf (accessed on 3 May 2014).
  4. Larson, A.M. Forest tenure reform in the age of climate change: Lessons for REDD+. Global Environ. Chang. 2011, 21, 540–549. [Google Scholar] [CrossRef]
  5. Danielsen, F.; Theilade, I. Potential fit of community-level monitoring of biodiversity and socio-economic outcomes with national REDD+ programmes. Linking Community Monitoring to National REDD+ MRV, Mexico City, Mexico, 12–14 September 2011; Available online: http://redd.ciga.unam.mx/files/inputpapers/input_paper3.pdf (accessed on 6 May 2014).
  6. Angelsen, A. Moving ahead with REDD: Issues, Options and Implication; CIFOR: Bogor, Indonesia, 2008. [Google Scholar]
  7. Funder, M. Reducing Emissions from Deforestation and Degradation: An Overview of Risks and Opportunities for the Poor; General Technical Report 2009:21; Danish Institute for International Studies: Copenhagen, Denmark, 2009. [Google Scholar]
  8. Ghazoul, J.; Butler, R.A.; Mateo-Vega, J.; Oh, J.P. REDD: A reckoning of environment and development implications. Trends Ecol. Evol. 2010, 25, 396–402. [Google Scholar] [CrossRef]
  9. CBD. REDD+ and Biodiversity;Technical Series No. 59; Convention on Biological Diversity: Montreal, Canada, 2011. [Google Scholar]
  10. Epple, C.; Dunning, E.; Dickson, B.; Harvey, C. Making Biodiversity Safeguards for REDD+ Work in Practice-Developing Operational Guidelines and Identifying Capacity Requirements; United Nations Environment Program-World Conservation Monitoring Centre: Cambridge, UK, 2011. [Google Scholar]
  11. Pistorius, T.; Schmitt, C.B.; Benick, D.; Entenmann, S. Greening REDD+ Challenges and Opportunities for Forest Biodiversity Conservation. Policy Paper, Second Revised Edition. University of Freiburg: Freiburg, Germany, 2011. [Google Scholar]
  12. Pokorny, B.; Scholz, I.; de Jong, W. REDD+ for the poor or the poor for REDD+? About the limitations of environmental policies in the Amazon and the potential of achieving environmental goals through pro-poor policies. Ecol. Soc. 2013, 18, p. 3. Available online: http://dx.doi.org/10.5751/ES-05458-180203 (accessed on 3 May 2014).
  13. Phelps, J.; Webb, E.L.; Agrawal, A. Does REDD+ Threaten to Recentralize Forest Governance? Science 2010, 328, 312–313. [Google Scholar] [CrossRef]
  14. Sikor, T.; Stahl, J.; Enters, T.; Ribot, J.C.; Singh, N. REDD-plus, forest people’s rights and nested climate governance. Global Environ. Chang. 2010, 20, 424–425. [Google Scholar]
  15. IIIFPCC. International Indigenous Peoples Forum on Climate Change (IIFPCC) Statements at the 38th Sessions of the Subsidiary Bodies to the UNFCCC. FPCC: Bonn, Germany, 2013. Available online: http://www.forestpeoples.org/topics/redd-and-related-initiatives/news/2013/06/international-indigenous-peoples-forum-climate-chan (accessed on 2 May 2014).
  16. Lyster, R. REDD+, transparency, participation and resource rights: The role of law Environmental. Sci. Policy 2011, 14, 118–126. [Google Scholar] [CrossRef]
  17. Fry, B.P. Community forest monitoring in REDD+: The ‘M’ in MRV? Environ. Sci. Policy 2011, 14, 181–187. [Google Scholar] [CrossRef]
  18. Skutsch, M.; Zahabu, E.; Karky, B.; Danielsen, F. The costs and reliability of community forestry monitoring. Skutsch, M., Ed.; Community forest monitoring for the carbon market: Earthscan, London, UK, 2011; pp. 73–81. [Google Scholar]
  19. Thompson, O.R.R.; Paavola, J.; Healey, J.R.; Jones, J.P.G.; Baker, T.R.; Torres, J. Reducing emissions from deforestation and forest degradation (REDD+): Transaction costs of six Peruvian projects. Ecol. Soc. 2010, 18, p. 17. Available online: http://dx.doi.org/10.575/ES-05239-180117. (accessed on April 6 2014).
  20. Kinderman, G.; Obersteiner, M; Sohngen, B.; Sathaye, J.; Andrasko, K.; Rametsteiner, E.; Schlamadinger, B.; Wunder, S.; Beach, R. Global cost estimates of reducing carbon emissions through avoided deforestation. In Proceedings of the National Academy of Sciences of the United States of America, Stanford, CA, USA, 20 May 2008; pp. 10302–10307.
  21. Fisher, B.; Lewis, S.L.; Burgess, N.D.; Malimbwi, R.E.; Munishi, P.K.; Swetnam, R.D.; Turner, R.K.; Willcock, S.; Balmford, A. Implementation and opportunity costs of reducing deforestation and forest degradation in Tanzania. Nat. Clim. Chang. 2011, 1, 161–164. [Google Scholar] [CrossRef]
  22. Sommerville, M.M.; Jones, J.P.G.; Milner-Gulland, E.J. A revised conceptual framework for payments for environmental services. Ecol. Soc. 2009, 14, p. 34. Available online: http://www.ecologyandsociety.org/vol14/iss2/art34/ (accessed on 25 April 2014).
  23. Sommerville, M.M.; Milner-Gulland, E.J.; Jones, J.P.G. The challenge of monitoring biodiversity in payment for environmental service interventions. Biol. Conserv. 2011, 144, 2832–2841. [Google Scholar] [CrossRef]
  24. Baker, T.R.; Jones, J.P.G.; Rendón Thompson, O.R.; Román Cuesta, R.M.; Del Castillo, D.; Chan Aguilar, I.; Torres, J.; Healey, J.R. How can ecologists help realise the potential payments for carbon in tropical forest countries? J. Appl. Ecol. 2010, 47, 1159–1165. [Google Scholar] [CrossRef]
  25. Balmford, A.; Gaston, K.J.; Blythe, S.; James, A.; Kapos, V. Global variation in terrestrial conservation costs, conservation benefits, and unmet conservation needs. In Proceedings of the National Academy of Sciences of the United States of America, Oxford, UK, 20 September 2002; PNAS: Oxford, UK; pp. 1046–1050.
  26. Sandbrook, C.; Nelson, F.; Adams, W.M.; Agrawal, A. Carbon, forests and the REDD paradox. Oryx 2010, 44, 330–334. [Google Scholar] [CrossRef]
  27. Sheil, D.; Lawrence, A. Tropical biologists, local people and conservation: New opportunities for collaboration. Trends Ecol. Evolut. 2004, 19, 634–638. [Google Scholar] [CrossRef]
  28. Müeller, J.G.; Assanou, I.H.B.; Guimbo, I.G.; Almedom, A.M. Evaluating Rapid Participatory Rural Appraisal as an Assessment of Ethnoecological Knowledge and Local Biodiversity Patterns. Conserv. Biol. 2009, 24, 140–150. [Google Scholar]
  29. Danielsen, F.; Pirhofer-Walzl, K.; Adrian, T.; Kapijimpanga, D.; Burgess, N.D.; Jensen, P.M.; Bonney, R.; Funder, M.; Landa, A.; Levermann, N.; Madsen, J. Linking public participation in scientific research to the indicators and needs of international environmental agreements. Conserv. Lett. 7, 12–24.
  30. Danielsen, F.; Jensen, P.M.; Burgess, N.D.; Altamirano, R.; Alviola, P.A.; Andrianandrasana, H.; Brashares, J.S.; Burton, A.C.; Coronado, I.; Corpuz, N.; et al. A multi-country assessment of tropical resource monitoring by local communities. BioScience 64, 236–251.
  31. Danielsen, F.; Jensen, P.M.; Burgess, N.D.; Coronado, I.; Holt, S.; Poulsen, M.K.; Rueda, R.M.; Skielboe, T.; Enghoff, M.; Hemmingsen, L.H.; Sørensen, M.; Pirhofer-Walzl, K. Testing focus groups as a tool for connecting indigenous and local knowledge on abundance of natural resources with science-based land management systems. Conserv. Lett. 2014b. [Google Scholar] [CrossRef]
  32. Danielsen, F.; Burgess, N.D.; Jensen, P.M.; Pirhofer-Walzl, K. Environmental monitoring: The scale and speed of implementation varies according to the degree of peoples involvement. J. Appl. Ecol. 2010, 47, 1166–1168. [Google Scholar] [CrossRef]
  33. Funder, M.; Danielsen, F.; Ngaga, Y.; Nielsen, M.R.; Poulsen, M.K. Reshaping conservation: The social dynamics of participatory monitoring in Tanzania’s community-managed forests. Conserv. Soc. 2013, 11, 218–232. [Google Scholar] [CrossRef]
  34. Larrazábal, A.; McCall, M.K.; Mwampamba, T.H.; Skutsch, M. The role of community carbon monitoring for REDD+: A review of experiences. Curr. Opin. Enviro. Sustain. 2012, 4, 707–716. [Google Scholar] [CrossRef]
  35. Byg, A.; Theilade, I.; Nielsen, M.R.; Lund, J.F. Local ecological knowledge and its relevance for management and research. For. Lands. Dev. Briefs. Policy 2012, 16. [Google Scholar]
  36. Danielsen, F.; Skutsch, M.D.; Burgess, N.D.; Jensen, P.M.; Andrianandrasana, H.; Karky, B.; Lewis, R.; Lovett, J.C.; Massao, J.; Ngaga, Y.; et al. At the heart of REDD: A role for local people in monitoring forests? Conserv. Lett. 2011, 4, 158–167. [Google Scholar] [CrossRef]
  37. Danielsen, F.; Adrian, T.; Brofeldt, S.; van Noordwijk, M.; Poulsen, M.K.; Rahayu, S.; Rutishauser, E.; Theilade, I.; Widayati, A.; An, N.T.; et al. Community monitoring for REDD+: International promises and field realities. Ecol. Soc. 2013a, 18, p. 41. Available online: http://dx.doi.org/10.5751/ES-05464-180341 (accessed on April 25 2014).
  38. Rutishauser, E.; Noor, F.; Laumonier, Y.; Halperin, J.; Rufi’ie; Hergoualc’h, K.; Verchot, L. Generic allometric models including height best estimate forest biomass and carbon stocks in Indonesia. For. Ecol. Manag. 2013, 307, 219–225. [Google Scholar] [CrossRef]
  39. Verplanke, J.; Zahabu, E. A Field Guide for Assessing and Monitoring Reduced Forest Degradation and Carbon Sequestration by Local Communities; KTGAL Project: Enschede, Nederlands, 2009. [Google Scholar]
  40. Hairiah, K.; Dewi, S.; Agus, F.; Velarde, S.J.; Ekadinata, A.; Rahayu, S.; van Noordwijk, M. Measuring Carbon Stocks across Land Use Systems: A Manual; World Agroforestry Centre-ICRAF, SEA Regional Office: Bogor, Indonesia, 2011. [Google Scholar]
  41. Brofeldt, S.; Keam, H.; Ken, P. Inventory in Community Forestry in Cambodia, Reviewing MAFF Prakas 219. In Emerging Trends, Challenges and Innovations in Community Based Natural Resource Management (CBNRM) in Cambodia-Volume II 2009; The CBNRM Leraning Institute: Phnom Penh, Cambodia, 2009. [Google Scholar]
  42. Wagner, F.; Rutishauser, E.; Blanc, L.; Herault, B. Effects of Plot Size and Census Interval on Descriptors of Forest Structure and Dynamics. Biotropica 2010, 42, 664–671. [Google Scholar] [CrossRef]
  43. Pearson, T.; Walker, S.; Brown, S. Sourcebook for Land Use, Land-Use Change and Forestry Projects; BioCarbon Fund & Winrock International: Washington, DC, USA; p. 2005.
  44. Intergovernmental Panel on Climate Change (IPCC). Guidelines for National Greenhouse Gas Inventories, vol. 4; Eggleston, H.S., Buendia, L., Miwa, K., Ngara, T., Tanabe, K., Eds.; Institute for Global Environmental Strategies (IGES): Hayama, Japan, 2006. [Google Scholar]
  45. Böttcher, H.; Eisbrenner, K.; Fritz, S.; Kinderman, G.; Kraxner, F.; McCallum, I.; Obersteiner, M. An assessment of monitoring requirements and costs of ‘Reduced Emissions from Deforestation and Degradation’. Carbon Balance Manag. 2009, 4, p. 7. Available online: http://dx.doi.org/10.1186/1-750-0680-4-7 (accessed on 3 May 2014).
  46. Burgess, N.D.; Bahane, B.; Clairs, T.; Danielsen, F.; Dalsgaard, S.; Funder, M.; Hagelberg, N.; Haule, P.H.; Kabalimu, K.; Kilahama, F.; et al. Getting ready for REDD+ in Tanzania: A case study of progress and challenges. Oryx 2010, 44, 339–351. [Google Scholar] [CrossRef]
  47. GOFC-GOLD. A Sourcebook of Methods and Procedures for Monitoring and Reporting Anthropogenic Greenhouse Gas Emissions and Removals Caused by Deforestation, Gains and Losses of Carbon Stocks in Forests Remaining Forests, and Forestation; GOFC-GOLD Report version COP 16-1: Alberta, Canada, 2010. [Google Scholar]
  48. Poulsen, M.K.; Danielsen, F.; An, N.T.; Brofeldt, S.; Budiman, A.; Burgess, N.D.; Caizhen, L.; Chang, F.R.; Jensen, A.E.; Kurniawan, Y.; et al. Theoretical Framework for Community-Based Forest Monitoring. Impacts of Reducing Emissions from Deforestation and Forest Degradation and Enhancement of Forest Carbon Stocks (I-REDD)FP7-ENV-2010-2014; Deliverable 4.1, 2nd ed.; Nordic Agency for Development and Ecology: Copenhagen, Denmark, Unpublished work; 2013. [Google Scholar]
  49. Bao, H.; Nguyen, T.T.H.; Sharma, B.D.; Nguyen, V.Q. Participatory Carbon Monitoring: Manual for Local People; SNV-The Netherlands Development Organisation: Ho Chi Minh City, Vietnam, 2013. [Google Scholar]
  50. Erni, C.; Guia-Padilla, M.T.; Villarante, P.; Rice, D.; Sukwong, S. Understanding Communty-Based REDD+ A Manual for Indigenous Communities; International Work Group for Indigenous Affairs (IWGIA) & Asia Indigenous Peoples Pact (AIPP): Chiang Mai, Thailand, 2011. [Google Scholar]
  51. UN-REDD+ Vietnam Program. Technical Manual for Participatory Carbon Monitoring; United Nations Programme for Reduced Emission from Deforestation and Degradation: Ha Noi, Vietnam, 2011. [Google Scholar]
  52. Walker, W.; Baccini, A.; Nepstad, M.; Horning, N.; Knight, D.; Braun, E.; Bausch, A. Field Guide for Forest Biomass and Carbon Estimation, Version 1.0; Woods Hole Research Centre: Falmouth, MA, USA, 2011. [Google Scholar]
  53. Subedi, B.; Pandey, S.; Pandey, A.; Rana, E.; Bhattarai, S.; Banskota, T.; Charmakar, S.; Tamrakar, R. Forest Carbon Stock Measurement:Guidelines for Measuring Carbon Stocks in Community-Managed Forests; Asia Network for Sustainable Agriculture and Bioresources (ANSAB): Kathmandu, Nepal, 2010. [Google Scholar]

