Article

Factors Influencing the Choice of Management Strategy among Small-Scale Private Forest Owners in Sweden

Department of Forest Resource Management, Swedish University of Agricultural Sciences, Skogsmarksgränd, 90183 Umeå, Sweden
*
Author to whom correspondence should be addressed.
Forests 2014, 5(7), 1695-1716; https://doi.org/10.3390/f5071695
Submission received: 13 May 2014 / Revised: 18 June 2014 / Accepted: 7 July 2014 / Published: 15 July 2014

Abstract

:
Half of the productive forest area in Sweden is owned by small-scale private forest owners. However, there is a lack of comprehensive information that would allow categorizing small-scale private forest owners according to their management strategy. In this study, we surveyed small-scale private forest owners in Sweden to determine the proportions who applied various management strategies. We analyzed the results using chi-square tests to identify the most relevant factors affecting the management strategy choices of individual forest owners. We found that “soft” factors, such as the importance of income from the forest, membership in a forest owners’ association, certification and an interest in and knowledge of forestry issues, had a stronger impact on the choice of management strategy than most “hard” factors related to the owner or the property, such as gender and distance between the owner’s residence and the property. However, property size was the most important factor and was associated with the importance of income derived from the forest and several other soft factors.

1. Introduction

Most small-scale private forest owners are not exclusively driven by profit, but instead, have diverse objectives for their forests, including recreation, monetary gain, potential as a residential location, family legacy and nature protection [1,2,3]. In Sweden, half of the productive forest area is owned by small-scale, non-industrial, private forest owners. Following changes to the Forestry Act in 1994, management decisions are largely the responsibility of the forest owner [3,4]. The forest management choices of private forest owners can have a decisive impact on forest composition and structure and, thus, on many ecosystem functions and services, such as wood supply, carbon storage, recreational values and biodiversity. Therefore, understanding forest owner behavior is vitally important for policy makers and forest planners. Moreover, private forest ownership is changing, as fewer forest owners are farmers, a greater proportion is female and more are living a long distance from their property. Thus, more owners are becoming less financially dependent on their forests and are increasingly separated from their land [3,5,6]. This will probably influence how they choose to manage their forest. Nordlund and Westin [7] found differences in forest values and attitudes towards forest management between resident and non-resident owners and between male and female owners in Sweden. The authors conclude that an increase in the share of female forest owners could lead to a change in forest management.
The objectives, attitudes and decision-making styles of private small-scale forest owners have been investigated in Europe and elsewhere over the last 25 years, leading to the development of many different forest owner typologies [3,8,9,10,11,12,13,14,15]. These studies focused on the objectives and values of private owners, but rarely on actual management practices [16,17]. Since the relationship between objectives and harvesting behavior is not straightforward [11], it is difficult to determine the silvicultural strategies employed simply based on forest owners’ objectives.
An alternative to relating the harvesting behavior of non-industrial private forests owners to their ownership objectives is to link management activity levels to forest holding size and different categories of owners. Property size has been shown to correlate with harvest intensity in a number of studies already in the early non-industrial private forest research literature [18]. In recent studies, research in Sweden focused on different categories of forest owners. For example, forests owned by men are reported to have been managed more actively than those owned by women [19], with more frequent harvesting, cleaning and supplementary planting. However, the owner’s gender has been found to have no effect on planting and mechanized scarification [20]. Differences in management activities between male and female owners observed in 1992–1994 were still present in 2003–2006 [21]. Older owners were less likely to harvest or actively manage their forests than younger owners [20], and owners who bought their forest properties were more active than those who inherited them [19]. Harvesting activities were more common on larger properties and on higher quality sites [20] and on properties under single ownership than those under joint ownership, despite their smaller size [21]. In addition, there was more activity on properties in Southern Sweden compared to Northern Sweden, despite the smaller size of the former [19].
However, even though previous research has shown that forest management behavior differs between several categories of small-scale private forest owners, the lack of quantitative information on management activities prevents a classification of Swedish private forest owners according to their management strategies. Therefore, regional and national assessments, such as forest impact analysis and future wood supply projections [22,23], regularly undertaken in Sweden, are based on present forest conditions, without taking into account the diverse forest ownership structure. The same management strategy is applied for all private forest owners, and this strategy is rather close to the production-oriented management of enterprise-owned forests. Therefore, the supply of wood and other ecosystem services may be over- or under-estimated in regional and national assessments that are regularly undertaken in Sweden. Information on forest management strategies of non-industrial private forest owners would allow taking into account the effects of the choices of strategies in projections of wood supply and other ecosystem services by means of including different management strategies for different groups of private forest owners when simulating forest development. In addition, if we had the ability to predict forest management strategies based on readily available information, such as property size and the age, gender and residence of the owner, predictions could be made about the potential impacts of changes in ownership on forest management and forest ecosystem services in future studies.
Our objectives were thus to determine the proportions of private forest owners in Sweden who employ different management strategies and to identify the most relevant factors in determining their management choices. We also tested the feasibility of predicting management choices from factors that are readily available from different existing data sources.

2. Methods

In this study, we analyzed survey results to determine the proportion of non-industrial private forest owners in Sweden who employed different management strategies. We analyzed the results using chi-square tests to identify the most relevant factors influencing the choice of management strategy by individual forest owners. We then tested the feasibility of predicting management strategies from factors available from different data sources, using regression models.
Within the Swedish research project, PLURAL (Planning for rural-urban dynamics: living and acting at several places), Statistics Sweden conducted a nationwide postal survey of non-industrial private forest owners in 2012/2013, asking for their opinions about the forest as a resource in the present and the future. The population consisted of forest properties of a minimum size of 5 ha, where the first owner was at least 20 years old, according to the Swedish property taxation register. Random samples of 1050 resident owners (living in the same municipality as their forest property) and 1050 non-resident owners (living in a different municipality) were selected, resulting in a total sample of 2100 forest owners.
The questionnaire, with 48 questions and several sub-questions, was sent out via mail in November, 2012, and was followed up with two reminders. A total of 60.1% of the questionnaires were completed, with higher response rates from married than from unmarried people. Otherwise, there were no major differences in background variables between owners that replied and those who did not [24]. For each reply, Statistics Sweden calculated a weight to account for the results for the entire population of private forest owners, which we used in subsequent analysis.
The questionnaire included questions about the owner (age, education, etc.), the forest property (e.g., size, certification), the owner’s view on forests in general and their own forest in particular and their forest management activities. Forest owners were asked to choose which strategy best described their management activities among five different options [25]. We constructed the strategies based on experience from previous studies (e.g., [26,27,28,29]), aiming to offer the owner a choice of strategies that are at the same time distinct, coherent and prevalent.
Strategy 1: I thin and clear-cut only on a small scale. I let the forest grow old, but I do not expect the harvest to increase in the future. (Passive) [30].
Strategy 2: I harvest only on a small scale, so that the amount of old forest remains constant or increases. My management practices are oriented towards nature protection, for example to increase the proportion of broadleaved forest. (Conservation).
Strategy 3: I harvest a lot of wood by thinning, and I clear-cut as soon as the forest age permits. (Intensive).
Strategy 4: I manage the forest for increased productivity and future harvest opportunities. Examples of my management practices are planting with soil scarification, pre-commercial thinning, ditching and fertilization. (Productivity).
Strategy 5: I harvest carefully and my management practices aim to increase harvest opportunities in the medium term. (Save).
We only used the 1169 satisfactory replies, which excluded multiple answers from 21 owners (1.7%) and missing answers from 68 owners (5.4%).
For our analysis, we differentiated between “hard” factors related to the owner or property that are available in different registers, such as gender and occupation (Table 1), and “soft” (changeable) factors, such as knowledge of and interest in forestry issues (Table 2). We included in particular those factors that have been shown to influence management activities and attitudes for different types of owners. We excluded or aggregated factors with insufficient entries in a contingency table of responses (Table 1 and Table 2).
Table 1. Hard factors with response options from the survey; categories of response options that were grouped together are indicated in the “aggregation” column.
Hard FactorsResponse OptionsAggregation
GenderMale, Female-
AgeYears-
EducationElementary school, high school, university-
Marital statusMarried, unmarried, divorced, widowed-
OccupationOwn enterprise, employee (full-time), employee (part-time), pensioner, student, otherOwn enterprise, employee, pensioner, other
Working in forestryYes/No-
Gross incomeSEK-
ResidenceResident, Non-resident 1-
I live/have lived on my forest propertyYes, I live on my forest property. No, but I have lived on my forest property before. No, I have never lived on my forest property.-
Property sizeha5–25, 25–50, >50 ha
Number of properties1, 2, 3, 4 or more1, 2 or more
Acquisition 2Purchase, purchase within family, re-organization, inheritance, gift, otherPurchase or re-organization, purchase within family, inheritance, gift
Ownership 2alone, with partner, with sibling, with other family member, with someone else (not family)-
Grown up on farmYes/No-
1 Resident: same municipality as forest property, non-resident: other municipality; 2 Primary holding only.
Table 2. Soft factors with response options from the survey; categories of response options that were grouped together are indicated in the “aggregation” column.
Soft FactorsResponse OptionsAggregation
Member of forest owners’ associationYes, no, do not knowYes, No
Up-to-date forest management planYes, no, do not knowYes, No
CertifiedFSC 1, PEFC 2, other standard, no, do not knowYes, no, do not know
Who manages your forest?Only myself, I and other co-owners or family members, I outsource part of the job, I outsource all of the jobMyself or with family members, I outsource part or all of the job
How often do you buy the following services?
Professional advice0 (never)–7 (often)0–1, 2–3, 4–5, 6–7
Forestry services (e.g., final felling, cleaning, planting)0 (never)–7 (often)0–1, 2–3, 4–5, 6–7
Do you like discussing forestry issues?Yes, No-
I have friends/family that work in forestryYes, No-
Interest in forestry issues1 (very little) to 7 (a lot)1–2, 3–5, 6–7
Knowledge about practical forestry measures1 (very little) to 7 (a lot)1–2, 3–5, 6–7
Knowledge about forestry legislation1 (very little) to 7 (a lot)1–2, 3–5, 6–7
Do you think you will buy more forest property within the next 5 years?Yes definitely, yes probably, no probably not, no, definitely not, I do not knowYes, no, do not know
Do you think you will sell/transfer (some of) your forest property within the next 5 years?Yes definitely, yes probably, no probably not, no definitely not, I do not knowYes, no, do not know
How important are the following in your forest ownership?
occupation for me or someone in my household1 (not at all) to 7 (very)1–2, 3–5, 6–7
economic income from forestry1 (not at all) to 7 (very)1–2, 3–5, 6–7
hunting area1 (not at all) to 7 (very)1–2, 3–5, 6–7
wood for own use1 (not at all) to 7 (very)1–2, 3–5, 6–7
influence in local community1 (not at all) to 7 (very)1–2, 3–5, 6–7
keeping up a forestry tradition1 (not at all) to 7 (very)1–2, 3–5, 6–7
keep contact with family/friends/childhood environment1 (not at all) to 7 (very)1–2, 3–5, 6–7
nature protection1 (not at all) to 7 (very)1–2, 3–5, 6–7
forest remains in family1 (not at all) to 7 (very)1–2, 3–5, 6–7
1 Forest Stewardship Council; 2 Programme for the Endorsement of Forest Certification.
To test for differences in management strategies among factors, we used Pearson chi-square tests of independence for categorical factors and analysis of variance tests for quantitative factors (age, gross income and property size). In order to determine the nature of the differences between the factor categories, the adjusted standardized residuals were interpreted for chi-square tests that were significant at the 5% level. As a measure of effect size, Cramer’s V values were calculated together with the Chi-square test statistics. Interpretation of Cramer’s V varies with the number of categories present in the smaller of the row or column categories of the contingency table (Table 3) [31].
Table 3. Interpretation of Cramer’s V values in chi-square tests for different effect sizes [31]; r is the number of row or column categories, whichever is smaller.
Effect Sizer = 2r = 3r = 4
 Small0.100.070.06
 Medium0.300.210.17
 Large0.500.350.29
Property size, which refers to all forests and not only productive forests, was analyzed as a quantitative variable, but also divided into 3 classes (>5–20, >20–50, >50 ha) and examined with a chi-square test. This classification allowed us to relate our results to data from the Swedish Forest Agency on a size class structure.
Both forest and ownership characteristics vary substantially between Northern and Southern Sweden. Productivity is higher in the south, and properties are larger in the north [32,33]. Therefore, we analyzed our data separately for properties in Northern and Southern Sweden, as well for the whole country. The boundary between Northern and Southern Sweden was based on a combination of the Limes Norrlandicus [34] and the Swedish counties in which the properties were located (Figure 1).
Figure 1. Map of the counties in Northern and Southern Sweden, based on the Limes Norrlandicus.
Forests 05 01695 g001
We used multinomial logistic regression models to test the feasibility of predicting management strategies based on hard factors. We used a stepwise forward entry method for all hard factors that were significant according to the chi-square tests, including all two-way interactions. Only factors that significantly improved the model (5% level) were retained. All analyses were conducted using the statistical software, IBM SPSS Statistics Version 21.

3. Results

The largest proportion of forest owners (almost one third in both Northern and Southern Sweden) stated that they manage their forest using the Save strategy (Table 4). The Productivity strategy was chosen by almost as many owners (29% and 25% in the north and south, respectively). Owners of forest properties in Northern Sweden chose the Passive strategy more often and the Conservation and Intensive strategies less often compared to owners in the south.
Table 4. Proportions of owners employing different management strategies in Northern and Southern Sweden and overall (total).
StrategyNorthSouthTotal
# owners%# owners%# owners%
Passive20726.07821.028524.4
Conservation617.64211.21028.8
Intensive536.74512.1988.4
Productivity23129.09325.032427.7
Save24430.711430.735930.7
Total797100.0372100.01169100.0

3.1. Hard Factors

Among the hard factors, property size was the one most closely associated with management strategy; the association was strong in Southern Sweden and moderate in Northern Sweden (Table 5). Owners of small properties (up to 20 ha) chose the Passive, Conservation and Save strategies more often than would be expected based on a random choice and the Intensive and Productivity strategies less often. In contrast, owners of properties larger than 50 ha across the whole of Sweden chose the Passive strategy less often than expected based on a random choice and favored the Productivity strategy; in the south, there was also a preference for the Intensive strategy.
The ANOVA results also revealed significant differences in mean property size with respect to different management strategies in both Northern and Southern Sweden, as well as across the whole area (p < 0.001 for all three tests). The mean property size was significantly higher for owners who chose the Productivity strategy in the north and south and also for those in Southern Sweden who chose the Intensive strategy (Table 6). Properties were generally smaller in the south (48 ha) compared to the north (100 ha). Since owners of more than one property possessed significantly larger forest areas (p < 0.001) than those with just one property, the factor “number of owned properties” had a similar, but weaker association. Ownership of several properties was more common in Northern Sweden than in Southern Sweden (32% and 18% of forest owners in the north and south, respectively).
Table 5. Chi-square test results for Northern and Southern Sweden and for the total area; illustrating the association between management choices and hard factors, with r = number of categories present in the smaller of the row or column categories of the contingency table and the strength of association (Cramer’s V, compare Table 3); only factors with at least one significant test result for one of the areas are shown; non-significant factors are shown in italics.
Factor (r)NorthSouthTotal
p-value (df, n)Cramer’s V (interpretation)p-value (df, n)Cramer’s V (interpretation)p-value (df, n)Cramer’s V (interpretation)
Gender (2)0.034 (4, 796)0.11 (small)0.186 (4, 373)0.13 (small)0.008 (4, 1169)0.11 (small)
Marital status (4)0.151 1 (12, 796)0.08 (small)0.187 2 (12, 373)0.12 (small)0.007 (12, 1196)0.09 (small)
Working in forestry (2)<0.001 (4, 777)0.16 (small)<0.001 (4, 368)0.31 (medium)<0.001 (4, 1145)0.20 (small)
Residence (2)0.009 (4, 796)0.13 (small)0.115 (4, 375)0.14 (small)0.009 (4, 1171)0.11 (small)
Size class of property (3)<0.001 (8, 763)0.24 (medium)<0.001 (8, 359)0.36 (large)<0.001 (12, 126)0.23 (medium)
Number of properties (2)0.010 (4, 792)0.13 (small)0.015 (4, 372)0.18 (small)<0.001 (4, 1164)0.14 (small)
Acquisition (4)0.117 (12, 772)0.09 (small)0.188 (12, 358)0.12 (small)0.016 (12, 1130)0.09 (small)
1 Two cells (10%) had expected values less than five; 2 four cells (20%) had expected values less than five.
Table 6. Average property size of owners employing different management strategies in Northern and Southern Sweden and over the whole of Sweden (total).
Management StrategyAverage Property Size (ha)
NorthSouthTotal
Passive533247
Conservation832761
Intensive956783
Productivity16473137
Save843969
Total1004883
In the entire country, 35%, 12% and 38% of the properties between six and 20 hectares were managed with the Passive, Conservation and Save strategies, respectively (Table 7), which means that almost 90% of small properties were managed extensively. In contrast, more than half of the properties larger than 50 hectares were managed by the Intensive and Productivity strategies. However, small properties accounted for only 10% of the area of total productive forest land owned by private individuals, while properties larger than 50 hectares occupied 68% of the privately owned forest area.
The second most important factor in explaining management strategies was an occupation in forestry (Table 5), with 16%, 18% and 15% of forest owners with an occupation in forestry overall and for Northern and Southern Sweden, respectively. Working in forestry was moderately and slightly associated with management strategy in Southern and Northern Sweden, respectively. Forest owners working in forestry chose the Productivity (Northern Sweden) or the Intensive (Southern Sweden) strategy more frequently and the Passive strategy less frequently than would be the case if the choice were random. However, employment in forestry was also associated with property size; owners of properties larger than 50 ha were more likely to work in forestry compared to owners of small properties (north: p < 0.001, Cramer’s V = 0.184, r = 2, n = 745; south: p < 0.001, Cramer’s V = 0.173, r = 2, n = 355).
Table 7. Proportions of owners employing the various management strategies for different property size classes for all of Sweden and the proportion of productive forest area owned by private individuals within each size class.
Property Size (ha)Management StrategyProportion of Productive Forest Area Owned By Private Individuals 1
PassiveConservationIntensiveProductivitySave
6–2035%12%4%10%38%10%
21–5027%7%12%26%28%20%
>5013%7%10%45%26%68%
1 Source: [33].
There were small, but significant, differences in management choices between men and women and between resident and non-resident owners in Northern Sweden, but not in Southern Sweden (Table 5). In Northern Sweden, female owners chose the Intensive strategy less often and the Passive strategy more often compared to men. Non-resident owners were less likely to choose the Save and Intensive strategies and more likely to choose the Productivity strategy compared to resident owners. It should be noted that non-resident owners with a property in the north lived further away (an average of 390 km) from their forest property compared to non-resident owners with a property in the south (an average of 136 km).
Neither marital status nor the nature of acquisition had a significant effect on management choices in Northern or Southern Sweden, but both were significant, with a small association for Sweden overall (Table 5).
In general, owners that grew up on a farm did not choose different strategies compared to other owners, regardless of gender. Education, occupation (except for owners working in forestry; see above), ownership type (alone vs. with somebody else) or living on the property had no significant impact on management choices. The mean age of forest owners (62.2 years) was not significantly different among owners who chose different management strategies (ANOVA test, p = 0.075 in Northern Sweden, p = 0.192 in Southern Sweden). Mean gross income was 312,000 SEK and 351,000 SEK for owners with property in Northern and Southern Sweden, respectively, with no significant differences among owners who chose different management strategies (ANOVA test, p = 0.26 in Northern Sweden, p = 0.57 in Southern Sweden).
Female owners had somewhat smaller properties compared to male owners in both Northern and Southern Sweden; however the difference was not statistically significant. There was no significant difference in property size between resident and non-resident owners.

3.2. Soft Factors

There were clear differences in the size of the effect of soft factors between Northern and Southern Sweden (
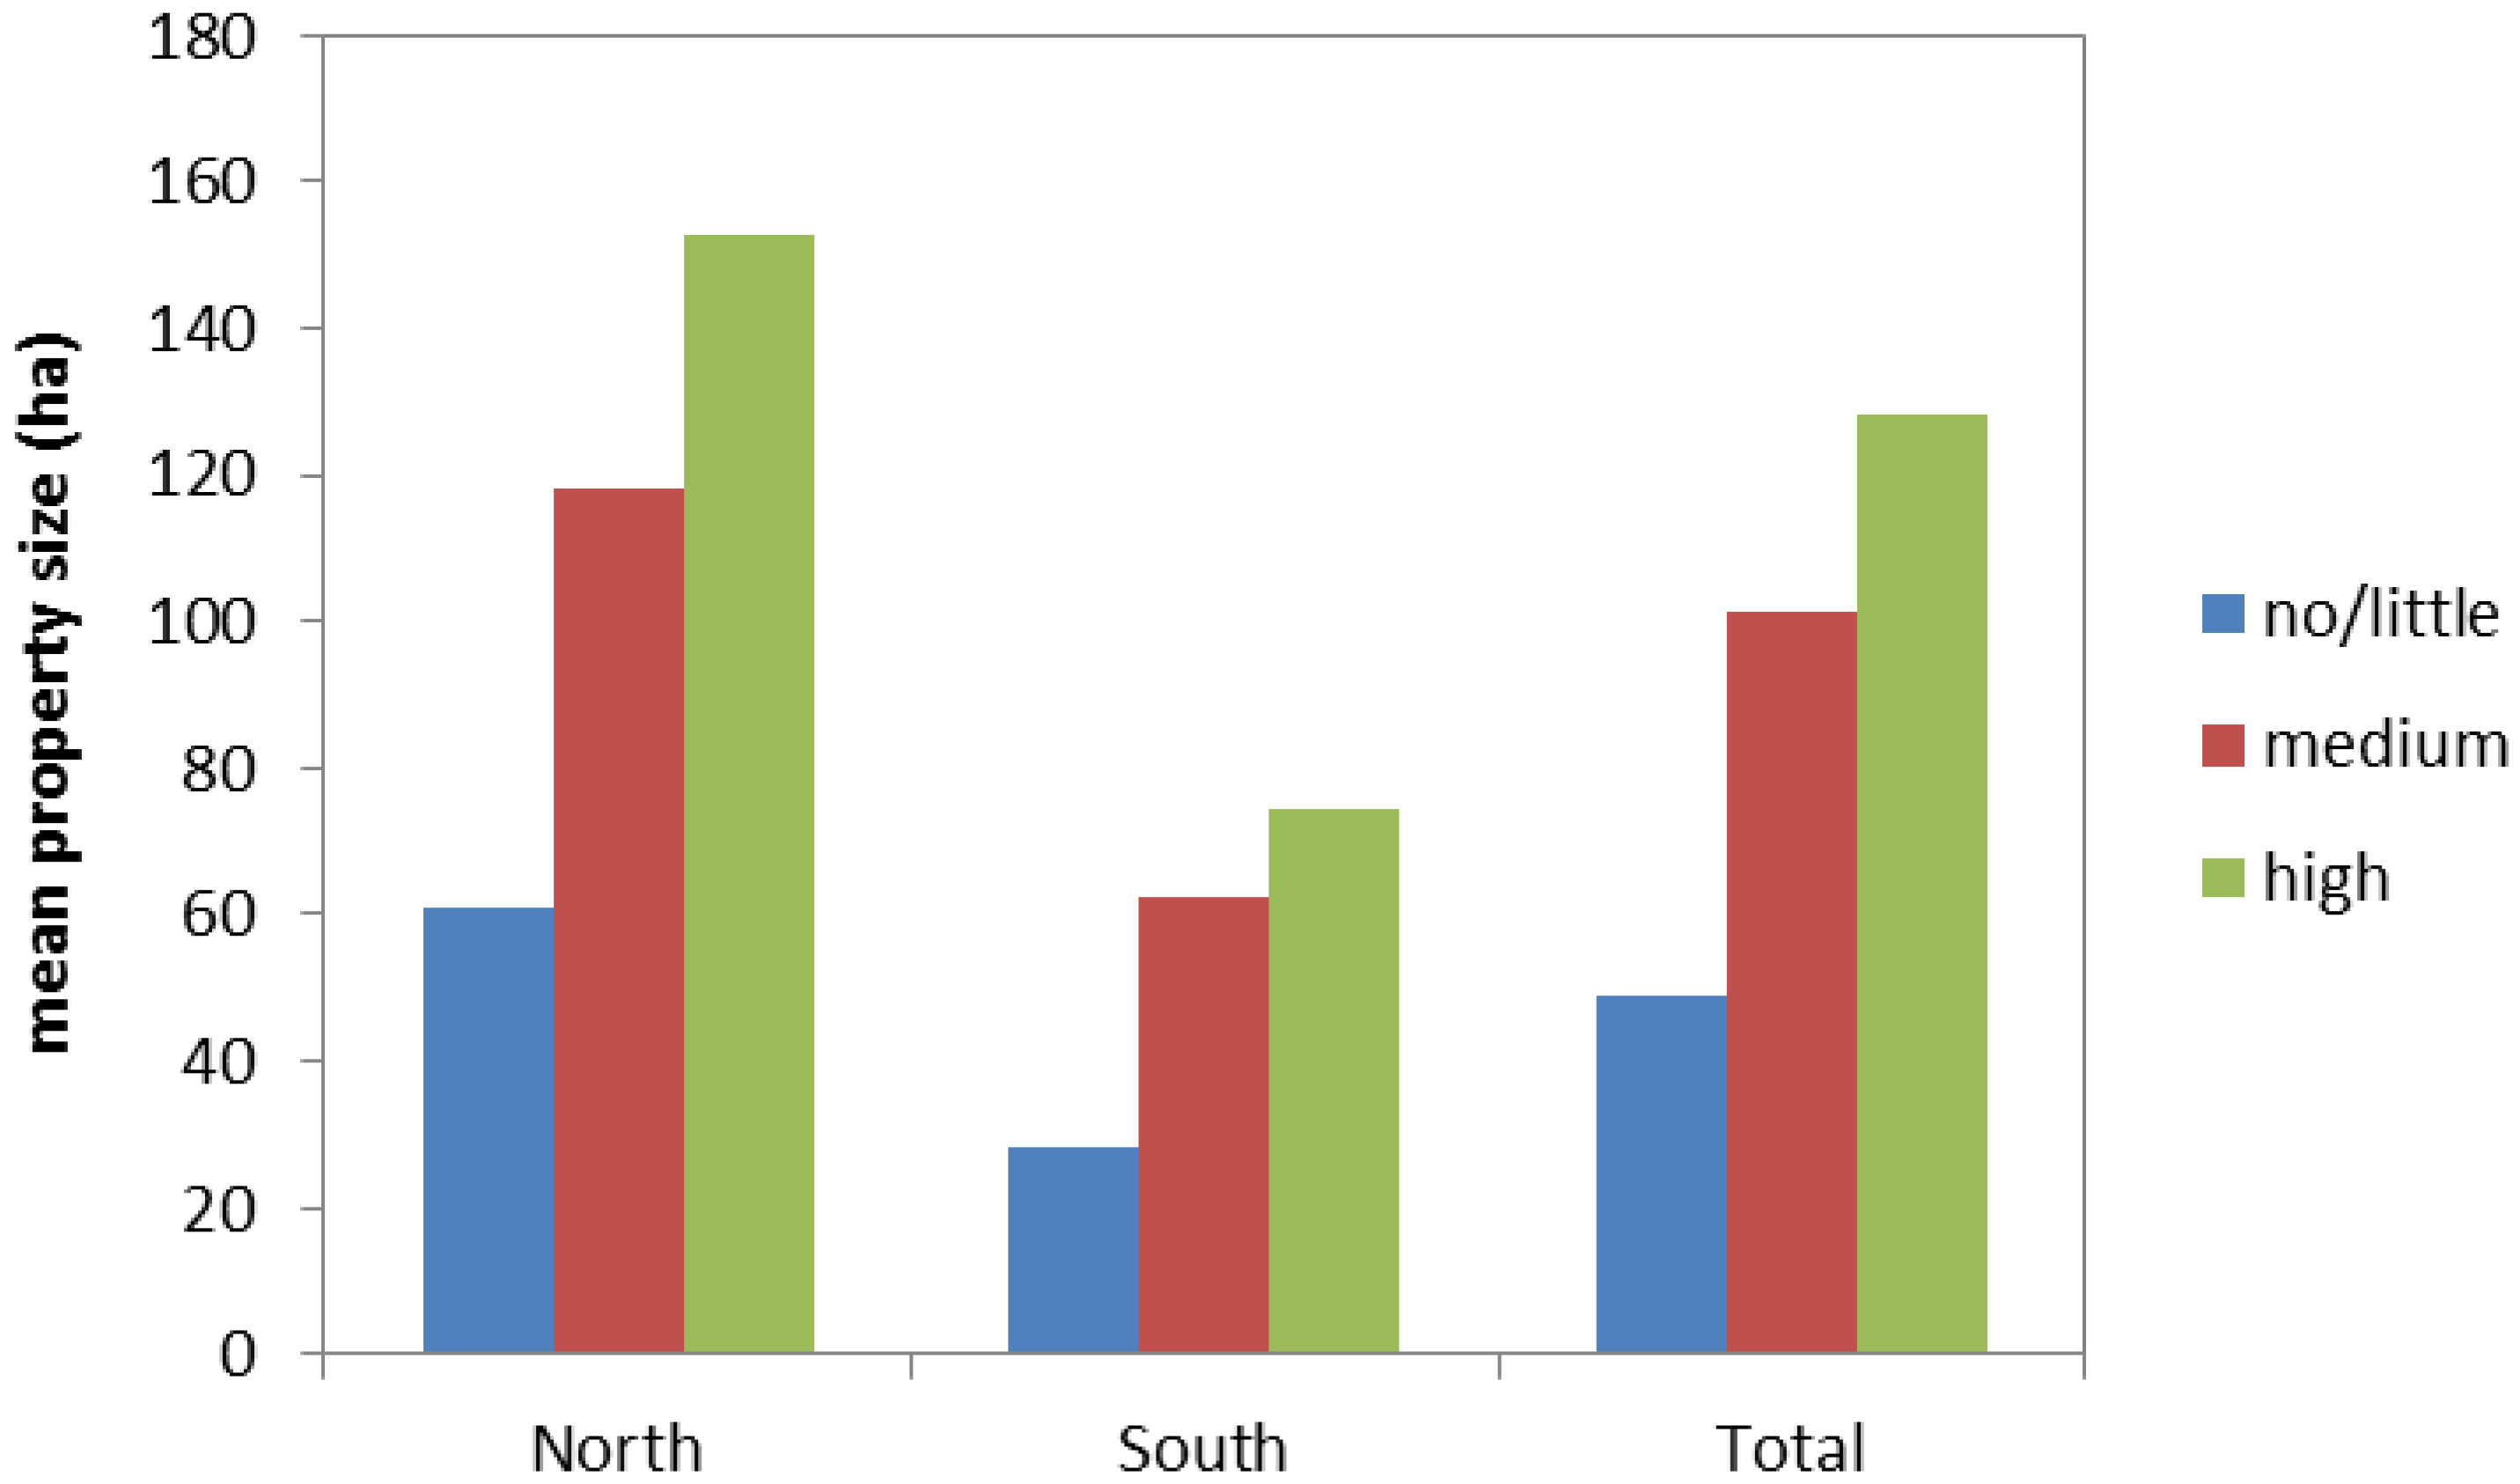
Table 8). Membership in a forest owners’ association, certification, existence of an up-to-date management plan, interest in forestry issues and knowledge about practical forestry and forest legislation all had a moderate impact on management choices in Southern Sweden, but only a small impact in Northern Sweden. The importance of economic income from forestry was moderately associated with management choices in both Northern and Southern Sweden and increased with property size (Figure 2). There were strong regional differences; properties in Northern Sweden were about twice as large as those in Southern Sweden for all levels of importance of income from forestry. More than half of the owners (54%) who placed little or no value on their economic income from forestry had properties smaller than 20 ha (49% and 61% in the north and south, respectively), compared to 15% of the owners who valued economic income highly. Interest in and knowledge about forestry was also related to property size: owners of larger properties were generally more interested in and knowledgeable about forestry issues (north: p < 0.001, Cramer’s V = 0.21, r = 3, n = 733; south: p < 0.001, Cramer’s V = 0.23, r = 3, n = 349).
Several soft factors were only slightly associated with management choice, including the occupation of the owner or someone in their household, hunting area, influence in the local community, keeping up a forestry tradition and nature protection. There was no significant difference in management choices associated with other factors, such as producing wood for own use, keeping the forest in the family, keeping in contact with family friends/childhood environment and having friends/family working in forestry.
The majority of owners outsourced some of their forestry activities, such as final felling or planting (81% and 84% in the north and south, respectively, outsourced forestry activities at least once). Owners who chose the Passive and save strategies bought forestry services less often than owners who chose the Intensive and Productivity strategies. This factor was also related to property size; owners of larger properties bought forestry services more often (north: p < 0.001, Cramer’s V = 0.2, r = 4, n = 733; south: p < 0.001, Cramer’s V = 0.33, r = 4, n = 352). There was a similar, but weaker, relationship between buying advisory services and both strategy and size of property. Seeking professional advice was quite common (64% and 71% of owners in the north and south, respectively, have engaged advisory services at least once).
About 12% of owners in both Northern and Southern Sweden planned to buy more forest land within the next five years. There was a small association between management choice and likelihood of buying more forest land within the next five years in the north; owners employing the Productivity strategy were most likely to express the intention to buy more forest land, while the opposite was true for owners who chose the Passive strategy. In contrast, 23% and 17% of owners in the north and south, respectively, were planning to sell/transfer (some of) their forest land within the next five years. There was only a small relationship between this factor and management choice in Southern Sweden, with owners who chose the Passive strategy being more uncertain (answering “do not know”) than others.
Table 8. Chi-square test results for Northern and Southern Sweden and overall (total), illustrating the association between management choice and soft factors, with r = number of categories present in the smaller of the row or column categories of the contingency table and strength of association (Cramer’s V, compare Table 3); only factors with significant test results in Northern, Southern or all of Sweden are shown; non-significant factors are shown in italics.
Factor (r)NorthSouthTotal
p-value (df, n)Cramer’s V (interpretation)p-value (df, n)Cramer’s V (interpretation)p-value (df, n)Cramer’s V (interpretation)
Member of FOA 1 (2)0.057 (4, 756)0.11 (small)<0.001 (4, 362)0.32 (medium)<0.001 (4, 1118)0.16 (small)
Up-to-date management plan 2 (2)<0.001 (4, 727)0.20 (small)<0.001 (4, 340)0.31 (medium)<0.001 (4, 1064)0.23 (small)
Certified (3)<0.001 (8, 780)0.15 (small)<0.001 (8, 361)0.27 (medium)<0.001 (8, 1141)0.18 (small)
Who manages your forest? (2)0.002 (4, 787)0.14 (small)0.053 (4, 361)0.16 (small)0.001 (4, 1148)0.13 (small)
How often do you buy the following services?
-professional advice? (4)0.026 (12, 724)0.10 (small)0.001 (12, 336)0.18 (medium)<0.001 (12, 1060)0.11 (small)
-forestry services (4)<0.001 (12, 756)0.14 (small)<0.001 (12, 356)0.23 (medium)<0.001 (12, 1112)0.16 (small)
Do you like discussing forestry issues? (2)<0.001 (4, 614)0.19 (small)<0.001 (4, 894)0.27 (small)<0.01 (4, 894)0.21 (small)
Interest in forestry issues (3)<0.001 (8, 663)0.18 (small)<0.001 (8, 358)0.29 (medium)<0.001 (8, 1121)0.20 (small)
Knowledge about practical forestry measures (3)<0.001 (8, 774)0.18 (small)<0.001 (8, 359)0.21 (medium)<0.001 (8, 1133)0.18 (small)
Knowledge about forestry legislation (3)<0.001 (8, 744)0.17 (small)<0.001 (8, 348)0.23 (medium)<0.001 (8, 1092)0.18 (small)
Do you think you will buy more forest property within the next five years? (3)0.001 (8, 791)0.13 (small)0.524 (8, 365)0.10 (small)0.001 (8, 1156)0.10 (small)
Do you think you will sell/transfer (some of) your forest property during the next five years? (3)0.121 (8, 792)0.09 (small)0.044 (8, 373)0.15 (small)0.006 (8, 1165)0.10 (small)
How important is the following in your forest ownership?
-an occupation for me or someone in my household (3)0.001 (8, 739)0.14 (small)0.069 (8, 346)0.15 (small)<0.001 (8, 1085)0.13 (small)
-economic income from forestry (3)<0.001 (8, 742)0.22 (medium)<0.001 (8, 357)0.25 (medium)<0.001 (8, 1099)0.23 (medium)
-hunting area (3)0.056 (8, 759)0.10 (small)0.124 (8, 352)0.13 (small)0.003 (8, 1111)0.10 (small)
-influence in local community (3)0.13 (8, 734)0.09 (small)0.003 (8, 346)0.18 (small)0.007 (8, 1080)0.10 (small)
-keeping up a forestry tradition0.039 (8, 757)0.10 (small)0.004 (8, 346)0.18 (small)0.001 (8, 1093)0.11 (small)
-nature protection0.011 (8, 751)0.12 (small)0.021 (8, 353)0.16 (small)<0.001 (8, 1104)0.12 (small)
1 FOA, forest owners’ association; the answer “do not know” was excluded to avoid low cell counts; it was given by 0.4% of the owners in Northern Sweden and 1.9% in Southern Sweden; 2 The answer “do not know” was excluded to avoid low cell counts; it was given by 8.3% of the owners in Northern Sweden and 6.6% in Southern Sweden.
Figure 2. Mean property size of private forests whose owners ascribed different levels of importance to income from forestry for Northern and Southern Sweden and overall (total).
Forests 05 01695 g002
The Passive and Productivity strategies had the strongest associations with soft factors (highest absolute adjusted standardized residuals), while the choice of other strategies varied little among different categories of factors. Owners who chose the Passive strategy were less interested in forestry issues and were not dependent on economic income from the forest. Owners who chose the Productivity strategy were more interested in and more knowledgeable about forestry issues and attached more importance to economic income from forestry. Only 43% of the owners who chose the Passive strategy had an up-to-date forest management plan (46% and 36% in the north and south, respectively), compared to 71% of the owners who chose the Productivity strategy (69% and 76% in the north and south, respectively). Members of a forest owners’ association (40% and 44% of owners in the north and south, respectively) and forest owners with certified management practices were more likely to choose the Productivity strategy. Certification was much more common in Southern Sweden, where 30% of the owners stated that they had certified their forest compared to 10% in the north. It was remarkable, however, that 15% of the owners (17% and 12% in the north and south, respectively) did not know if their forest was certified or not. Certification and membership in a forest owners’ association were associated with the size of property: larger properties were more often certified (north: p < 0.001, Cramer’s V = 0.17, r = 3, n = 754; south: p < 0.001, Cramer’s V = 0.31, r = 3, n = 355) than smaller properties, and their owners were more often members of associations (north: p < 0.001, Cramer’s V = 0.16, r = 2, n = 733; south: p < 0.001, Cramer’s V = 0.22, r = 2, n = 355), especially in Southern Sweden. In Southern Sweden, owners who chose the Intensive and Productivity strategies valued influence in the local community more than owners who chose other strategies.
While residence had no significant effect on the membership in a forest owners’ association or the level of certification, non-resident owners were more likely to have an up-to-date management plan in both Northern and Southern Sweden (57% and 48% of the non-resident and resident owners, respectively, in the entire country, p = 0.004, r = 2, Cramer’s V = 0.097, n = 1,154). Non-resident owners outsourced forest management activities more often and were less knowledgeable about practical forest management matters. There was no difference, however, in general interest in forestry issues, nor in economic interest between resident and non-resident owners.
Female owners assigned less importance to forestry as an occupation and to hunting area compared to male forest owners. However, there was no gender difference with respect to economic interest. There was a strong relationship between gender and practical forestry knowledge: only 16% of female forest owners thought that they had (very) good knowledge of practical forestry, compared to 61% of male owners. There was a similar, but slightly weaker, relationship with interest in forestry and knowledge about legislation. Only 11% of female owners replied that they managed their forests on their own, compared to 37% of male owners (with no large differences between Northern and Southern Sweden). Female owners managed their forest more often than men with co-owners or family members (women 28%, men 12%) or engaged outsiders (women 61%, men 51%).

3.3. Predicting Management Strategies

We constructed separate multinomial logistic regression models for Northern and Southern Sweden. The one for the north was significantly better at predicting management choices than a model with no predictors (likelihood ratio chi-square = 117.2, p-value of <0.001). However, the pseudo R2 values were not very high (Cox Snell’s R2 = 0.146; Nagelkerke’s R2 = 0.154). The model classified 41.2% of answers correctly, 10.3% more than would have been the case with an empty model. While the model was very effective at correctly identifying the Productivity strategy and was reasonable at correctly identifying the Passive strategy cases, only 30% of cases in the Save strategy and none in the Conservation and Intensive strategies were classified correctly (Table 9). Significant terms in this model included property size, residence and an occupation in forestry.
Table 9. Classification into management strategies by the multinomial logistic regression model for Northern Sweden.
ObservedPredicted
PassiveConservationIntensiveProductivitySavePercent Correct
Passive87005545  46.4%
Conservation17002114  0.0%
Intensive2000248  0.0%
Productivity540015116  68.5%
Save66009869  29.7%
Overall32.6%0.0%0.0%46.8%20.6%  41.2%
All intercepts in the model for Northern Sweden were negative and significant (Table 10), indicating that owners of properties larger than 50 ha had a lower likelihood of choosing the Passive, Conservation, Intensive or Save strategies compared to the Productivity strategy. Having a small property (>5–20 ha) increased the likelihood of the owner choosing the Passive, Conservation or Save strategies. Working in forestry decreased the likelihood of choosing the Passive or Save strategies compared with the Productivity strategy, while resident owners were more likely to choose the Intensive or Save strategies instead of the Productivity strategy compared to non-resident owners. In general, the odds ratios for size classes were higher than the odds ratios for other factors, indicating that property size had a greater impact on management choices than other factors.
Table 10. Model parameters, standard error (SE), Wald statistic, degrees of freedom (df), significance (p-value), odds ratio and confidence interval for the multinomial logistic regression model for Northern Sweden for different management strategies; factors in the model included property size, residence and an occupation within forestry; parameters that were significant are highlighted in bold. The reference category is the Productivity strategy.
SEWalddfp-valueOdds Ratio95% Confidence Interval for Exp(B)
Lower BoundUpper Bound
 Passive
 Intercept−0.9420.20321.5121<0.001
 Resident0.1710.2140.64110.4231.1870.7801.805
 Non-resident0 a 0
 >5–20 ha1.8970.27547.6741<0.0016.6673.89111.425
 >20–50 ha1.1030.25718.4531<0.0013.0121.8214.982
 >50 ha0 a 0
Working in forestry−0.7680.3046.38910.0110.4640.2560.842
Not working in forestry0 a 0
 Conservation
 Intercept−1.7750.29137.2471<0.001
 Resident−0.1750.3170.30310.5820.8400.4511.564
 Non-resident0 a 0
 >5–20 ha1.7110.37021.4001<0.0015.5342.68011.424
 >20–50 ha0.1130.4530.06210.8031.1200.4612.718
 >50 ha0 a 0
Working in forestry−0.3470.4370.63010.4270.7070.3001.664
Not working in forestry0 a 0
 Intensive
 Intercept−2.3110.34345.4521<0.001
 Resident1.0030.3607.76810.0052.7261.3475.517
 Non-resident0 b 0
 >5–20 ha0.5870.4351.81510.1781.7980.7664.220
 >20–50 ha0.6530.3593.30210.0691.921.9503.883
 >50 ha0 a 0
Working in forestry−0.3710.4020.85110.3560.6900.3141.518
Not working in forestry0 a 0
 Save
 Intercept−0.6100.18510.90310.001
 Resident0.5810.2048.09910.0041.7881.1982.669
 Non-resident0 b 0
 >5–20 ha1.4960.25534.4541<0.0014.4632.7087.354
 >20–50 ha0.2980.2481.44810.2291.3480.8292.191
 >50 ha0 a 0
Working in forestry−0.7770.2718.19910.0040.4600.2700.783
Not working in forestry0 a 0
a this parameter was set to zero because it is redundant.
The multinomial logistic regression model for Southern Sweden was significantly better at predicting management choices than a model with no predictors (likelihood ratio chi-square = 126.34, p-value of <0.001). The pseudo R2 values were higher than those for Northern Sweden (Cox Snell’s R2 = 0.299; Nagelkerke’s R2 = 0.313). The model classified 39.9% of the answers correctly, 9% more than an empty model. While the model was reasonably good at identifying the Passive and Productivity strategies (63% and 56% correct, respectively), it correctly classified only 33% and 19% of the Save and Intensive strategies, respectively, and none of the Conservation strategy cases (Table 11). Significant model terms in Southern Sweden were property size and working in forestry.
Table 11. Classification by the multinomial logistic regression model for Southern Sweden.
ObservedPredicted
PassiveConservationIntensiveProductivitySavePercent Correct
Passive47.403.24.819.763.1%
Conservation21.300.03.213.60.0%
Intensive2.008.418.514.519.4%
Productivity8.005.649.925.855.8%
Save45.802.824.936.533.2%
Overall35.0%0.0%5.6%28.5%30.9%39.9%
Owners with properties larger than 50 ha who were not working in forestry were less likely than owners of smaller properties to choose the Passive, Conservation, Intensive and Save strategies, as indicated by the significant negative intercepts (Table 12). Owners of properties between 5 and 20 ha were most likely to choose the Passive strategy (highest odds ratio), followed by the Productivity and Save strategies, compared to owners of properties larger than 50 ha. Working in forestry decreased the likelihood of choosing the Passive or Conservation strategies, while it increased the odds of choosing the Intensive strategy instead of the Productivity strategy. As in Northern Sweden, the odds ratios for size classes were generally higher than the odds ratios for the working in forestry factor, indicating that property size had a larger impact on management choices than an occupation in forestry.
Table 12. Model parameters, standard error (SE), Wald statistic, degrees of freedom (df), significance (p-value), odds ratio and confidence interval for the multinomial logistic regression model for Southern Sweden for different management strategies; factors in the model included property size, residence and occupation within forestry; parameters that were significant are highlighted in bold. The reference category is the Productivity strategy.
SEWalddfSig.Odds ratio95% Confidence Interval for Exp(B)
Lower BoundUpper Bound
Passive
 Intercept−2.140.4819.561<0.001
 >5–20 ha3.900.5943.481<0.00149.2315.46156.78
 >20–50 ha1.880.5611.2610.0016.572.1919.71
 >50 ha0 a 0
Working in forestry−1.020.533.7210.0540.360.131.02
Not working in forestry0 a 0
Conservation
 Intercept−2.460.5818.021<0.001
 >5–20 ha3.460.6924.971<0.00131.698.17122.91
 >20–50 ha1.790.677.1910.0076.021.6222.33
 >50 ha0 a 0
Working in forestry−2.090.984.5510.0330.120.020.84
Not working in forestry0 a 0
 Intensive
 Intercept−1.380.3317.891<0.001
 >5–20 ha0.630.581.1810.2781.880.605.90
 >20–50 ha0.610.412.1910.1391.840.824.13
 >50 ha0 a 0
Working in forestry1.010.406.3810.0122.731.255.96
Not working in forestry0 a 0
 Save
 Intercept−0.570.264.7610.029
 >5–20 ha2.280.4328.641<0.0019.754.2322.44
 >20–50 ha0.820.355.4210.0202.271.144.54
 >50 ha0 a 0
Working in forestry−0.580.402.1710.1410.560.261.21
Not working in forestry0 a 0
a this parameter was set to zero because it is redundant.

4. Discussion

Forest ownership is changing in Sweden, with a decreasing proportion of farmers, a slowly increasing proportion of female and non-resident owners and decreased dependence on economic income from forestry. An understanding of how this is likely to affect forest management is very important for policy makers at national, regional and municipality levels, for the forest industry and organizations with an interest in forest issues. In addition, knowledge about the distribution of management strategies among non-industrial private forest owners is important for wood supply forecasts and for assessing the development of other forest ecosystem services at the landscape, regional and national level. Therefore, we analyzed the proportions of five different forest management strategies among non-industrial private forest owners and how the strategies are associated with hard factors (age, property size, gender, etc.) and soft factors (attitudes and objectives) related to forest properties and owners. Previous studies on non-industrial private forest owners have either focused on management objectives or activity levels. However, objectives are not necessarily completely reflected by management strategies, and the level of activity is closely related to forest conditions. In addition, different attitudes and objectives do not necessarily result in different management strategies, while the same objective can yield different strategies. For example, it is conceivable that passive and recreationist owners, which are identified in several forest owner typologies [15], manage their forest in a similar way. On the other hand, multi-objective owners may have a rather large variety of management strategies. This is why we chose not to focus on objectives, but on actual management behavior. The management strategies we defined did not assess the level of activity directly, but instead, provided a subjective interpretation by the forest owners of their own management behavior. Even though it is conceivable that forest owners apply several different management strategies in different parts of their property (e.g., key biotopes, forest around the house, special recreational spots), we assume that their management choices specified in the survey correspond to their main approach to forest management.
Our results show that a substantial share of non-industrial private forest owners do not seem to manage the forest very intensively (Table 7). Between 85% (for the smallest property size class, 6–20 ha) and 46% (for the largest property size class, >50 ha) of the forest owners state that they manage their forest according to the Passive, Conservation or Save strategy, i.e., supposedly less intensively compared to enterprise-owned forest. This could mean that the forest impact analysis and future wood supply projections, which are regularly undertaken and widely used in Sweden, overestimate potential wood supply from non-industrial private forest, because no reductions in harvest propensity for non-industrial owners are regarded in these studies. Future forest resource assessments on the national, regional or landscape level should take the diverse management strategies of private forest owners into account. With the results from our study, it would be possible to stratify non-industrial private forest owners according to their management strategy. However, given the rather high average age of private forest owners and the fact that around one fifth of the owners plan to sell or transfer the property within the next five years according to our survey results (Table 8), it can be expected that a substantial share of forest properties will change their owner during the coming years. The new owners may prioritize other forest-related values and choose management strategies differently in the future, which should be kept in mind when using our results for long-term projections.
According to our results, property size was the most important factor for forest owners in choosing a management strategy. Property size has been reported to be an important factor also in other studies, in Sweden and elsewhere. For example, Lidestav and Ekström [20] found that harvesting frequency increased with property size. Umaerus et al. [5] found that forest owners who did not claim traditional forestry as a current activity had significantly smaller forest holdings compared to owners with some ongoing business activities. In addition, Ingemarson et al. [3] showed that “passive owners” owned smaller estates compared to other groups of owners. Size of forest holding was often identified to be an important determinant of landowner behavior and to correlate with management intensity [18,35] in the United States. We found that property size was related to various soft factors (e.g., economic importance, interest and knowledge about forestry issues), which we found to be more relevant to management choices than hard factors (with the exception of property size), especially in Southern Sweden. Owners of larger properties often chose the Productivity strategy, since income from forestry was important to them; in addition, they were particularly interested in forestry issues. Forest management is less relevant to the economic income of owners of smaller properties [36], who therefore tended to choose the Passive strategy. Property size was more strongly associated with management choices in Southern Sweden, where properties were generally more productive and smaller than in Northern Sweden. Our size class aggregation may not have been optimal for conditions in Northern Sweden; however, we used the same size class aggregation for both regions, since we wanted the results to be comparable.
Even though male and female forest owners differ in their forest-related values and activity levels [7,21] and in their forestry-related interests and knowledge (Table 8), we found that management choices and economic interest in the forest are quite similar for male and female forest owners. This could be because the Swedish forestry sector has traditionally been and still is dominated by men [5,6,37]. Most female owners are married and may make decisions about forest management together with their husband or co-owner, or even leave (some of) the decisions to him [37]. Umaerus et al. [5] found that women are rarely the operational managers in family forestry holdings, even though they represent 38% of the owners. Women manage their forest far less often on their own (12% of female owners compared to 43% of male owners) according to our results. This could also explain some of the difference in activity levels between male and female forest owners. However, higher activity levels do not necessarily mean that the forest is managed more intensively. It could be that men are more often active, as they do part of the job themselves, but on small areas, while women more often engage outside help and activities are more seldom, but then, maybe cover larger areas.
Distance to the forest property was one of the few factors that influenced management choices for owners with a property in Northern Sweden, but not in Southern Sweden. Longer distances to their property for non-resident owners with a property in Northern Sweden compared to non-resident owners with a property in Southern Sweden make frequent visits more difficult. Non-resident owners with a property in the north may have chosen the Productivity strategy more often, since non-resident owners outsourced forest management more often than resident owners.
Our results highlight that management strategies do not have a particularly strong association with forest ownership objectives, with the exception of the objective, economic income, which had a medium strong association with management strategy. One reason for this could be that forest management activities, such as final felling and thinning, are highly mechanized and frequently outsourced in Sweden [33]. Both planning and management activities are often conducted by forest owners’ associations or enterprises, which means that management of private forests not only depends on the attitudes and behavior of private forest owners, but is also influenced by their forest managers. Kindstrand et al. [38] have shown that the perception of private forest owners and professional forest managers regarding the importance of certain forest services for the private owners differ. Private forest owners value traditional forest services (wood supply and family traditions) less and environmental (biodiversity) and recreational functions of the forest more than the forest managers think they would. The diverging perceptions between forest owners and forest managers can help explaining why forest owners’ values and attitudes do not necessarily affect their forestry practices. Thus, better communication is needed between private forest owners and their forest managers [38]. Forest managers need to improve their understanding of the owners’ objectives and how to follow them in all management decisions.
We found a lot of uncertainty in predicting management choices based on hard factors available from standard registers; only about 40% of the owners were classified correctly in our regression models, even though the models were statistically significant (Table 9 and Table 11). While the identification of owners choosing the Passive and Productivity strategies by the regression models was acceptable, identification of owners choosing the Save strategy was poor, and the models largely failed in identifying owners choosing the Conservation and Intensive strategies. One possible reason for this may be limitations in our study design. There is a large variety in management practices among non-industrial private forest owners, and to our knowledge, there have been no attempts to classify Swedish non-industrial private owners’ management practices before. We aimed to offer respondents a choice of strategies that are at the same time distinct, coherent and prevalent, based on experience from previous studies on non-industrial private forest owners. Nonetheless, our strategies may not have been sufficiently well chosen or they may have been ambiguous. In future studies, it would be useful to test the suitability of the management strategies for describing different categories of management behavior and the comprehensibility of the strategies for the respondents. Another limitation is that our study did not include potentially important factors, such as length of ownership, which has been shown to be important, as new owners are often more active harvesters [39], and factors related to the state of the forest (e.g., age class distribution and volume of wood). However, we believe that the most important reason for the unsatisfactory performance of the regression models is that forest owners are individuals, each with their own history, circumstances and objectives, so that the choice of management strategies is difficult to predict only based on the hard factors identified in our study. Forest legislation in Sweden allows owners a lot of freedom in their management decisions. Owners’ management choices are probably influenced by many interacting factors. In future studies, it would be interesting to investigate the link between the forest management objectives of owners and their management strategy in more detail.

5. Conclusions

To conclude, our results stress the fact that there is a considerable variety in management strategies among non-industrial private forest owners, which should be taken into account in future forest resource and wood supply projections. On the other hand, the expected changes in forest ownership, such as the increasing proportion of female and non-resident owners, are not likely to lead to substantial changes in forest management according to our results. Property size was the most important factor in determining the choice of management strategy, with owners of larger properties more frequently choosing a more production-oriented management strategy compared to owners of small properties. Thus, potential changes in the property sizes of non-industrial private forests could have noticeable effects on future forest management in these forests.

Acknowledgments

This research was performed within the PLURAL project (Planning for Rural-Urban Dynamics: Living and Acting at Several Places) and funded by the Swedish Research Council Formas. We thank two reviewers for their constructive comments.

Author Contributions

All authors were responsible for the study design. Jeannette Eggers analyzed all data and prepared the manuscript. All authors contributed to the manuscript revisions.

Conflicts of Interest

The authors declare no conflict of interest.

References and Notes

  1. Fischer, A.P.; Bliss, J.; Ingemarson, F.; Lidestav, G.; Lönnstedt, L. From the small woodland problem to ecosocial systems: The evolution of social research on small-scale forestry in Sweden and the USA. Scand. J. For. Res. 2010, 25, 390–398. [Google Scholar]
  2. Hugosson, M.; Ingemarson, F. Objectives and motivations of small-scale forest owners; theoretical modelling and qualitative assessment. Silva Fenn. 2004, 38, 217–231. [Google Scholar]
  3. Ingemarson, F.; Lindhagen, A.; Eriksson, L. A typology of small-scale private forest owners in Sweden. Scand. J. For. Res. 2006, 21, 249–259. [Google Scholar] [CrossRef]
  4. Appelstrand, M. Miljömålet i Skogsbruket: Styrning Och Frivillighet; Lund Studies in Sociology of Law 26, Sociologiska Institutionen, Lunds Universitet: Lund, Sweden, 2007. [Google Scholar]
  5. Umaerus, P.; Lidestav, G.; Eriksson, L.O.; Högvall Nordin, M. Gendered business activities in family farm forestry: From round wood delivery to health service. Scand. J. For. Res. 2013, 28, 596–607. [Google Scholar] [CrossRef]
  6. Andersson, M.; Håkansson, C.; Holmgren, L. Non-industrial private forest owners’ financial risk taking: Does gender matter? Scand. J. For. Res. 2010, 25, 6–13. [Google Scholar]
  7. Nordlund, A.; Westin, K. Forest values and forest management attitudes among private forest owners in Sweden. Forests 2010, 2, 30–50. [Google Scholar] [CrossRef]
  8. Favada, I.M.; Karppinen, H.; Kuuluvainen, J.; Mikkola, J.; Stavness, C. Effects of Timber Prices, Ownership Objectives, and Owner Characteristics on Timber Supply. For. Sci. 2009, 55, 512–523. [Google Scholar]
  9. Hujala, T.; Kurttila, M.; Karppinen, H. Customer segments among family forest owners: Combining ownership objectives and decision-making styles. Small-Scale For. 2013, 12, 335–351. [Google Scholar] [CrossRef]
  10. Boon, T.E.; Meilby, H.; Thorsen, B.J. An empirically based typology of private forest owners in Denmark: Improving communication between authorities and owners. Scand. J. For. Res. 2004, 19, 45–55. [Google Scholar] [CrossRef]
  11. Karppinen, H. Values and objectives of non-industrial private forest owners in Finland. Silva Fenn. 1998, 32, 43–59. [Google Scholar]
  12. Wiersum, K.F.; Elands, B.H.M.; Hoogstra, M.A. Small-scale forest ownership across Europe: Characteristics and future potential. Small-Scale For. Econ. Manag. Policy 2005, 4, 1–19. [Google Scholar]
  13. Kline, J.D.; Alig, R.J.; Johnson, R.L. Fostering the production of nontimber services among forest owners with heterogeneous objectives. For. Sci. 2000, 46, 302–311. [Google Scholar]
  14. Mizaraite, D.; Mizaras, S. The formation of small-scale forestry in countries with economies in transition: Observations from Lithuania. Small-Scale For. Econ. Manag. Policy 2005, 4, 437–450. [Google Scholar]
  15. Häyrinen, L.; Mattila, O.; Berghäll, S.; Toppinen, A. Changing objectives of non-industrial private forest ownership: A confirmatory approach to measurement model testing. Can. J. For. Res. 2014, 44, 290–300. [Google Scholar] [CrossRef]
  16. Novais, A.; Canadas, M.J. Understanding the management logic of private forest owners: A new approach. For. Policy Econ. 2010, 12, 173–180. [Google Scholar] [CrossRef]
  17. Dhubháin, Á.N.; Cobanova, R.; Karppinen, H.; Mizaraite, D.; Ritter, E.; Slee, B.; Wall, S. The values and objectives of private forest owners and their influence on forestry behaviour: The implications for entrepreneurship. Small-Scale For. 2007, 6, 347–357. [Google Scholar] [CrossRef]
  18. Hatcher, J.E.; Straka, T.J.; Greene, J.L. The size of forest holding/parcelization problem in forestry: A literature review. Resources 2013, 2, 39–57. [Google Scholar] [CrossRef]
  19. Eriksson, L. Åtgärdsbeslut i Privatskogsbruket (Treatment Decisions in Privately Owned Forestry); SLU, Department of Forest Products: Uppsala, Sweden, 2008. (In Swedish) [Google Scholar]
  20. Lidestav, G.; Ekström, M. Introducing gender in studies on management behaviour among non-industrial private forest owners. Scand. J. For. Res. 2000, 15, 378–386. [Google Scholar] [CrossRef]
  21. Lidestav, G.; Berg Lejon, S. Harvesting and silvicultural activities in Swedish family forestry-Behavior changes from a gender perspective. Scand. J. For. Res. 2013, 28, 136–142. [Google Scholar] [CrossRef]
  22. Gustafsson, K.; Hägg, S. Skogliga Konsekvensanalyser 2003 SKA 03; Skogsstyrelsen: Jönköping, Sweden, 2004; p. 52. [Google Scholar]
  23. SLU; Skogsstyrelsen. Skogliga konsekvensanalyser 2008—SKA_VB 08; Skogsstyrelsen: Jönköping, Sweden, 2008; p. 157. [Google Scholar]
  24. A non-response analysis was done by Statistics Sweden, including the background variables sex, age, income, country of origin, citizenship, marital status, residence (same or different municipality compared to forest property) and type of residential place/municipality (such as big city, suburban area, medium big cities, goods-producing municipality, rural areas, and others).
  25. Words in brackets were not present in the questionnaire, but are used to identify the strategies.
  26. Andersson, E. Forest Management Strategies Developed for Private Forest Owners Members in Forest Owner Assiociation Norrskog; Institutionen för Skoglig Resurshushållning, SLU: Umeå, Sweden, 2012; (In Swedish with English Summary). [Google Scholar]
  27. Duncker, P.S.; Barreiro, S.M.; Hengeveld, G.M.; Lind, T.; Mason, W.L.; Ambrozy, S.; Spiecker, H. Classification of forest management approaches: A new conceptual framework and its applicability to European forestry. Ecol. Soc. 2012, 17, 51. [Google Scholar]
  28. Wilhelmsson, E. Enskilda Skogsägarnas Målformulering; SLU, Department of Forest Resource Management: Umeå, Sweden, 2011. (In Swedish) [Google Scholar]
  29. Ingemarson, F. Small-Scale Forestry in Sweden—Owners’ Objectives, Silvicultural Practices and Management Plans; Acta Universitatis Agriculturae Sueciae; Swedish University of Agricultural Sciences: Uppsala, Sweden, 2004. [Google Scholar]
  30. In contrast to some other forest owner studies, the label Passive in our study refers to owners who stated that they manage their forest according to strategy 1, which is a strategy that allows for low intensive forest management operations.
  31. Cohen, J. Statistical Power Analysis for the Behavioral Sciences; Taylor and Francis: Hoboken, NJ, USA, 2013. [Google Scholar]
  32. SLU. Forest Statistics 2013; Institutionen för Skoglig Resurshushållning, SLU: Umeå, Sweden, 2013. [Google Scholar]
  33. Swedish Forest Agency. Swedish Statistical Yearbook of Forestry 2013; Skogsstyrelsen: Jönköping, Sweden, 2013. [Google Scholar]
  34. Bernes, C. Biodiversity in Sweden; Swedish Environmental Protection Agency: Stockholm, Sweden, 2011. [Google Scholar]
  35. Straka, T.J.; Wisdom, H.W.; Moak, J.E. Size of forest holding and investment behavior of nonindustrial private owners. J. For. 1984, 82, 495–496. [Google Scholar]
  36. Suuriniemi, I.; Matero, J.; Hänninen, H.; Uusivuori, J. Factors affecting enlargement of family forest holdings. Silva Fenn. 2012, 46, 253–266. [Google Scholar]
  37. Lidestav, G.; Nordfjell, T. A conceptual model for understanding social practices in family forestry. Small-Scale For. 2005, 4, 391–408. [Google Scholar]
  38. Kindstrand, C.; Norman, J.; Boman, M.; Mattsson, L. Attitudes towards various forest functions: A comparison between private forest owners and forest officers. Scand. J. For. Res. 2008, 23, 133–136. [Google Scholar] [CrossRef]
  39. Karppinen, H. New forest owners and owners-to-be: Apples and oranges? Small-Scale For. 2012, 11, 15–26. [Google Scholar] [CrossRef]

