Article

Effects of Restoration Techniques on Soil Carbon and Nitrogen Dynamics in Florida Longleaf Pine (Pinus palustris) Sandhill Forests

1
Department of Biology, University of Florida, 220 Bartram Hall, Gainesville, FL 32611, USA
2
Eglin Air Force Base, Natural Resources Management, Jackson Guard, Niceville, FL 32578, USA
3
University of Nevada at Reno, 1664 N. Virginia MS 0314, Reno, NV 89557, USA
4
The Nature Conservancy, 100 Peachtree St NW, Suite 2250, Atlanta, GA 30303, USA
5
The Nature Conservancy, 1 E. First Street, suite 1007, Reno, NV 89501, USA
*
Author to whom correspondence should be addressed.
Forests 2014, 5(3), 498-517; https://doi.org/10.3390/f5030498
Submission received: 23 December 2013 / Revised: 27 February 2014 / Accepted: 12 March 2014 / Published: 24 March 2014

Abstract

:
Historic fire suppression and intensive forest management in longleaf pine (Pinus palustris) sandhill forests has resulted in hardwood encroachment and degradation of this fire-dependent ecosystem. Active management is now required to restore native community structure and composition, but little is known about the long-term impacts of typical restoration techniques on ecosystem properties. In 1994, the Longleaf Pine Restoration Project (LPRP) was established in fire-excluded longleaf pine sandhills of Eglin Air Force Base, Florida, to explore the effects of restoration treatments on plant and animal community composition and soil processes. Experimental treatments applied included three hardwood reduction techniques and delayed burn. Reference sites were concurrently monitored. Fifteen years later, we revisited the LPRP plots to determine whether soil processes showed lasting treatment effects. This study showed that there were no differences in soil C and N between the reference and the fire-suppressed plots prior to the treatments, suggesting that soil C and N were relatively resistant to degradation. This study also showed that the restoration treatments had a significant effect by reducing soil C, but this effect was only short-lived (<3 years). In addition, a MRPP (multi-response permutation procedure) analysis showed that only the herbicide treatment was still different from the reference plots 15 years after the initial treatments. Thus, this study suggests that repeated fires (or lack of) or hardwood removal treatments have little detectable effect on soil nutrients in these nutrient-poor ecosystems.

1. Introduction

Prior to European settlement, large parts of the southeastern United States were dominated by fire-maintained longleaf pine (Pinus palustris Mill.) forests [1,2]. Decades of intensive agricultural land use and fire suppression, however, have led to a 97% decline (i.e., from 38 Mha to 1.2 Mha) in the spatial extent of longleaf pine forests [2,3,4]. As a result, these ecosystems are now considered one of the most vulnerable in the United States. Remnants of these forests (i.e., reference forests), however, are still well-represented on Federal lands across the Southeast [2], particularly on military installations that have been protected from suburban or agricultural development.
In their reference state, vegetation and soil processes of longleaf pine forests are structured by short fire-return intervals (e.g., 1–5 years) and low-intensity surface fire [5,6]. Fire suppression in intensively managed forests results in accumulation of forest floor materials and increased abundance of other southern pine (loblolly, shortleaf, and slash pines) and hardwood (Sweetgums, Oaks) species [7,8,9]. In fire-suppressed forests, light penetration to the understory is reduced, altering abundance and diversity of light-demanding understory species such as grasses and forbs, as well as the establishment of longleaf pine seedlings [10,11,12,13,14].
Management techniques frequently used to restore native plant community structure in fire-suppressed or degraded longleaf pine sandhills include herbicide application and mechanical removal of hardwoods, as well as prescribed burning. Short-term effects of these hardwood removal techniques on plant community composition and structure have been well documented in the past [15,16,17,18,19,20,21,22,23,24]. For instance, mechanical removal and herbicide application are generally more efficient than fire at removing overstory and mid-story hardwoods [19,24]. Mechanical removal may need repeated fires to prevent and control hardwood resprouting [19,20], while herbicide application may be detrimental to other species through non-target impacts (e.g., insects, reptiles, etc.) [25,26]. These studies also suggest that burning remains essential for recovery of species richness and species abundance of understory vegetation through control of litter accumulations and reduction in the forest floor [9,20,24].
Although hardwood removal and initiation of prescribed burning should have substantial impacts on forest floor and soil processes—which also affect vegetation dynamics—there have been few studies that have quantified these impacts. Several studies have looked at the short-term effects of prescribed burning on soil nutrients in the forest floor [27,28] and mineral soil horizons [29,30,31,32,33,34,35,36]. These studies have concentrated in more nutrient-rich pine flatwoods and upland longleaf pine forests of the Coastal Plain, but few studies have investigated the impact of hardwood removal techniques or prescribed burning on the soils of xeric degraded longleaf sandhill forests. In a related study, we found that at fine spatial scales degraded sites that had undergone various restoration treatments still had soil C and N concentrations and pools that were consistently greater than those in the reference sites, even after 15 years of restoration treatments [37]. Soil nutrient and carbon dynamics are key controls over vegetation productivity [29,34,38,39,40,41], and understanding how restoration techniques affect soils is important for designing management techniques that restore ecosystem function as well as species composition.
In 1994, the Longleaf Pine Restoration Project (LPRP) was established in fire-suppressed (greater than 20 years) longleaf pine sandhills of Eglin Air Force Base, Northwestern Florida, to explore the effects of restoration treatments on vegetation and faunal community composition and soil processes [19,20,42,43,44,45,46]. Experimental treatments applied included three hardwood reduction techniques (spring burning, herbicide application and chainsaw felling/girdling) and delayed burn (continued fire-suppression until 1999). Reference (i.e., the target for restoration) sites were selected by experts from areas where fire frequency was high and concurrently monitored. Over the last fifteen years of experimental treatment, all plots have been burned repeatedly (both prescribed burning and wildfire) as part of their management (Table 1). To determine how the effects of these treatments played out over longer time-scales, we re-sampled the LPRP experimental and reference plots in 2009, fifteen years after their establishment.
Table 1. Average number of burns (i.e., number of burns divided by number of plots for each period) for the period between 1972 and 1994, and 1995 and 2009 for each treatment.
TreatmentPeriod 1972 to 1995Period 1995 to 2009
Reference2.26.8
Burn-only0.64.2
Delayed burn0.44.0
Herbicide0.65.4
Mechanical0.43.8
The main objectives of our study were three-fold. First, we determined the short-term effects (up to 3-year post treatment) of prescribed fire and hardwood removal treatments on soil C and N concentrations and pools in reference and fire-suppressed plots by analyzing unpublished data from the initial phase of the study (1994–1997). Second, we compared treatment effects between the initial phase and 2009 re-sampling to determine the long-term effects of restoration treatments on soil C and N concentrations and pools. Finally, we examined the long-term effects of restoration treatments on soil N and P mineralization rates, indices not measured in the initial phase of the study, by examining treatment effects present in 2009. To fulfill these objectives, we tested the effects of mechanical removal, herbicide application and burn-only on soil C and N and compared with the delayed burn (continued fire-suppression until 1999) and reference (frequently-burned and target for restoration) plots. All plots were measured prior to treatment in 1994, and were re-sampled two (1996), three (1997), and fifteen years (2009) after initial treatment.

2. Experimental Section

2.1. Study Area

The field study was conducted in xeric longleaf pine sandhill forests located at Eglin Air Force Base. The base, established in 1931, is located in the Florida Panhandle, USA, (30°29’00” N; 86°31’52” W) and covers ~1500 km2 [47]. Soils of the study sites were all typic quartzipsamments of the Lakeland series with a mean depth to water table of 200 cm [48]. The subtropical climate of the area is characterized by warm humid summers and mild winters. Mean annual temperature is 19.8 °C, with mean annual precipitation of 1580 mm [48]. Elevation ranges from 50–100 m above sea level, and all sites have the minimal topography typical of sandhill longleaf pine forests [49].
Eglin Air Force Base is composed of fire-suppressed and frequently-burned sandhill forests. The fire-suppressed areas are generally dominated by turkey oak (Quercus laevis Walter) with longleaf pine (Pinus palustris Mill.), yaupon holly (Ilex vomitoria) and other various deciduous oaks, e.g., sand post oak (Q. margaretta Ashe), blue jack oak (Q. incana Bartram), sand live oak (Q. germinate Small), and laurel oak (Q. laurifolia). The frequently-burned sites, which present conditions consistent with historical reports of relatively unaltered sandhill forests, are mostly co-dominated by longleaf pines and turkey oaks [50]. Both reference and restoration forests are populated with shrubs, forbs and graminoid (see reference [50] for the full list of species).

2.2. Experimental Design

The original experimental design established in spring 1994 consisted of 24 restoration plots in fire-suppressed sandhill forests and six reference (desired conditions) plots in frequently burned longleaf pine-dominated forests [19,20,42]. The restoration plots constituted a randomized complete block design with four 81-ha treatment plots (900 m × 900 m) per block with a total of six blocks. Block #5 of the original study was omitted from our re-sampling due to impacts from a 2006 timber harvest of encroached sand pine (Pinus clausa) leaving five replicate blocks. Within each plot, eight, 10 m × 40 m nested subplots were distributed in four transects with four subplots spaced 10 m apart (2 × 4 = 8) for a total of 16 subplots per plot. Reference plots were divided into three blocks of two 81-ha plots. Each plot was also composed of 16, 10 m × 40 m nested subplots distributed in four transects. Each pair of reference plots was separated by a minimum of 5 km within each block.
Treatments were randomly assigned to plots within blocks and included (1) prescribed growing season fire; (2) mechanical killing of hardwoods (chainsaw felling and girdling, residual biomass left in place); (3) herbicide killing of hardwoods (single application of the ULW form of the herbicide Hexazinone at a rate of 1.68 kg active ingredient per ha; residual biomass left in place); and (4) delayed burn. The initial hardwood removal treatment occurred in 1995. Burn-only treatments were applied in April-June, herbicide in early May and mechanical removal between June and November of 1995. In 1997, after herbicide application and mechanical removal, both treatments received a prescribed fire the following year [19,20,42], as any long-term restoration will require follow-up treatment with frequent fire to reduce fuel build-up resulting from the treatments.
As part of the original study in 1994, four soil cores (30-cm deep) were collected and mixed into one sample from the corners of each 10 × 40-m subplot (i.e., n = 4 per plot) before treatments were applied (fall of 1994), and two (spring and fall of 1996) and three years (spring and fall of 1997) after treatment application. For each sampling, soil samples were transported back to the University of Florida and analyzed by the Analytical Research Laboratory at the University of Florida.
In June 2009, we revisited all restoration and reference plots. Prior to re-sampling, all plots burned several times between 1994 and 2009 (see Table 1 for the fire history of all the plots). All plots were also burned in prescribed fires between January and April 2009. In each plot, we sampled all four transects and for each transect, we sampled four 10 m spaced subplots and bulked the samples (i.e., n = 4 per plot). Contrary to the original soil sampling (i.e., 30-cm deep mineral soil core), at each sampling location, we collected the litter and sampled the mineral soil separately from 0–10 cm and from 10–30 cm. Soil samples were kept on ice for transport back to the University of Florida and kept at 4 °C until processing.
Foliar samples were collected using a shotgun from mature longleaf pines in late December of 2010. A single tree was sampled from each subplot when mature trees were available (some subplots contained no mature longleaf pines). At least twelve samples were taken from each plot. This short window of opportunity limited sampling to 16 of the restoration plots (four complete blocks) and four reference plots (two complete blocks). Foliage was kept frozen once sampled and then transported to the University of Florida for processing.

2.3. Soil Analysis

Soil samples from the original study (1994, 1996 and 1997 samplings) were processed by the Analytical Research Laboratory at the University of Florida. Soil organic matter was determined by the Walkley-Black method and total N by using the micro-Kjeldahl method [51].
For the soil sampling of summer 2009, soils were homogenized and roots, twigs, and green vegetation were removed by hand. From each soil sample, we determined for all soil layers: gravimetric moisture content, bulk density, total soil C and N; and mineral soils only: soil pH, Mehlich P, inorganic N (NO3 -N and NH4+-N), and N mineralization rates.
Total soil C and N were measured on subsamples of initial soil cores using a Costech ECS 4010 Elemental Analyzer (Valencia, CA, USA) and calculated on a dry soil mass (%) and volume basis (e.g., g m−2). Total (C and N) were calculated on a dry soil mass basis. The pH measurements were made in aqueous suspensions (approx. soil:water ratio = 1:2).
To determine Mehlich P (double acid extractable P), soil samples were analyzed by extracting approximately 5 g of air-dried soil with 20 ml of double acid reagent (0.025 N H2SO4 + 0.05 N HCL). The solutions were shaken for 5 min at low speed and spun for about 5 min. Phosphorus extracts were determined using a microplate reader (BioTek Instruments, Inc., Winooski, VT, USA).
To determine N mineralization, soil samples were analyzed for initial and final pools of inorganic N (NO3-N and NH4+-N) by extracting approximately 10 g of field moist soil with 50 mL of 2.0 M KCL [52]. The solutions were shaken for 1 h and left to sit in an air-conditioned room (approx. 23 °C) for 18–24 h and then filtered using a Whatman (GF/A) filter under vacuum. Ammonium and NO3 concentrations in extracts were determined colorimetrically using an Astoria-Pacific colorimetric autoanalyzer (Astoria, OR, USA). Net rates of nitrification and N mineralization for the incubation period (i.e., 30 days) were calculated from the differences in initial and final inorganic N pools divided by the incubation time. All initial N pools and N rates were calculated on a dry soil mass basis (e.g., µg N gdw−1) and volume basis (e.g., g N m−2).
Considering that the differences between the initial and 2009 C concentrations were large enough (i.e., ~70% higher in 2009), we suspected that there was some methodological bias in the initial sampling that resulted in systematically lower C concentrations. These differences may have been due to method of soil preparation, analytic method, or standards used. Unfortunately, no soils were archived, so we were unable to re-analyze initial samples via dry combustion. We also analyzed a subset of 2009 samples via the Walkley Black method, with the analyses done at the same Analytical Research lab, but although we were able to detect a significant (R2 = 0.74, p < 0.05) and linear offset (~0.74) between the two methods, this was not large enough to account for the differences in C concentration between the initial and 2009 samples. Thus, we decided to examine relative differences—rather than absolute differences—among treatments (see Statistics below).

2.4. Foliar Analysis

Foliage was removed from branches, dried at 60 °C for 48–72 h, and ground to a fine powder on a Wiley Mill (Thomas Scientific, Swedesboro, NJ, USA) with a #40 screen. Total foliar C and N were measured on a Costech ECS 4010 Elemental Analyzer (Valencia, CA, USA).

2.5. Statistical Analysis

To account for differences in methodologies between the two-time period for C and CN ratios determination, we examined the relative differences within both datasets to test for the treatment effects. We used this approach because it has been frequently reported that dry combustion processes result in greater C values than chemical oxidation with the Walkley-Black method [53]. A factor of conversion is often used to compensate for the incomplete oxidation of organic C, but the use of this factor has the potential for serious error when estimating the C content of soils. Indeed, this factor of conversion, which is quite variable (1.35 to 14.1; [54]), has been shown to vary with soil type, mineralogy and soil depth [55,56]. Similarly, dry combustion processes have also resulted in greater N values than the Kjeldahl method [57,58]. Thus, considering this limitation, we were unable to test for the effect of time on soil C, N and CN ratios.
Since the reference plots were not part of the five blocks, which include all restoration treatments, and were not spatially randomized, we could not include them in the generalized linear mixed models (GLMM) analysis (see below). Instead, we used a nonparametric multivariate distance technique to compare C, N, and CN ratios of the restoration hardwood reduction treatments to each other and to reference conditions for the pre-treatment (fall 1994) and three post-treatment (spring 1996, 1997, and 2009) samplings. Three plots, a reference, herbicide and delayed burn, were missing post-treatment data for 2009. These three plots were excluded for all four-time periods to ensure consistent comparison, resulting in a total of 101 samples for each time period. To account for the different scales and range of values in the three variables, each variable was relativized by its maximum value so that all variables ranged from 0 to 1. We used multi-response permutation procedure ([MRPP; [59]) as implemented in PC-ORD v5 [60] with Euclidean distance, pairwise comparisons, α = 0.05, and 1000 permutations. MRPP is a distance-based analysis that enabled us to include the reference plots that were not part of the original randomized complete block design. MRPP was run for each of the four time periods using the relativized data with five treatments, including reference, as the grouping variable. The false discovery rate correction (FDR; [61]) was used to correct for multiple pairwise comparisons using the statistical software R [62].
Giving that the MRPP analysis gives an integrated assessment of treatment differences, we also used univariate analysis to interpret the results of the MRPP. Thus, to compare the results (i.e., only top 30 cm of the mineral soil) from the late post-treatment (spring 2009) sampling with the early post-treatment samplings (spring and fall of 1996 and 1997), we used a generalized linear mixed model (GLMM) [63,64] to evaluate the effect of treatment (excluding the reference plots, see above) on total C and N concentrations with pre-treatment (fall of 1994) data as a covariate to account for differences among treatments that existed prior to treatment application. GLMM analysis was also used to evaluate the effect of treatment, depth and their interaction on soil bulk density, soil moisture content, pH, C and N (concentration and pool), and Mehlich P and N mineralization rates for the late post-treatment sampling (spring 2009). GLMM was used as well to test the effect of the interaction between treatment and time (spring 1997 vs. spring 2009) on soil C and N pools, and the effect of treatment on foliar C, N 13C and 15N (spring 2009). All multiple comparisons of means were performed with Tukey adjustments. We computed the p-values with two methods. First, to produce a p-value for a particular fixed-effects term in a GLMM model, we use a likelihood ratio test (LRT). More explicitly, to compare the models, we first fit the model including the term to be tested using maximum likelihood, and then refit the model again without the term tested and compared both models using analysis of variance (ANOVA) [65,66]. We also produced p-values with Wald χ2 tests, which are generally considered better than LTR for testing fixed effects with smaller sample sizes [63]. For simplicity and convenience and also because results from the two methods were highly similar, we presented only the results from the Wald χ2 tests. All analysis were run in the statistical freeware R. For GLMM analysis, the “lme4” package [64] was used, for multiple comparisons, the “multcomp” package [67] was used, while the “ggplot2” package [68] was used for the figures.

3. Results

3.1. Multi-Response Permutation Procedure (MRPP)

Pre-treatment, reference, burn-only, delayed burn, mechanical, and herbicide plots were all similar based on the MRPP analysis of C, N, and CN ratios (Table 2). The first post-treatment analysis (spring 1996) showed that there were significant differences between the reference and all treatments (mechanical p < 0.1). In the second post-treatment analysis (spring 1997) the delayed burn plots differed from the burn-only, mechanical, herbicide (p < 0.1) and reference plots. The mechanical and herbicide (p < 0.1) also differed from the reference plots. For the spring 2009, the MRPP analysis showed differences between the treatments with the burn-only plots differing from the mechanical and herbicide plots, and the herbicide plots differing from the reference plots (Table 2).
Table 2. Results (p-values) associated with the multi-response permutation procedure (MRPP) on pairwise comparisons of soil total C, total N, and CN ratios on restoration treatments and reference sites for pre-treatment (fall of 1994) and post-treatment (spring of 1996, 1997, 2009) samplings. N.S. = not significant.
TreatmentReferenceBurn-onlyDelayed burnHerbicideMechanical
Pre-treatment (fall 1994)
Reference N.S.N.S.N.S.N.S.
Burn-only N.S.N.S.N.S.
Delayed burn N.S.N.S.
Herbicide N.S.
Early Post-treatment (spring 1996)
Reference 0.0030.040.001N.S.
Burn-only N.S.N.S.N.S.
Delayed burn N.S.N.S.
Herbicide 0.099
Early Post-treatment (spring 1997)
Reference N.S.0.0010.0660.001
Burn-only 0.046N.S.N.S.
Delayed burn N.S.0.046
Herbicide N.S.
Late Post-treatment (spring 2009)
Reference N.S.N.S.0.04N.S.
Burn-only N.S.0.0350.04
Delayed burn N.S.N.S.
Herbicide N.S.

3.2. Soil pH, Soil Bulk Density, and Soil Moisture

In the initial (1994–1997) study, pH showed very little variability with no differences between years (4.64 to 4.71; p = 0.5237) or treatments (4.64 to 4.81; p = 0.8623) for the 0–30 cm layer, despite dramatic changes in vegetative cover within the initial treatments [19,20]. In the 2009 post-treatment sampling, only soil pH and bulk density differed with depth (Table 3 and Table 4). However, there was no significant difference among restoration treatments for pH, soil moisture, and bulk density among soil depths. Soil pH showed low variability, with ranges of 4.8–5.4 and 5.1–5.4 respectively for the 0–10 cm and 10–30 cm layer of the mineral soil. In contrast, soil bulk density was more variable with ranges from 0.007 to 0.06 g cm−3 for the litter layer and from 0.7 to 1.4 g cm−3 for the two mineral soil horizons. Soil pH was slightly more acidic in the 0–10 cm (5.04) than the 10–30 cm (5.17) layers while soil bulk density was less in the litter layer (Table 3 and Table 4).
Table 3. Results of a GLMM testing the effect of treatment, depth and interaction treatment × depth on soil pH, soil bulk density, Mehlich P, and soil C and N pools and mineralization rates for the 2009 post-treatment. p-values and degrees of freedom were produced with Wald χ2 tests. The reference treatment was not included in the GLMM testing. N.S. = not significant; W = weight; V = volume.
EffectsdfBulk densityCwNwC:N ratioCvNv
Treatment3N.S.N.S.0.0339<0.0001N.S.N.S.
Depth2<0.0001<0.0001<0.0001<0.0001<0.0001<0.0001
T × D6N.S.N.S.<0.00010.0023N.S.0.0554
NO3wNO3vNH4+wNH4+vN nitwN nitv
Treatment30.02000.01450.00220.00240.00090.0070
Depth1N.S.<0.0001<0.0001<0.0001N.S.N.S.
T × D3N.S.N.S.0.0188N.S.N.S.N.S.
Net N minwNet N minvPwPvpHMoisture
Treatment3N.S.N.S.0.0152N.S.N.S.N.S.
Depth10.00170.0065<0.00010.0350<0.0001N.S.
T × D3N.S.N.S.0.0283N.S.N.S.N.S.

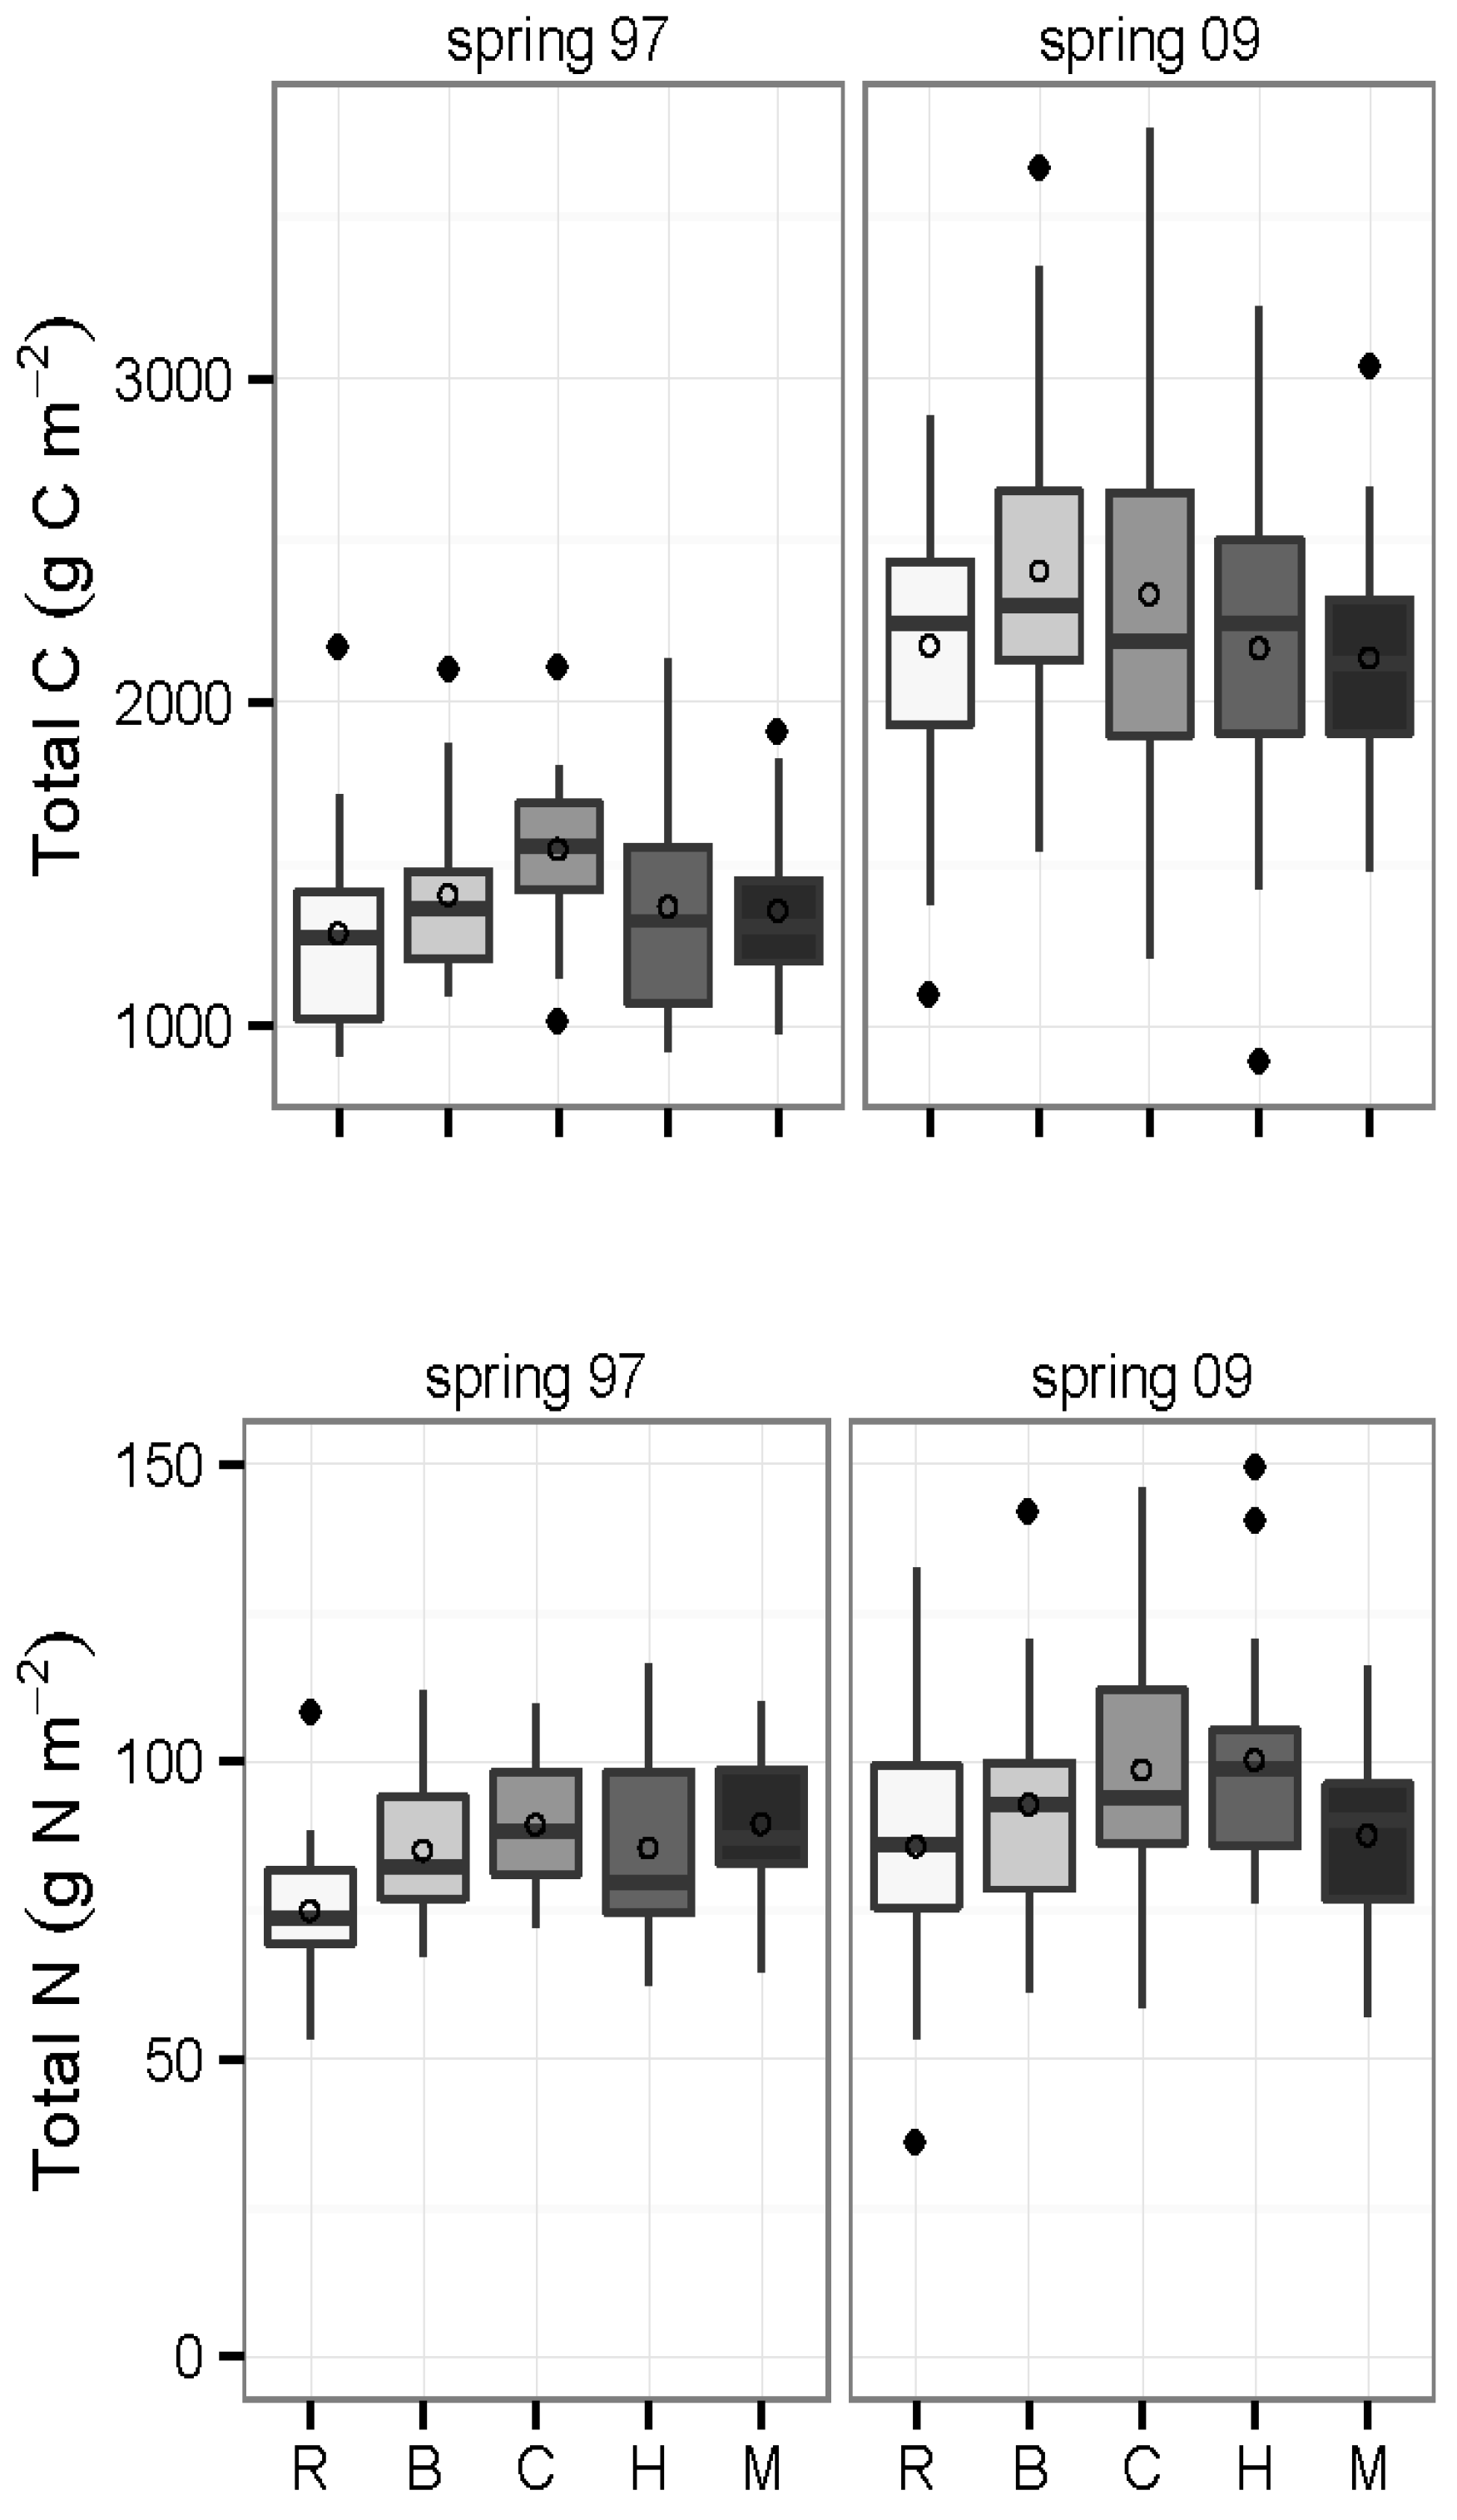
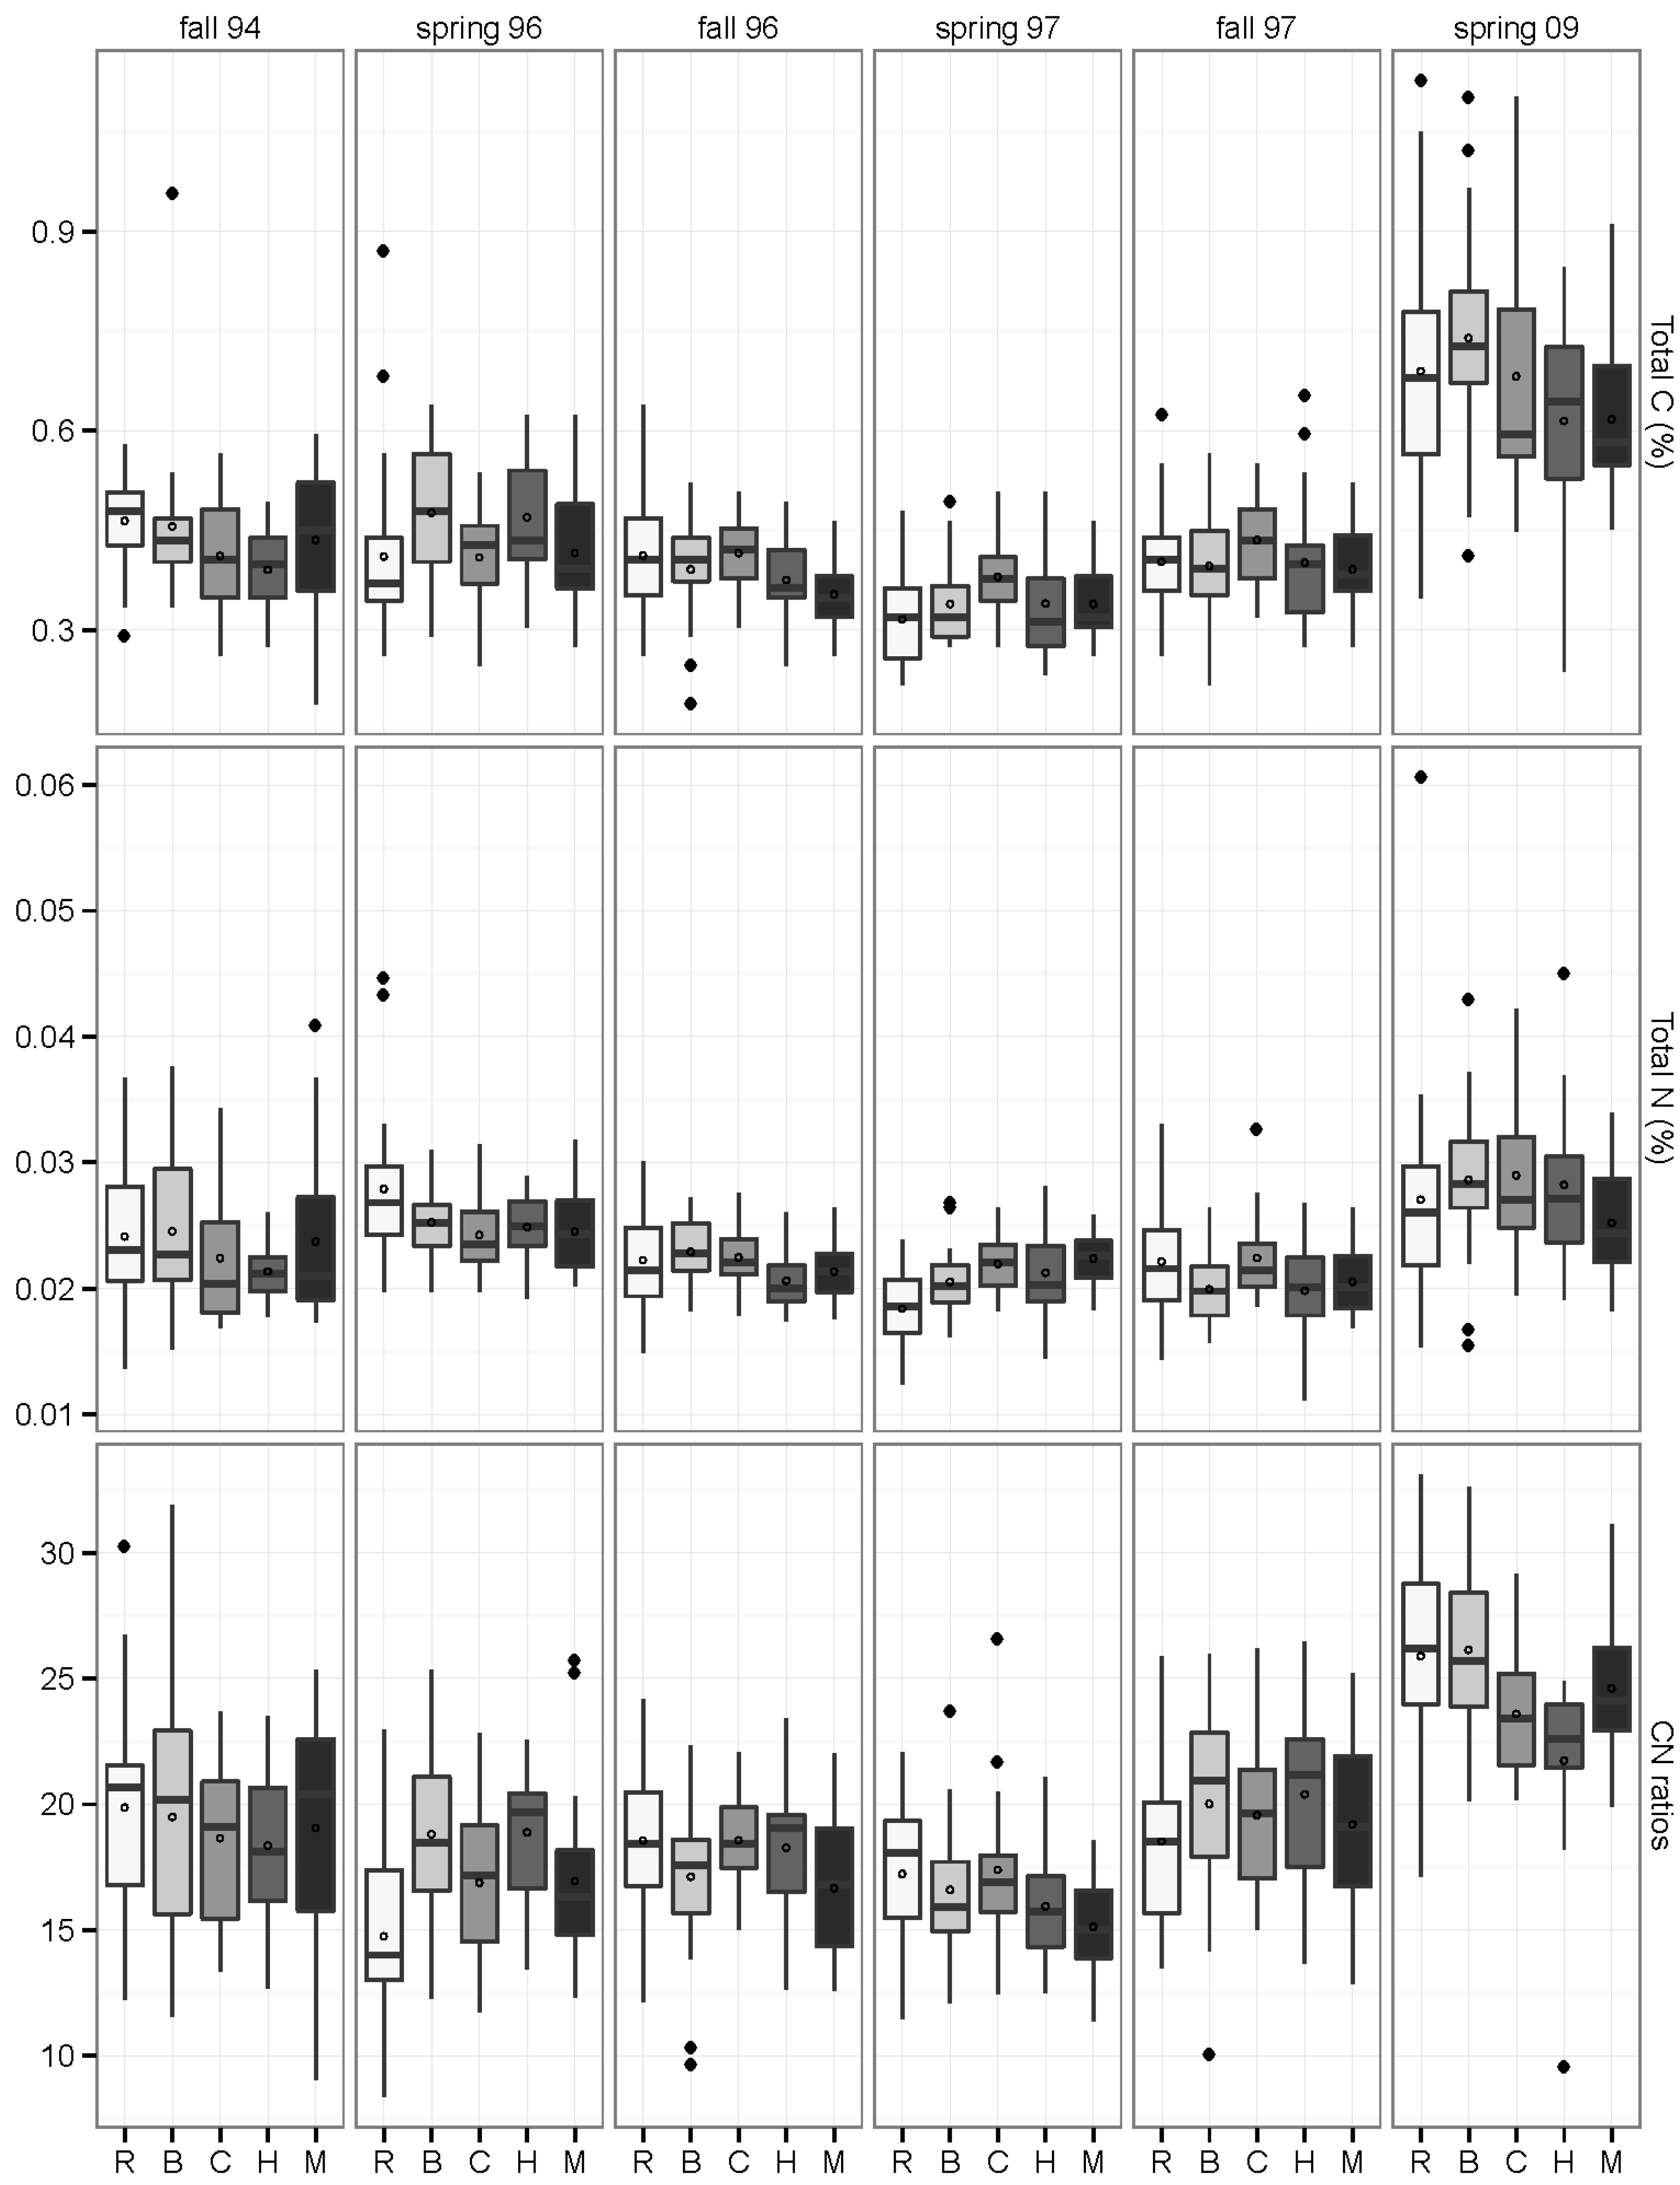
3.3. Carbon and Nitrogen Concentrations and Pools

In the initial sampling effort (1994–1997), bulk soil C concentration was significantly lower during spring 1997 (~ 20% lower) than fall 1994 and spring 1996 (p < 0.0001) with no treatment effect (p = 0.1885; reference plots excluded) on C concentration (Figure 1). Nitrogen (%) also showed some variability between the years with differences between 1997 (spring and fall), and fall 1994 and spring 1996 (p < 0.0001), with also no treatment effect (p = 0.3407; Figure 1). CN ratios were greater during fall 1997 (~ 15%) than spring 1997 (p < 0.0001), and similar to C and N, restoration treatments had no significant effect (p = 0.2626; Figure 1). As for the 2009 sampling (when 0–10 and 10–30 cm layers were combined), the effects of treatment (reference plots excluded) were statistically significant for CN ratios (p = 0.0013) and only marginally significant for soil C (p = 0.0710), with the herbicide plots being 16% and 13% respectively lower than the burn-only plots (Figure 1).
In the 2009 post-treatment sampling, we also measured three soil horizons, the litter, and the 0–10 cm and 10–30 cm mineral layers. These three layers were combined in the initial study. In the 2009 post-treatment sampling, treatment (reference plots excluded) and depth interacted significantly only for total N and CN ratios (Table 3). As expected, concentrations of C and N and CN ratios were significantly greater in the litter layer than the mineral soil horizons while C and N pools were higher in the mineral horizons (Table 3 and Table 4). The effect of treatment was more variable and specific to each soil layer (Table 4). There were no significant differences between restoration treatments in concentration of C and in total C pool, whereas our results were different for N (%); for the litter layer, total N (%) was greater (~17%) in the delayed burn and herbicide than the burn-only plots; for the 0–10 cm and 10–30 cm there was no difference between the treatments (Table 4). In addition, the effect of restoration treatment on the CN ratio for the litter layer was greater (~22%) in the burn-only than the delayed burn and herbicide plots (Table 4).
Table 4. Means and standard errors of soil characteristics for reference (not included in the GLMM testing) and restoration plots in longleaf pine forests at EAFB, Florida for summer 2009. Means for treatment or depth with the same letter do not differ at p < 0.05. NM = not measured.
ReferenceBurn-onlyDelayed burnHerbicideMechanical
Bulk Density (g cm−3)
Litter a0.031 (0.003)0.037 (0.006) a0.028 (0.001) a0.022 (0.005) a0.027 (0.002) a
Min 0–10 cm b0.98 (0.07)0.94 (0.04) a1.01 (0.05) a1.07 (0.05) a1.03 (0.04) a
Min 10–30 cm c1.15 (0.09)1.18 (0.06) a1.20 (0.03) a1.26 (0.04) a1.22 (0.03) a
pH
LitterNMNMNMNMNM
Min 0–10 cm a5.03 (0.05)4.98 (0.06) a5.10 (0.08) a5.06 (0.07) a5.05 (0.03) a
Min 10–30 cm b5.21 (0.05)5.15 (0.02) a5.13 (0.03) a5.18 (0.02) a5.19 (0.05) a
C (%)
Litter a51.12 (0.90)50.21 (0.64) a49.73 (0.58) a50.28 (1.13) a50.03 (0.37) a
Min 0–10 cm b1.23 (0.17)1.27 (0.09) a1.06 (0.10) a0.97 (0.05) a0.96 (0.03) a
Min 10–30 cm c0.45 (0.03)0.52 (0.04) a0.53 (0.05) a0.46 (0.02) a0.48 (0.02) a
N (%)
Litter a0.57 (0.03)0.60 (0.05) b0.72 (0.04) a0.70 (0.01) a0.64 (0.02) ab
Min 0–10 cm b0.046 (0.007)0.047 (0.003) a0.045 (0.003) a0.042 (0.002) a0.038 (0.002) a
Min 10–30 cm c0.019 (0.001)0.021 (0.002) a0.022 (0.001) a0.022 (0.002) a0.020 (0.001) a
CN ratio
Litter a95.3 (3.1)87.3 (6.2) a69.9 (6.4) c73.6 (1.5) bc80.9 (1.8) ab
Min 0–10 cm b27.8 (0.7)26.9 (1.4) a23.6 (0.5) a23.2 (0.6) a25.8 (0.7) a
Min 10–30 cm b24.0 (0.7)24.5 (1.0) a23.6 (0.8) a21.1 (0.3) a23.7 (0.8) a
C pool (g m−2)
Litter a158.7 (17.4)187.4 (31.6) a140.6 (6.4) a108.3 (22.9) a135.4 (9.5) a
Min 0–10 cm b1139.7 (71.4)1209.7 (63.0) a1055.2 (87.0) a1013.6 (53.0) a972.7 (43.2) a
Min 10–30 cm b1032.5 (103.0)1194.0 (69.4) a1276.0 (128.6) a1151.4 (78.5) a1162.8 (59.9) a
N pool (g m−2)
Litter a1.96 (0.24) a2.28 (0.43) a2.13 (0.16) a1.52 (0.32) a1.80 (0.17) a
Min 0–10 cm c39.5 (1.96) a45.2 (2.82) a44.7 (3.31) a43.5 (1.67) a38.1 (2.40) a
Min 10–30 cm b43.3 (4.42) b47.6 (2.60) a53.7 (3.75) a56.3 (4.46) a49.4 (2.60) a
Moisture (%)
LitterNMNMNMNMNM
Min 0–10 cm a0.02 (0.01)0.07 (0.05) a0.03 (0.04) a0.05 (0.02) a0.03 (0.01) a
Min 10–30 cm a0.03 (0.01)0.05 (0.01) a0.04 (0.01) a0.03 (0.01) a0.04 (0.01) a
We also compared the C and N pools of the 1997 post-treatment sampling with the 2009 post-treatment sampling (0–30 cm; Figure 2). There was no interaction effect for C (p = 0.6674) or N (p = 0.2319) pools. Similarly, there was no difference between restoration plots for C (p = 0.1595) and N (p = 0.4448). Thus, these results suggest that the difference in C or N pools among the restoration treatments (excluding the reference) did not change between the two studies.
Figure 1. Box plots of soil total C (%), total N (%), and CN ratios for longleaf pine forests at Eglin Air Force Base, Florida. The boundary of the box plot closest to zero indicates the 25th percentile, the line within the box marks the median, the open circle indicates the mean, and the boundary of the box plot farthest from zero indicates the 75th percentile. Error bars above and below indicate the 90th and 10th percentile. Means (open circles) for treatments (Reference not included in the GLMM analysis) with the same letter do not differ at p < 0.05. R = reference; B = burn-only; C = delayed burn; H = herbicide; M = mechanical.
Forests 05 00498 g001
Figure 2. Box plots of C and N pools (0–30 cm mineral soil layer) for longleaf pine forests at Eglin Air Force Base, Florida, USA. The boundary of the box plot closest to zero indicates the 25th percentile, the line within the box marks the median, the open circle indicates the mean, and the boundary of the box plot farthest from zero indicates the 75th percentile. Error bars above and below indicate the 90th and 10th percentile. Means (open circles) for treatments (Reference not included in the GLMM analysis) with the same letter do not differ at p < 0.05. R = reference; B = burn-only; C = delayed burn; H = herbicide; M = mechanical.
Forests 05 00498 g002

3.4. Inorganic N and Mineralization Rates: 2009

Extractable NO3 and NH4+ concentrations and pools and nitrification rates were generally low in all plots and were more variable than C and N. Ammonium (mass basis) showed a significant interaction between treatment (excluding the reference) and depth, with concentrations of NH4+ greater in the 0–10-cm layer of delayed burn plots (Table 3 and Table 5). Ammonium (volume basis) was greater in the delayed burn than the burn-only and mechanical treatments while NO3 (mass and volume basis) was greatest in the herbicide plots (Table 5). Nitrification rates were significantly lower in the herbicide plots than in the delayed burn plots as well (Table 5). There was also a significant depth effect, with greater values in the 0–10 cm layer for NH4+ concentrations and pools, and N min rates (Table 3).
Table 5. Means and standard errors of inorganic N and N mineralization, and P for reference (not included in the GLMM testing) and restoration plots in longleaf pine forests at EAFB, Florida for summer 2009. Means for treatment and depth with the same letter (capital letter was used when the two soil horizons were combined) do not differ at p < 0.05.
ReferenceBurn-onlyDelayed burnHerbicideMechanical
NH4 (µg NH4 gdw−1)
Min 0–10 cm a1.14 (0.19)1.64 (0.16) b2.60 (0.45) a1.81 (0.31) b1.48 (0.17) b
Min 10–30 cm b0.91 (0.07)1.08 (0.12) a1.29 (0.13) a1.27 (0.16) a0.97 (0.09) a
NO3 (µg NO3 gdw−1)
Min 0–10 cm a0.12 (0.05)0.25 (0.06) B0.22 (0.06) B0.41 (0.10) A0.25 (0.08) B
Min 10–30 cm a0.15 (0.01)0.32 (0.08)0.31 (0.08)0.36 (0.12)0.24 (0.05)
NH4 (g NH4 m−2)
Min 0–10 cm a0.12 (0.02)0.15 (0.02) B0.27 (0.05) A0.19 (0.04) AB0.15 (0.02) B
Min 10–30 cm b0.22 (0.03)0.24 (0.02)0.32 (0.04)0.32 (0.04)0.24 (0.02)
NO3 (g NO3 m−2)
Min 0–10 cm a0.012 (0.004)0.022 (0.006) B0.022 (0.008) B0.045 (0.011) A0.026 (0.008) B
Min 10–30 cm b0.036 (0.005)0.075 (0.022)0.075 (0.022)0.102 (0.029)0.059 (0.012)
Nitrification (µg NO3 kg−1d−1)
Min 0–10 cm a9.67 (3.64)8.80 (8.63) AB18.98 (12.22) A−7.66 (7.96) B4.47 (5.10) B
Min 10–30 cm a13.92 (4.62)5.24 (6.65)18.23 (14.06)−2.66 (5.96)−2.03 (2.77)
N min (µg N min kg−1d−1)
Min 0–10 cm a16.95 (6.02)10.22 (9.65) a9.97 (6.72)a5.59 (7.54) a10.84 (7.64) a
Min 10–30 cm b−3.19 (7.23)−5.42 (7.10) a3.47 (14.43)a−13.87 (11.70)a−13.57 (3.39) a
Nitrification (mg NO3 m−2d−1)
Min 0–10 cm a0.97 (0.41)0.83 (0.82)AB1.68 (1.21) A−0.85 (0.83) B0.49 (0.49) B
Min 10–30 cm a2.92 (7.18)0.76 (1.67)4.30 (3.31)−0.73 (1.43)−0.53 (0.70)
N min (mg N min m−2d−1)
Min 0–10 cm a1.60 (0.64)0.81 (0.82) a0.92 (0.65) a0.33 (0.75) a1.04 (0.78) a
Min 10–30 cm b−1.29 (1.43)−1.58 (1.89) a0.73 (3.44) a–3.40 (1.25) a−3.39 (0.82) a
P (µg gdw−1)
Min 0–10 cm a0.89 (0.12)0.68 (0.08) b1.26 (0.34) a0.68 (0.04) b0.73 (0.05) b
Min 10–30 cm b0.34 (0.03)0.38 (0.05)a0.48 (0.08) a0.41 (0.07) a0.37 (0.05) a
P (g m−2)
Min 0–10 cm a0.088 (0.013)0.067 (0.008) a0.131 (0.043) a0.075 (0.009) a0.075 (0.062) a
Min 10–30 cm b0.084 (0.008)0.109 (0.021) a0.121 (0.018) a0.129 (0.039) a0.090 (0.011) a

3.5. Mehlich Phosphorus

Concentrations and pools of Mehlich P ranged from 0.23–2.29 µg P gdw−1 and from 0.04–0.30 g m−2 respectively. Concentrations of Mehlich P were significantly greater (on average about twice) in the 0–10 cm horizon while the opposite was true for concentration scaled to pool size (Table 3 and Table 5). Only in the 0–10 cm layer were P concentrations greater in the delayed burn than in the burn-only (0.58 µg P gdw−1 lower), herbicide (0.58 µg P gdw−1 lower) and mechanical (0.53 µg P gdw−1 lower) treatments (Table 3 and Table 5).

3.6. Foliar C and N, 13C and 15N

Longleaf pine foliar C (%) ranged from 49.7% to 51.7% and there was no difference (p = 0.4688) among treatments. Similarly, total N (%) did not differ between restoration treatments (p = 0.5192) and ranged from 0.8% to 1.1%. Hardwood removal or prescribed burning did not affect either foliar 13C (p = 0.4573) or 15N (p = 0.2945). At last, foliar 13C and 15N expressed very little variability as they ranged from −28.5 to −27.4 (‰) and from −5.1 to −3.5 (‰) respectively.

4. Discussion

We found no differences in soil nutrients between the reference and the fire-suppressed plots prior to the treatment implementation. This result was slightly unexpected given the structural changes in forest communities [19,20,42] but was consistent with earlier studies [30,31,36,69,70] that found little or no short-term effect of repeated fires on soil nutrients in nutrient-poor systems. This would also suggest that soil C and N are relatively resistant to degradation. All plots expressed very low soil fertility and the reference plots were burned ~4x more than the fire-suppressed plots during the 25-year period prior to the treatments.
We also found that the restoration treatments were effective in reducing soil C values. Differences between reference and most treatment plots were short-lived (<3 years). In the herbicide treatment, however, differences persisted 15 years. We suggest that early differences between the reference and the burn-only, mechanical and herbicide plots were likely the result of a pulse of nutrients released into the soil following restoration treatments, perhaps caused by decomposition and nutrient release from cutting, burning, or herbiciding of the oak overstory and midstory in the fire-suppressed plots [25]. In addition, winter 1996 is also considered as the largest mast year ever recorded for longleaf pine cone production, thus providing additional litter on the forest floor in all plots, which were all burned in 1997. In contrast, we would argue that the absence of fire explains the difference between the delayed burn (the delayed burn plots were burned only starting in 2000 after the conclusion of the initial study) and the other plots (including reference). The persistent dissimilarity between the herbicide, and the reference and the burn-only plots over the years is harder to explain considering that all the treatments were subjected to several fires (i.e., between 4 and 7) over the 15-year period. There was not a clear trend in the percentage of ground cover between the treatments [71]. A possible scenario that would explain this difference is that the decrease in oak overstory and midstory was more extensive in the herbicide than the other treatments [25], thus providing additional litter on the forest floor which could have led to more severe fires in these plots and potentially greater C losses.
We also examined the long-term effects of restoration treatments on soil N and P mineralization rates, indices not measured in the initial phase of the study. Extractable N and N mineralization rates were generally low in all the plots, and representative of a nutrient-poor pine forest [34,35]. In addition, there was no specific pattern for treatment or depth; for example NH4+ (volume basis) was greater in the delayed burn, NO3 (dry soil mass and volume basis) was greater in the herbicide plots, while nitrification rates were lower in the herbicide and mechanical plots, although the latter may be an artifact of high initial NO3 concentrations. These results were different from Lavoie et al. [37], but Lavoie et al. [37] only used one block while five complete blocks were used in this study, thus possibly capturing a different nutrient pattern present at a larger spatial scale. It is also well known that extractable N and N mineralization rates are very dynamic [33]. Thus, temporal variability could also explain the discrepancy between the two studies since soil sampling of this study was undertaken in early June, at the onset of the rainy season [49], while Lavoie et al. [37] was carried out in early August.
No differences were significant for any foliage characteristics (i.e., C (%), N (%), 13C and 15N). The results were consistent with Boyer and Miller [32; foliar N], Samuelson et al. ([72]; 13C), and Binkley et al. ([31]; foliar N).

5. Conclusions

Contrary to our initial expectations, there were few differences in soil C or nutrients between the reference and degraded, fire-suppressed plots prior to the restoration treatments. In addition, the short- and long-term effects of fire and hardwood removal treatments on soil and foliar characteristics were minor, with the exception of the herbicide treatment. These results were concordant with earlier studies and confirm that soil C and N are relatively resistant to degradation and that repeated fires or hardwood removal treatments have few detectable impacts on soil nutrients in this study area. We also examined the long-term effects of restoration treatments on soil N and P mineralization rates, and foliar nutrients but we found no systematic evidence of treatment effects. The herbicide treatment did show some changes in nitrification, which may be related to the reduction in CN ratio. The lack of responsiveness of this longleaf pine ecosystem to restoration of fire and changes in forest structure may result from the already low levels of nutrients present in these soils and relatively variable distribution of those resources seasonally and spatially. In addition, our work suggests that forest soils in longleaf pine sandhill forests may be buffered against changes in disturbance regime and resilient to altered fire regimes, which may result from climate change or human intervention.

Acknowledgments

The authors are thankful to Amanda Steen from the Joseph W. Jones Ecological Center and Brett Williams from Jackson Guard at Eglin Air Force Base for field assistance. We also thank Jenny Schafer, Jennie Demarco, Grace Cummer, and Julia Reiskind for laboratory assistance and Doria Gordon for valuable assistance. This research was supported by the Strategic Environmental Research and Development Program (Grant # 09 RC01-001). Thanks to the Department of Defense and the longleaf Pine Restoration Project (The Nature Conservancy, Tall Timbers Research Station, and the University of Florida).

Conflicts of Interest

The authors declare no conflict of interest.

References

  1. Stanturf, J.A.; Wade, D.D.; Waldrop, T.A.; Kennard, D.K.; Achtemeir, G.L. Fire in Southern Forest Landscapes. In Southern Forest Resource Assessment: Summary Report; Station General Technical Report SRS-54; Wear, D.N., Greis, J.G., Eds.; United States Department of Agriculture, Forest Service Southern Research: Asheville, NC, USA, 2002; pp. 607–630. [Google Scholar]
  2. Frost, C.C. History and future of the longleaf pine ecosystem. In The Longleaf Pine Ecosystem: Ecology, Silviculture, and Restoration; Springer series on Environmental Management; Jose, J., Jokela, E.J., Miller, D.L., Eds.; Springer: New York, NY, USA, 2006; pp. 9–48. [Google Scholar]
  3. Frost, C.C. Four centuries of changing landscape patterns in the longleaf pine ecosystem. In Proceedings of the Tall Timbers Fire Ecology Conference No. 18, the Longleaf Pine Ecosystem: Ecology, Restoration and Management; Hermann, S.M., Ed.; Tall Timbers Research Station: Tallahassee, FL, USA, 1993; pp. 17–43. [Google Scholar]
  4. Noss, R.F.; LaRoe, E.T.; Scott, J.M. Endangered Ecosystems of the United States: A Preliminary Assessment of Loss and Degradation; United States Department of Interior National Biological Service, Biological Report 28; United States Department of Interiors: Washington, DC, USA, 1995.
  5. Chapman, H.H. Is the longleaf type a climax? Ecology 1932, 45, 328–334. [Google Scholar] [CrossRef]
  6. Garren, K.H. Effects of fire on vegetation of the Southeastern United States. Bot. Rev. 1943, 9, 617–654. [Google Scholar] [CrossRef]
  7. Gilliam, F.S.; Platt, W.J. Effects of long-term fire exclusion on tree species composition and stand structure in an old-growth Pinus palustris (Longleaf pine) forest. Plant Ecol. 1999, 140, 15–26. [Google Scholar] [CrossRef]
  8. Van Lear, D.H.; Carroll, W.D.; Kapeluck, P.R.; Johnson, R. History and restoration of the longleaf pine-grassland ecosystem: Implications for species at risk. For. Ecol. Manag. 2005, 211, 150–165. [Google Scholar] [CrossRef]
  9. Hiers, J.K.; O’Brien, J.J.; Will, R.E.; Mitchell, R.J. Forest floor depth mediates understory vigor in xeric Pinus palustris ecosystems. Ecol. Appl. 2007, 17, 806–814. [Google Scholar] [CrossRef]
  10. Heyward, F. The relation of fire to stand composition of longleaf pine forests. Ecology 1939, 20, 287–304. [Google Scholar] [CrossRef]
  11. Bruce, D. Thirty-two years of annual burning in longleaf pine. J. For. 1947, 45, 809–814. [Google Scholar]
  12. McGuire, J.P.; Mitchell, R.J.; Moser, E.B.; Pecot, S.D.; Gjerstad, D.H.; Hedman, C.W. Gap in a gappy forest: Plant resources response to tree removal in longleaf pine savannas. Can. J. For. Res. 2011, 31, 765–778. [Google Scholar]
  13. Varner, J.M., III; Gordon, D.R.; Putz, F.E.; Hiers, J.K. Restoring fire to long-unburned Pinus palustris ecosystems: Novel fire effects and consequences for long-unburned ecosystems. Restor. Ecol. 2005, 13, 536–544. [Google Scholar] [CrossRef]
  14. Hu, H.; Wang, G.G.; Walker, J.L.; Knapp, B.O. Silvicultural treatments for converting loblolly pine to longleaf pine dominance: Effects on resource availability and their relationships with planted longleaf pine seedlings. For. Ecol. Manag. 2012, 282, 115–123. [Google Scholar] [CrossRef]
  15. Harrington, T.B.; Edwards, M.B. Understory vegetation, resource availability, and litterfall responses to pine thinning and woody vegetation control in longleaf pine plantations. Can. J. For. Res. 1999, 29, 1055–1064. [Google Scholar] [CrossRef]
  16. Kush, J.S.; Meldahl, R.S.; Boyer, W.D. Understory plant community response after 23 years of hardwood control treatments in natural longleaf pine (Pinus palustris) forests. Can. J. For. Res. 1999, 29, 1047–1054. [Google Scholar] [CrossRef]
  17. Brockway, D.G.; Outcalt, K.W.; Wilkins, R.N. Restoring longleaf pine wiregrass ecosystems: Plant cover, diversity and biomass following low-rate hexazinone application on Florida sandhills. For. Ecol. Manag. 1998, 103, 159–175. [Google Scholar] [CrossRef]
  18. Brockway, D.G.; Outcalt, K.W. Restoring longleaf pine wiregrass ecosystems: Hexazinone application enhances effects of prescribed fire. For. Ecol. Manag. 2000, 137, 121–138. [Google Scholar] [CrossRef]
  19. Provencher, L.; Herring, B.J.; Gordon, D.R.; Rodgers, H.L.; Tanner, G.W.; Hardesty, J.L.; Brennan, L.A.; Litt, A.R. Longleaf pine and oak responses to hardwood reduction techniques in fire-suppressed sandhills in northwest Florida. For. Ecol. Manag. 2001, 148, 63–77. [Google Scholar] [CrossRef]
  20. Provencher, L.; Herring, B.J.; Gordon, D.R.; Rodgers, H.L.; Galley, K.E.M.; Tanner, G.W.; Hardesty, J.L.; Brennan, L.A. Effects of hardwood reduction techniques on longleaf pine sandhill vegetation in northwest Florida. Restor. Ecol. 2001, 9, 13–27. [Google Scholar] [CrossRef]
  21. Archer, J.K.; Miller, D.L.; Tanner, G.W. Changes in understory vegetation and soil characteristics following silvicultural activities in a southeastern mixed pine forest. J. Torrey Bot. 2007, 134, 489–504. [Google Scholar] [CrossRef]
  22. Haywood, J.D. Influence of pine straw harvesting, prescribed fire, and fertilization on a Louisiana longleaf pine site. South. J. Appl. For. 2009, 33, 115–120. [Google Scholar]
  23. Jose, S.; Ranasinghe, S.; Ramsey, C.L. Longleaf pine (Pinus palustris P. Mill.) restoration using herbicides: Overstory and understory vegetation responses on a coastal plain flatwoods site in Florida, USA. Restor. Ecol. 2010, 18, 244–251. [Google Scholar]
  24. Outcalt, K.W.; Brockway, D.G. Structure and composition changes following restoration treatments of longleaf pine forests on the Gulf Coastal Plain of Alabama. For. Ecol. Manag. 2010, 259, 1615–1623. [Google Scholar] [CrossRef]
  25. Steen, D.A.; Smith, L.L.; Conner, L.M.; Litt, A.R.; Provencher, L.; Hiers, J.K.; Pokswinski, S.; Guyer, C. Reptile assemblage response to restoration of fire-suppressed longleaf pine sandhills. Ecol. Appl. 2013, 23, 148–158. [Google Scholar] [CrossRef]
  26. Steen, D.A.; Conner, L.M.; Smith, L.L.; Provencher, L.; Hiers, J.K.; Pokswinski, S.; Helms, B.S.; Guyer, C. Birds assemblage response to restoration of fire-suppressed longleaf pine sandhills. Ecol. Appl. 2013, 23, 134–147. [Google Scholar] [CrossRef]
  27. Hough, W.A. Impact of Prescribed Fire on Understory and Forest Floor Nutrients; Research Note SE-303; United States Department of Agriculture, Forest Service, Southeastern Forest Experiment Station: Asheville, NC, USA, 1981.
  28. DiStefano, J.F.; Gholz, H.L. Controls over net inorganic nitrogen transformations in an age sequence of Pinus. elliottii plantations in North Florida. For. Sci. 1989, 35, 920–934. [Google Scholar]
  29. Christensen, N.L. Fire and soil-plant nutrient relations in a pine-wiregrass savanna on the coastal plain of North Carolina. Oecologia 1977, 31, 27–44. [Google Scholar] [CrossRef]
  30. Abrahamson, W.G. Post-recovery of Florida Lake Wales Ridge vegetation. Am. J. Bot. 1984, 71, 9–21. [Google Scholar] [CrossRef]
  31. Binkley, D.; Richter, D.; David, M.B.; Caldwell, B. Soil chemistry in a loblolly/longleaf pine forest with interval burning. Ecol. Appl. 1992, 2, 157–164. [Google Scholar] [CrossRef]
  32. Boyer, W.D.; Miller, J.H. Effect of burning and brush treatments on nutrient and soil physical properties in young longleaf pine stands. For. Ecol. Manag. 1994, 70, 311–318. [Google Scholar] [CrossRef]
  33. Wilson, C.A.; Mitchell, R.J.; Hendricks, J.J.; Boring, L.R. Patterns and controls of ecosystem function in longleaf pine—Wiregrass savannas. II. Nitrogen dynamics. Can. J. For. Res. 1999, 29, 752–760. [Google Scholar] [CrossRef]
  34. Wilson, C.A.; Mitchell, R.J.; Boring, L.R.; Hendricks, J.J. Soil nitrogen dynamics in a fire-maintained forest ecosystem: Results over a 3-year burn interval. Soil Biol. Biochem. 2002, 34, 679–689. [Google Scholar] [CrossRef]
  35. Boring, L.R.; Hendricks, J.J.; Wilson, C.A.; Mitchell, R.J. Season of burn and nutrient losses in a longleaf pine ecosystem. Int. J. Wildland Fire 2004, 13, 443–453. [Google Scholar] [CrossRef]
  36. Lavoie, M.; Starr, G.; Mack, M.C.; Martin, T.A.; Gholz, H.L. Effects of a prescribed fire on understory vegetation, carbon pools, and soil nutrients in a longleaf pine-slash pine forest in Florida. Nat. Areas J. 2010, 30, 82–94. [Google Scholar] [CrossRef]
  37. Lavoie, M.; Mack, M.C.; Hiers, J.K.; Pokswinski, S. The effects of restoration treatments on the spatial variability of soil processes under longleaf pine trees. Forests 2012, 3, 591–604. [Google Scholar] [CrossRef]
  38. Palik, B.J.; Mitchell, R.J.; Houseal, G.; Pederson, N. Effects of canopy structure on resource availability and seedling responses in a longleaf pine ecosystem. Can. J. For. Res. 1997, 27, 1458–1464. [Google Scholar] [CrossRef]
  39. Mitchell, R.J.; Kirkman, L.K.; Pecot, S.D.; Wilson, C.A.; Palik, B.J.; Boring, L.R. Patterns and controls of ecosystems function in longleaf pine—Wiregrass savannas. I. Aboveground net primary productivity. Can. J. For. Res. 1999, 29, 743–751. [Google Scholar] [CrossRef]
  40. Carter, M.C.; Foster, C.D. Prescribed burning and productivity in southern pine forests: A review. For. Ecol. Manag. 2004, 191, 93–109. [Google Scholar] [CrossRef]
  41. Ford, C.R.; Mitchell, R.J.; Teskey, R.O. Water table depth affects productivity, water use, and the response to nitrogen addition in savanna system. Can. J. For. Res. 2008, 38, 2118–2127. [Google Scholar] [CrossRef]
  42. Provencher, L.; Litt, A.R.; Galley, K.E.M.; Gordon, D.R.; Tanner, G.W.; Brennan, L.A.; Gobris, N.M.; McAdoo, S.J.; McAdoo, J.P.; Herring, B.J. Restoration of Fire-Suppressed Longleaf Pine Sandhills at Eglin Air Force Base, Florida; Final Report to Natural Resources Management Division; Eglin Air Force Base: Niceville, Florida, Science Division; The Nature Conservancy: Gainesville, FL, USA, 2001.
  43. Provencher, L.; Gobris, N.M.; Brennan, L.A.; Gordon, D.R.; Hardesty, L. Breeding bird response to midstory hardwood reduction in Florida sandhill longleaf pine forests. J. Wildl. Manag. 2002, 66, 641–661. [Google Scholar] [CrossRef]
  44. Provencher, L.; Gobris, N.M.; Brennan, L.A. Effects of hardwood reduction on winter birds in northwest Florida longleaf pine sandhill forests. Auk 2002, 119, 71–87. [Google Scholar]
  45. Provencher, L.; Galley, K.E.M.; Litt, A.R.; Gordon, D.R.; Brennan, L.A.; Tanner, G.W.; Hardesty, J.L. Fire, herbicide, and chainsaw felling effects on arthropods in fire-suppressed longleaf pine sandhills at Eglin Air Force Base, Florida. In The Role of Fire in Nongame Wildlife Management and Community Restoration: Traditional Uses and New Directions Proceedings of a Special Workshop; General Technical Report NE-288; Ford, W.M., Russell, K.R., Moorman, C.E., Eds.; United States Department of Agriculture, Forest Service Northern Research Station: Nashville, TN, USA, 2002; pp. 24–34. [Google Scholar]
  46. Litt, A.R.; Provencher, L.; Tanner, G.W.; Franz, R. Herpetofaunal responses to restoration treatments of longleaf pine sandhills in Florida. Restor. Ecol. 2001, 9, 462–474. [Google Scholar] [CrossRef]
  47. Eglin Air Force Base, U.S. Air Force. Available online: http://www.eglin.af.mil/ (accessed on 22 December 2013).
  48. Overing, J.D.; Weeks, H.H.; Wilson, J.P.; Sullivan, J.; Ford, R.D. Soil Survey of Okaloosa Country, Florida. US Department of Agriculture; Natural Resource Conservation Service: Washington, DC, USA, 1995.
  49. Myers, R.L. Schrub and high pine. In Ecosystem of Florida; Myers, R.L., Ewel, J., Eds.; University of Florida Presses: Gainesville, FL, USA, 1990; pp. 174–193. [Google Scholar]
  50. Rodgers, H.L.; Provencher, L. Analysis of longleaf pine sandhill vegetation in northwest Florida. Castanea 1999, 64, 138–162. [Google Scholar]
  51. Mylavarapu, R.; Kennelley, E. UF/IFAS Extension Soil Testing Laboratory (ESTL) Analytical Procedures and Training Manual; University of Florida: Gainesville, FL, USA, 2002. [Google Scholar]
  52. Keeney, D.R.; Nelson, D.W. Nitrogen—Inorganic forms. In Methods of Soil Analysis. Part 2—Chemical and Microbial Properties, 2nd ed.; Page, A.L., Miller, R.H., Keeney, D.R., Eds.; Soil Science Society of America: Madison, WI, USA, 1982; pp. 643–698. [Google Scholar]
  53. Bisutti, I.; Hilke, I.; Raessler, M. Determination of total organic carbon—An overview of current methods. TRAC-Trend Anal. Chem. 2004, 23, 716–726. [Google Scholar] [CrossRef]
  54. Pribyl, D.W. A critical review of the conventional SOC to SOM conversion factor. Geoderma 2010, 156, 75–83. [Google Scholar] [CrossRef]
  55. Perié, C.; Ouimet, R. Organic carbon, organic matter and bulk density relationships in boreal forest soils. Can. J. Soil Sci. 2008, 88, 315–325. [Google Scholar] [CrossRef]
  56. Chatterjee, A.; Lal, R.; Wielopolski, L.; Martin, M.Z.; Ebinger, M.H. Evaluation of different soil carbon determination methods. Crit. Rev. Plant Sci. 2009, 28, 164–178. [Google Scholar] [CrossRef]
  57. Pereira, M.G.; Espindula, A.; Valladeres, G.S.; Cunha dos Anjos, L.H.; de Melo Benites, V.; Schultz, N. Comparison of total nitrogen methods applied for histosols and soil horizons with high organic matter content. Commun. Soil Sci. Plant 2006, 37, 939–943. [Google Scholar] [CrossRef]
  58. Dieckow, J.; Mielniczuk, J.; Knicker, H.; Bayer, C.; Dick, D.P.; Kogel-Knabner, I. Comparison of carbon and nitrogen determination methods for samples of a paleudult subjected to no-till cropping systems. Sci. Agric. 2007, 64, 532–540. [Google Scholar]
  59. McCune, B.; Grace, J.B. Analysis of Ecological Communities; MjM Software Design: Gleneden Beach, OR, 2002. [Google Scholar]
  60. McCune, B.; Mefford, M.J. PC-ORD, Multivariate Analysis of Ecological Data; Version 5 for Windows Edition; MjM Software Design: Gleneden Beach, OR, USA, 2006. [Google Scholar]
  61. Benjamini, Y.; Yekutieli, D. The control of the false discovery rate in multiple testing under dependency. Ann. Stat. 2001, 29, 1165–1188. [Google Scholar] [CrossRef]
  62. R Development Core Team. R: A Language and Environment for Statistical Computing; R Foundation for Statistical Computing: Vienna, Austria, 2012. [Google Scholar]
  63. Bolker, B.M.; Brooks, M.E.; Clark, C.J.; Geange, S.W.; Poulsen, J.R.; Stevens, M.H.H.; White, J.-S.S. Generalized linear mixed models: A practical guide for ecology and evolution. Trends Ecol. Evol. 2009, 24, 127–135. [Google Scholar] [CrossRef]
  64. Bates, D.; Maechler, M.; Bolker, B. lme4.0: Linear Mixed-Effects Models Using S4 Classes. R Package Version 0.9999-1/r1692. 2012. Available online: http://R-Forge.R-project.org/projects/lme4/ (accessed on 2 August 2012).
  65. Crawley, M.J. The R Book; John Wiley & Sons Ltd: Chichester, UK, 2007. [Google Scholar]
  66. Zuur, A.; Ieno, E.N.; Walker, N.; Saveiliev, A.A.; Smith, G.M. Mixed Effects Models and Extensions in Ecology with R; Springer: New York, NY, USA, 2009. [Google Scholar]
  67. Hothorn, T.; Bretz, F.; Westfall, P. Simultaneous inference in general parametric models. Biom. J. 2008, 50, 346–363. [Google Scholar] [CrossRef]
  68. Wickham, H. ggplot2: Elegant Graphics for Data Analysis; R Package Version 2.0.9.1; Springer: Berlin, Germany, 2009. [Google Scholar]
  69. Anderson, R.C.; Menges, E.S. Effects of fire on sandhill herbs: Nutrients, mycorrhizae, and biomass allocation. Am. J. Bot. 1997, 84, 938–948. [Google Scholar] [CrossRef]
  70. Alexis, M.A.; Rasse, D.P.; Rumpel, C.; Bardoux, G.; Péchot, N.; Schmalzer, P.; Drake, B.; Mariotti, A. Fire impact on C and N losses and charcoal production in a scrub oak ecosystem. Biogeochemistry 2007, 82, 201–216. [Google Scholar] [CrossRef]
  71. Steen, D.A.; Smith, L.L.; Morris, G.; Conner, L.M.; Litt, A.R.; Pokswinski, S.; Guyer, C. Response of Six-Lined Racerunner (Aspidoscelis sexlineata) to habitat restoration in fire-suppressed longleaf pine (Pinus palustris) sandhills. Rest. Ecol. 2013, 21, 457–473. [Google Scholar] [CrossRef]
  72. Samuelson, L.J.; McLemore, P.C., III; Somers, G.L. Relationship between foliar δ13C and hydraulic pathway length in Pinus palustris. For. Sci. 2003, 49, 790–798. [Google Scholar]

