Article

Transformation of a Degraded Pinus massoniana Plantation into a Mixed-Species Irregular Forest: Impacts on Stand Structure and Growth in Southern China

1
Key Laboratory for Silviculture and Conservation of Ministry of Education, Beijing Forestry University, Beijing 100083, China
2
Institute of Forest Resource and Information Techniques, Chinese Academy of Forestry, Beijing 100091, China
3
Experimental Center for Tropical Forestry, Chinese Academy of Forestry, 532600, Pingxiang City, Guangxi Zhuang Autonomous Region 532600, China
*
Author to whom correspondence should be addressed.
Forests 2014, 5(12), 3199-3221; https://doi.org/10.3390/f5123199
Submission received: 8 October 2014 / Revised: 4 December 2014 / Accepted: 4 December 2014 / Published: 12 December 2014

Abstract

:
We transformed a Pinus massoniana plantation, the most important conifer plantation in southern China, with four different transformation treatments, in which Pinus massoniana was thinned to a density of 70%, and then differing richness and compositions of enrichment plantings were added. In order to examine the effects of the transformation, we compared species composition, stand structure and growth pattern in transformed stands with those in control stands. The results suggested that in the transformed stands species composition was diverse with trees both from the enrichment plantings and from natural recruitment. The size structure was changed such that the diameter at breast height (DBH) distribution tended to shift from a nearly normal distribution to an irregular multi-modal distribution. Substantial new ingrowth was found in the small DBH classes. The residual trees in the transformed stands were significantly larger than in the control treatment. However, for all trees, the control stands had the largest mean size, even though the residual tree growth was significantly smaller in the control stands. Finally, transformation treatment A4, which had the smallest overall mortality rate and simultaneously the mortality rate of each tree species was smaller than the corresponding value in other transformation treatments, was identified as the optimal transformation.

1. Introduction

Pinus massoniana, one of the most prevalent plantation tree species in southern China, covers a total area of 12 million hectares and accounts for 7.74% of the total arboreal forest area in China [1]. Similar to other plantations, this monoculture conifer stand suffers from relatively low stability, low ecological services, and high susceptibility to disturbance [2,3]. For example, in February 2008 about 18 million hectares of plantation in the subtropical regions of China were affected by heavy sleet and ice, causing economic losses on the order of magnitude of 57.3 billion Chinese Yuan (around 9.3 billion US Dollar) [4]. The even-aged stand structure is thought to be responsible for instability and vulnerability [5,6,7].
In Central Europe, transforming single-species even-aged conifer stands into more irregular uneven-aged stand structures of multiple species has been widely adopted by foresters [8,9,10]. Stands of mixed species will not only continue to have economic value but will also provide a range of benefits, including greater resilience to climate change, increased wind stability, and improved biodiversity value [2,11,12]. Facing worsening environmental problems and increasing demands for ecological benefits from forest ecosystems, the forest sector in China has gradually started to focus on multi-purpose management rather than only on timber production as in the past [4,13]. Transforming single-species even-aged plantation to uneven-aged mixed forest is the first step in multi-purpose forest management [14,15].
As early as 1996, pure plantation transformation with the objective of constructing a more realistically natural forest was first proposed in China by Zhang et al., who suggested that near natural forest management is an important management alternative for sustainable forest development [16]. The first transformation experiment was carried out by Wang et al., who found a significant increase in easily decomposable litter and the formation of a sub-layer dominated by broad-leaved trees only three years after transformation [17]. Subsequent studies in many parts of China mainly focused on plantation species including Pinus yunnanensis [18,19], Larix olgensis [20], and Pinus tabulaeformis [21,22]. The studies all concluded that compared to control stands, transformed stands were improved in terms of species diversity, forest structure and soil quality. However, for Cunninghamia lanceolata and Pinus massoniana, the most significant plantation species in southern China, few transformation experiments were performed, though there were some articles addressing the necessity and feasibility of this transformation for multi-functional forest management [23,24].
In 2005, the Chinese Academy of Forestry converted a Cunninghamia lanceolata plantation into a mixed-species irregular forest by bringing in seedlings of more than 20 hardwoods prized for their timber on its experimental forest farm (Tropical forest research center, South China) [25]. The initial encouraging effect was recognized both nationally and internationally [25]. Building on this success, we then decided to transform the other most important regional plantation, dominated by Pinus massoniana, into a mixed-species irregular forest with different transformation treatments. We hypothesized that there would be an optimal transformation treatment which could significantly improve the stand quality compared to other treatments. Therefore, the objective of this paper are to (1) explore the species composition, stand structure and growth pattern in the transformed stands compared with control stands; (2) identify the optimal transformation treatment and (3) give corresponding suggestions for future forest management schemes.

2. Materials and Methods
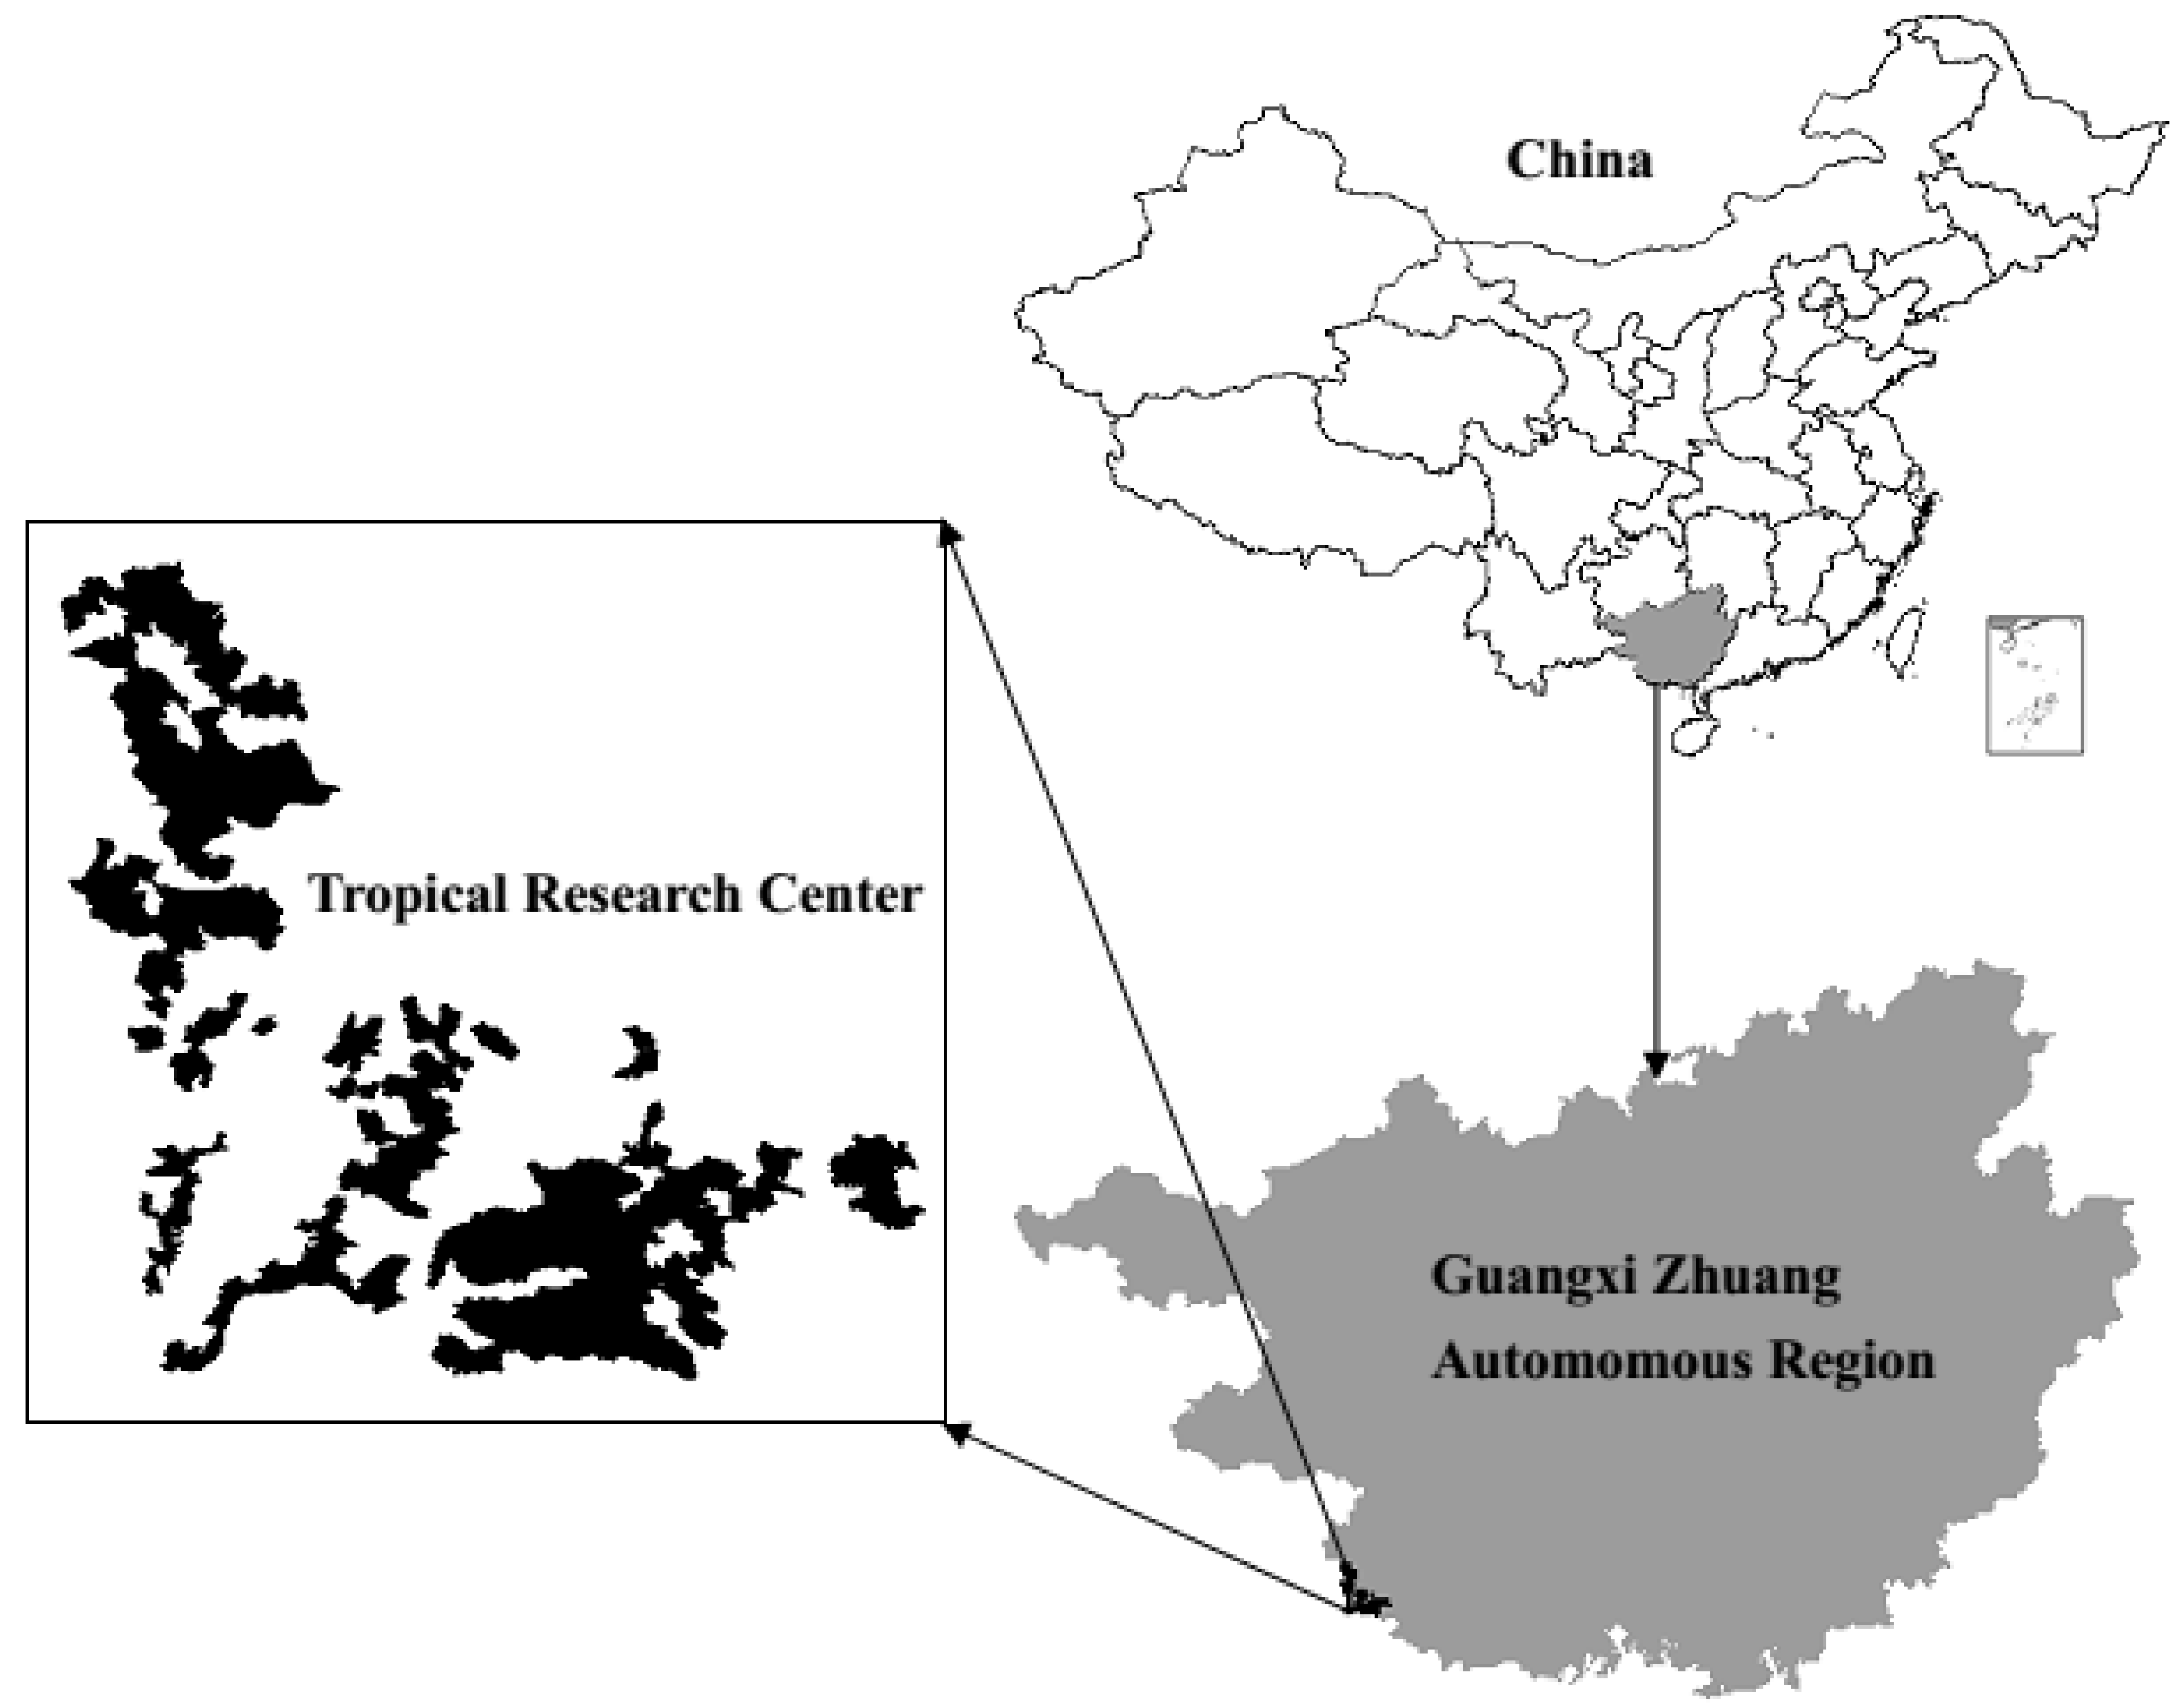
2.1. Study Area

Our study was conducted in the Tropical Forest Research Center in Pingxiang City (found in the rectangle defined by 21°57′ N to 22°16′ N, 106°41′ E to 109°59′ E), located in the southwest of the Guangxi Zhuang Autonomous Region in south China (Figure 1). The southern subtropical humid climate has an annual average air temperature of 20.5–21.7 °C, and ranges from 13 °C to 28 °C. The annual precipitation averages 1386 mm. Elevations range from between 250 and 800 m and slopes range between 25% and 30%. The dominant parent rocks of soils are volcanic rock, granite, purple sand-shale, and sandstone. Forest soils are primarily a lateritic mountain soil and purplesoil [26]. The main vegetation types are Pinus massoniana, Cunninghamia lanceolata and broad-leaved plantation [27].
Figure 1. The location of the study area. Our research was conducted in a tropical research center in Guangxi Zhuang Autonomous Region, China.
Forests 05 03199 g001

2.2. Experimental Design and Plot Establishment

We established five model stands with five different silvicultural treatments. Four of these treatments, designated A1, A2, A3, and A4, were the transformation treatments, in which Pinus massoniana was thinned to a density of 70%, and then differing richness and compositions of enrichment plantings were added. The thinning was from above. We selected 30% of total trees as future crops based on the stem quality and tree vigor and then the remaining 70% trees were removed, which inhibit the good crown development of the future crop trees. The fifth treatment was the control where no management was conducted (Table 1).
Table 1. Target forest and enrichment planting species for transformation treatments.
TreatmentTarget ForestEnrichment SpeciesEnrichment Density (n∙ha1)Spacing (m)
A1Pinus massoniana with 2 broad-leaved treesCastanopsis hystrix3503.5 × 4
Magnoliaceae glanca350
A2Pinus massoniana with 2 broad-leaved treesErythrophleum fordii4063 × 4
Quercus griffithii406
A3Pinus massoniana with 3 broad-leaved treesQuercus griffithii2193 × 4
Castanopsis hystrix375
Magnoliaceae glanca219
A4Pinus massoniana with 4 broad-leaved treesCastanopsis hystrix 1633 × 5
Magnoliaceae glanca163
Erythrophleum fordii163
Quercus griffithii163
A5 (Control)Pure Pinus massoniana plantation 0
The enrichment plantings were various species of one-year-old seedlings with heights ranging from 20 to 30 cm. All of the four species used (Castanopsis hystrix, Erythrophleum fordii, Magnoliaceae glanca and Quercus griffithii) were native to the region and either economically valuable or ecologically valuable. For instance, Castanopsis hystrix and Erythrophleum fordii were hardwoods prized for their timber [28,29,30]. Quercus griffithii was able to improve soil quality due to its large amount of easily decomposable litter as well as nitrogen fixation by its nodule bacteria [31,32]. Magnoliaceae glanca, which belonged to the Magnoliaceae family that had good stem form and timber quality, was of economical value [33]. The different densities in which these different species were planted (Table 1) were based on information from a long-term local reforestation trial using different broad-leaved tree species in different densities. Each of the five treatments was replicated four times on different sites in a randomized block design. The area of each block was ~3 ha. These four sites were distributed on different slope position and slope aspect. Site 1 was on the foot of a northeast-facing slope; site 2 was on the foot of a south-facing slope; site 3 was on the back slope of a southwest-facing slope; site 4 was on the back of a northeast-facing slope. Site 1 ranked first in terms of fertility and water availability followed by site 2, site 4 and site 3. The stands in all the four sites were established in 1993. The initial number of trees was 1350, 1175, 1100 and 1325 per hectare for sites 1–4 and the corresponding basal area was 34.8, 33.7, 33.1 and 34.5 m2∙ha−1. The transformations involving heavy thinning and enrichment plantings were conducted in early spring 2008 as outlined in Table 1. We established 5 plots in each block once the transformation was finished. The plots were circular with areas of 0.040 ha. In each plot we recorded the diameter at breast height (DBH at 1.3 m), height and location of all trees greater than 5 cm in DBH. We also measured the height and ground diameter of the enrichment saplings. All the trees and saplings were identified to the species level. We measured the understory saplings every year and the overstory trees every two years. Following Robert [34], in the present study overstory was defined as trees with 5 cm diameter or greater, whereas understory referred to saplings with 1 cm or over and less than 5 cm diameter.

2.3. Analysis

2.3.1. Species Composition and Forest Structure

In each treatment, species composition was analyzed for both the overstory and the understory and reported in terms of number of tree species, number of stems and proportion. Trees/ha (stand density), volume/ha, basal area/ha, mean DBH, mean basal area, and mean value of each index of stand structure were calculated for each plot. Tree volume was calculated using the following formulas developed specially for this region: V = 0.714265437 × 10⁻⁴ D1.867008H0.9014632 (for Pinus massoniana), V = 0.667054 × 10⁻⁴ D1.84795450H0.96657509 (for broad-leaved tree species). The diameter distribution was compared between 2008 and 2014 for each treatment to investigate the change in stand structure.

2.3.2. Growth Pattern

In order to investigate the growth pattern, ingrowth, survival growth and mortality were analyzed for Pinus massoniana, enrichment planting and natural regenerations, respectively. Ingrowth is the number or volume of trees that grew into the lowest diameter class of 5 cm during the growth study period. Survival growth refers to the growth of residual trees which were present in both inventories. For enrichment plantings and natural regenerations, ingrowth and mortality were examined between 2008 and 2014, whereas survival growth was investigated between 2010 and 2014, as there were no trees falling into the 5-cm diameter class in 2008. For Pinus massoniana, the growth pattern was analyzed between 2008 and 2014.

2.3.3. Statistical Analysis

An analysis of mean values was conducted on two groups of trees: (1) all trees present both in 2008 and 2014 and (2) trees present in 2008 and still alive in 2014 (i.e., residual trees). Comparisons between years to assess changes in DBH, basal area, and volume over the course of the study were performed using paired t-tests for each treatment. Two-way analysis of variance (ANOVA) was used to test for significant changes in size due to treatment or block effects. Pairwise comparisons among treatments were done using t-tests with a Bonferroni’s adjustment to account for multiple comparisons. All analyses were carried out using R v.2.14.2 statistical software (R Foundation for Statistical Computing, Vienna, Austria).

3. Results

3.1. Species Composition

3.1.1. Overstory Species Composition

In 2008, after the transformation and enrichment planting, Pinus massoniana was the only tree species in the overstory, whether in the four transformation treatments or the control treatment. After six years of conversion, the transformation treatments were successful in shifting the single species composition towards a multiple species composition (Table 2). Pinus massoniana accounted for 43.5%, 39.3%, 41.1%, and 45.5% of total trees and 91.2%, 81.6%, 87.1% and 89.0% of total basal area in the four management treatments, respectively. Trees derived from the enrichment plantings and from natural regeneration had grown into the overstory. For instance, in the A2 treatment, the enrichment tree species Quercus griffithii and Erythrophleum fordii accounted for 43.8% of the total trees and the natural regenerated tree species accounted for 17.0%, though they only made up 14.7% and 3.6% of the total basal area. Furthermore, Pinus massoniana was not the most dominant tree species any longer, being replaced by Quercus griffithii. In contrast, in the control treatment Pinus massoniana accounted for 98.4% of the total trees and almost no natural regeneration occurred into the overstory.
Table 2. Species composition in the overstory of different treatment stands in 2014.
TreatmentSpecies CategoryNumber of Tree SpeciesNumber of Stems (n∙ha−1)Proportion (%)Basal Area (m2∙ha−1)Proportion (%)
A1Pinus massoniana1837543.522.691.2
Castanopsis hystrix18821.70.73.0
Magnoliaceae glanca758.70.51.8
Others (15 from natural regeneration)22526.11.04.0
A2Quercus griffithii1528140.23.314.4
Pinus massoniana27539.318.981.6
Erythrophleum fordii253.60.10.3
Others (12 from natural regeneration)11917.00.83.6
A3Pinus massoniana1733141.122.287.1
Magnoliaceae glanca23128.71.45.6
Quercus griffithii698.50.83.0
Castanopsis hystrix445.40.20.7
Others (13 from natural regeneration)13116.30.93.7
A4Pinus massoniana1734445.522.989.0
Quercus griffithii13818.21.34.9
Castanopsis hystrix699.10.31.1
Magnoliaceae glanca638.30.41.7
Erythrophleum fordii131.70.00.1
Others (12 from natural regeneration)13117.40.83.2
A5 (Control)Pinus massoniana3117598.444.399.9
Schefflera actinophylla131.10.00.1
Evodia lepta60.50.00.0

3.1.2. Understory Species Composition

After the transformation and enrichment planting in 2008, the understory in management treatments was diversified by the enrichment planted tree species (Table 1). In contrast, there were neither natural nor planted trees in the understory of the control treatment. After six years of conversion, the understory of the transformation treatments was more diversified not only by the enrichment planting but also by tree species from natural regeneration (Table 3). For instance, in the A4 treatment, the enrichment tree species Quercus griffithii, Erythrophleum fordii, Magnoliaceae glance, and Erythrophleum fordii accounted for 51.4% of the total trees and the other 48.6% consisted of species that naturally regenerated (Table 3). In contrast, for the control treatment there were still nearly no trees in the understory.
Table 3. Species composition in the understory of different treatment stands in 2014.
TreatmentSpecies CategoryNumber of Tree SpeciesNumber of Stems (n∙ha−1)Proportion (%)Basal Area (m2∙ha1)Proportion (%)
A1Castanopsis hystrix116330.00.132.9
Magnoliaceae glanca4421.20.124.3
Others (9 from natural regeneration)10048.50.142.8
A2Quercus griffithii863.60.06.2
Erythrophleum fordii8146.40.139.1
Others (6 from natural regeneration)8850.00.154.7
A3Magnoliaceae glanca106325.60.132.9
Quercus griffithii62.60.03.2
Erythrophleum fordii135.10.06.6
Others (7 from natural regeneration)16066.70.157.4
A4Quercus griffithii12135.70.04.5
Erythrophleum fordii3114.30.020.8
Magnoliaceae glanca2511.40.09.7
Erythrophleum fordii4420.00.013.8
Others (8 from natural regeneration)10648.60.151.3
A5 (Control)Aluerites fordii3715.60.013.9
Schefflera actinophylla3066.70.053.2
Evodia lepta817.80.032.9

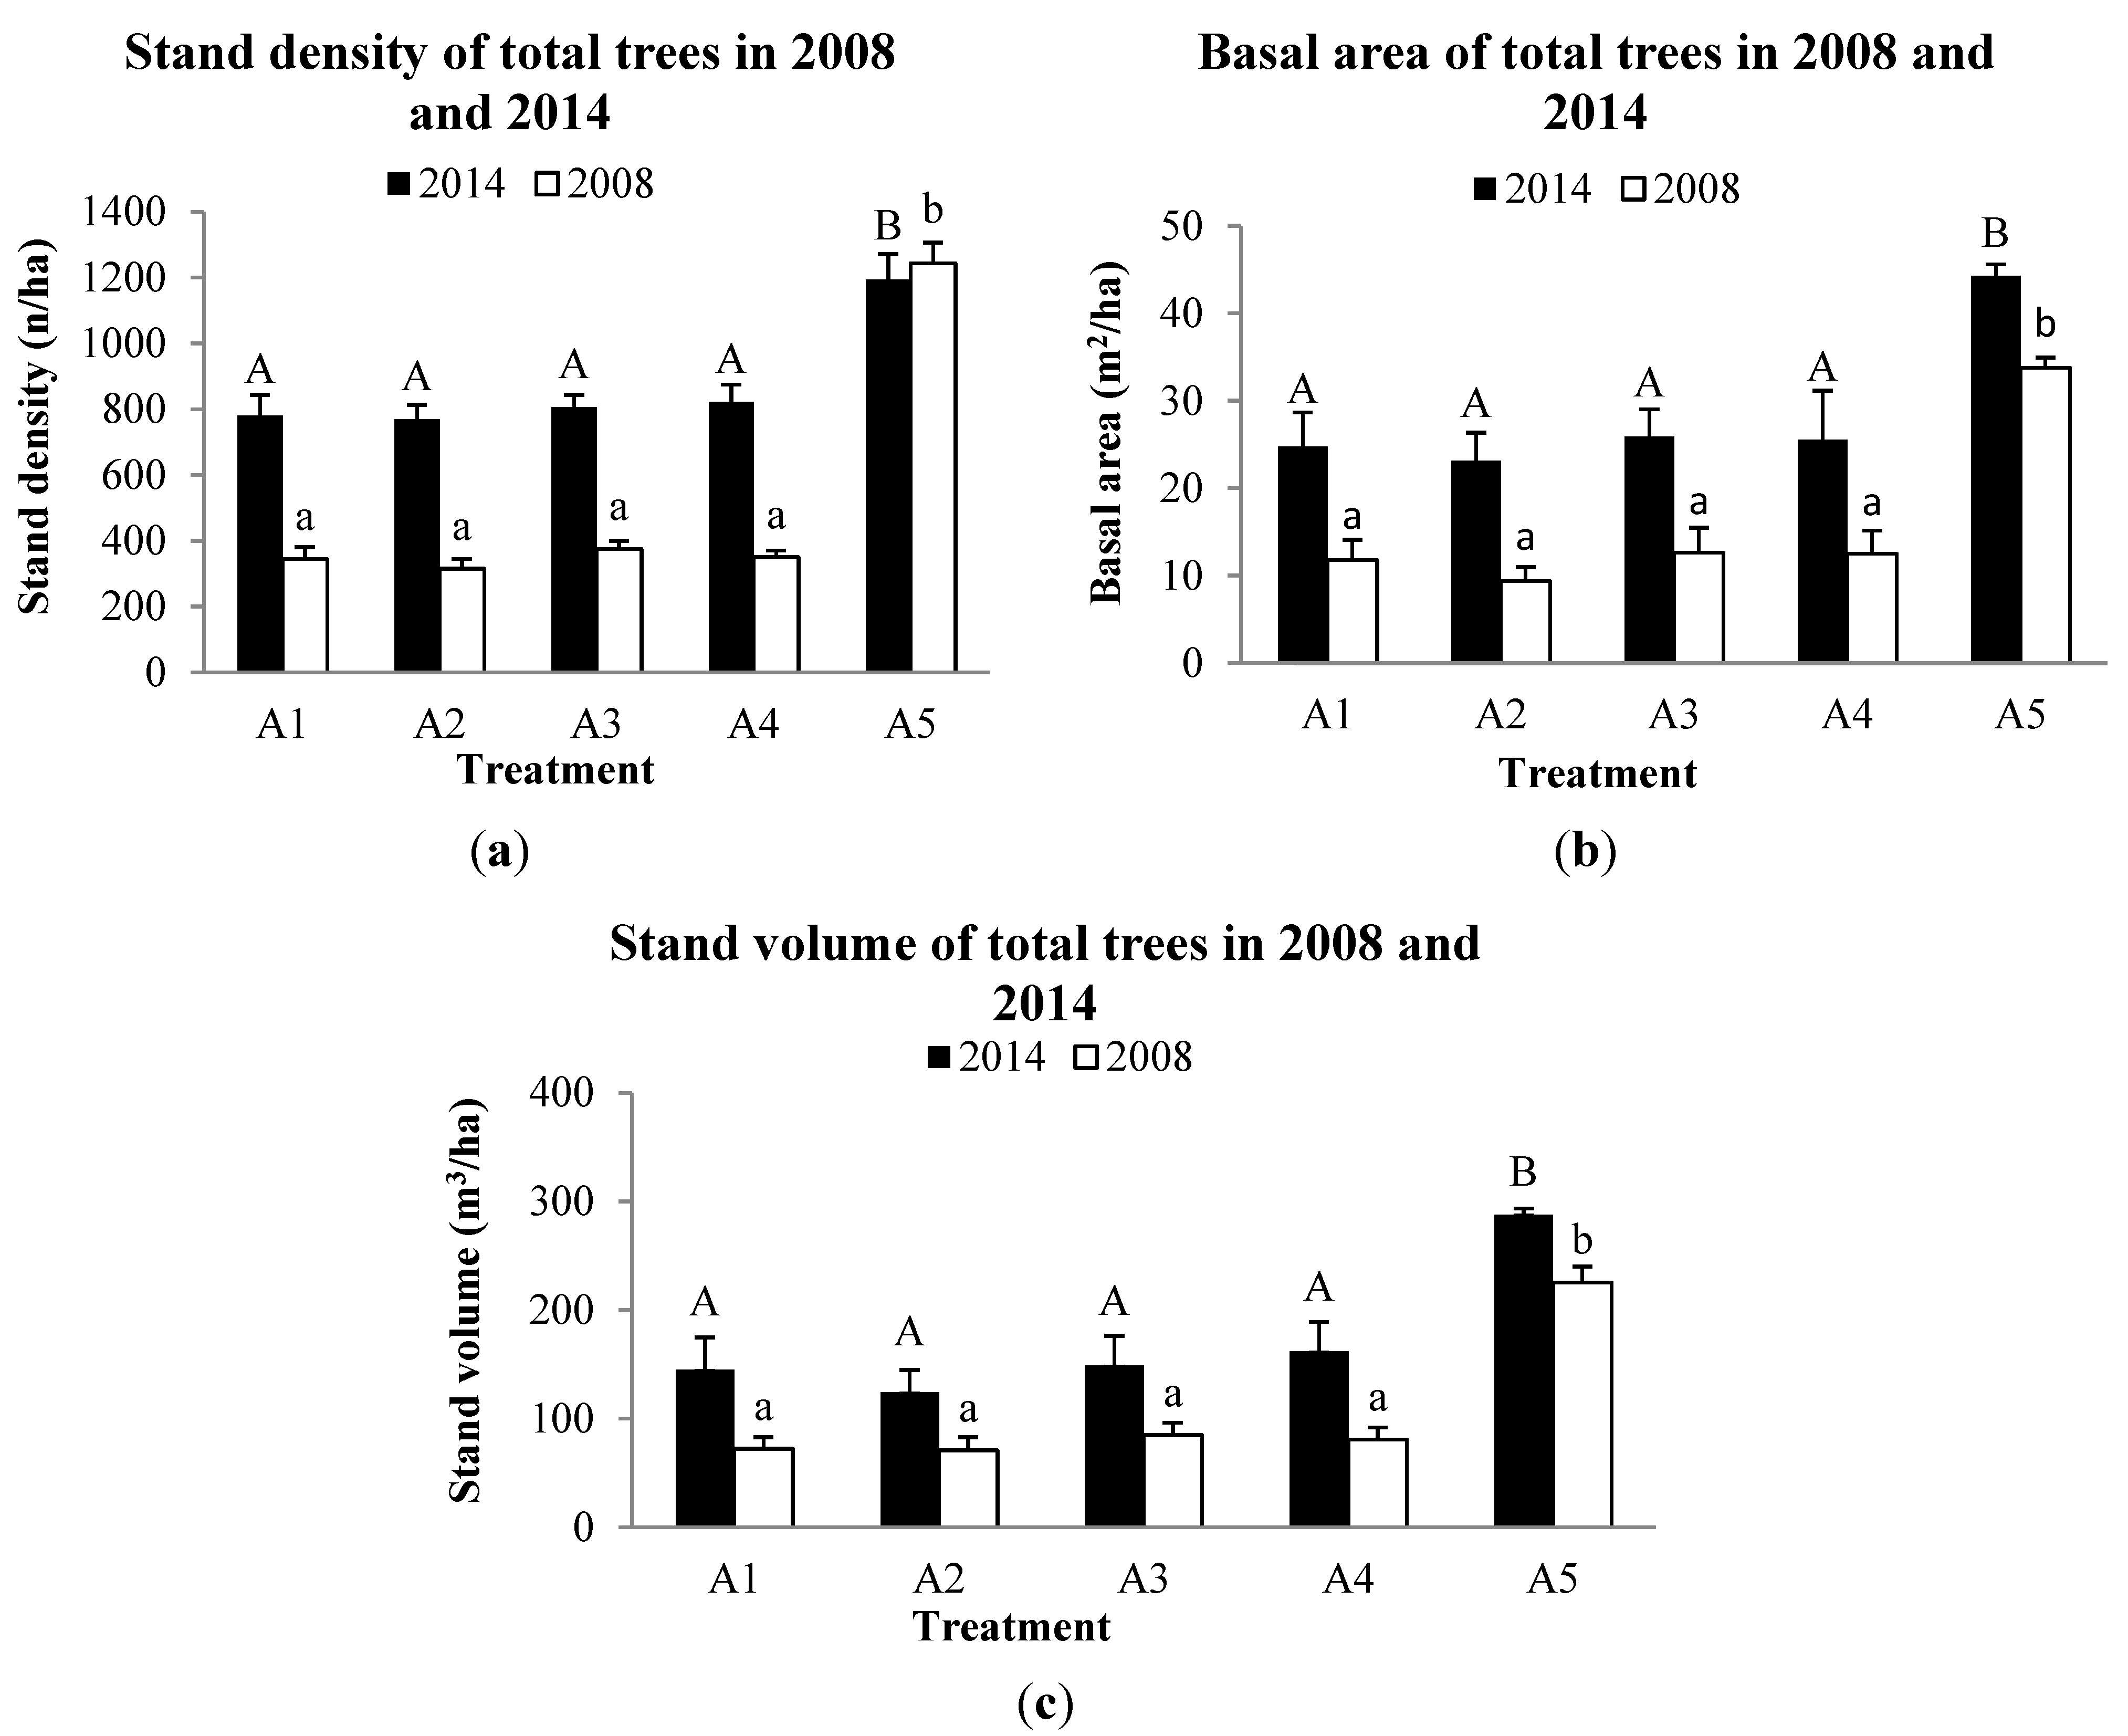
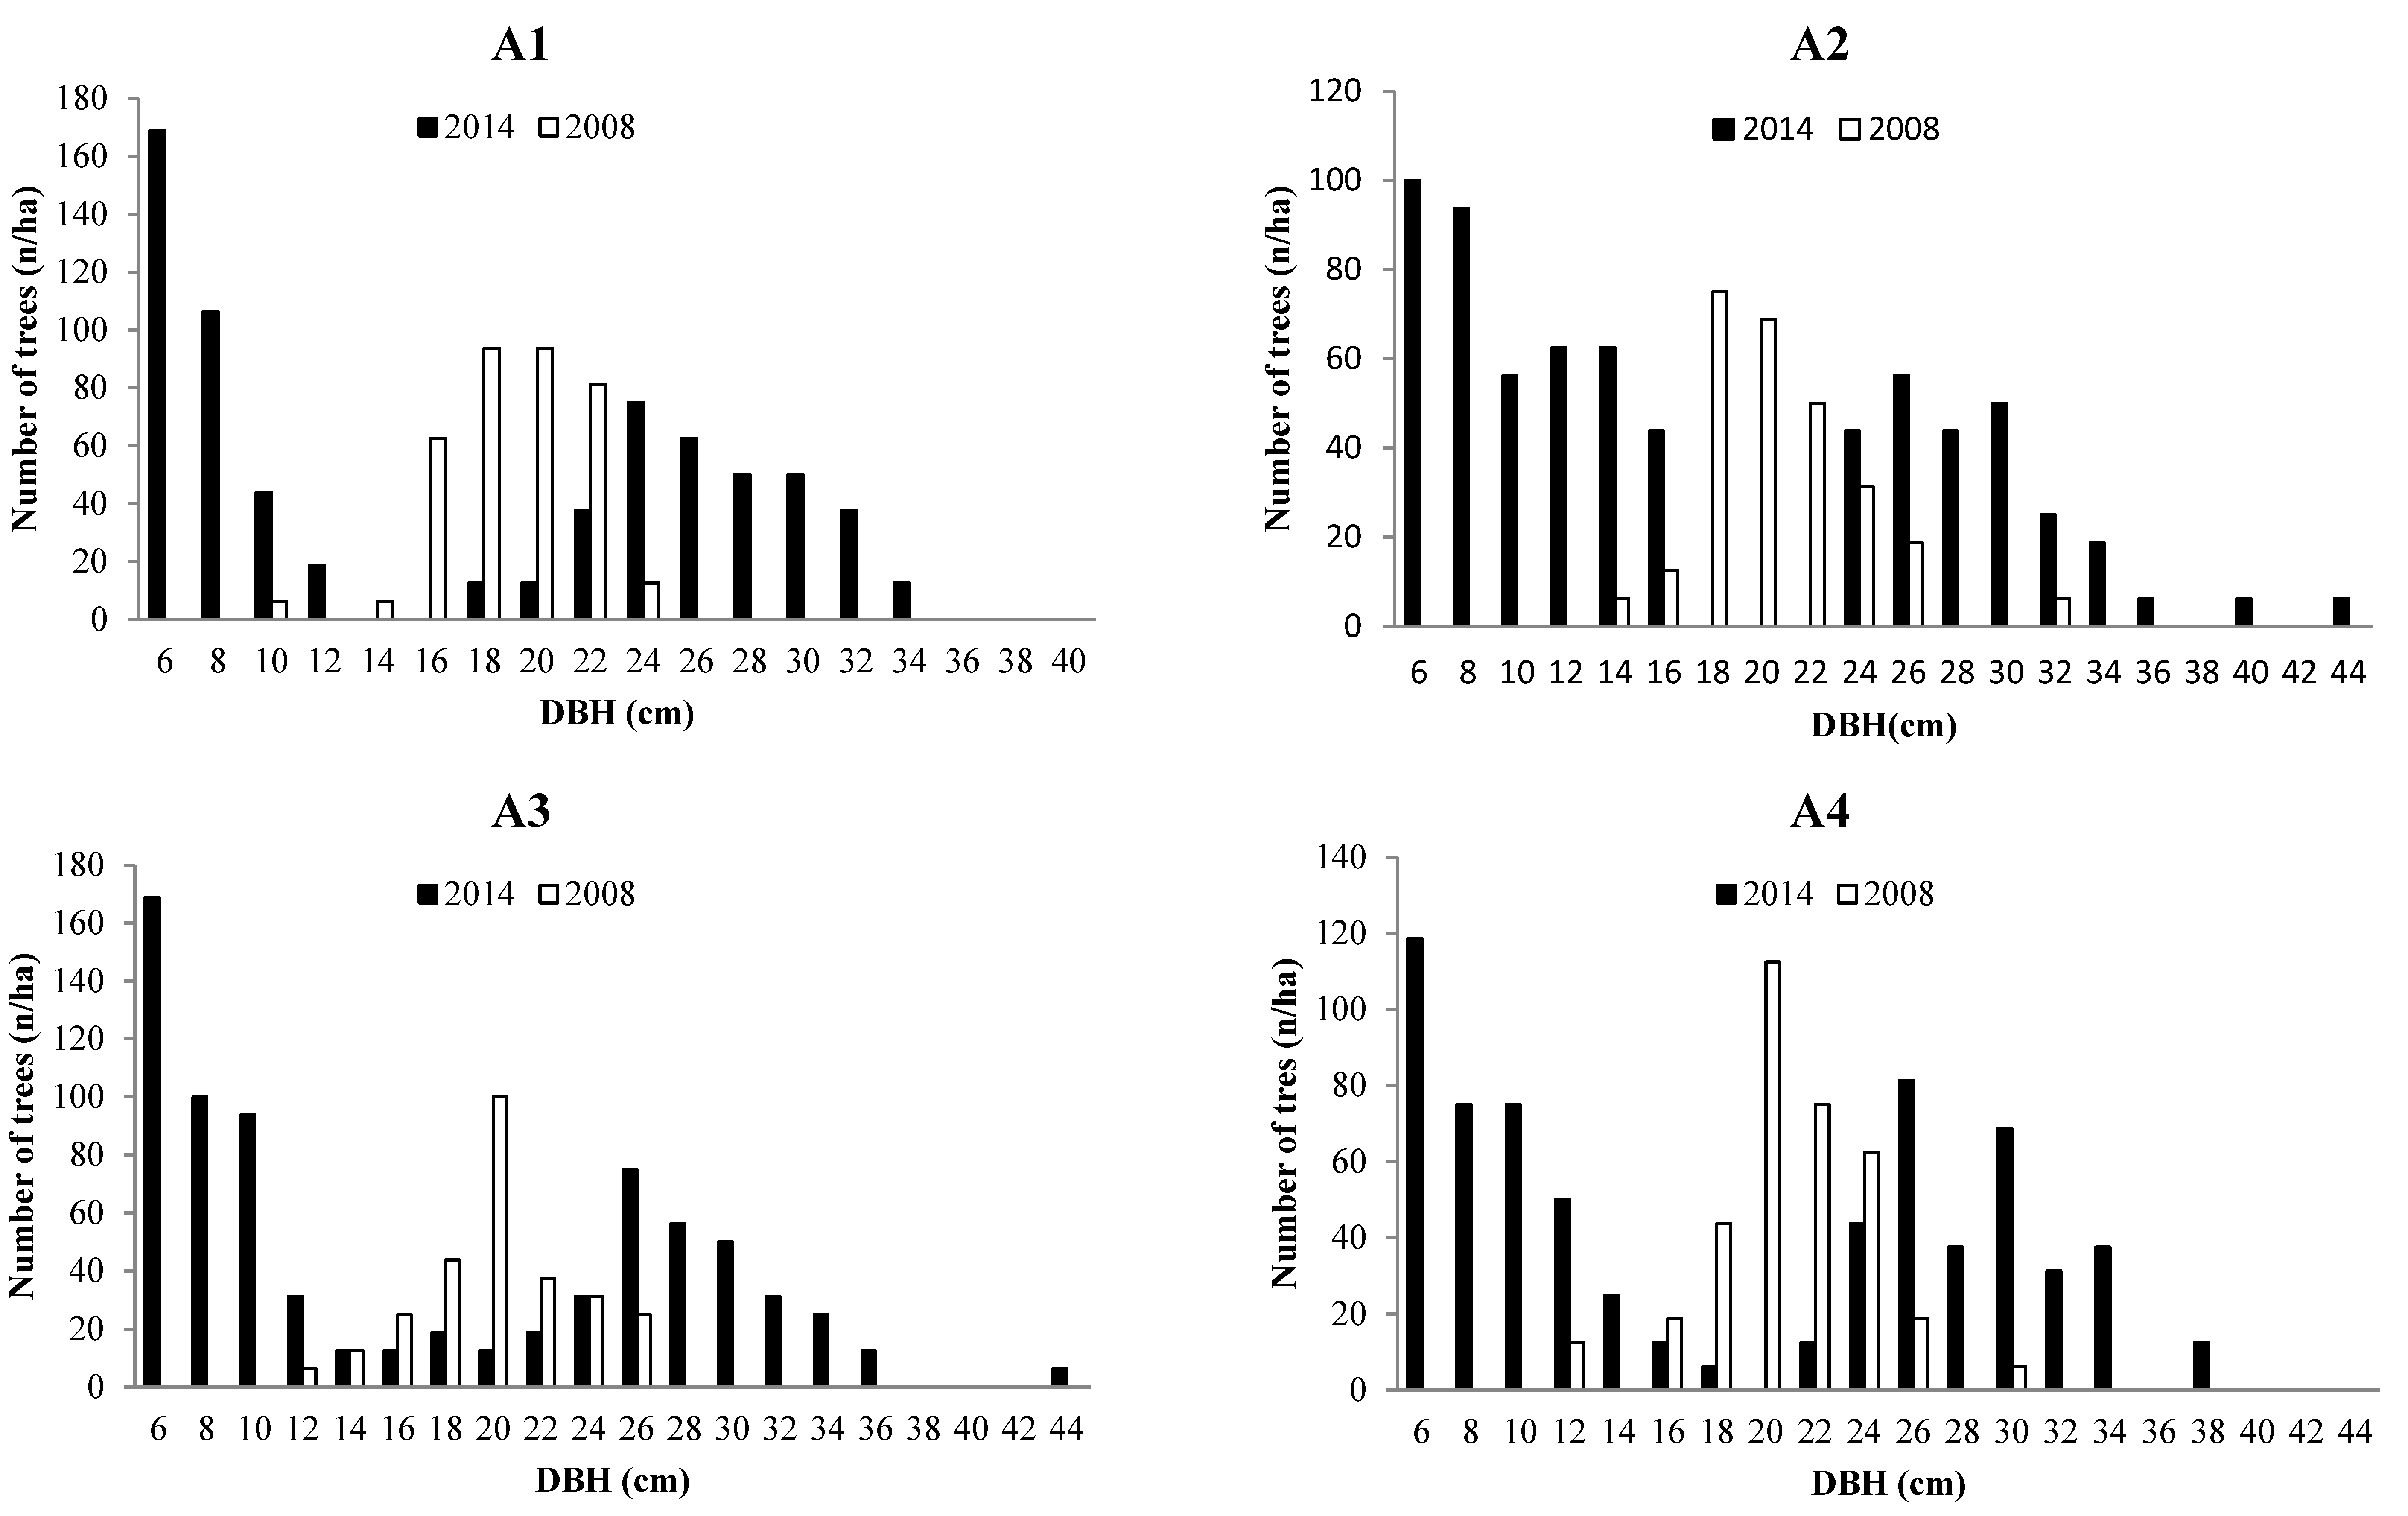
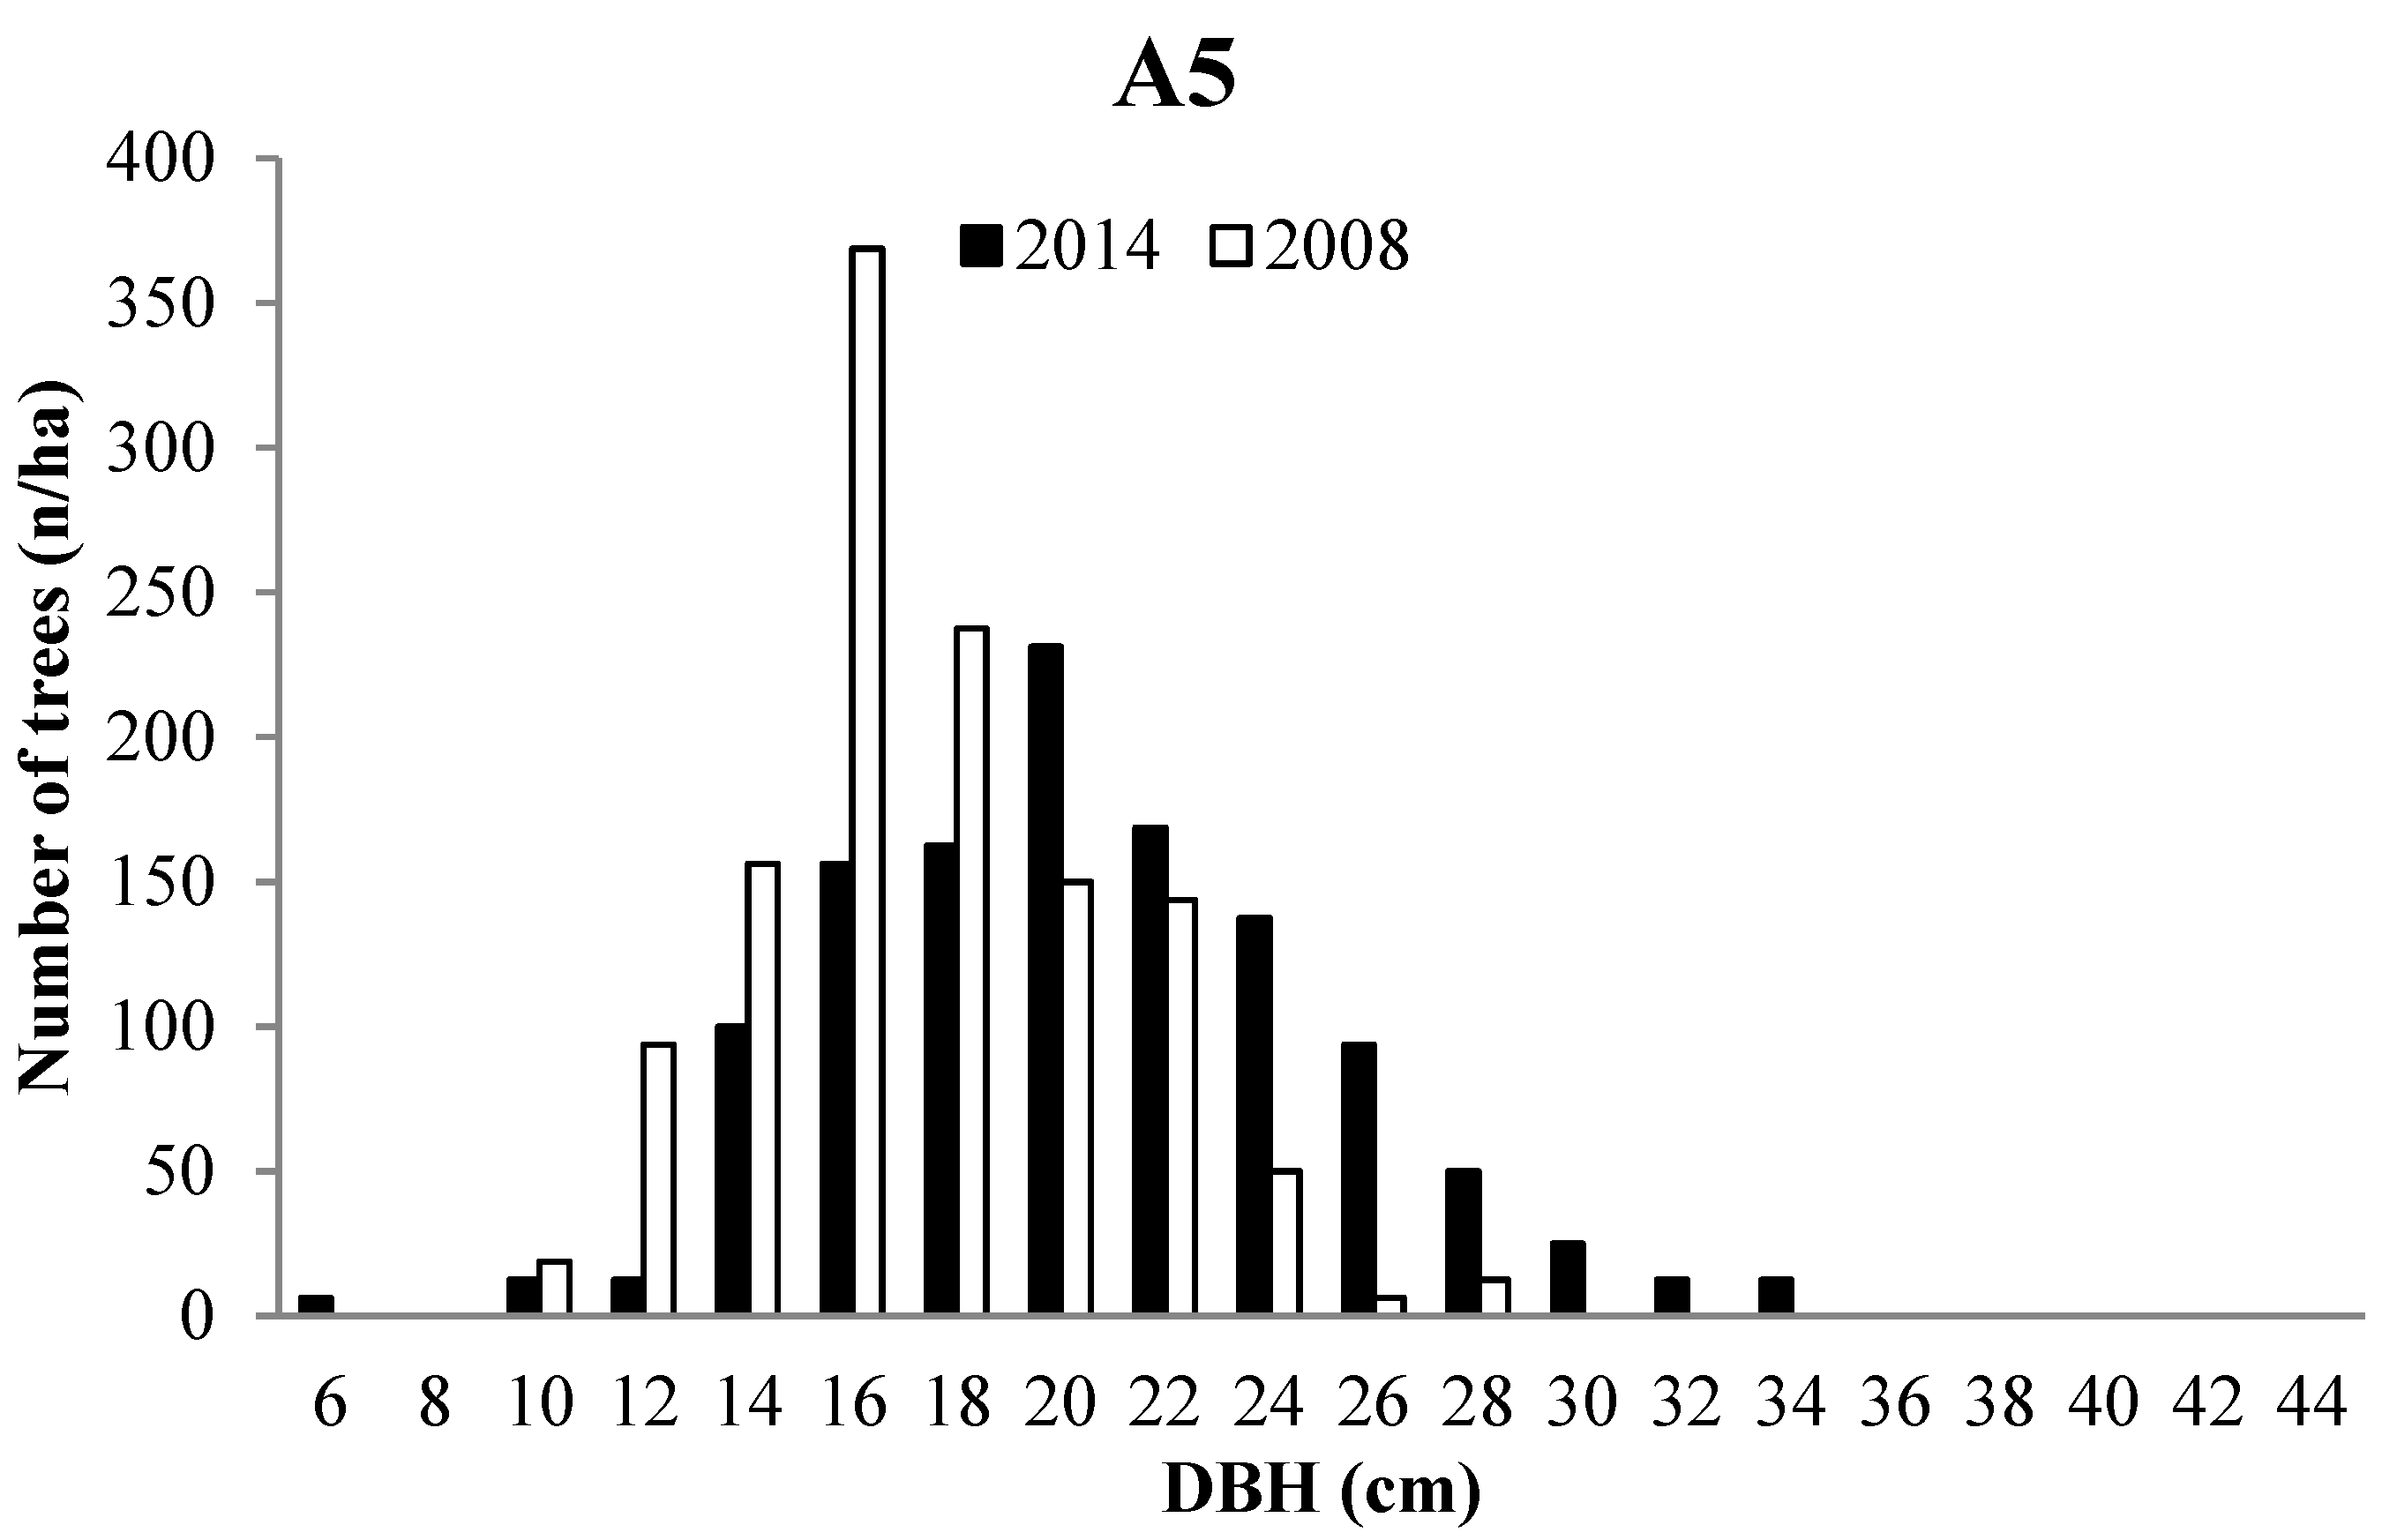
3.2. Forest Structure

The stand density (number/ha), stand volume/ha, and basal area/ha for total trees differed significantly among the treatments both in 2008 and 2014 and the paired comparison revealed that the control treatment was significantly higher than the other treatments (Figure 2, Appendix Table A1). The mean size for all trees—residual trees and new growth—was generally unchanged in the transformation treatments while a significant increase was found in the control treatment (Appendix Table A2). The control treatment had the smallest mean size among all the treatments in 2008 while it had the significantly largest mean size in 2014 (Appendix Table A1).
Figure 2. Stand density (a), basal area (b) and stand volume (c) of total trees in 2008 and 2014. Different letters indicate significant difference (p < 0.05) (Lower-case letter for 2008, upper-case letter for 2014).
Forests 05 03199 g002
In 2008, all the treatments showed a near normal DBH distribution: the frequency gradually increased to a peak and then gradually decreased among the larger diameters (Figure 3). In 2014, the diameter distribution moved towards the right and the range of DBH classes extended both upwards and downwards especially in the transformation treatments. For instance, in the A3 treatment, the DBH classes in 2008 ranged from 12 to 26 cm while in 2014 values ranged from 6 to 44 cm. The substantial growth in the small DBH classes was found only in the transformation treatments, indicating that the DBH distribution tended to shift from a near normal distribution to an irregular multi-modal distribution with a large amount of small trees appearing in the small DBH class. However, in control treatments the DBH distribution still exhibited a near normal distribution.
Figure 3. Histogram of tree size distribution of different transformation models.
Forests 05 03199 g003aForests 05 03199 g003b

3.3. Tree growth

3.3.1. Survival Growth

Over the six-year study period, residual trees of Pinus massoniana increased in size in all treatments, but considerably less so in control treatments (Appendix Table A1 and Appendix Table A2). For example, the mean volume was 92.8%, 78.3%, 110.5%, and 88.3% greater after six years in the A1–A4 treatments, respectively, but was only 36.1% larger in the control treatment. Trees in the control treatment were the smallest and significantly different from the other treatments (Appendix Table A1 and Appendix Table A2). The annual residual tree growth for Pinus massoniana was significantly smaller in the control treatment compared to the other treatments (Appendix Table A1). For example, the annual tree volume growth in the transformation treatments (A1: 32902.6 ± 12639.0, A2: 30281.9 ± 7709.4, A3: 33548.4 ± 3492.1, A4: 32052.7 ± 4386.0 cm3/ha) was more than three times larger than in the control treatment (9138.5 ± 4732.3 cm3/ha).
For enrichment plantings, Magnoliaceae glance, Castanopsis hystrix, and Quercus griffithii were observed as residuals between 2010 and 2014 (Table 4). Quercus griffithii had the largest annual diameter growth of 1.5 cm. Magnoliaceae glance ranked second with an annual diameter growth of 1.2 cm. Finally, Castanopsis hystrix grew in diameter by only 0.9 cm. For natural regeneration, 6 tree species were recorded as residuals, which were Styrax serrulatus, Ficus simplicissima, Mallotus philippensis, Trema orientalis, and Schefflera actinophylla. All were pioneer tree species and their annual growth is found in Table 4.
Table 4. Survival growth of enrichment planting and natural regeneration between 2010 and 2014.
SpeciesDiameter Growth (cm/year/n)Basal Area Growth (cm2/year/n)Volume Growth (cm3/year/n)
Enrichment Planting
Magnoliaceae glance1.223.46327.1
Castanopsis hystrix0.98.25143.2
Quercus griffithii1.529.710321.4
Natural Regeneration
Styrax serrulatus1.828.28923.5
Ficus simplicissima0.78.41309.7
Mallotus philippensis0.77.21802.6
Trema orientalis1.014.86386.6
Schefflera actinophylla0.79.73513.0

3.3.2 Ingrowth

After six years, the enrichment planting gradually grew into the lower inventoried diameter class. For example, in the A1 treatment, the ingrowths of Castanopsis hystrix and Magnoliaceae glance together accounted for 30.4%, 4.8%, and 1.7% of the number, basal area and volume of total trees (Table 2 and Table 5).
In addition to enrichment plantings, ingrowth also originated from natural regeneration. The naturally regenerated ingrowth observed in all treatments was comprised of 16 pioneer tree species such as Schefflera octophylla, Evodia lepta, Mallotus philippensis, and Rhus chinensis. The number of naturally regenerated ingrowth was 225, 119, 131, and 131 stems per hectare for treatment A1–A4, respectively. For example, in the A4 treatment, the regenerated ingrowths consisted of 12 tree species and accounted for 17.4%, 3.6%, and 1.9% of the number, basal area, and volume of total trees. In contrast, there were only 19 regenerated ingrowths per hectare in treatment A5 (Table 2 and Table 5).
Table 5. Ingrowth of enrichment plantings between 2008 and 2014.
TreatmentSpeciesNumber of Stems (n/ha)Average DBH (cm)Basal Area (m2/ha)Volume (m3/ha)
A1Castanopsis hystrix1886.90.71.6
Magnoliaceae glance758.50.50.9
A2Quercus griffithii28111.83.310.4
Erythrophleum fordii256.20.10.1
A3Quercus griffithii6911.50.82.5
Castanopsis hystrix447.30.20.4
Magnoliaceae glance2318.51.42.6
A4Quercus griffithii13810.51.33.3
Erythrophleum fordii135.40.00.0
Castanopsis hystrix697.10.31.2
Magnoliaceae glance639.10.40.9

3.3.3. Mortality

The overall mortality rates were 35.7%, 43.9%, 31.5%, and 26.9% for the transformation treatments A1, A2, A3, and A4, respectively (Table 6). Quercus griffithii had the smallest mortality rate, whereas Erythrophleum fordii had the highest mortality. In treatment A4, the mortality rate of each tree species was smaller than the corresponding value in other treatments. For instance, the mortality rate of Erythrophleum fordii in treatment A4 was 42.3%, while it was 67.7% in treatment A2.
Table 6. Mortality of enrichment plantings between 2008 and 2014.
TreatmentSpeciesNumber of Individuals in 2008 (n/ha)Number of Mortality Trees (n/ha)Mortality Rate (%)Overall Mortality Rate (%)
A1Castanopsis hystrix35013839.335.7
Magnoliaceae glanca35011332.1
A2Quercus griffithii4068120.043.9
Erythrophleum fordii40627567.7
A3Quercus griffithii2195022.931.5
Castanopsis hystrix37512533.3
Magnoliaceae glanca2198137.1
A4Quercus griffithii1633119.226.9
Erythrophleum fordii1636942.3
Castanopsis hystrix1633823.1
Magnoliaceae glanca1633823.1

4. Discussion

4.1. Species Composition and Forest Structure

Our findings suggested that in the transformation treatments the species composition in either the overstory or the understory was diverse while the control treatment almost only consisted of the originally planted species. The improvement of species composition could be attributed to forest gaps created by the transformation, which triggered natural regeneration and allowed enrichment plantings to grow into the overstory [35]. Forest gaps can provide a suitable forest microclimate for natural regeneration and for ground flora [36,37]. However, Madsen and Hahn [38] found that the regeneration response to gap formation was limited and few seedlings were added to the overstory. This was because the gaps in their research were too small and closed only in three or four years. Therefore, the gap effect was too short for regeneration to establish and to fully develop. In our transformation treatments, we used heavy thinning to a density of 70% and gaps were large enough for natural regeneration and enrichment plantings to establish and to develop into canopy trees. However, heavy thinning could also cause many negative impacts. For instance, residual trees after heavy thinning should be easily suffered from blowdown by strong wind [39,40]. Blakemore et al. [41], stated that the low stocking levels after heavy thinning may lead to the depreciation of wood physical properties, such as density and dimensional stability because of increased ring width and percentage of earlywood. In contrast, since no forest gaps were created for the control treatment, it was difficult for the natural tree species to colonize the stands and develop.
The control treatment had the smallest mean size among all the treatments in 2008. This was because we selected and cut the low quality smaller trees during transformation, which resulted in a larger mean size compared to the control treatment. However, the control treatment had the highest mean tree size in 2014, due to high levels of ingrowth in the transformation treatments that reduced average tree size. Tree-size diversity was increased in the transformation treatments (Figure 2). This was primarily the result of ingrowth from both natural regeneration and enrichment plantings under forest gaps. Many studies have already found that forest gaps created by selective logging can increase structural diversity within forest stands [42,43,44]. In addition, we also expect a more diverse spatial structure (though not analyzed here) in the transformation treatments especially when trees from enrichment plantings and from natural regeneration dominate the overstory and are able to self-regenerate.

4.2. Growth Pattern and Determination of Optimal Transformation Treatment

Residual trees of Pinus massoniana in all treatments increased in size significantly over the six-year study period and the increase was much higher in the transformation treatments (Appendix Table A1 and Appendix Table A2). A similar result was reported by O’Hara et al. [45], who found that average volume for residual trees was 124% and 107% greater after 4 years in the low- and moderate-density treatment, respectively, but only 72% larger in the control treatment. This was because thinning conducted in the transformation treatments released competition, which resulted in an increase in resource availability for residual trees.
Mean size of all trees increased in the control but remained unchanged in the transformation treatments. This was because new growth in the transformation treatments reduced average tree size (Appendix Table A2, Figure 2), whereas self-thinning in the control treatments tended to increase average tree size. The similarity of tree size among the transformation treatments (Figure 3) was due to the fact that all were essentially open-grown following the thinning. Since crown closure will shift stand development from an initiation to an exclusion mode [46], we expect that in the future tree size in the transformation treatments will further differentiate, resulting in a greater size diversity.
A number of studies have found a positive relationship among plant diversity, ecosystem stability, and resilience after perturbation [47,48,49]. For example, Schläpfer and Schmid [50] suggested that species-rich assemblages in grassland ecosystems are more stable than species-poor assemblages. The transformation treatment A4 had the smallest overall mortality rate and simultaneously the mortality rate of each tree species was smaller than the corresponding value in other transformation treatments (A1–A3). This was probably because the transformation treatment A4 had higher species richness and thus was more stable than the other three transformation treatments.
In a recent meta-analysis by Cardinale et al. [51], the conclusion was that, in general, high species richness in plant communities was related to higher productivity. Similarly, numerous studies have already suggested that the improvement of species mixture and diversity has a positive contribution to tree and stand growth [52,53,54,55]. However, different statements about the relationship between species diversity and productivity were also proposed. For instance, Forrester [56] argued that site conditions have a strong influence on whether there could be diversity–productivity relationships. Binkley [57] reported that P.menziesii monocultures were less productive than mixtures at the low N site but not at the high N site. Morin et al. [58], stated that stand productivity increased with species diversity, and the absolute complementarity effect increased with increasing site quality. In the present study, the transformation treatment A4 showed no significant advantage over the other transformation treatments in terms of growth or productivity. This is probably because the observation interval is too short for transformation treatment A4 to differentiate from the other transformation treatments and reveal its advantage. In addition, this could also be attributing to the nutrients which were regarded to be the limiting factor at these sites of low quality. After six years transformation, the nutrients influenced by species interactions increased and so did the complementary effects. However, the complementary effects might decrease or disappear with increase of nutrients in other sites of relatively good quality. Therefore, we concluded that with a comparison to the present sites the transformation A4 would have even larger effect in the nutrient-poorer sites whereas smaller or no effect in the nutrient-richer site. Finally, we determined transformation A4 as the optimal transformation treatment because of its smallest overall and species-specific mortality rate as well as its potential higher productivity caused by higher species diversity than the other transformation treatment.

5. Conclusions and Future Prospects for Sustainable Forest Management

5.1. Conclusions

With only six years of transformation, the species composition, stand structure, and growth pattern in the transformed stands demonstrated obvious advantages over control stands. This one-time transformation treatment will change the composition of the forests for many years to come in a self-sustaining manner. Transformation treatment A4, which had the smallest overall mortality rate and simultaneously the mortality rate of each tree species was smaller than the corresponding value in other transformation treatments (A1–A3), was identified as the optimal transformation, though there was no significant advantage over the other transformation treatments in terms of growth or productivity, likely due to the short duration of our study. The sites in the present study were poor in nutrients and the transformation treatment A4 could be applied in the sites that have fewer nutrients than the present sites. In other sites, for instance, the sites rich in nutrients where the complementary effect might not be observed or the sites where P. massoniana is very competitive and it might be hard for any other species to compete with it, this type of mixing treatment might not work. Finally, we concluded that converting a monoculture conifer plantation into a mixed-species forest improved stand quality and therefore might be a possible option for multi-purpose forest management in China, which has the largest areas of plantation in the world.

5.2. Future Prospects for Sustainable Forest Management

The transformed stands should be monitored continuously and carefully with great attention to the forest gaps until most of the broad-leaved tree species grow into the overstory and can self-regenerate. The successful establishment of regeneration and potential development into canopy trees depends on gap size [59]. For instance, if we desired light-demanding tree species, gaps should be of substantial size and have the ability to stay relatively open for several years. A series of gap cuttings can be used to expand the original gap for the facilitation of regeneration establishment and development.
Further enrichment plantings are necessary in places where no natural regeneration occurred. Advanced regeneration may be relatively secure, though seedlings established after gap formation can be ephemeral [42]. Sites with advanced regeneration are those with regeneration success in the years following gap formation. Collet and Chenost [60] have also reported that advanced regeneration can respond very rapidly to canopy opening and that very few seedlings regressed or died following gap formation.
Investigation of spatial structure should be encouraged in the future as it may provide an indirect indication of the underlying ecological process of forest stands, which is useful to forest management decisions [9,61,62,63]. A good example of relating forest spatial structure with management decisions was proposed by Tang et al., who suggested that a sound forest spatial structure might be characterized by low competition, high species intermingling and uniform distribution [64].

Acknowledgments

We thank the Experimental Center of Tropical Forestry, Chinese Academy of Forestry, for their support during our research. We are grateful to Jixin Tang, Zong Zhao and Shilong Yu for their assistance in the field work. This study was supported by the Fundamental Research Funds for the Central Universities (NO.YX2013–37), the National Natural Science Foundation of China (31300532) and the project innovation technique for multi-purpose forest management (CAFYBB2012013 & Lin2Value).

Author Contributions

Jinghui Meng and Yuanchang Lu conceived and designed the experiments; Jinghui Meng performed the experiments; Jinghui Meng analyzed the data; Ji Zeng contributed reagents/materials/analysis tools; Jinghui Meng wrote the paper.

Appendix

Table A1. Analysis of variance results for tests of tree size differences for residual trees and for total trees in 2008 and 2014.
DataMeasureSourcedfSum sqF-ValueP > FPaired Comparisons
Total Trees 2014Stand density( n/ha)Treatment458281210.950.000565A21 < A12 < A33 < A44 < A51–5
Block3760941.910.182437
Stand volume (m3/ha)Treatment46817024.581.05 × 10−5A21 < A12 < A33 < A44 < A51–5
Block355882.690.0936
Stand basal area (m2/ha)Treatment41231.822.731.58 × 10−5A21 < A12 < A44 < A33 < A51–4
Block344.11.090.393
Mean volume (m3)Treatment40.0122.500.0983A1 < A2 < A3 < A4 < A5
Block30.0113.130.0659
Mean basal area (m2)Treatment401.380.3A1 < A3 < A4 < A2 < A5
Block302.000.17
Mean diameter (cm)Treatment455.624.940.0138A11 < A23 < A4 < A2 < A51,2
Block323.382.770.0877
Mean height (m)Treatment456.524.680.0166A2 < A3 < A4 < A1 < A5
Block325.882.860.082
Total Trees 2008Stand density(n/ha)Treatment42659188142.945.19 × 10−10A21 < A12 < A44 < A33 < A51–5
Block3826255.920.0102
Stand volume (m3/ha)Treatment47343732.175.16 × 10−6A21 < A12 < A34 < A43 < A51–5
Block342572.490.115
Stand basal area (m2/ha)Treatment4159149.006.06 × 10−7A21 < A12 < A44 < A33 < A51–5
Block387.63.600.0497
Mean volume (m3)Treatment40.006020.970.464A5 < A1 < A3 < A2 < A4
Block30.007441.600.246
Mean basal area (m2)Treatment40.000151.330.319A5 < A1 < A3 < A2 < A4
Block30.000171.900.188
Mean diameter (cm)Treatment410.70.420.791A5 < A3 < A4 < A1 < A2
Block340.052.100.159
Mean height (m)Treatment42.6681.240.35A1 < A3 < A2 < A5 < A4
Block31.6371.010.424
Residual Trees of Pinus massoniana 2014Stand volume (m3/ha)Treatment47671927.326.01 × 10−6A21 < A12 < A33 < A44 < A51–4
Block367433.200.0622
Basal area (m2/ha)Treatment41677.330.313.45 × 10−6A21 < A32 < A13 < A44 < A51–4
Block393.82.260.134
Mean volume (m3)Treatment40.10039.320.00115A51,2,3,4 < A11 < A22 < A33 < A44
Block30.036744.550.02372
Mean basal area (m2/ha)Treatment40.0026012.920.000263A51–4 < A11 < A32 < A43 < A24
Block30.000926.120.139
Mean diameter (cm)Treatment4156.68.600.00163A51–4 < A21 < A12 < A43 < A34
Block361.174.480.127
Mean height (m)Treatment411.691.600.243A2 < A3 < A5 < A4 < A1
Block320.713.780.0439
Growth of Residual Trees of Pinus massonianaVolume (m3/year/n)Treatment40.0027.760.00318A51–4 < A21 < A42 < A13 < A34
Block300.720.559
Basal area(m2/year/n)Treatment44.85E-0611.930.00055A51–4 < A41 < A12 < A33 < A24
Block34.85E-061.7010.22413
Table A2. Stand-level characteristics (stand density, basal area, volume) and mean size measured by DBH, height, tree basal area, and tree volume by treatment with standard deviations. Differences were calculated for total trees present during each year (total trees) and for only those trees that were present in 2008 and alive in 2014 (residual trees). Paired t-tests were used to evaluate if changes were significant.
TreatmentMeasureResidual Trees of Pinus massonianaTotal Trees
20082014p20082014p
A1Stand density(n/ha)375 ± 117375 ± 117 375 ± 117862 ± 1980.021
Stand volume (m3/ha)74.9 ± 22.2140.7 ± 31.20.00174.9 ± 22.2144.9 ± 29.90.001
Stand basal area (m2/ha)11.8 ± 3.122.6 ± 4.70.00111.8 ± 3.124.8 ± 4.00.001
Mean volume (m3)0.2 ± 0.00.4 ± 0.10.0070.2 ± 0.00.2 ± 0.10.481
Mean basal area (m2)0.03 ± 0.010.06 ± 0.010.0050.03 ± 0.010.03 ± 0.010.441
Mean height (m)13.3 ± 0.615.4 ± 3.30.12013.3 ± 0.611.6 ± 3.80.802
Mean diameter (cm)20.1 ± 1.828.0 ±3.30.00220.1 ± 1.816.5 ± 2.90.836
A2Stand density275 ± 46275 ± 46 275 ± 46700 ± 960.001
Stand volume (m3/ha)59.1 ± 10.0111.5 ± 21.00.00459.1 ± 10.0124.4 ± 20.40.004
Stand basal area (m2/ha)9.4 ± 1.618.9 ± 2.90.0019.4 ± 1.623.1 ± 3.20.000
Mean volume (m3)0.2 ± 0.00.4 ± 0.10.0020.2 ± 0.00.2 ± 0.00.996
Mean basal area (m2)0.03 ± 0.010.07 ± 0.010.0000.04 ± 0.010.03 ± 0.010.995
Mean height (m)13.4 ± 0.213.2 ± 0.80.70513.4 ± 0.29.1 ± 1.60.994
Mean diameter (cm)20.3 ± 2.327.6 ± 4.80.00020.3 ± 2.318.0 ± 2.10.999
A3Stand density343 ± 97331 ± 94 343 ± 97806 ± 380.029
Stand volume (m3/ha)80.8 ± 36.0141.8 ± 29.40.00580.8 ± 35.9149.0 ± 27.20.004
Stand basal area (m2/ha)12.6 ± 5.022.2 ± 4.30.00312.6 ± 5.025.5 ± 3.20.002
Mean volume (m3)0.2 ± 0.10.4 ± 0.10.0020.2 ± 0.10.2 ± 0.00.705
Mean basal area (m2)0.01 ± 0.010.07 ± 0.010.0040.03 ± 0.010.03 ± 0.010.710
Mean height (m)13.3 ± 0.913.9 ± 0.80.00413.3 ± 0.99.6 ± 1.10.996
Mean diameter (cm)19.1 ± 3.629.2 ±1.70.00419.1 ± 3.617.1 ± 1.30.937
A4Stand density350 ± 94343 ± 103 350 ± 94781 ± 1030.000
Stand volume (m3/ha)84.7 ± 42.9153.5 ± 52.40.00084.7 ± 42.9161.9 ± 50.60.000
Stand basal area (m2/ha)12.5 ± 5.422.9 ± 6.00.00012.5 ± 5.425.9 ± 5.60.000
Mean volume (m3)0.2 ± 0.10.4 ± 0.00.0000.2 ± 0.10.2 ± 0.11.000
Mean basal area (m2)0.04 ±0.010.07 ±0.000.0020.04 ±0.010.03 ± 0.011.000
Mean height (m)14.2 ± 1.114.7 ± 1.20.00914.2 ± 1.110.0 ± 1.51.000
Mean diameter (cm)20.0 ± 4.429.0 ± 0.60.00219.9 ± 4.417.5 ± 1.91.000
A5Stand density1244 ± 1111175 ± 1510.1961244 ± 1111194 ± 1340.196
Stand volume (m3/ha)225.4 ± 14.7287.8 ± 5.70.011225.4 ± 14.7287.9 ± 5.70.011
Stand basal area (m2/ha)33.8 ± 1.244.3 ±1.30.00033.8 ± 1.244.3 ± 1.30.000
Mean volume (m3)0.2 ± 0.00.3 ± 0.00.0150.2 ±0.00.2 ±0.00.019
Mean basal area (m2)0.03 ± 0.000.04 ± 0.000.0000.03 ± 0.000.04 ± 0.000.000
Mean height (m)13.9 ± 0.713.7 ± 0.70.60413.9 ± 0.713.7 ± 0.70.622
Mean diameter (cm)18.3 ± 0.921.6 ±1.30.00018.3 ± 0.921.3 ± 1.00.000

Conflicts of Interest

The authors declare no conflict of interest.

References

  1. Department of Forest Resource Management. China’s forest resource status and dynamic change-based on analysis of the seventh national forest resource inventory results. For. Econ. 2010, 7, 42–48. [Google Scholar]
  2. Gärtner, S.; Reif, A. The impact of forest transformation on stand structure and ground vegetation in the southern Black Forest, Germany. Plant Soil 2004, 264, 35–51. [Google Scholar] [CrossRef]
  3. Felton, A.; Lindbladh, M.; Brunet, J.; Fritz, Ö. Replacing coniferous monocultures with mixed-species production stands: An assessment of the potential benefits for forest biodiversity in northern Europe. For. Ecol. Manag. 2010, 260, 939–947. [Google Scholar]
  4. Li, W. Degradation and restoration of forest ecosystems in China. For. Ecol. Manag. 2004, 201, 33–41. [Google Scholar] [CrossRef]
  5. Kelty, M.J. The role of species mixtures in plantation forestry. For. Ecol. Manag. 2006, 233, 195–204. [Google Scholar] [CrossRef]
  6. Kerr, G. The use of silvicultural systems to enhance the biological diversity of plantation forests in Britain. Forestry 1999, 72, 191–205. [Google Scholar] [CrossRef]
  7. Liu, H.; Li, J. The study of the ecological problems of eucalyptus plantation and sustainable development in Maoming Xiaoliang. J. Sustain. Dev. 2010, 3, 197. [Google Scholar]
  8. Pommerening, A.; Murphy, S.T. A review of the history, definitions and methods of continuous cover forestry with special attention to afforestation and restocking. Forestry 2004, 77, 27–44. [Google Scholar] [CrossRef]
  9. Malkinson, D.; Kadmon, R.; Cohen, D. Pattern analysis in successional communities—An approach for studying shifts in ecological interactions. Forestry 2003, 14, 213–222. [Google Scholar] [CrossRef]
  10. Harmer, R.; Kiewitt, A.; Morgan, G. Effects of overstorey retention on ash regeneration and bramble growth during conversion of a pine plantation to native broadleaved woodland. Eur. J For. Res. 2012, 131, 1833–1843. [Google Scholar] [CrossRef]
  11. Nabuurs, G.J.; Paivinen, R.; Schelhaas, M.J.; Pussinen, A.; Verkaik, E.; Lioubimow, A.; Mohren, F. Nature-oriented forest management in Europe: modeling the long-term effects. J. For. 2001, 99, 28–33. [Google Scholar]
  12. Chauvat, M.; Titsch, D.; Zaytsev, A.S.; Wolters, V. Changes in soil faunal assemblages during conversion from pure to mixed forest stands. For. Ecol. Manag. 2011, 262, 317–324. [Google Scholar] [CrossRef]
  13. Démurger, S.; Hou, Y.Z.; Yang, W.Z. Forest management policies and resource balance in China: An assessment of the current situation. J. Environ. Dev. 2009, 18, 17–41. [Google Scholar] [CrossRef]
  14. Shao, Q. An elucidation to nature-approximating forestry and forestry target. World For. Res. 2003, 16, 1–5. [Google Scholar]
  15. Lu, Y.; Zhang, S.; Lei, X.; Ning, J.; Wang, Y. Theoretical basis and implementation techniques on close-to-nature transformation of plantations. World For. Res. 2009, 22, 20–27. [Google Scholar]
  16. Zhang, S.X.; Lei, R.D.; Chen, C.G.; Liu, J.J. “Close-to-nature forest”—“A prospect manmade natural forest”. J. Northwest. For. Uni. 1996, 11, 157–162. [Google Scholar]
  17. Wang, L.Y.; Wang, X.H.; Song, Y.C. Study on restoration of degraded secondary forest and transformation of plantation in Tiantong forest farm. For. Sci. Technol. 2000, 11, 4–6. [Google Scholar]
  18. Zhang, J.Y.; Lu, Y.C.; Cheng, K.W.; Zhong, K.P.; Huang, Y.X. Impact of near nature modification on community structure and species biodiversity of artificial Pinus yunnanensis forest. J. Agric. Univ. Hebei 2010, 33, 72–77. [Google Scholar]
  19. Cai, N.H.; Cai, G.Q.; Lu, Y.C. Discussion on the approaching—Nature forestry management of Pinus yuananensis pure forests. J. Northwest For. Univ. 2006, 21, 85–88. [Google Scholar]
  20. Wang, X.H.; Wang, Q.H. Effects of the close-to-nature cultivation of Larix olgensis and Fraxinus mandshurica on the soil physiochemical properties. Sci. Silvae Sin. 2008, 44, 21–27. [Google Scholar]
  21. Zeng, D.H.; Jiang, F.Q.; Hao, H.; Fan, Z.H.; Du, X.J. Transformation and assessment of Chinese pine pure plantations for soil and water conservation in western Liaoning province, P.R. China. J. For. Res. 2004, 15, 127–134. [Google Scholar]
  22. Ning, J.K.; Lu, Y.C.; Zhao, H.Y.; Liu, X.Z.; Ren, Y.Q.; Chen, J.Q. Assessment on close-to-nature transformation of Pinus tabulaeformis plantation to Xishan region, Beijing. J. Northeast For. Univ. 2009, 37, 42–44. [Google Scholar]
  23. Ding, Z.F.; Ma, Y.C.; Wu, Z.N.; Wei, Z.H.; Chu, G.Q. Comprehensive discussion on low-function ecological forest reconstruction technology of Cunninghamia lanceolata and Pinus massoniana in Anhui northern subtropics region. J. Anhui Agric. Sci. 2013, 2, 660–662. [Google Scholar]
  24. Wu, H.Z.; Guo, M.X.; Chen, C.G.; Wang, Y. Discussion on ecological reconstruction of pure Pinus massoniana forest around Dinghu Mountain in Zhaoqing City. Cent. South For. Inventar. Plant 2011, 30, 25–28. [Google Scholar]
  25. Stone, R. Nursing China’s ailing forests back to health. Science 2009, 352, 556–558. [Google Scholar] [CrossRef]
  26. Kang, B.; Liu, S.H.; Zhang, G.J.; Chang, J.G.; Wen, Y.G.; Ma, J.M.; Hao, W.F. Carbon accumulation and distribution in Pinus massoniana and Cunninghamia lanceolata mixed forest ecosystem in Daqingshan, Guangxi of China. Acta Ecol. Sin. 2006, 26, 1320–1329. [Google Scholar] [CrossRef]
  27. Cai, D.; Guo, W.; Jia, H.; Lu, L.; Li, j.; Chen, J. Sustainable management of plantations—Taking as an example in the implementation of ecological management approach in Experimental Center of Tropical Forestry. For. Resour. Manag. 2008, 2, 42–46. [Google Scholar]
  28. Lu, L.H.; Wang, B.G.; He, R.M. The effect of site and cultivation model on growth of Castanopsis hystrix. For. Res. 1999, 12, 519–523. [Google Scholar]
  29. Tang, J.X.; Bai, L.H.; Guo, W.F.; Zeng, J.; Cai, D.X. Preliminary study on growth regularity of Castanpsis hystrixplantation. J. Cent. South Univ. For. Technol. 2012, 32, 51–60. [Google Scholar]
  30. Zhu, P.; Wang, Z.H.; Ye, W.H.; Cao, H.L.; Saravanan, T. Preliminary studies on pollination and mating system of rare and endangered plant Erythrophleum fordii Oliv. J. Trop. Subtrop. Bot. 2012, 21, 38–44. [Google Scholar]
  31. Jiang, Y.; Wang, Y.H.; Qiu, F.Y.; Huang, R.L. Early selection for superior provenances of Castanopsis fisa. For. Res. 2011, 40, 1–7. [Google Scholar] [CrossRef]
  32. Chhetri, R.; Toomsan, B.; Kaewpradit, W.; Limpimmtana, V. Mass loss, nitrogen, phosphorus and potassium release patterns and non-additive interactions in a decomposition study of chir pine (Pinus roxburghii) and Oak (Quercus griffithii). Int. J. Agric. Res. 2012, 7, 332–344. [Google Scholar] [CrossRef]
  33. He, F.; Ma, Q.Y.; Liu, X.L.; Wang, J.X.; He, D.H. Characteristics of biology and geographical distribution of wild Magnoliaceae plants in Sichuan Province. Sci Soil Water Conserv. 2008, 6, 48–53. [Google Scholar]
  34. Roberts, M.R. Stand development and overstory-understory interactions in an aspen-northern hardwoods stand. For. Ecol. Manag. 1992, 54, 157–174. [Google Scholar] [CrossRef]
  35. Bruelheide, H.; Böhnke, M.; Both, S.; Fang, T.; Assmann, T.; Baruffol, M. Community assembly during secondary forest succession in a Chinese subtropical forest. Ecol. Monogr. 2011, 81, 25–41. [Google Scholar] [CrossRef] [Green Version]
  36. Hahn, K.; Thomsen, R.P. Ground flora in Suserup Skov: Characterized by forest continuity and natural gap dynamics or edge-effect and introduced species? Ecol. Bull. 2007, 52, 167–181. [Google Scholar]
  37. Degen, T.; Devillez, F.; Jacquemart, A.L. Gaps promote plant diversity in beech forests (Luzulo-Fagetum), North Vosges, France. Annu. For. Sci. 2005, 62, 429–440. [Google Scholar] [CrossRef]
  38. Madsen, P.; Hahn, K. Natural regeneration in a beech-dominated forest managed by close-to-nature principles: A gap cutting based experiment. Can. J. For. Res. 2008, 38, 1716–1729. [Google Scholar] [CrossRef]
  39. Perera, A.H.; Buse, L.J.; Weber, M.G. Emulating Natural Forest Landscape Disturbances: Concepts and Applications. Columbia University Press: New York, NY, USA, 2007; p. 247. [Google Scholar]
  40. Cameron, A.D. Importance of early selective thinning in the development of long-term stand stability and improved log quality: A review. Forestry 2002, 75, 25–35. [Google Scholar] [CrossRef]
  41. Blakemore, P.; Cown, D.; Dumbrell, I.; McKinley, R.; Lyon, A.; Barr, B.; Northway, R. Western Australian Softwood Resource Evaluation: A Survey of Key Characteristics of the Pinus radiate and Pinus pinaster Resources in Western Australia with Links to Product Performance of Trees Sampled from Each Resource, as Determined by a Processing; Western Australian Softwood Resource: Melbourne, VIC, Australia, February 2010. [Google Scholar]
  42. Angers, V.A.; Messier, C.; Beaudet, M.; Leduc, A. Comparing composition and structure in old-growth and harvested (selection and diameter-limit cuts) northern hardwood stands in Quebec. For. Ecol. Manag. 2005, 217, 275–293. [Google Scholar] [CrossRef] [Green Version]
  43. Droessler, L.; von Luepke, B. Canopy gaps in two virgin beech forest reserves in Slovakia. J. For. Sci. 2005, 51, 446–457. [Google Scholar]
  44. Zeibig, A.; Diaci, J.; Wagner, S. Gap disturbance patterns of a Fagus sylvatica virgin forest remnant in the mountain vegetation belt of Slovenia. For. Snow Landsc. Res. 2005, 79, 2. [Google Scholar]
  45. O’Hara, K.L.; Nesmith, J.C.B.; Leonard, L.; Porter, D.L. Restoration of old forest features in coast redwood forests using earlystage variable-density thinning. Restor. Ecol. 2010, 18, 125–135. [Google Scholar] [CrossRef]
  46. Oliver, C.D.; Larson, B.C. Forest Stand Dynamics. Wiley: New York, NY, USA, 1996; p. 520. [Google Scholar]
  47. Mellinger, M.V.; McNaughton, S.J. Structure and function of successional vascular plant communities in central New York. Ecol. Monogr. 1975, 45, 161–182. [Google Scholar] [CrossRef]
  48. Tilman, D.; Downing, J.A. Biodiversity and stability in grasslands. Nature 1994, 367, 363–365. [Google Scholar] [CrossRef]
  49. Tilman, D. Biodiversity: Population versus ecosystem stability. Ecology 1996, 77, 350–363. [Google Scholar] [CrossRef]
  50. Schläpfer, F.; Schmid, B.; Seidl, I. Expert estimates about effects of biodiversity on ecosystem processes and services. Oikos 1999, 84, 346–352. [Google Scholar] [CrossRef]
  51. Cardinale, B.J.; Matulich, K.L.; Hooper, D.U.; Byrnes, J.E.; Duffy, E.; Gamfeldt, L.; Balvanera, P.; O’Connor, M.I.; Gonzalez, A. The functional role of producer diversity in ecosystems. Am. J. Bot. 2011, 98, 572–592. [Google Scholar] [CrossRef] [PubMed]
  52. Liang, J.; Buongiorno, J.; Monserud, R.A.; Kruger, E.L.; Zhou, M. Effects of diversity of tree species and size on forest basal area growth, recruitment, and mortality. For. Ecol. Manag. 2007, 243, 116–127. [Google Scholar] [CrossRef]
  53. Piotto, D. A meta-analysis comparing tree growth in monocultures and mixed plantations. For. Ecol. Manag. 2008, 255, 781–786. [Google Scholar] [CrossRef]
  54. Pretzsch, H.; Schütze, G. Transgressive overyielding in mixed compared with pure stands of Norway spruce and European beech in Central Europe: Evidence on stand level and explanation on individual tree level. Eur. J. For. Res. 2009, 128, 183–204. [Google Scholar] [CrossRef]
  55. Wacker, L.; Baudois, O.; Eichenberger-Glinz, S.; Schmid, B. Effects of plant species richness on stand structure and productivity. J. Plant Ecol. 2009, 2, 95–106. [Google Scholar] [CrossRef]
  56. Forrester, D.I. The spatial and temporal dynamics of species interactions in mixed-species forests: From pattern to process. For. Ecol. Manag. 2014, 312, 282–292. [Google Scholar] [CrossRef]
  57. Binkley, D. Seven decades of stand development in mixed and pure stands of conifers and nitrogen-fixing red alder. Can. J. For. Res. 2003, 33, 2274–2279. [Google Scholar] [CrossRef]
  58. Morin, X.; Fahse, L.; Scherer-Lorenzen, M.; Bugmann, H. Tree species richness promotes productivity in temperate forests through strong complementarity between species. Ecol. Lett. 2011, 14, 1211–1219. [Google Scholar] [CrossRef] [PubMed]
  59. Emborg, J. Suppression and release during canopy recruitment in Fagus sylvatica and Fraxinus excelsior, a dendro-ecological study of natural growth patterns and competition. Ecol. Bull. 2007, 52, 53–67. [Google Scholar]
  60. Collet, C.; Chenost, C. Using competition and light estimates to predict diameter and height growth of naturally regenerated beech seedlings growing under changing canopy conditions. Forestry 2006, 79, 489–502. [Google Scholar] [CrossRef]
  61. Young, C.G.; Dale, M.R.T.; Henry, G.H.R. Spatial pattern of vegetation in high arctic sedge meadows. Ecoscience 1999, 6, 556–564. [Google Scholar]
  62. Hou, J.H.; Mi, X.C.; Liu, C.R.; Ma, K.P. Spatial patterns and associations in a Quercus-Betula forest in northern China. J. Veg. Sci. 2004, 15, 407–414. [Google Scholar]
  63. Wiegand, T.; Moloney, K.A. Rings, circles, and null-models for point pattern analysis in ecology. Oikos 2004, 104, 209–229. [Google Scholar] [CrossRef]
  64. Tang, M.P. Study on Spatial Structure Optimizing Model of Stand Selection Cutting. Sci. Silvae. Sin. 2004, 40, 25–31. [Google Scholar]

