Article

Selection of Provenances to Adapt Tropical Pine Forestry to Climate Change on the Basis of Climate Analogs

1
Centre for Wood Science and Technology, University of Hamburg, Hamburg, Germany
2
International Centre of Tropical Agriculture (CIAT), Cali, Colombia
3
Bioversity International, Americas Office, Cali, Colombia
4
Ghent University, Faculty of Bioscience Engineering, Coupure Links 653, 9000 Gent, Belgium
5
International Tree Breeding and Conservation Program (Camcore), North Carolina State University, Raleigh, NC, USA
*
Author to whom correspondence should be addressed.
Forests 2013, 4(1), 155-178; https://doi.org/10.3390/f4010155
Submission received: 14 August 2012 / Revised: 20 February 2013 / Accepted: 25 February 2013 / Published: 20 March 2013

Abstract

:
Pinus patula and Pinus tecunumanii play an important role in the forestry sector in the tropics and subtropics and, in recent decades, members of the International Tree Breeding and Conservation Program (Camcore) at North Carolina State University have established large, multi-site provenance trials for these pine species. The data collected in these trials provide valuable information about species and provenance choice for plantation establishment in many regions with different climates. Since climate is changing rapidly, it may become increasingly difficult to choose the right species and provenance to plant. In this study, growth performance of plantings in Colombia, Brazil and South Africa was correlated to the degree of climatic dissimilarity between planting sites. Results are used to assess the suitability of seed material under a changing climate for four P. patula provenances and six P. tecunumanii provenances. For each provenance, climate dissimilarities based on standardized Euclidean distances were calculated and statistically related to growth performances. We evaluated the two methods of quantifying climate dissimilarity with extensive field data based on the goodness of fit and statistical significance of the climate distance relation to differences in height growth. The best method was then used as a predictor of a provenance change in height growth. The provenance-specific models were used to predict provenance performance under different climate change scenarios. The developed provenance-specific models were able to significantly relate climate similarity to different growth performances for five out of six P. tecunumanii provenances. For P. patula provenances, we did not find any correlation. Results point towards the importance of the identification of sites with stable climates where high yields are achievable. In such sites, fast-growing P. tecunumanii provenances with a high but narrow growth optimum can be planted. At sites with climate change of uncertain direction and magnitude, the choice of P. patula provenances, with greater tolerance towards different temperature and precipitation regimes, is recommended. Our results indicate that the analysis of provenance trial data with climate similarity models helps us to (1) maintain plantation productivity in a rapidly changing environment; and (2) improve our understanding of tree species’ adaptation to a changing climate.

1. Introduction

1.1. Background

Climate change, and the associated shifts and changes in temperature and precipitation patterns, are likely to affect substantial areas of forest plantation production in the tropics and subtropics. Progressive climate change may make the choice of which species and provenance to plant increasingly difficult. Statistical models, as well as process- and ecophysiologically-based models, suggest a substantial loss of production in plantation forestry, unless appropriate action is taken. It is common practice to choose seed material which is climatically suited to the planting site. However, if climate change proceeds as predicted [1], seed material that is well matched under the current climate will grow in sub-optimal conditions within the production cycles of the upcoming decades [2]. Forest plantations will need to take anticipated climate conditions into account in order to maintain productivity in future harvest cycles. Therefore, seed material, adapted to the novel climate conditions, needs to be immediately identified and selected [3,4]. Sustaining production by identifying the right seed sources for specific sites needs to happen in a time where planted forests become increasingly important to meeting global wood demand and potentially relieving pressure on natural forests in the face of growing demand and dwindling supplies [5,6,7]. Furthermore, the potential of planted forests to sequester substantial amounts of carbon constitutes an important cornerstone in global climate change mitigation strategies (e.g., [8,9]).
International multi-site provenance trials that measure growth performances of different seed sources in a range of different climates, provide a wealth of information on the adaptive capacity of species provenances that may facilitate selection of seed material for changing climate conditions. Camcore, North Carolina State University (International Tree Breeding and Conservation Program) collected seeds from 40 tropical and subtropical tree species in natural stands. In the last three decades, these seed collections were used to establish more than 1000 ha of field trials [10]. Data from these trials, coupled with high resolution climate data, provides useful information to predict how the growth of economically important plantation tree species is affected by progressive climate change.

1.2. The Analogue Method

Climate analogs are a promising approach to assess differences in provenance performance and their relation to climatic factors. A spatial climate analog in our context, where we want to know which provenance to plant in future climates, draws insights from a location where knowledge on the interaction of climate and tree growth exists and relates these insights to locations in other areas with a similar climate. A temporal climate analog analyses knowledge on past interactions between climate and growth performance to develop an understanding of the present day and make inferences about the future [11,12]. The analog method can help to identify spatial and temporal analog sites to provide insights into the vulnerability of crops or species to climate change, support field evaluation, and create a network through which knowledge on well-adapted cultivars can be passed on. The analog method may also prove to be a very useful tool in pointing decision makers in the forestry sector in the right direction—to support a rational planting decision and sustain, or even improve, wood production in a rapidly changing environment.
Calculating climate dissimilarities (identifying locations which resemble current climate conditions that are expected to be encountered at another location in the future) for the purpose of providing decision support in a changing environment has lately received a great deal of attention (e.g., [13,14,15]). In the forestry sector, the concept of identifying similarities in climate to match forest seed material to certain sites, in order to assist species selection, is a well-established approach (e.g., [16,17,18]).

1.3. Research Objectives

In this study, we assess the extent to which the climate analog method can provide concrete recommendations to adapt planted forests to climate change through a better use of forest genetic resources. We ascertain this question in a case study in which we test the ability of this approach to relate climate dissimilarity to the trial’s growth performance. This approach lets us identify appropriate seed material of P. patula and P. tecunumanii for degraded areas and established planted forests in Colombia, Brazil and South Africa.
First, we evaluated with P. patula and P. tecunumanii provenance trial data, which, with two ways to measure climate dissimilarity, correlates better with provenance height growth. Secondly, we show how the analog method that resulted in dissimilarity measures that correlated better with height can be used to identify well-adapted provenances for specific plantation sites. We use P. patula and P. tecunumanii as model species to demonstrate the potential and the restrictions in the application of climate analogs to support management plans to adapt existing and planned forest plantations with expected harvest times around 2030 and 2050.

2. Experimental Section

2.1. Camcore’s International Provenance Trial Data

The comparison and validation of the two analog methodologies was based on height growth data from ten provenances of P. patula and P. tecunumanii at age eight, measured at several test sites (ranging from six to 22 sites depending on the provenance). The data were retrieved from a database of 153 geo-referenced provenance trials, established by CAMCORE members in Colombia, Brazil and South Africa during 1981 and 1997 [10,19,20]. Coordinates were carefully checked following Hijmans et al. [21] and are considered to be correct. All trials were measured for height [m], diameter at breast height (dbh) [cm] and survival. Trial management, such as site preparation, spacing of trees, weed control, thinning, and pruning was as similar as practical in the field.

2.2. Study Species’ Description
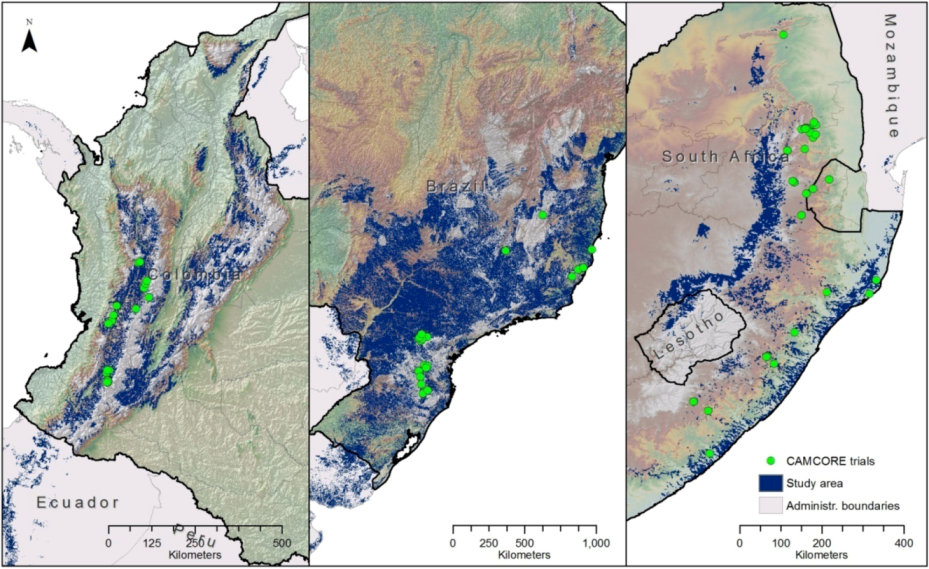
The two closed-cone pine species P. patula and P. tecunumanii are native to Mesoamerica. Both play an important role as plantation species for the forestry sector in the tropics and subtropics, which is typically lacking adequate resources of coniferous wood. Pinus patula is one of the most planted pine species, with close to one million ha established in productive forest plantations [22]. Lesser amounts of P. tecunumanii are used in plantations, but it is an important plantation species in Colombia and due to its favorable growth characteristics and comparatively high resistance against pitch canker [23], the species is gaining importance in Brazil and Southern Africa [24]. The natural distribution range of Pinus patula extends from the mountainous regions of the state of Tamaulipas in Mexico’s East to Veracruz in the country’s south. The species can be divided into the two varieties P. patula var. patula and P. patula var. longipedunculata [24]. Individual provenances of P. patula contain seeds from both varieties. P. tecunumanii natural distribution range extends from Chiapas, Mexico to Nicaragua. The species can be divided into two ecotypes based on the altitude where they occur. A highland ecotype (HE) is found in cloud forests at altitudes between 1500 and 2900 m.a.s.l., and a lowland ecotype (LE) of P. tecunumanii occurs at altitudes between 450 and 1500 m.a.s.l. [25]. These ecotypes have also shown to be genetically different in molecular marker analysis [26].

2.3. The Study Area

The study area is restricted to cultivated and degraded areas that are suitable for P. patula and P. tecunumanii plantations. The area selected for this study comprises a topographic range from 51 m below sea level to 3371 m of altitude and diverse climates that range from tropical conditions in the Colombian highlands, where annual rainfall frequently exceeds 3000 mm, to the dry, subtropical conditions characterized by cold and dry winters in subtemperate South Africa. The maximum annual mean temperature there exceeds 20 °C, but temperature seasonality is more than 10 times as high as in Colombia. In South Africa, in the coldest quarter of the year, the temperature drops below 0 °C. The trials were planted by Camcore partners in parts of the northern tropical Andes in Colombia, and in southern Brazil, where trials are established in the states of Minas Gerais, Epirito Santo, Parana and Santa Catarina. Trial sites in South Africa are located in the country’s eastern escarpment from the Eastern Cape Province to Mpumalanga Province.
A so-called mask was developed that only comprises areas which have a similar bioclimatic setup to the climate in which trials, with high survival rates, were established. The study area is restricted to a bioclimatic niche where the species exhibited a survival rate of at least 70% (Figure 1). This bioclimatic niche was confined by maximum and minimum values of five variables derived from trial sites where species exhibited high survival rates. The five variables used to confine the study area (annual mean temperature, maximum mean temperature of the warmest and coldest month, annual precipitation, and precipitation seasonality) are all known to be of physiological importance to the species [27,28]. The masked area was further reduced by excluding all protected areas based on the World Database of Protected Areas [29]. We used global land cover data to restrict the study area to agricultural crop, or managed land [30,31,32]. In this way we avoid planting suggestions that would promote undesired land-use changes such as of biodiversity-rich Colombian Andean, Brazilian Atlantic and South African landscapes into planted forests.
Figure 1. Map of study area and location of Camcore’s provenance trials.
Forests 04 00155 g001

2.4. Climate Data

Current climate data, used to define sites with conditions with similar climatic conditions were derived from the WorldClim database with interpolated climate data from 1960–1990 [33]. The interpolated climate surfaces have a resolution of five arc-minutes which, at the equator, equals approximately 85 km2. Variables from the database included in this study are monthly total precipitation, monthly mean temperature, diurnal temperature range and 19 derived bioclimatic variables [34].
We use an ensemble of General Circulation Models (GCMs) to develop climate layers for 2030’s and 2050’s future climate (Table 1). We use three emission scenarios to account for uncertainties in global socioeconomic developments (15 GCM for scenario A1b, 12 for A2 and 14 for B1). These scenarios allow for variations in variables that are related to human population and economic growth and the degree at which technological advances are developed, implemented and exchanged. The three scenarios used in this study are taken from IPCCs 4th special report on Emission Scenarios [3] and reflect the following:
  • a homogeneous world with rapid economic growth that relies on a balance of all energy sources (emission scenario A1b);
  • a more divided world with focus on regionally oriented economic development and slower and more fragmented technological changes (emission scenario A2);
  • an integrated world that is more ecologically friendly and emphasizes global solutions to achieve economic, social and environmental stability (emission scenario B1) [3].
Table 1. List of 20 GCMs used to calculate of climatic dissimilarities for the year 2030 and 2050.
GCMDeveloped byInstitute-/Model Name
BCCR-BCM 2.0Bjerknes Centre for Climate ResearchUniversity of Bergen, Norway
CNRM-CM 3Centre Européen de Recherche et de Formation Avancée en Calcul ScientifiqueCentre National de la Recherche Scientifique
GFDL CM 2.0 and 2.1Geophysical Fluid Dynamics LaboratoryNational Oceanic and Atmospheric Administration
GISS Model ER and AOMGoddard Institute for Space StudiesNational Aeronautics and Space Administration
IPSL CM 4Institute Pierre Simon LaplaceCentre National de la Recherche Scientifique
MIUB ECHO-GMeteorologisches Institut der Universität BonnFriedrich-Wilhelms Universität Bonn
NCAR CCM 3.0National Center for Atmospheric ResearchCommunity Climate System Model
CCCMA CGCM 3.1 t46 and t63Canadian Centre for Climate Modelling and AnalysisMeteorological Service of Canada
CSIRO Mk 3.0 and 3.5Commonwealth Scientific and Industrial Research OrganisationMarine and Atmospheric Research Laboratories
IAP FGOALS g1.0Institute of Atmospheric PhysicsChinese Academy of Sciences
MIROC 3.2 Hires and MedresCentre for Climate System Research, TokyoModel for Interdisciplinary Research On Climate
MPI ECHAM 5Max Planck Institute for MeteorologyEuropean Centre Hamburg Model
UKMO HADCM 3United Kingdom Meteorological OfficeHadley Centre Climate Model
INM CM 3.0Institute of Numerical MathematicsRussian Academy of Science
MRI CGCM 2.3 2aMeteorological Research Institute, JapanCoupled General Circulation Model

2.5. Data Preparation

For each pair of trials of the same provenance, climate distances were calculated for the current climate and the expected climate in 2030 and 2050. We compared two methodologies using current climate data to calculate dissimilarities. The method that provides the strongest relationship between performance and climate distance was selected to project results into the future. Geographical Information Systems (GIS) were used to import the gridded dataset from R to map model predictions for forestry productions areas [35,36].
For six P. tecunumanii and four P. patula provenances, there was sufficient information available to develop a model (Table 2).
Table 2. Provenances’ identification number, name, species, subpopulation, country of origin and number of trials where it was evaluated.
Id NumberProvenance NameSpeciesSubpopulation/VarietyCountry, State of OriginNo of Trials
1JocónP. tecunumaniilow elevationHonduras, Yoro9
2CampamentoP. tecunumaniilow elevationHonduras, Olancho7
3ChempilP. tecunumaniihigh elevationMexico, Chiapas6
4San JerónimoP. tecunumaniihigh elevationGuatemala, Baja Verapaz9
5Mountain Pine RidgeP. tecunumaniilow elevationBelize, Cayo6
6Sierra HuayacocotlaP. patulaPatulaMexico, Veracruz9
7Potrero de MonroyP. patulaPatulaMexico, Veracruz22
8ChanalP. tecunumaniihigh elevationMexico, Chiapas11
9El CieloP. patulaPatulaMexico, Tamaulipas7
10Conrado CastilloP. patulaPatulaMexico, Tamaulipas14

2.6. The Analog Methods

The methods we use in this study were developed as part of a joint collaboration between the Walker Institute at the University of Reading, the International Center for Tropical Agriculture (CIAT), and the Climate Impacts Group at the University of Leeds. We compare two implementations that differ in the way environmental parameters are used to compute climate similarities and evaluate which set of climate similarity measures relate better to provenance growth performance. We termed the first method CCAFS dissimilarity. The second method computes dissimilarities with stepwise selected BIOCLIM variables.

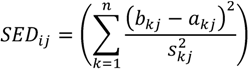
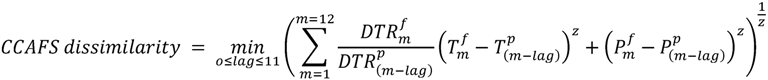
2.6.1. CCAFS Dissimilarity, Hereafter Method A

CCAFS dissimilarity’s computation closely follows a metric that Williams [13] used to identify climate states with no current analog and disappearance of extant climates. To describe similar climate conditions, Williams [13] referred to four climate variables: mean surface air temperature and precipitation from June to August and from December to February. The equation he uses calculates Standard Euclidean Distances (SEDs) between a pair of sites [1]:
Forests 04 00155 i001
where akj is the value for climate variable k under current climate and bkj for future projected climate at gridpoints i and j. skj is the standard deviation of the interannual variability under the current climate [13].
The CCAFS dissimilarity method that was used in this study also computes Euclidean distances, but uses monthly mean values of temperature, precipitation and diurnal temperature range to express climate dissimilarities. Future and present climates are described as m sequential temperature and precipitation vectors [2]. Dissimilarity is then calculated as Euclidean distance between the variables’ vectors for reference (f) and target (p) scenario:
Forests 04 00155 i002
where DTR is diurnal temperature range, T is temperature, P is precipitation, m is month, p is present and f is future. The time lag searches across 12 months for minimum dissimilarities to capture the fact that not all locations experience the same timing in seasonal variation [37]. The z parameter can be varied to perform a sensitivity analysis, but, in this study, the z parameter was kept constant at 2 to calculate standard Euclidean distances. This metric weighs temperature differences by the quotient of the respective diurnal temperature ranges. The calculated value is termed dissimilarity—instead of a similarity value—to conveniently follow the scaling of the CCAFS measure, where higher values indicate a more dissimilar pair of sites.

2.6.2. CCAFS with Stepwise Selected BIOCLIM Variables, Hereafter Method B

For the second method, only climate variables are used for the computation of dissimilarities that are significantly related to height growth. The stepwise regression used to identify these variables is a common method in variable selection for site growth models [38,39,40]. All calculations were done in R [35]. The retention criterion was set to be Bayesian Information Criterion (BIC).
Some environmental variables predicted height growth best through a quadratic regression. To enable the multiple linear regression model to account for these quadratic effects, the stepwise regression picked from a pool of variables that contained the linear as well as the centered squared version of the 19 bioclimatic variables. The development of squared centered variables is a recommended method to improve linear regression models in the presence of quadratic effects [41]. To guard against the negative effects of multicollinearity on the stability of regression coefficients and significance levels [42], variance inflation factors (Vif) were calculated. Variables were taken out of the modeling process if their Vif-score exceeded 10, which is a common threshold to test for multicollinearity [43]. Regression equations were tested using a five-fold cross-validation, and the mean square error for each multiple linear regression function was denoted.
The climate variables found by the stepwise regression for each provenance were then used as input variables to compute SEDs following the CCAFS method adapted to the variables selected via stepwise regression [2].

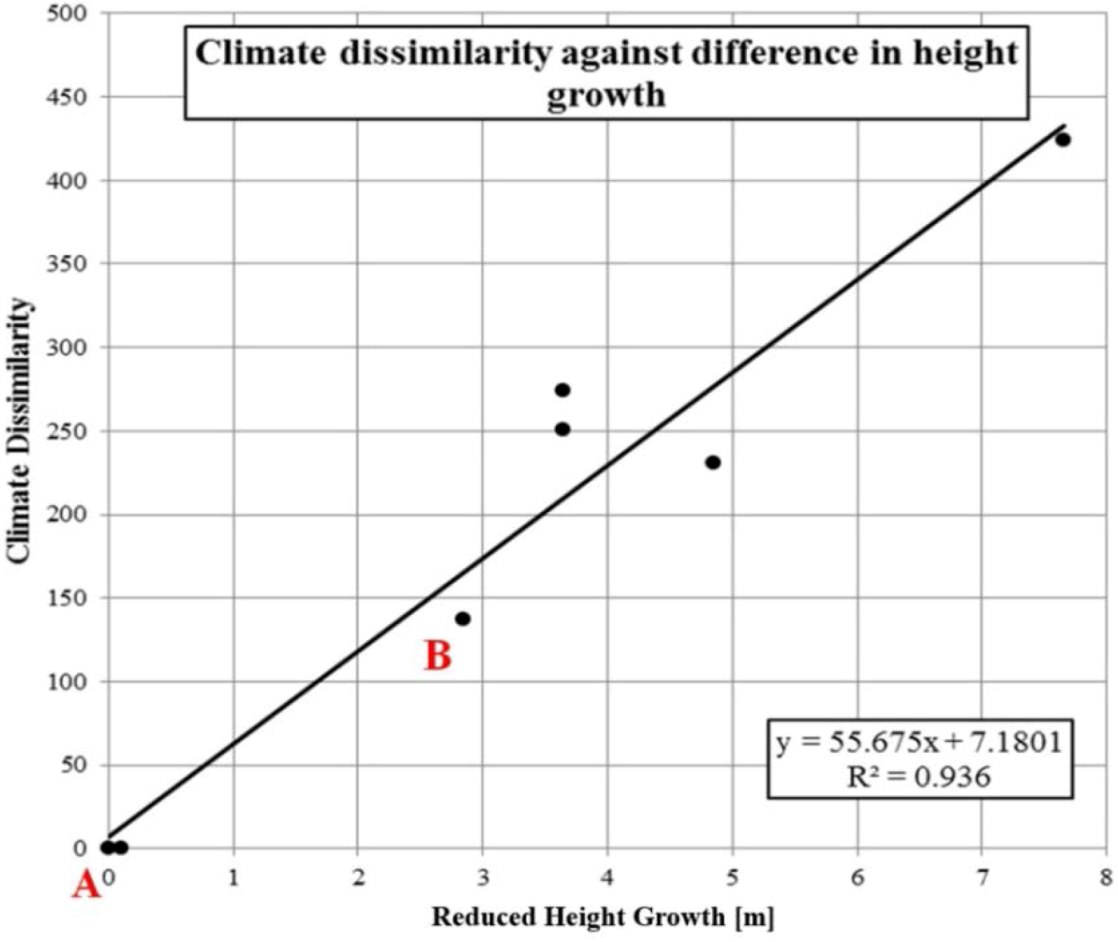
2.7. Evaluating Dissimilarities in Climate as a Provenance Performance Indicator

We calculate dissimilarity values for each provenance and method for the gridded study area.
We use for each provenance the best performing site as a reference point for the grid calculation (point A) because of the following reasons. (1) Practically, the forestry sector should be interested in climate analogs in order to optimize performance at each location; and (2) We therefore hypothesize that each provenance has an optimum climate for height growth and that height growth reduces when climate varies drastically from the optimal climate. To test our hypothesis, we calculated 10 dissimilarity grids, one for each provenance, and in each case used the coordinates of the most successful trial as a reference. Climate dissimilarity values calculated for coordinates where remaining trials of the same provenance were planted should be clearly related to differences in height growth. If our hypothesis is true, the differences in height performance relative to the best trial should show a significant correlation with the calculated dissimilarity value for each of the trials where the provenance was planted. The goodness of fit of this correlation expresses how well the calculation of climate dissimilarities relates to provenance performance (Figure 2). The linear regression example accounts for 93.6% of the variability in the variable height growth (R2 = 0.936). The point marked A indicates the reference trial with top height growth for which climate dissimilarities have been calculated. The point marked B indicates a trial planted with seeds from the same provenance, in this case P. tecunumanii provenance Campamento, at another location. This trial B exhibited 2.85 m less height growth as compared to the top trial (A) and is found at a location associated with a climate dissimilarity value of 137 as compared to the climate found at the location of the top trial.
Figure 2. Scatter plot exemplifying the linear correlation of climate dissimilarity and height growth for one single provenance.
Forests 04 00155 g002

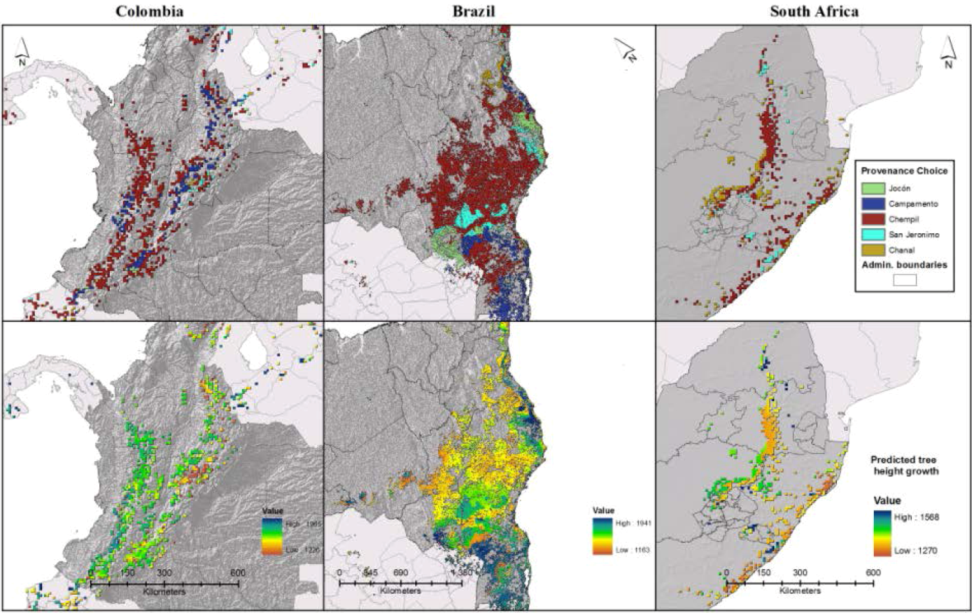
2.8. Spatialization of Results and Growth Predictions

The analog method that is found to provide climate dissimilarity values that most successfully relate to provenance growth differences is used to predict provenances’ height growths under current and future climate conditions. The evaluation was based on goodness of fit (R2) and statistical significance of the relationship.
To estimate growth performances during the next two rotations, the study considers projected climate conditions for the years 2030 and 2050 [44]. Three global socioeconomic development paths are considered by running the analog tool for three SRES emission scenarios: A1b, A2, and B1 for each GCM [45].
Climate dissimilarity was computed in two ASCII grids for every provenance (10 in total), time step (current climate conditions, 2030s, 2050s) and for each GCM model. The first grid indicates which trial is climatically most similar to a site of interest. The second grid calculates a dissimilarity value for this site of interest and the trial indicated by the first grid. Each GCM yields a slightly different dissimilarity value for a pair of sites. The first grid’s value can be directly linked to one certain Camcore trial indicating a climatically most similar provenance and, with this, an expected height growth. The projections of the dissimilarity values are all done with climate grids that have a spatial resolution of five arc minutes.
The dissimilarity value from the second grid is used to further refine the result and to estimate height growth of climatically most similar provenance in that specific grid cell. The provenance-specific response functions developed for the analog methodology indicate how sensible the height growth of specific provenances is to climate dissimilarities from their optimal climate (Figure 2). The slope of the linear regression trend line serves as an estimator of this sensitivity. The steeper this slope the less sensitive height growth of a specific provenance is to climate dissimilarities from their optimal climate. Following the linear regression equation [3]:
Y = a + bx
where Y, the dependent variable, is the dissimilarity in climate from the reference trial, a the intercept and b the slope.
By dividing the slope (b) of the provenance response function with the dissimilarity value (Y) of a certain site, we compute the deviation from the height estimation brought about by climate dissimilarity (x). This deviation subtracted from the height, measured at the climatically most similar trial, gives us the minimum height a provenance is expected to yield at any site inside the study area.
Uncertainties in the simulations of future climate are addressed by comparing the outcomes of the multiple model runs using the different GCMs (listed under Table 1) We assumed that analog predictions are reliable across the climate models if at least 11 (more than two-thirds) of the individual GCMs calculate the same trial to be the best climate analog for a site. In order to take spatial variability in climate model uncertainty into account [46] uncertainties were individually calculated for Colombia, Brazil and South Africa.

3. Results

3.1. Definition of Study Area

Trials exhibited a survival rate of at least 70% where mean annual temperature was between 12.4 and 24.6 °C, maximum temperature of warmest month does not exceed 33.1 °C and average minimum temperature of the coldest month does not fall below 0 °C. Annual rainfall was in the range of 720 and 2666 mm and precipitation seasonality between 88 and 13. The cultivated and degraded areas comprised in this climatic niche cover an area of 2.37 million km2. Of this area, 5.75% lies inside the administrative boundaries of Colombia, 84.53% in Brazil, and 9.72% in South Africa, Lesotho, and Swaziland.

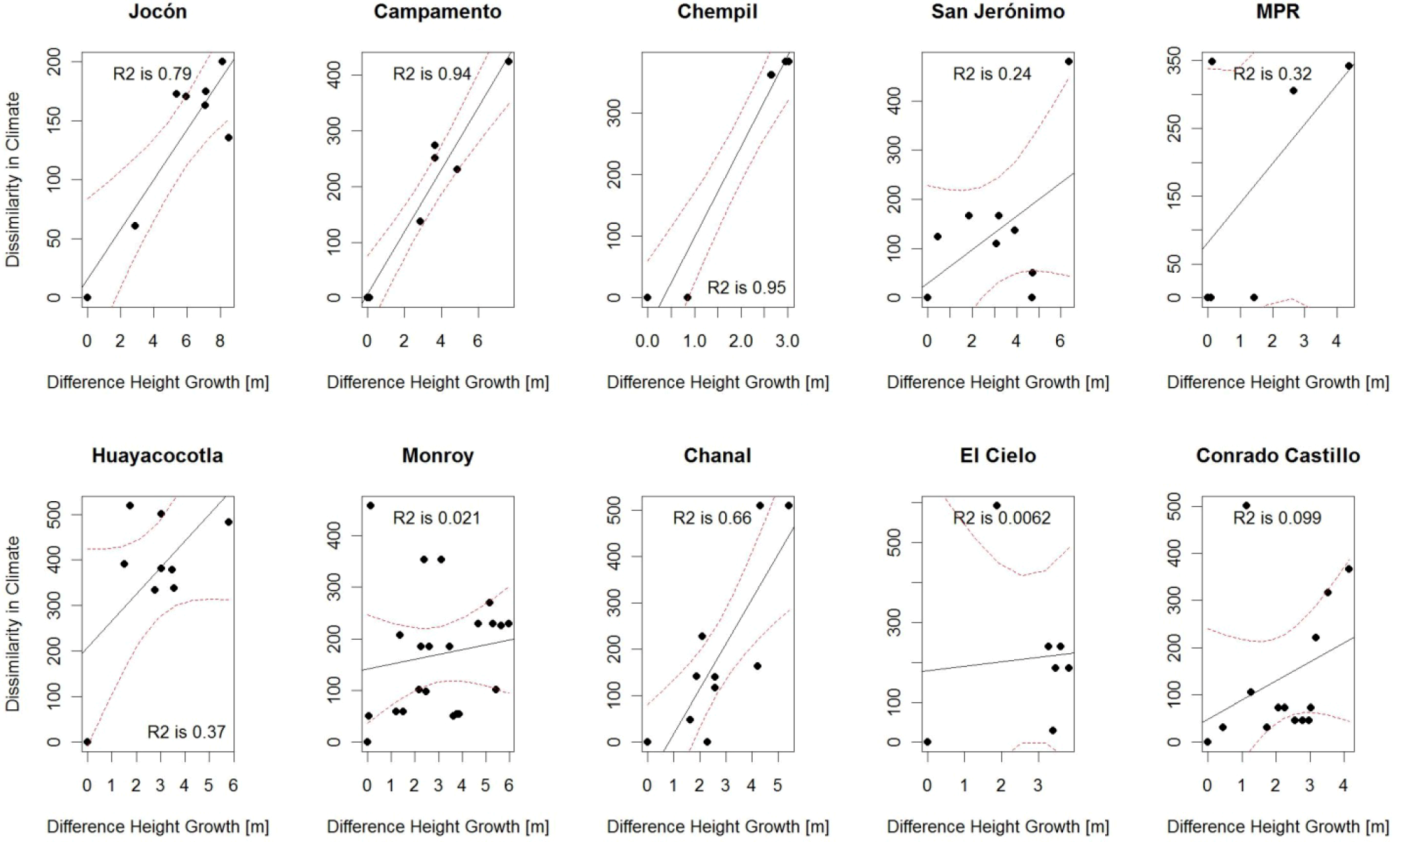
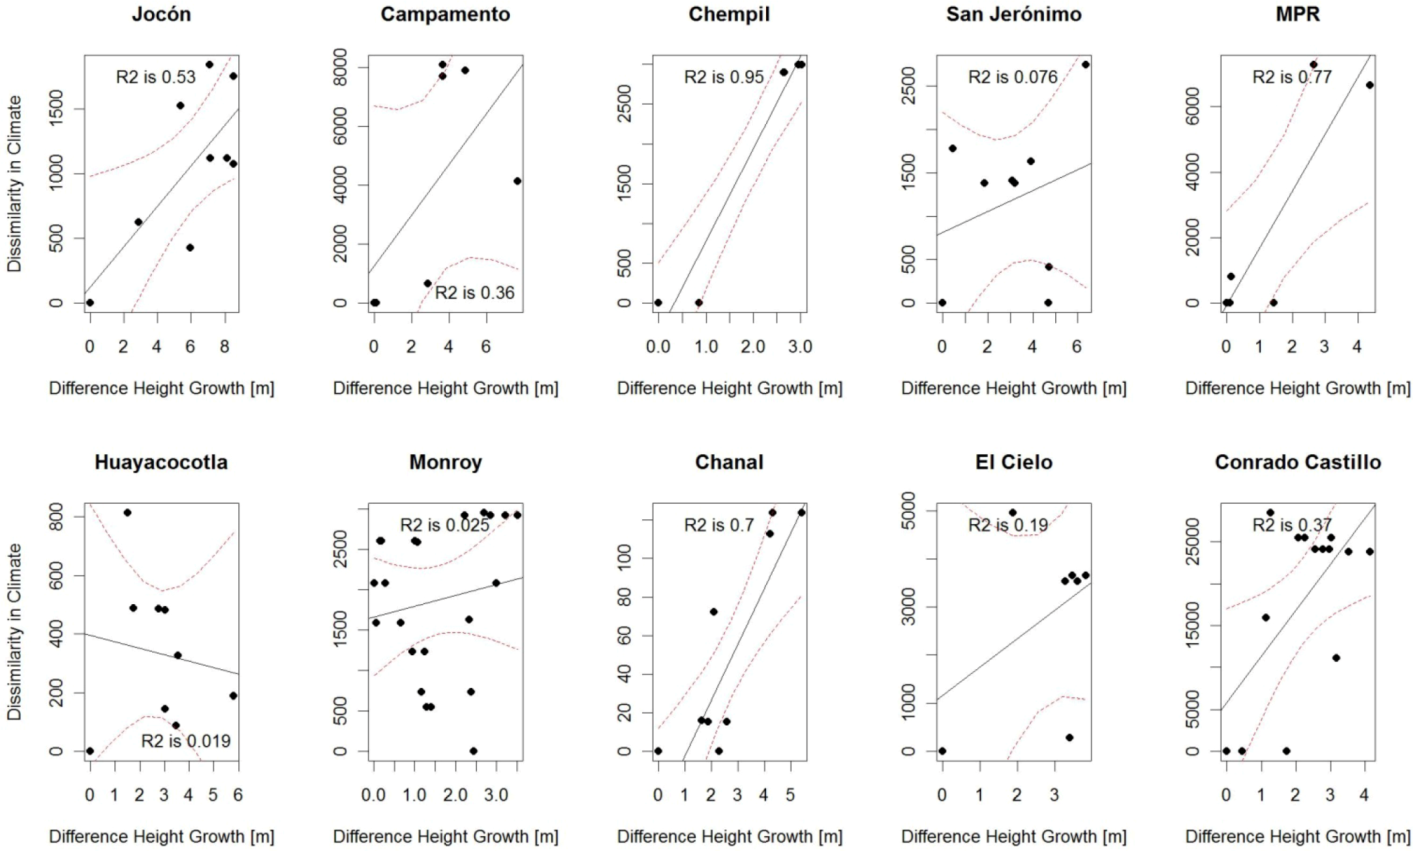
3.2. Comparison of Analog Methods in Their Ability to Predict Provenance Performance

The method that provided climate dissimilarity measures that best correlated with growth performance was selected. Selection criteria included the average R2 of the climate dissimilarity growth performance models by species and whether the provenance-specific relationships between climate dissimilarity and growth performance were statistically significant. Models resulting from using climate dissimilarity measures from method A yielded an average coefficient of determination of 0.68 for P. tecunumanii provenances and an average coefficient of determination of 0.12 for P. patula provenances. Models resulting from using climate dissimilarity measures from method B had a similar average R2 value for P. tecunumanii provenances of 0.59 and P. patula provenances of 0.15 (Table 3). Cross-validation of the method relying on stepwise selected climate variables yielded an average square root residual error of 0.92 m corresponding to an error of 7.5% (mean height of 10 provenances equals 12.28 m) which is considered to fall inside an acceptable error margin. Climate dissimilarity measure from both analog methods can thus be seen to relate equally well to growth differences. It has to be noted that while the stepwise regression algorithm is still commonly used in the field of ecological modeling, its advantages and shortcomings are a topic of recent debate among statisticians [40,47,48]. Since no method is found to be clearly superior in terms of scored R2 values, method A resulted in a relationship with a larger number of provenances. With respect to Pinus patula, only regression functions for the provenance Sierra Huayacocotla (6) for standard method A and Conrado Castillo (10) for method B were not significant at α 0.1 (Table 3). The values in the table indicate coefficient of determination scores of the 10 regression function developed to validate the two methods. The level of significance is coded according to the regression’s p-value: 0.001(***), 0.01(**), 0.05(*), 0.1(.), 1( ). All regressions for P. tecunumanii developed using the standard CCAFS method, except Mountain Pine Ridge (ID 5), are significant at the 0.1 level. Four out of five of these regressions are significant at the 0.01 level.
Table 3. Table summarizing the results of the analog method comparison.
Pinus tecunumanii provenancesPinus patula provenances
123458Average1R267910Average2R2
CCAFS0.79 **0.94 ***0.95 ***0.44 .0.32 0.66 **0.680.37 .0.02 0.01 0.10 0.12
BIOCLIM0.53*0.36 0.95 **0.25 0.77 *0.70**0.590.02 0.03 0.19 0.37 *0.15
Figure 3, Figure 4 depict the 10 regressions developed for the CCAFS method and the BIOCLIM method, respectively. They depict how well climate dissimilarity expresses differences in tree height growth at age eight for each provenance. The provenance name is indicated above each plot. The dotted line indicates the 5% confidence band for each linear regression. The number in each plot area indicates the regression’s coefficient of determination.
Method A was found most useful in relating climate dissimilarities to differences in growth in a selection of pine provenance performances and was chosen to generate spatial climate analogu and project the generated grids of climate dissimilarity into the future.
Figure 3. Results of validation of CCAFS dissimilarity computation.
Forests 04 00155 g003
Figure 4. Results of validation of CCAFS dissimilarity with stepwise-selected BIOCLIM variables.
Forests 04 00155 g004

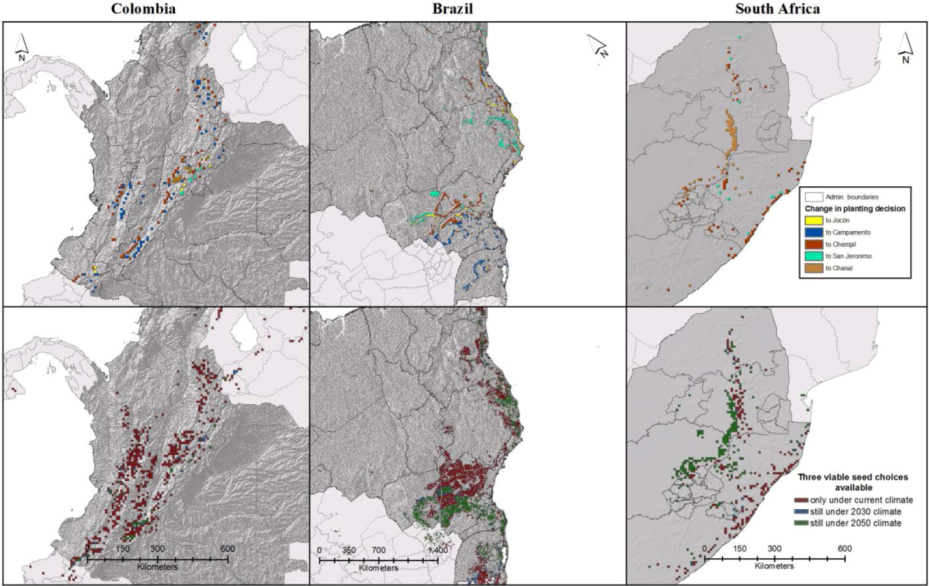
3.3. Expected Impact of Climate Change on Wood Productivity and Choice of Seed Material

Under the current climate, the P. tecunumanii HE Chempil is predicted to increase growth performance in 65.9% of the study area (Table 4). In the Colombian states of Valle del Cauca, Santander and Huila, the seeds from the provenance Campamento, originating from Honduras, are predicted to yield the highest growths rates. Campamento is also found to be the fastest-growing provenance when planted in southern Brazil, in the state of Rio Grande do Sul. In the near coastal areas of the central Brazilian states Espirito Santo and Rio de Janeiro, the P. tecunumanii LE provenances Jocón and San Jeronimo show the best height growth (Figure 5).
Table 4. Table summarizing model results of best seed choices under current and future climate conditions.
Current ClimateChange by 2030Change by 2050
ProvenanceColombiaBrazilSouth AfricaColombiaBrazilSouth AfricaColombiaBrazilSouth Africa
Jocon **1.94 6.960.07−1.19−0.89-−1.38−0.67-
Campamento ***21.0714.020.041.002.31-2.194.02-
Chempil ***74.6169.0858.230.16−0.74−2.23−1.50−2.16−9.63
San Jeronimo .1.577.4110.50−0.66−0.013.08−0.60−0.624.45
Huay .---------
Chanal **0.822.5431.160.69−0.67−0.741.29−0.585.29
Figure 5. Map of best seed choice and predicted height growth under current climate conditions.
Forests 04 00155 g005
The population Chanal, originating from HE seed sources, are predicted to show favorable growth rates in parts of Eastern Cape provenance and in the northern part of Natal and Zululand. A promising seed source for Swaziland and Mpumalanga province of South Africa is San Jeronimo, from the state of Baja Verapaz in central Guatemala. The best performing P. patula provenance according the climate dissimilarity model is Sierra Huayacocotla originating from Veracruz, Mexico. The provenance was not the best seed source for any portion of the geographic area considered. Nevertheless, as the second-best planting alternative, seeds from Sierra Huayacocotla are of importance in 16.2% of the study area.
Climate change is predicted to significantly alter the choice of seed material by 2030 in 14.6% and by 2050 in 18.7% of the study area. In Colombia, the choice of seed material for harvesting between 2020 and 2050 should be changed in 21% of the study area to adapt adequately to these climates. In Brazil, 11.6 and in South Africa 23.3% of the study area is subject to change. By 2050, a change is predicted to be necessary in 23.8% of the study area in Colombia of 17% in Brazil and of 27.8% in South Africa. In Brazil and Colombia, seeds from Jocon slightly lose while seeds, especially from the provenance Campamento, gain importance by 2030. In South Africa, the provenance Chanal is losing while Chempil and San Jeronimo is gaining importance as most suitable seed material (Table 4). The numbers in Table 4 indicate in what percentage of the study area the respective provenance was found to exhibit the highest expected height growth under current climate. The table gives this information for sites in Colombia, Brazil and South Africa separately. The values under column “Change by 2020” and “Change by 2050” show the change brought about by climate change. These values are the average change predicted to occur by the utilized three emission scenarios, a1b, a2, and b1. The symbols next to the provenance names are used to depict the level of significance according to the regression’s p-value 0.001(***), 0.01(**), 0.05(*), 0.1(.), 1( ).
Selection of material adapted to climate change enables foresters to maintain yield levels. In none of the three studied countries does change in expected height growth exceed 1%. The standard deviation of height predictions, not denoted in Table 5, indicate that while yields are highest in Colombia, so is the study area’s heterogeneity in terms of modeled height growth. The numbers in Table 5 indicate expectable height growth (row 1) or change in height growth compared to current climate (row 2 and 3) if seeds from provenances are planted that show best height growth according to the analog model results. The level of significance according to the regression’s p-value range from 0.05 to 0.001.
Table 5. Estimated average height growth of the most suitable seed sources under current climate and expected change by 2030 and 2050.
ColombiaBrazilSouth Africa
current climate [m]15.2713.6213.44
change by 2030 [Δm]−0.19−0.07−0.12
change by 2050 [Δm]−0.35−0.040.02

3.4. Influence of Socioeconomic Scenarios on the Prediction’s Outcome

Differences in driving forces and emissions that underlie the projected climates for 2030 and 2050 lead to different predictions in 5.2% of the study areas. The predicted climate in year 2030 for the different emission scenarios influences the planting decision in 5% of study area. Per country, these differences make up 2.1, 5.2 and 12% in Colombia, Brazil and South Africa, respectively. By 2050 the scenario influence on planting decisions more than doubles to 13% of the study area. By 2050, these differences increase to 8.4% globally, or 6.1% in Colombia, 9% in Brazil, and 12.3% in South Africa. Differences in the predictions based on the scenarios A1b and A2 are not significant.

3.5. Available Viable Seed Choices

An important aspect for foresters to select good planting material is not only the height a provenance choice can be expected to grow under certain climates. Many other site factors such as soil characteristics or pressures from biotic threats play an important role, as well. For example, P. patula and P. tecunumanii do not grow well on poorly drained soils that remain moist. Because our approach does not account for these site factors, we evaluated and here present the best three provenances climatically suitable for a given site. These provenances should be further evaluated for pest resistance or suitability in terms of non-climatic site effects (Figure 6).
The model runs indicate that planting sites in Colombia are most sensitive to the choice of climatically well-matched seed material. Achievable yields are high but seeds should be well adapted to local climate conditions. Expected differences in height growth from the first to second-best seed choice are 4 m and 4.7 m from the 1st to 3rd choice. These differences are predicted to increase slightly until 2030. For sites in South Africa, the model runs predict that difference between the top three seed choices are low with only 1.1 m from best to third choice. Brazil exhibits with 2.1 m an average difference in expected height growth from first to third seed choice.
Figure 6. Spatial results of analog runs for projected climate conditions.
Forests 04 00155 g006

3.6. Uncertainty in Climate Change Projections

As an indicator of variability of the GCM prediction, a level of agreement between the climate models is calculated. We consider a confident level of agreement between GCMs when for all six provenances at least 11 of the 16 models predict the same trial to be climatically most similar to a certain site. A single indicator, as a measure for climate model uncertainty was calculated for each country separately. We summed up the individual level of agreement per provenance and the respective portion of the study area where this level of agreement was found. Climate uncertainties are lowest in Colombia and highest in Brazil. GCM agreement decreases from 2030 to 2050 in Colombia and Brazil by 2.1 and 2.4% respectively while in South Africa agreement increases slightly by 0.3%.

4. Discussion

Wood demand from planted forest increases rapidly [6,49] while at the same time plantations are expected to yield significantly reduced harvestable amount of timber if no appropriate action is undertaken to adapt plantation forestry to climate change [2,50]. The projected climate changes have the potential to alter the distribution of optimal planting areas and seed choices for current cultivars of the major tree crop species. Optimal niches of P. sylvestris provenances’ height growth in Eurasia and North America are predicted to shift considerably during the next 90 years [51]. Also in P. patula and P. radiata plantations in South Africa, a great loss of productivity is expected to occur unless different seed sources are selected that are appropriate for future climate conditions [52].

4.1. Climate Dissimilarity as an Estimator for Provenance Performance

Our results show that analog tools that calculate climate dissimilarity measures serve as a useful indicator to determine site–provenance–climate relationships in P. tecunumanii. The identification of climatically similar environments, coupled with future climate scenarios, suggests a change in the most suitable provenance for 11 to 23% of the study areas will occur by 2050. The outcomes of the evaluation of climate dissimilarity as provenance performance indicator for P. patula, however, suggest that the growth performance of this species is more robust to changes in the considered climate factors. This may indicate, on the one hand, that P. patula is less sensitive to changes in climate, but it could also be due to the fact that Camcore’s members planted P. patula in a climate range that is somewhat more confined than the one occupied by P. tecunumanii trials.
The dissimilarity value calculated via the CCAFS method could best be related to height and diameter growth of individual P. tecunumanii provenances. The analog methodology based on stepwise found Bioclim variables performed similarly well, but the more robust method is believed to be the CCAFS method (e.g., [47]). It does not only refrain from using the stepwise algorithm, but also accounts for interannual and seasonal variations in climate, which are believed to play an important role in influencing crops and tree growth [53,54,55].
Individual provenances’ growth performance related well to the calculated dissimilarity values (e.g., provenance Jocón, Campamento, Chempil, and Chanal). For P. tecunumanii, the study suggests that intra-specific variation and forest plantations’ growth rates can be related to the geographic origin of the reproductive material [10,56].
Our analog models calculate statistical, mathematical similarity in climates for sites where successful provenance trials were established and are not bound by the fact that a species in the wild may only realize a fraction of its fundamental niche (e.g., [57]). Developing planting advice from the identification of climate analog to successful trials from multisite provenance tests, avoids a major shortcoming of similarity models that make predictions based on species’ natural distribution ranges. These models neglect the incongruity of a species’ fundamental and realized niche, whereas the CCAFS analog approach has the possibility to account for the full adaptive capacity of the tested species.

4.2. “Analogues’” Performance in Relation to Species’ Stability across Environments

A common approach in tree breeding for assessing a provenance’s stability across environments regresses provenance and family means on the mean of the trial site [58]. The underlying thought is that an unstable source would provide higher yields than the “climate safe” stable source. The breeder has to decide if it is better to choose stable or unstable genetic entries for the tree improvement or planting program [59]. A forester faces very much the same situation when selecting a seed source for planting. In the context of climate change, the choice may very well turn in favor of the lower yielding but more reliable source.
The box plot in Figure 7 shows measured height growth for P. tecunumanii low elevation subpopulation (Low), P. tecunumanii high elevation subpopulation (High) and P. patula’s two varieties var. patula (patula) and var. longipedunculata (longip). The upper and lower boundary of the box depict the first and third quartiles, and the line indicates the maximum and minimum measured height. The horizontal line inside the box indicates the height distribution’s median. Results from evaluating the relation between climate dissimilarity to growth performance support the specialization hypothesis for phenotypic plasticity (compare [60,61,62]). This hypothesis postulates that plants that are relatively specialized to a particular environment should exhibit a relatively high magnitude of phenotypic plasticity across a range of alternative environments, particular for characteristics that most closely estimate fitness which, in our study, is height growth.
Figure 7. Box plot of mean height growth at age eight.
Forests 04 00155 g007
The findings (Figure 3 and Figure 4) indicate a relatively large degree of specialization of the P. tecunumanii provenances to their natural environment which results in phenotypic instability as they are introduced to new environments. The large standard deviation in P. tecunumanii (HE) growth may partly be attributed to stem breakages common for this population [63]. The even larger standard deviation present in the measurements for P. tecunumanii (LE), however, cannot be explained by this defect alone (Figure 7). It could partly be the result of the degree of natural introgression with P. oocarpa [26], but is more likely than not attributed to LE’s large degree of specialization to its environment. Seed material from P. patula provenances growing in Mexico at elevations from 1490 to 2920 m, is likely to be adapted to a broader range of climate conditions than the narrowly distributed P. tecunumanii, as temperature and precipitation patterns change along the elevation gradient. The “analog” validation results suggest that P. patula provenances are rather tolerant to different climate conditions and may be less specialized, or in other terms, less narrowly adapted to a particular climate niche than P. tecunumanii’s LE. P. patula provenances exhibit a rather low degree of phenotypic plasticity and do not react sensitively to changes in climate in terms of height growth. Different climates evaluated with CCAFS’s analog method expressed through temperature, precipitation and diurnal temperature vectors do not seem to trigger P. patula’s height or diameter growth (Figure 3).
P. patula’s insensitive reaction to a broad range of climates makes it especially valuable in an unstable climate. In the face of great climate uncertainty, and the shortcomings of climate models to reliably predict temperature and precipitation patterns one or two rotations from now, species and provenances should be selected that are not overly sensitive to climate change. The response functions (Figure 3) developed in this study enabled us to directly ascertain and compare different provenances’ climate sensitivity. Coupled with analog or comparable statistical models, provenance tests help to select seed material well adapted to anticipated climate conditions and let us identify genotypes of proven broad adaptability. These are especially valuable in areas where the comparison of GCMs and SRESes indicate that the direction and magnitude of climate change is uncertain. Results such as these indicate once more the enormous value of international trials in obtaining dissemination results of wide application (e.g., [56,57]).

4.3. Implications for Plantation Forestry

A decision model for managing forests under climate uncertainty, and assessing management options for intensively managed forests is necessary to prepare the forestry sector to the challenges of climate change. Our results aim to facilitate part of this decision model for managing forest under rapid environmental change and uncertainties. In view of expected climate instability, adaptability of forest trees causes serious concern due to their long lifespan compared to the rapidity of expected changes in environmental conditions [56,64,65]. Preliminary analysis indicates that concepts and contingency plans for adapting forests are rarely included in national plans for adaptation [66]. The information on climatically well-adapted seed sources and phenotypic plasticity of individual provenances generated in this study may assist rational planting decisions in an uncertain environment (compare [4,9]).
The site quality models include important commercial characteristics like height and diameter growth. Of particular importance when evaluating the potential of different provenances is also the issue of frequent stem breakage. This is repeatedly observed in P. tecunumanii HE plantations where on the worst sites 30%–40% of the trees are affected. The propensity for the main stem to break in its upper crown due to a large number of branches produced per whorl and/or wind storms is thought to be the greatest limitation to using P. tecunumanii in the tropics and subtropics [10]. Other important traits greatly influencing the planting decision are species and provenance specific susceptibilities to fungi and insects. Including biotic risk factors in the growth and site quality models by identifying environments that favor relevant insects such as Pineus pini (woolly aphid), Cinara cronartii (black aphid) or fungi such as Fusarium circinatum (pitch canker) could greatly improve the applicability of climate-driven decision support models [10]. Results presented in this study provide a good starting point to assist a rational planting decision. Similar climates and sites with well-matched provenances could be identified. In a second step, suggestions can be adjusted to soil types or species-specific preferences in terms of their non-climatic abiotic and biotic environment. Further elaborating the potential of the model to simulate pitch canker-resistant hybrids such as P. patula x P. tecunumanii could be of great value for the forest industry [67]. One could assume that the hybrid is intermediate between the parents in most traits like frost and drought resistance.

Projection’s Uncertainties

There are several considerable uncertainties and a number of possible error sources such as the lack of agreement between climate models [68] or low resolution of climate grids that might be too coarse for case-specific decision support. Nevertheless, the models presented here form the basis for developing site-specific decision support models for selecting planting material under a dynamic climate. In view of the rapid increase of area covered with tree plantations from 264 Mio ha 2010 to more than 300 Mio ha by 2020 [7] the analog tool may provide much-needed decision support for the forest sector in a time where rapid climate change makes the choice of the right seed source increasingly difficult.
The dependence of climate projections on the chosen emission scenario is believed to be low, at least up to the year 2035 [69]. There is no reason to believe that including CO2 fertilization effects would alter results since there is no scientific evidence that intraspecific variation at the provenance level would exhibit different physiological responses to altered concentrations of CO2. No problems are expected in the extrapolation of the model predictions to the whole study area because the area is within the climate ranges where the field trials are established.

5. Conclusions

In this study, Analogue, a statistical tool to quantify climate distances, was tested with growth data from international provenance trials. After careful validation, the tool was used to evaluate the need to change the currently used seed material of P. patula and P. tecunumanii provenances to optimize wood productivity in the face of climate change in the next rotations. Correlation of climate dissimilarity with differences in height growth per provenance allowed us to distinguish between seed sources that have high height growth in a specific climate, like most P. tecunumanii provenances, and provenances that have a more moderate height growth but that are adapted to a wide climate range, such as most tested P. patula provenances. Although the climate analog may be particularly useful to identify suitable areas for P. tecunumanii provenances, P. patula provenances may be more convenient to plant in a rapidly changing environment because of their ability to adapt to a wide range of climates.

Competing Interests

The interpretation of data, presentation of results or the conclusions drawn are not influenced by any of the authors’ personal or financial relationships.

Acknowledgements

The corresponding author would like to express his gratitude to the Decision and Policy Analysis (Dapa) Team at CIAT, especially to Julian Ramirez Villegas whose support and technical advice was of great help in elaborating the study’s methodology. We would further like to thank the Camcore members in Brazil, Colombia and South Africa for establishing, maintaining and measuring the research field plantings. We thank also William Woodbridge, Camcore data manager, for his assistance in preparing the large data sets for this analysis. Our gratitude goes also to four anonymous reviewers. For their constructive review, we would like to say thank you and believe that their detailed comments significantly contributed to improving the quality of the publication. MJvZ thanks the CGIAR consortium research programs CCAFS and Forest, Trees and Agroforestry for financial support.

References

  1. IPCC, Climate Change 2007: Synthesis Report; Cambridge University Press: New York, NY, USA, 2007.
  2. McKenney, D.; Pedlar, J.; O’Neill, G. Climate change and forest seed zones: Past trends, future prospects and challenges to ponder. For. Chron. 2009, 85, 258–266. [Google Scholar]
  3. Fairbanks, D. South African Country Study on Climate Change: Vulnerability and Adaptation Assessment for Plantation Forestry; National Research Foundation: Pretoria, South Africa, 1999. [Google Scholar]
  4. Spittlehouse, D.L.; Stewart, R.G. Adaptation to climate change in forest management. BC J. Ecosyst. Manag. 2003, 4, 1–11. [Google Scholar]
  5. Maginnis, S.; Jackson, W. The Role of Planted Forests in Forest Landscape Restoration. In Proceedings of the UNFF Intersessional Experts Meeting on the Role of Planted Forests in Sustainable Forest Management, Christchurch, New Zealand, 25–27 March 2003; pp. 87–99.
  6. Carle, J.; Holmgren, P. Wood from planted forests: A global outlook 2005–2030. For. Prod. J. 2008, 58, 6–18. [Google Scholar]
  7. FRA, Global Forest Resources Assessment 2010; Forestry Paper for FAO: Rome, Italy, 2010; p. 136.
  8. IPCC, Land Use, Land Use Change and Forestry; Cambridge University Press: Cambridge, UK, 2000.
  9. Guariguata, M.R.; Cornelius, J.P.; Locatelli, B.; Forner, C.; Sánchez-Azofeifa, G.A. Mitigation needs adaptation: Tropical forestry and climate change. Mitig. Adapt. Strategy Glob. Chang. 2008, 13, 793–808. [Google Scholar] [CrossRef] [Green Version]
  10. Dvorak, W.S.; Hodge, G.R.; Romero, J.L. Results of twenty years of research on Pinus tecunumanii by the CAMCORE Cooperative. For. Genet. Resour. 2001, 29, 2–6. [Google Scholar]
  11. Glantz, M.H. Societal Responses to Climate Change: Forecasting by Analogy; Westview Press: Boulder, CO, USA, 1988. [Google Scholar]
  12. Glantz, M.H. Does history have a future—Forecasting climate change effects on fisheries by analogy. Fisheries 1990, 15, 39–44. [Google Scholar] [CrossRef]
  13. Williams, J.W.; Jackson, S.T.; Kutzbach, J.E. Projected distributions of novel and disappearing climates by 2100 AD. Proc. Natl. Acad. Sci. USA 2007, 104, 5738–5742. [Google Scholar] [CrossRef]
  14. Hallegatte, S.; Hourcade, J.C.; Ambrosi, P. Using climate analogues for assessing climate change economic impacts in urban areas. Clim. Chang. 2007, 82, 47–60. [Google Scholar] [CrossRef]
  15. Ford, J.D.; Keskitalo, E.C.H.; Smith, T.; Pearce, T.; Berrang-Ford, L.; Duerden, F.; Smit, B. Case study and analogue methodologies in climate change vulnerability research. Wiley Interdiscip. Rev. 2010, 3, 374–392. [Google Scholar]
  16. Robertson, C.C. A Reconnaissance of The Forest Trees of Australia from the Point of View of Their Cultivation in South Africa; South African Government Printer: Capetown, South Africa, 1926. [Google Scholar]
  17. Golfari, L.; Caser, R.L.; Moura, V.P.G. Zoneamento ecologico esquematico para reflorestamento no Brasil. Série Técnica 1978, 11, 1–66. [Google Scholar]
  18. Booth, T.H. A new method for assisting species selection. Commonw. For. Rev. 1985, 64, 241–250. [Google Scholar]
  19. Dvorak, W.S.; Donahue, J.H.; Vásquez, J.A. Early performance of CAMCORE introductions of Pinus patula in Brazil, Colombia and South Africa. S. Afr. For. J. 1995, 174, 23–33. [Google Scholar]
  20. Dvorak, W.S.; Jordan, A.P.; Romero, J.L.; Hodge, G.R.; Furman, B.J. Quantifying the geographic range of Pinus patula var longipedunculata in southern Mexico using morphologic and RAPD marker data. S. Afr. For. J. 2001, 192, 19–30. [Google Scholar]
  21. Hijmans, R.J.; Schreuder, M.; de la Cruz, J.; Guarino, L. Using GIS to check coordinates of genebank accessions. Genet. Resour. Crop Evol. 1999, 46, 291–296. [Google Scholar] [CrossRef]
  22. Birks, J.S.; Barnes, R.D. The Genetic Control of Wood Quality in Pinus patula; ODA Research Scheme R4616; Oxford Forestry Institute, University of Oxford: Oxford, UK, 1991. [Google Scholar]
  23. Hodge, G.R.; Dvorak, W.S. Growth potential and genetic parameters of four mesoamerican pine planted in the southern hemisphere. South. For. 2012, 74. in press. [Google Scholar]
  24. Dvorak, W.S.; Hodge, G.R.; Gutiérrez, E.A.; Osorio, L.F.; Malan, F.S.; Stanger, T.K. Pinus tecunumanii. In Conservation and Testing of Tropical and Subtropical Forest Tree Species; CAMCORE Cooperative: Raleigh, NC, USA, 2000; pp. 188–209. [Google Scholar]
  25. Dvorak, W.S.; Balocchi, C.E.; Raymond, R.H. Performance and Stability of Provenances and Families of Pinus tecunumanii in the Tropics and Subtropics. In Breeding Tropical Trees: Population Structure And Genetic Improvement Strategies In Clonal And Seedling Forestry; Gibson, G.L., Griffin, A.R., Matheson, A.C., Eds.; Oxford Forestry Institute: Oxford, UK, 1989; pp. 187–196. [Google Scholar]
  26. Dvorak, W.S.; Potter, K.M.; Hipkins, V.D.; Hodge, G.R. Genetic diversity and gene exchange in Pinus oocarpa, a Mesoamerican pine with resistance to the pitch canker fungus (Fusarium circinatum). Int. J. Plant Sci. 2009, 170, 609–626. [Google Scholar] [CrossRef]
  27. Kanzler, A. Genotype × environment interaction in Pinus patula and its implications in South Africa. PhD thesis, Department of Forestry, North Carolina State University, Raleigh, NC, USA, 2010. [Google Scholar]
  28. Louw, J.H. Site Classification and Evaluation for Commercial Forestry in the Crocodile River Catchment; University of Stellenbosch: Stellenbosch, South Africa, 1995. [Google Scholar]
  29. IUCN and UNEP, The World Database on Protected Areas (WDPA); UNEP-WCMC: Cambridge, UK, 2009.
  30. Eva, H.D.; de Miranda, E.E.; di Bella, C.M.; Gond, V.; Sgrenzaroli, O.M.; Jones, S.; Coutinho, A.; Dorado, A.; Guimarães, M.; Elvidge, C.; et al. A vegetation map of South America, European Commission; EUR 20159 EN; Joint Research Centre: Brussels, Belgium, 2002. [Google Scholar]
  31. Mayaux, P.; Bartholomé, E.; Massart, M.; van Cutsem, C.; Cabral, A.; Nonguierma, A. A Land-Cover Map of Africa; EUR 20665 EN; Office for Official Publications of the European Communities: Luxembourg, Luxembourg, 2003. [Google Scholar]
  32. Bartholomé, E.; Belward, A.S.; Achard, F.; Bartalev, S.; Carmona Moreno, C.; Eva, H.; Fritz, S.; Grégoire, J.M.; Mayaux, P.; Stibig, H.J. Global Land Cover Mapping for the Year 2000—Project Status November 2002; ref EUR 20524; JRC: Ispra, Italy, 2003. [Google Scholar]
  33. Hijmans, R.J.; Cameron, S.E.; Parra, J.L.; Jones, P.G.; Jarvis, A. Very high resolution interpolated climate surfaces for global land areas. Int. J. Climatol. 2005, 25, 1965–1978. [Google Scholar] [CrossRef]
  34. Busby, J.R. BIOCLIM-A Bioclimatic Analysis and Prediction System. In Nature Conservation: Cost Effective Biological Surveys and Data Analysis; Margules, C.R., Austin, M.P., Eds.; CSIRO: Canberra, Australia, 1991; pp. 64–68. [Google Scholar]
  35. R Development Core Team: R. A Language and Environment for Statistical Computing, Version 2.13.0; R Foundation for Statistical Computing: Vienna, Austria, 2011. Available online: http://www.R-project.org/ (accessed on 6 May 2011).
  36. Arc 9.3 Arc/Info; Environmental Systems Research Institute: Redlands, CA, USA, 2009.
  37. Arnell, N.A.; Osborne, T.; Hiiker, J. Using Agriculturally Meaningful Measures of Climatic Similarity to Identify Present and Future Analogue Climates; Report to CCAFS: Development of Prototype Climate Analogue Tool 2011; Walker Institute for Climate System Research, University of Reading: West Berkshire, UK, 2011. [Google Scholar]
  38. Huston, M. Soil nutrients and tree species richness in Costa Rican forests. J. Biogeogr. 1980, 7, 147–157. [Google Scholar] [CrossRef]
  39. Dise, N.B.; Wright, R.F. Nitrogen leaching from European forests in relation to nitrogen deposition. For. Ecol. Manag. 2000, 71, 153–161. [Google Scholar] [CrossRef]
  40. Yang, Y.; Watanabe, M.; Li, F.; Zhang, J.; Zhang, W.; Zhai, J. Factors affecting forest growth and possible effects of climate change in the Taihang Mountains, northern China. Forestry 2006, 79, 135–147. [Google Scholar]
  41. Bedrick, E.J. Checking for lack of fit in linear models with parametric variance functions. Technometrics 2000, 42, 227–236. [Google Scholar] [CrossRef]
  42. Mac Nally, R. Regression and model-building in conservation biology, biogeography and ecology: The distinction between—and reconciliation of—‘predictive’ and ‘explanatory’ models. Biodivers. Conserv. 2000, 9, 665–671. [Google Scholar] [CrossRef]
  43. O’Brien, R.M. A caution regarding rules of thumb for variance inflation factors. Qual. Quant. 2007, 41, 673–690. [Google Scholar] [CrossRef]
  44. PCMDI, IPCC Model Output 2007. Available online: http://www-pcmdi.llnl.gov/ipcc/about_ipcc.php (accessed on 20 June 2011).
  45. IPCC Special Report on Emissions Scenarios (SRES); Nakicenovic, N.; Swart, R. (Eds.) Cambridge University Press: Cambridge, UK, 2000.
  46. Lugo, A.E.; Brown, S.; Chapman, J. An analytical review of production rates and stemwood biomass of tropical forest plantations. For. Ecol. Manag. 1988, 23, 189–200. [Google Scholar]
  47. Mearns, L.O.; Rosenzweig, C.; Goldberg, R. Mean and variance change in climate scenarios: Methods, agricultural applications, and measures of uncertainty. Clim. Chang. 1997, 34, 367–396. [Google Scholar]
  48. Whittingham, M.J.; Stephens, P.A.; Bradbury, R.B.; Freckleton, R.P. Why do we still use stepwise modeling in ecology and behaviour? J. Anim. Ecol. 2006, 75, 1182–1189. [Google Scholar] [CrossRef]
  49. Rencher, A.C.; Pun, F.C. Inflation of R2 in best subset regression. Technometrics 1980, 22, 49–53. [Google Scholar] [CrossRef]
  50. Gonzalez, R.W.; Salón, D.; Dasmohaptra, S.; Cubbage, F. South America industrial roundwood supply potential. BioResources 2008, 3, 255–269. [Google Scholar]
  51. Matalaa, J.; Ojansuu, R.; Peltola, H.; Sievänen, R.; Kellomäki, S. Introducing effects of temperature and CO2 elevation on tree growth into a statistical growth and yield model. Ecol. Model. 2005, 181, 173–190. [Google Scholar] [CrossRef]
  52. Rehfeldt, G.E.; Tchebakova, N.M.; Parfenova, Y.I.; Wykoff, W.R.; Kuzmina, N.A.; Milyutin, L.I. Intraspecific responses to climate in Pinus sylvestris. Glob. Chang. Biol. 2002, 8, 912–929. [Google Scholar] [CrossRef]
  53. Fairbanks, D. South African Country Study on Climate Change: Vulnerability and Adaptation Assessment for Plantation Forestry; National Research Foundation: Pretoria, South Africa, 1999. [Google Scholar]
  54. Rowhani, P.; Lobell, D.B.; Linderman, M.; Ramankutty, N. Climate variability and crop production in Tanzania. Agric. For. Meteorol. 2001, 151, 449–460. [Google Scholar]
  55. Brook, J.R.; Flanagan, L.B.; Ehleringer, J.R. Responses of boreal conifers to climate fluctuations: Indications from tree-ring widths and carbon isotope analyses. Can. J. For. Res. 1998, 29, 524–533. [Google Scholar]
  56. Clark, D.A.; Clark, D.B. Climate induces annual variation in canopy tree growth in a Costa Rican tropical rain forest. J. Ecol. 1994, 82, 865–872. [Google Scholar] [CrossRef]
  57. Mátyás, C. Climatic adaptation of trees: Rediscovering provenance tests. Euphytica 1996, 92, 45–54. [Google Scholar] [CrossRef]
  58. William, R.L.; Barner, H. Matching Seed Source to Planting Site; Lecture Note B.3; Danida Forest Seed Centre: Humlebaek, Denmark, 1993. [Google Scholar]
  59. Finley, K.W.; Wilkinson, G.N. The analysis of adaptation in a plant-breeding program. Aust. J. Agric. Res. 1963, 14, 342–354. [Google Scholar]
  60. Lortie, C.J.; Aarssen, L.W. The specialization hypothesis for phenotypic plasticity in plants. Int. J. Plant Sci. 1996, 15, 484–487. [Google Scholar]
  61. Via, S.; Gomulkiewicz, R.; de Jong, G.; Scheiner, S.M.; Schlichting, C.D. Adaptive phenotypic plasticity: Consensus and controversy. Trends Ecol. Evol. 1995, 10, 212–217. [Google Scholar] [CrossRef]
  62. Emery, R.J.N.; Chinnappa, C.C.; Chmielewski, J.G. Specialization, plant strategies, and phenotypic plasticity in populations of Stellaria longipes along an elevational gradient. Int. J. Plant Sci. 1994, 155, 203–219. [Google Scholar]
  63. Hodge, G.R.; Dvorak, W.S. Genetic parameters and provenance variation of Pinus tecunumanii in 78 international trials. For. Genet. 1999, 6, 157–180. [Google Scholar]
  64. Rosvall, O.; Ericsson, T. Förtlyttningseffekter I norrländska gran-proveniensförsörk. Föreningen Skogrsträds-förädling; Institutet for Skogsförbättring: Årsbok, Sweden, 1981. [Google Scholar]
  65. Davis, M.B.; Shaw, R.G. Range shifts and adaptive responses to quaternary climate change. Science 2001, 292, 673–679. [Google Scholar] [CrossRef]
  66. FAO, Adaptation to Climate Change in Agriculture, Forestry and Fisheries: Perspective, Framework and Priorities; Food Agricultural Organization of the United Nations: Rome, Italy, 2007; p. 2.
  67. Mitchell, R.G.; Steenkamp, E.T.; Coutinho, T.A.; Wingfield, M.J. The pitch canker fungus, Fusarium circinatum: Implications for South African forestry. South. For. 2011, 73, 1–13. [Google Scholar]
  68. Wilby, R.; Dawson, C. SDSM 4.1–A Decision Support Tool for the Assessment of Regional Climate Change Impacts; User Manual: London, UK, 2007; p. 93. [Google Scholar]
  69. Stott, P.A.; Kettleborough, J.A. Origins and estimates of uncertainty in predictions of twenty-first century temperature rise. Nature 2002, 416, 723–726. [Google Scholar] [CrossRef]

