Article

The Validation of the Mixedwood Growth Model (MGM) for Use in Forest Management Decision Making

Department of Renewable Resources, 751 General Services Building, University of Alberta, Edmonton, AB, T6G 2H1, Canada
*
Author to whom correspondence should be addressed.
Forests 2013, 4(1), 1-27; https://doi.org/10.3390/f4010001
Submission received: 26 October 2012 / Revised: 12 December 2012 / Accepted: 18 December 2012 / Published: 7 January 2013

Abstract

:
We evaluated the Mixedwood Growth Model (MGM) at a whole model scale for pure and mixed species stands of aspen and white spruce in the western boreal forest. MGM is an individual tree-based, distance-independent growth model, designed to evaluate growth and yield implications relating to the management of white spruce, black spruce, aspen, lodgepole pine, and mixedwood stands in Alberta, British Columbia, Saskatchewan, and Manitoba. Our validation compared stand-level model predictions against re-measured data (volume, basal area, diameter at breast height (DBH), average and top height and density) from permanent sample plots using combined analysis of residual plots, bias statistics, efficiency and an innovative application of the equivalence test. For state variables, the model effectively simulated juvenile and mature stages of stand development for both pure and mixed species stands of aspen and white spruce in Alberta. MGM overestimates increment in older stands likely due to age-related pathology and weather-related stand damage. We identified underestimates of deciduous density and volume in Saskatchewan. MGM performs well for increment in postharvest stands less than 30 years of age. These results illustrate the comprehensive application of validation metrics to evaluate a complex model, and provide support for the use of MGM in management planning.

1. Introduction

The Mixedwood Growth Model (MGM) [1] is a deterministic, distance-independent, individual tree-based stand growth model developed for the western Canadian boreal forest. The model was developed to assist decision makers in estimating growth and yield outcomes for a range of management practices. Recent publications by Pitt et al. [2], Comeau et al. [3] and Farnden [4] demonstrate the use of MGM as a tool to link stand interventions or surveys to future yield. As MGM was developed, various growth and mortality relationships were published, typically accompanied by tree-level and stand-level validation [5]. However, in response to a growing need to characterize yield trajectories for mixed and pure post-harvest stands subject to silvicultural interventions, new and improved growth and mortality functions that better account for the interactions between trembling aspen and white spruce have been developed. This manuscript provides the first peer-reviewed journal publication examining the whole model behavior of MGM, where the component relationships and their interactions are validated at the stand level.
Model evaluation assesses the suitability of a selected modeling approach for a given purpose [6]. It begins early in the model design and development phase, and should continue for the life of the model [7]. The process should be both qualitative and quantitative [8]. Model evaluation should define the evaluation criteria; it should include a model description which identifies the modeling approach, the growth functions, the parameterization and calibration specifications and algorithms used, the range of application, input and output parameters, a description of the software and hardware requirements; and it should provide a quantitative validation [6]. The evaluation should also examine model logic and biological consistency, including a sensitivity analysis that identifies the important input parameters [9].
Validation is one aspect of the evaluation process that assesses the degree of accuracy attained [6,10]. While model validation has been widely discussed in the literature, there is little consensus on an acceptable approach, and there are few examples of whole model validation. This is not surprising since there are many types of models (individual tree, stand level and size distribution models), model applications, and tests available. Statistical validation assesses model bias and accuracy by comparing model predictions to actual data. Graphical displays of the residuals and the distribution of observed vs. predicted values show the residual errors and aid in identifying undesirable patterns. Common examples of statistical metrics include: average model bias (AMB), relative model bias (RMB), and efficiency (EF) [11], the coefficient of determination (R2), root mean square error (RMSE), and hypothesis tests for the correspondence of observed vs. predicted data [12]. More recently, equivalence tests [13] have been recommended for testing the fit of a model within an acceptable range of error. These statistics should be chosen or structured to allow the end user (forest manager or regulator) to easily evaluate the performance of the model based on its intended use [7].
In western Canada, yield curves or tables are a management planning requirement for both managed and natural stands. Forest managers are interested in whether the model is unbiased over the operational landscape. Since there are no long-term re-measured managed (post-harvest) stand data, and only a small amount of short-term managed stand data, growth models must be used to predict future managed stands yields for management planning. An individual tree model like MGM suits this purpose since it can accept different species mixtures and stand structures, and allows for the modeling of treatments such as release or thinning. MGM grows and reduces the survival of each tree according to its species, size and social position within the stand. This makes MGM responsive to changes in stand structure and allows projections of complex species mixtures and stand structures, especially following thinning or tending treatments. Since stand-level yield projections are the primary use of MGM, an evaluation and validation at this scale is essential.
Validations can be carried out on annual periodic growth increment [8,14] which eliminates the effect of initial size and relates errors directly to what is modeled. This type of validation can be done at an individual tree level where increment is assessed only for the survivors, or at a stand level to validate increment while accounting for the influence of natural mortality, ingress and removals. Another common approach for validation is based on yield (volume per hectare), supported by the validation of other stand parameters (top height, average height, average diameter and density) [15]. Both approaches require that the model be validated as a whole, where all internal components and their interactions act as one system [9]. The danger to this approach is that it assumes that the individual sub-models are parameterized and calibrated well and are correctly linked, although it is unlikely that a model with poorly parameterized and calibrated sub-models would validate well as a whole.
The goal of the validation presented in this paper is to provide regulatory agencies and users of MGM with sufficient information to be able to assess whether the model adequately meets their performance requirements in the context of Canadian forest practices. The paper also demonstrates, contrasts and discusses several methods for whole model validation using MGM as an example.

2. Experimental Section

2.1. The Mixedwood Growth Model

MGM models the growth of pure or mixed stands of four major boreal species: white spruce (Picea glauca (Moench) Voss) (SW), lodgepole pine (Pinus contorta var. latifolia Engelm.) (PL), trembling aspen (Populus tremuloides Michx.) (AW), and black spruce (Picea mariana (Mill.) B.S.P.) (SB). The model utilizes individual tree growth (height increment and diameter increment) and survival functions to project a list of trees into the future. MGM includes sub-models developed separately for: (1) Juvenile trees having a diameter at breast height (DBH) less than 4.0 cm; (2) Mid-rotation trees having a DBH greater than or equal to 4.0 cm and that is less than 80% of their maximum height, defined by the asymptote of the height vs. DBH curve; and (3) Old-Growth trees taller than 80% of their maximum height. Site index and competition from other trees are key drivers of the growth functions. A full description of the model functions and parameters by species and sub-models can be found online [1].
The model can be initialized using a tree list or stand table, including juvenile trees <1.3 m height. Tree lists can also be created using stand summary data: species, average height and diameter at breast height (DBH), breast height age for each tree (or total age for trees <1.3 m), and an estimate of site index for each species. The growth and survival relationships were developed using Alberta data, although regional variants for British Columbia, Saskatchewan, and Manitoba allow use of local species codes, site curves, and tree-volume estimation equations.
Outputs summarize both tree and stand characteristics. Summaries are provided as yield tables and charts portraying averages and totals for the conifer and hardwood components including estimates of above ground tree biomass. Linkage to the Stand Visualization System [16] is also built into the model, to provide visual snapshots of the stand structure (assuming random tree locations) at any stage of development.

2.2. Description of Validation Datasets

Four datasets were used for the validation: the Alberta Sustainable Resource Development (ASRD) Stand Dynamics System (SDS) juvenile permanent sample plots (PSPs), the Western Boreal Growth and Yield Association (WESBOGY) juvenile PSPs, ASRD mature stand PSPs (ASRD), and Saskatchewan Ministry of the Environment PSP data (SSK). These datasets contain a range of forest stand types (species mixtures and structure), and include a range of productivity (site index) and stand ages (juvenile, mid-rotation and mature) and varying projection lengths. The SDS and WESBOGY datasets contain some silvicultural manipulations (chiefly site preparation and juvenile thinning). These data provide a basis for the rigorous testing of model performance. Summary details on plots and re-measurements for the data sources are found in (Table 1, Table 2, Table 3, Table 4 and Table 5).
Four datasets were used for the validation: the Alberta Sustainable Resource Development (ASRD) Stand Dynamics System (SDS) juvenile permanent sample plots (PSPs), the Western Boreal Growth and Yield Association (WESBOGY) juvenile PSPs, ASRD mature stand PSPs (ASRD), and Saskatchewan Ministry of the Environment PSP data (SSK). These datasets contain a range of forest stand types (species mixtures and structure), and include a range of productivity (site index) and stand ages (juvenile, mid-rotation and mature) and varying projection lengths. The SDS and WESBOGY datasets contain some silvicultural manipulations (chiefly site preparation and juvenile thinning). These data provide a basis for the rigorous testing of model performance. Summary details on plots and re-measurements for the data sources are found in (Table 1, Table 2, Table 3, Table 1 and Table 5).
Table 1. Summary statistics (mean, min. and max.) for age and projection length, as well as the average site index for aspen, pine and spruce types by validation dataset and species group.
DatasetSpeciesnInitial Age (years)Projection Length (years)Aspen Site Index (m)Pine Site Index (m)Spruce Site Index (m)
MeanMinMaxMeanMinMaxMeanMeanMean
ASRDAW12474281302854118.7--
CD1841474043532134317.8-15.2
DC90108421983074217.6-19.3
SW1041546643529639--15.3
SDSAW5151101491919.8--
SW13527161122--20.1
MX1662916131918.3-18.3
WESBOGYAW93751061920.9--
SW62751061917.6--
MX307751061920.8-17.3
SASKAW20714610315102918.9--
CD201056716021123215.616.917.8
DC20975416021133317.517.116.3
SW20916314016829-17.0-
Table 2. The summary of observed stand parameters (volume (m3 ha−1), basal area (m2 ha−1), DBH (cm), height (m), density (stems ha−1) and top height (m)), as well as the validation statistics (average mean bias (AMB), standard deviation of the residuals (SD_resid), relative mean bias (RMB), efficiency (EF) and the equivalence cutoff (EQ) for the conifer and deciduous components by species group (AW, CD, DC, and SW) for the ASRD dataset.
Species GroupnVariableConiferDeciduous
ObservedStatistics of Model FitObservedStatistics of Model Fit
MeanMinMaxSDAMBSD_residRMB (%)EFEQMeanMinMaxSDAMBSD_residRMB (%)EFEQ
AW124Volume (m3 ha−1)37.830.33142.0536.073.3322.688.800.606.81251.0057.82510.9298.024.7060.021.870.6217.57
Basal Area (m2 ha−1)4.100.1213.233.560.711.9817.340.650.6127.756.7853.728.941.685.886.050.531.67
DBH (cm)34.7711.7067.2013.824.885.6314.050.715.9127.5212.8747.208.61−0.821.90−2.960.941.38
Height (m)21.266.7031.486.17−1.752.83−8.250.712.3421.5710.6830.344.06−1.161.77−5.420.731.51
Density (stems ha−1)61529670−0.8125.09−1.340.876.6759879192044075.08124.3612.550.8995.73
Top Height (m)22.158.0030.646.14−1.793.72−8.070.552.4423.8212.3032.514.04−1.541.80−6.440.661.91
CD184Volume (m3 ha−1)296.527.00547.1095.59−28.0266.39−9.450.4338.55103.252.87309.3473.3927.4450.5626.580.4134.07
Basal Area (m2 ha−1)31.751.5558.2510.12−0.846.77−2.650.553.8110.390.4629.016.762.954.7628.430.333.22
DBH (cm)27.3413.9350.106.491.462.825.350.781.9135.6917.8266.408.460.024.630.070.731.07
Height (m)21.0410.7028.613.83−0.451.61−2.140.820.8423.8015.4532.073.40−0.832.13−3.470.571.19
Density (stems ha−1)626442765471−58.16151.40−9.290.9081.41106104748329.6265.1627.880.2638.24
Top Height (m)25.9910.7034.714.05−0.791.80−3.030.791.0424.2915.4532.073.46−0.712.19−2.930.581.21
DC90Volume (m3 ha−1)159.4337.16321.9663.79−20.6769.92−12.97−0.3133.48189.8625.89643.1897.573.6967.571.950.5222.78
Basal Area (m2 ha−1)15.774.5631.605.61−1.076.24−6.78−0.273.0019.292.8750.338.520.995.815.150.521.93
DBH (cm)29.8415.1349.046.921.533.095.130.752.3932.1613.1646.506.35−0.262.87−0.800.790.96
Height (m)22.6013.3430.893.07−1.422.43−6.320.162.0323.5215.2731.203.03−1.081.99−4.630.441.65
Density (stems ha−1)24440729151−39.9485.94−16.390.6056.0627020147022025.7086.399.520.8343.19
Top Height (m)25.6215.6034.883.12−1.812.51−7.050.012.3124.8615.7732.492.82−1.582.03−6.340.161.99
SW104Volume (m3 ha−1)361.14133.94594.37101.41−28.7473.01−7.960.4143.3423.270.69107.3225.744.4717.9719.220.487.45
Basal Area (m2 ha−1)38.2012.5262.5310.62−1.116.94−2.910.584.202.710.1210.492.710.601.9022.230.450.79
DBH (cm)25.6916.6846.725.49−0.413.03−1.600.691.0326.0611.4054.208.880.363.861.400.811.30
Height (m)21.4013.0928.912.77−0.831.71−3.900.531.2819.7310.1828.863.56−0.842.05−4.010.621.18
Density (stems ha−1)78264229942455.60207.587.110.7493.87515235508.5228.7916.770.6413.71
Top Height (m)26.9717.9132.822.92−0.451.50−1.670.710.8119.8810.1828.863.58−0.762.04−3.850.631.19
Table 3. The summary of observed stand increment (volume increment (m3 ha−1 y−1), DBH increment (cm y−1), height increment (m y−1), and top height increment (m y−1)), and the validation statistics (average mean bias (AMB), standard deviation of the residuals (SD_resid), relative mean bias (RMB), as well as the t-test statistics (t-statistic and p-value) for AMB, for the conifer and deciduous components by species group (AW, CD, DC, and SW) ASRD dataset.
GroupSpecies VariableObservedStatistics of Model Fitt-test for AMB
nMeanAMBSD_ResidRMB (%)t-valuep-value
AWVolume Inc (m3 ha−1 y−1)1244.309−1.8561.873−43.08−11.039<0.001
DeciduousDBH Inc (cm y−1) 0.263−0.0310.063−11.69−5.408<0.001
Height Inc (m y−1) 0.120−0.0590.117−49.52−5.655<0.001
Top Height Inc (m y−1) 0.055−0.0760.128−136.22−6.574<0.001
CDVolume Inc (m3 ha−1 y−1)1843.807−0.8112.247−21.31−4.898<0.001
ConiferDBH Inc (cm y−1) 0.1690.0480.09028.527.298<0.001
Height Inc (m y−1) 0.109−0.0160.049−14.31−4.293<0.001
Top Height Inc (m y−1) 0.061−0.0240.056−39.59−5.900<0.001
DCVolume Inc (m3 ha−1 y−1)902.687−0.8731.384−32.49−5.984<0.001
DeciduousDBH Inc (cm y−1) 0.242−0.0110.096−4.46−1.0710.287
Height Inc (m y−1) 0.099−0.0380.067−38.54−5.402<0.001
Top Height Inc (m y−1) 0.040−0.0540.077−136.30−6.646<0.001
SWVolume Inc (m3 ha−1 y−1)1044.967−1.4852.475−29.89−6.118<0.001
ConiferDBH Inc (cm y−1) 0.154−0.0140.093−9.11−1.5380.127
Height Inc (m y−1) 0.127−0.0340.060−26.56−5.751<0.001
Top Height Inc (m y−1) 0.092−0.0160.060−16.97−2.6720.009
Table 4. The summary of the mean deciduous or coniferous volume increment (m3 ha−1 y−1), as well as the standard deviation of the residual volume (SD) by projection length classes for the species group (AW, CD, DC, and SW) in the ASRD dataset.
Species GroupnAverage Projection LengthActual Mean Deciduous Volume IncrementResidual Deciduous Volume IncrementSD Residual Volume IncrementSpecies GroupnAverage Projection LengthActual Mean Conifer Volume IncrementResidual Coniferous Volume IncrementSD Residual Volume
AW5683.72−2.931.48CD123103.67−0.232.97
183.99−2.461.14 203.53−0.832.61
264.23−2.021.03 273.55−0.702.41
354.38−1.580.93 333.57−0.382.14
DC42112.45−1.691.16SW50124.43−1.622.84
182.70−1.191.06 194.72−1.493.00
262.83−0.820.83 264.91−1.362.96
342.99−0.411.14 345.34−0.862.65
Table 5. The summary of observed stand parameters (DBH (cm), height (m), density (stems ha−1) and top height (m)), as well as the validation statistics (average mean bias (AMB), standard deviation of the residuals (SD_resid), relative mean bias (RMB), efficiency (EF) and the equivalence cutoff (EQ) for the conifer and deciduous components by species group (AW, SW and MX) for the SDS dataset.
Species GroupnVariableConiferDeciduous
ObservedStatistics of Model FitObservedStatistics of Model Fit
MeanMin Max SDAMBSD_residRMB (%)EFEQMeanMin Max SDAMBSD_residRMB (%)EFEQ
AW51DBH (cm)2.230.505.461.13−0.261.04−11.510.110.514.301.258.771.580.021.110.470.510.47
Height (m)2.601.445.230.76−0.150.74−5.700.010.346.192.609.161.600.000.93−0.060.660.43
Density (stems ha−1)2368250140002856−526.721166.71−22.250.80828.6893431000360006259−910.304776.33−9.740.402055.49
Top Height (m)3.391.317.911.41−0.091.29−2.560.170.5410.005.4716.202.451.251.4312.520.391.70
SW13DBH (cm)4.380.809.212.98−0.041.78−0.890.641.532.060.337.802.48−1.851.18−89.470.142.64
Height (m)3.581.686.851.60−0.220.92−6.240.650.793.121.447.752.16−1.421.28−45.520.162.15
Density (stems ha−1)300075095002636−347.39564.13−11.580.94630.004281250170005723−4019.416347.50−93.88−0.767149.69
Top Height (m)5.011.687.902.270.201.343.980.651.154.131.5511.803.53−1.602.79−38.740.142.97
MX16DBH (cm)4.391.677.931.980.111.342.490.541.054.281.497.751.87−0.791.35−18.500.291.41
Height (m)3.982.396.741.23−0.050.85−1.350.520.685.772.019.832.19−0.821.61−14.250.311.56
Density (stems ha−1)318875090002850−393.50669.29−12.350.92701.2549531000152504262−206.083101.90−4.160.472377.50
Top Height (m)5.953.528.881.830.491.368.300.371.078.992.6012.302.410.631.797.050.371.44
For each of the validation datasets, individual plots were categorized by dominant species: pure types which included white spruce (SW) and trembling aspen (AW); and mixed types: conifer (white spruce leading) (CD), deciduous leading (DC), or if there were too few PSPs to differentiate by leading species, a general mixedwood category (MX) was used. Pure species groups were defined as having 80% or greater basal area of the primary species, while mixed types had between 50% and 80% of their basal area represented by the primary species. Since basal area proportions varied over the re-measurements, plots were categorized at the time they were closest to maturity, i.e., the last measurement for the juvenile plots, and the first measurement for the mature plots.

2.2.1. ASRD—Mature Permanent Sample Plot Data

The Alberta Sustainable Resource Development (ASRD) PSPs were initiated by the province in the 1960s and were continually installed until the 1990s. They were originally intended to aid in the determination of the optimal rotation age of various stand types, and were therefore placed in near-mature to mature stands. We used 524 ASRD PSPs in this validation, of which 78 were single plots and 801 were from clusters of two to four plots several tree-lengths apart. Each of the clustered plots was considered independent. The plots had up to six re-measurements, of which the first and last were used for the validation. Detailed information on plot design and measurement protocol can be found in the PSP field procedures manual Alberta Land and Forest Service, 1998 [17]. For these ASRD mature PSPs, four stand type categories were created: two pure (AW and SW), and two mixed (CD and DC). Site index estimates were obtained from measurement of either trees destructively sampled adjacent to each plot, or estimated using measured heights of top height trees (thickest 100 ha−1), based on sub-regional site index equations [18,19]. Stand volume was compiled from tree height and DBH data using sub-regional equations [20].
For this validation, 22 plots (17 CD and 5 SW plots) from the mature ASRD dataset were removed because they exhibited dramatic reductions in stand density over one projection period due to windthrow.

2.2.2. Juvenile Stand Dynamics System Plot Data

The Stand Dynamics System (SDS) PSPs were part of a program initiated by the province in the 1980s to develop growth and yield information for young post-harvest stands. We used the 80 aspen-spruce PSPs from the SDS program in this validation. For deciduous (AW) and deciduous-leading (DC), we restricted our validation to data from the four 1.78 m (10 m2) circular regeneration plots (40 m2 total area). Additional information is contained in the larger plots (250 m2, 1000 m2) into which these are nested; however, the tagging thresholds used in these larger plots (height >1.3 m and DBH >9.1 cm, respectively) make it impossible to separate the effects of mortality and new establishment from density changes due to trees growing through the tagging limit. For white spruce and conifer (spruce) leading mixedwoods, we used data from all plots. Also in very high density stands (>50 trees in each 10 m2 subplot; ~50,000 stems ha−1), additional trees were simply tallied into 10 cm height classes. These partial tallies at high density create some ambiguity in distinguishing ingress from mortality over time, but there was no way to remove this ambiguity without ignoring the high density dynamics. Detailed information on plot design and measurement protocols can be found in the Stand Dynamics System field procedures manual [21]. For the SDS PSPs, three stand type categories were created, two pure (AW and SW) and one mixed (MX). Site index for the primary species was estimated using measured heights of top height trees taken at the last re-measurement, and using sub-regional site index equations [18,19].

2.2.3. WESBOGY Juvenile Permanent Sample Plot Data

The Western Boreal Growth and Yield Association (WESBOGY) has a series of long-term study plots, established from 1990 to 2004. These plots are placed in post-harvest, mixed aspen–white spruce stands and consist of control (untreated) aspen, and five manipulated aspen densities (0, 200, 500, 1500 and 4000 stems ha−1). White spruce was planted in these stands at controlled densities of 0, 500 and 1000 stems ha−1. We used data from nine installations (462 plots) from the WESBOGY study in this validation. The data were from 400 m2 plots, with the exception of the natural (control) aspen plots which, owing to the high density, were taken from four 4m2 sub-plots, combined to form a single 16 m2 plot. Detailed information on plot design and measurement protocols can be found in the WESBOGY procedures manual [22] and in Bokalo et al. [23]. For the WESBOGY PSPs, three stand types were assessed, two pure (AW and SW) and one mixed (MX). Site index values were estimated as for the SDS plots.

2.2.4. Saskatchewan Mature Permanent Sample Plot Data

This validation dataset from Saskatchewan was a random sub-sample of 80 permanent sample plots from the 1122 PSPs maintained by the Saskatchewan Ministry of Environment and Weyerhaeuser Company. The database included measurements made by Weyerhaeuser Company as part of their forest management agreement from 1994 to 2000. Detailed information on plot design and measurement protocols can be found in the Weyerhaeuser permanent sample plot procedures manual [24]. Compilation and sub-sampling protocols can be found in Tansanu and Bokalo [25]. For the Saskatchewan PSPs, four species categories were created, consisting of two pure (AW and SW) and two mixed (CD and DC). Site index was estimated using measured heights of top height trees and unpublished regional site index equations [26]. Volumes were estimated using regional taper equations [27].

2.3. Validation Methods

Our model validation used the first plot measurement to initialize MGM, we then projected the treelist to the final re-measurement where the observed stand conditions were evaluated against the MGM predictions. Using only the final measurement for validation provided the longest possible growth interval and eliminated autocorrelation issues that can arise when multiple measurements from individual stands are used. MGM projections used sub-regional site index equations [18] and sub-regional volume equations [20]. Because we were projecting PSPs, no mortality adjustments were used. The model was validated using both scatter plots and statistical tests for stand level model outputs (depending on dataset) that include the state variables volume (m3 ha−1), basal area (m2 ha−1), average DBH (cm), average height (m), top height (m), density (stems ha−1) and quadratic mean diameter (QMD, cm). Annual periodic growth rate (volume-, height-, DBH- and top height increment) was also used for validation because it removes the influence of initial size and directly evaluates the performance of the component relationships. Annual periodic volume increment was calculated as the annualized difference in yield over the projection period, adding back the volume which was lost to mortality during this interval [28]. There were no removals over the projection periods and ingress was not included. Validation using increment was done on the ASRD, SDS and WESBOGY datasets.
Validation of volume increment with respect to projection length for the ASRD dataset used a subsample of plots with the longest projection lengths. This kept the number of observations constant in order to remove effects of sample size and data variability on the results. For all projection length classes, the first measurement represents the initial volume from which volume increment is calculated.
Since volume vs. stand age (“yield”) curves are the most important product of the model for users, we used residual plots for volume to assess potential biases with respect to site index, initial stand density and projection length. As projection lengths varied from 5 to 40 years, bias was also assessed in approximately 10-year projection intervals, as well as at the final re-measurement.
We did not examine volume and basal area predictions for the juvenile datasets (SDS and WESBOGY) since these variables have low values and are highly dependent on the density distribution above and below breast height (1.3 m; volume and basal area calculations do not include trees shorter than 1.3 m).
Top height was defined as the average height of the thickest 100 stems ha−1 of each species. Basal area, quadratic mean diameter, density, and top height are readily measurable in the field, and are useful for tracking stand performance against the model. Average height and DBH are additional simple metrics of tree size.
Except for Saskatchewan data, the results were examined for both the conifer and deciduous stand components based on the four stand types (AW, SW, CD, DC) and—in the cases where there was insufficient data to separate CD and DC—the MX group. For brevity, in the pure species groups, only the dominant species component will be discussed.

2.4. Validation Metrics
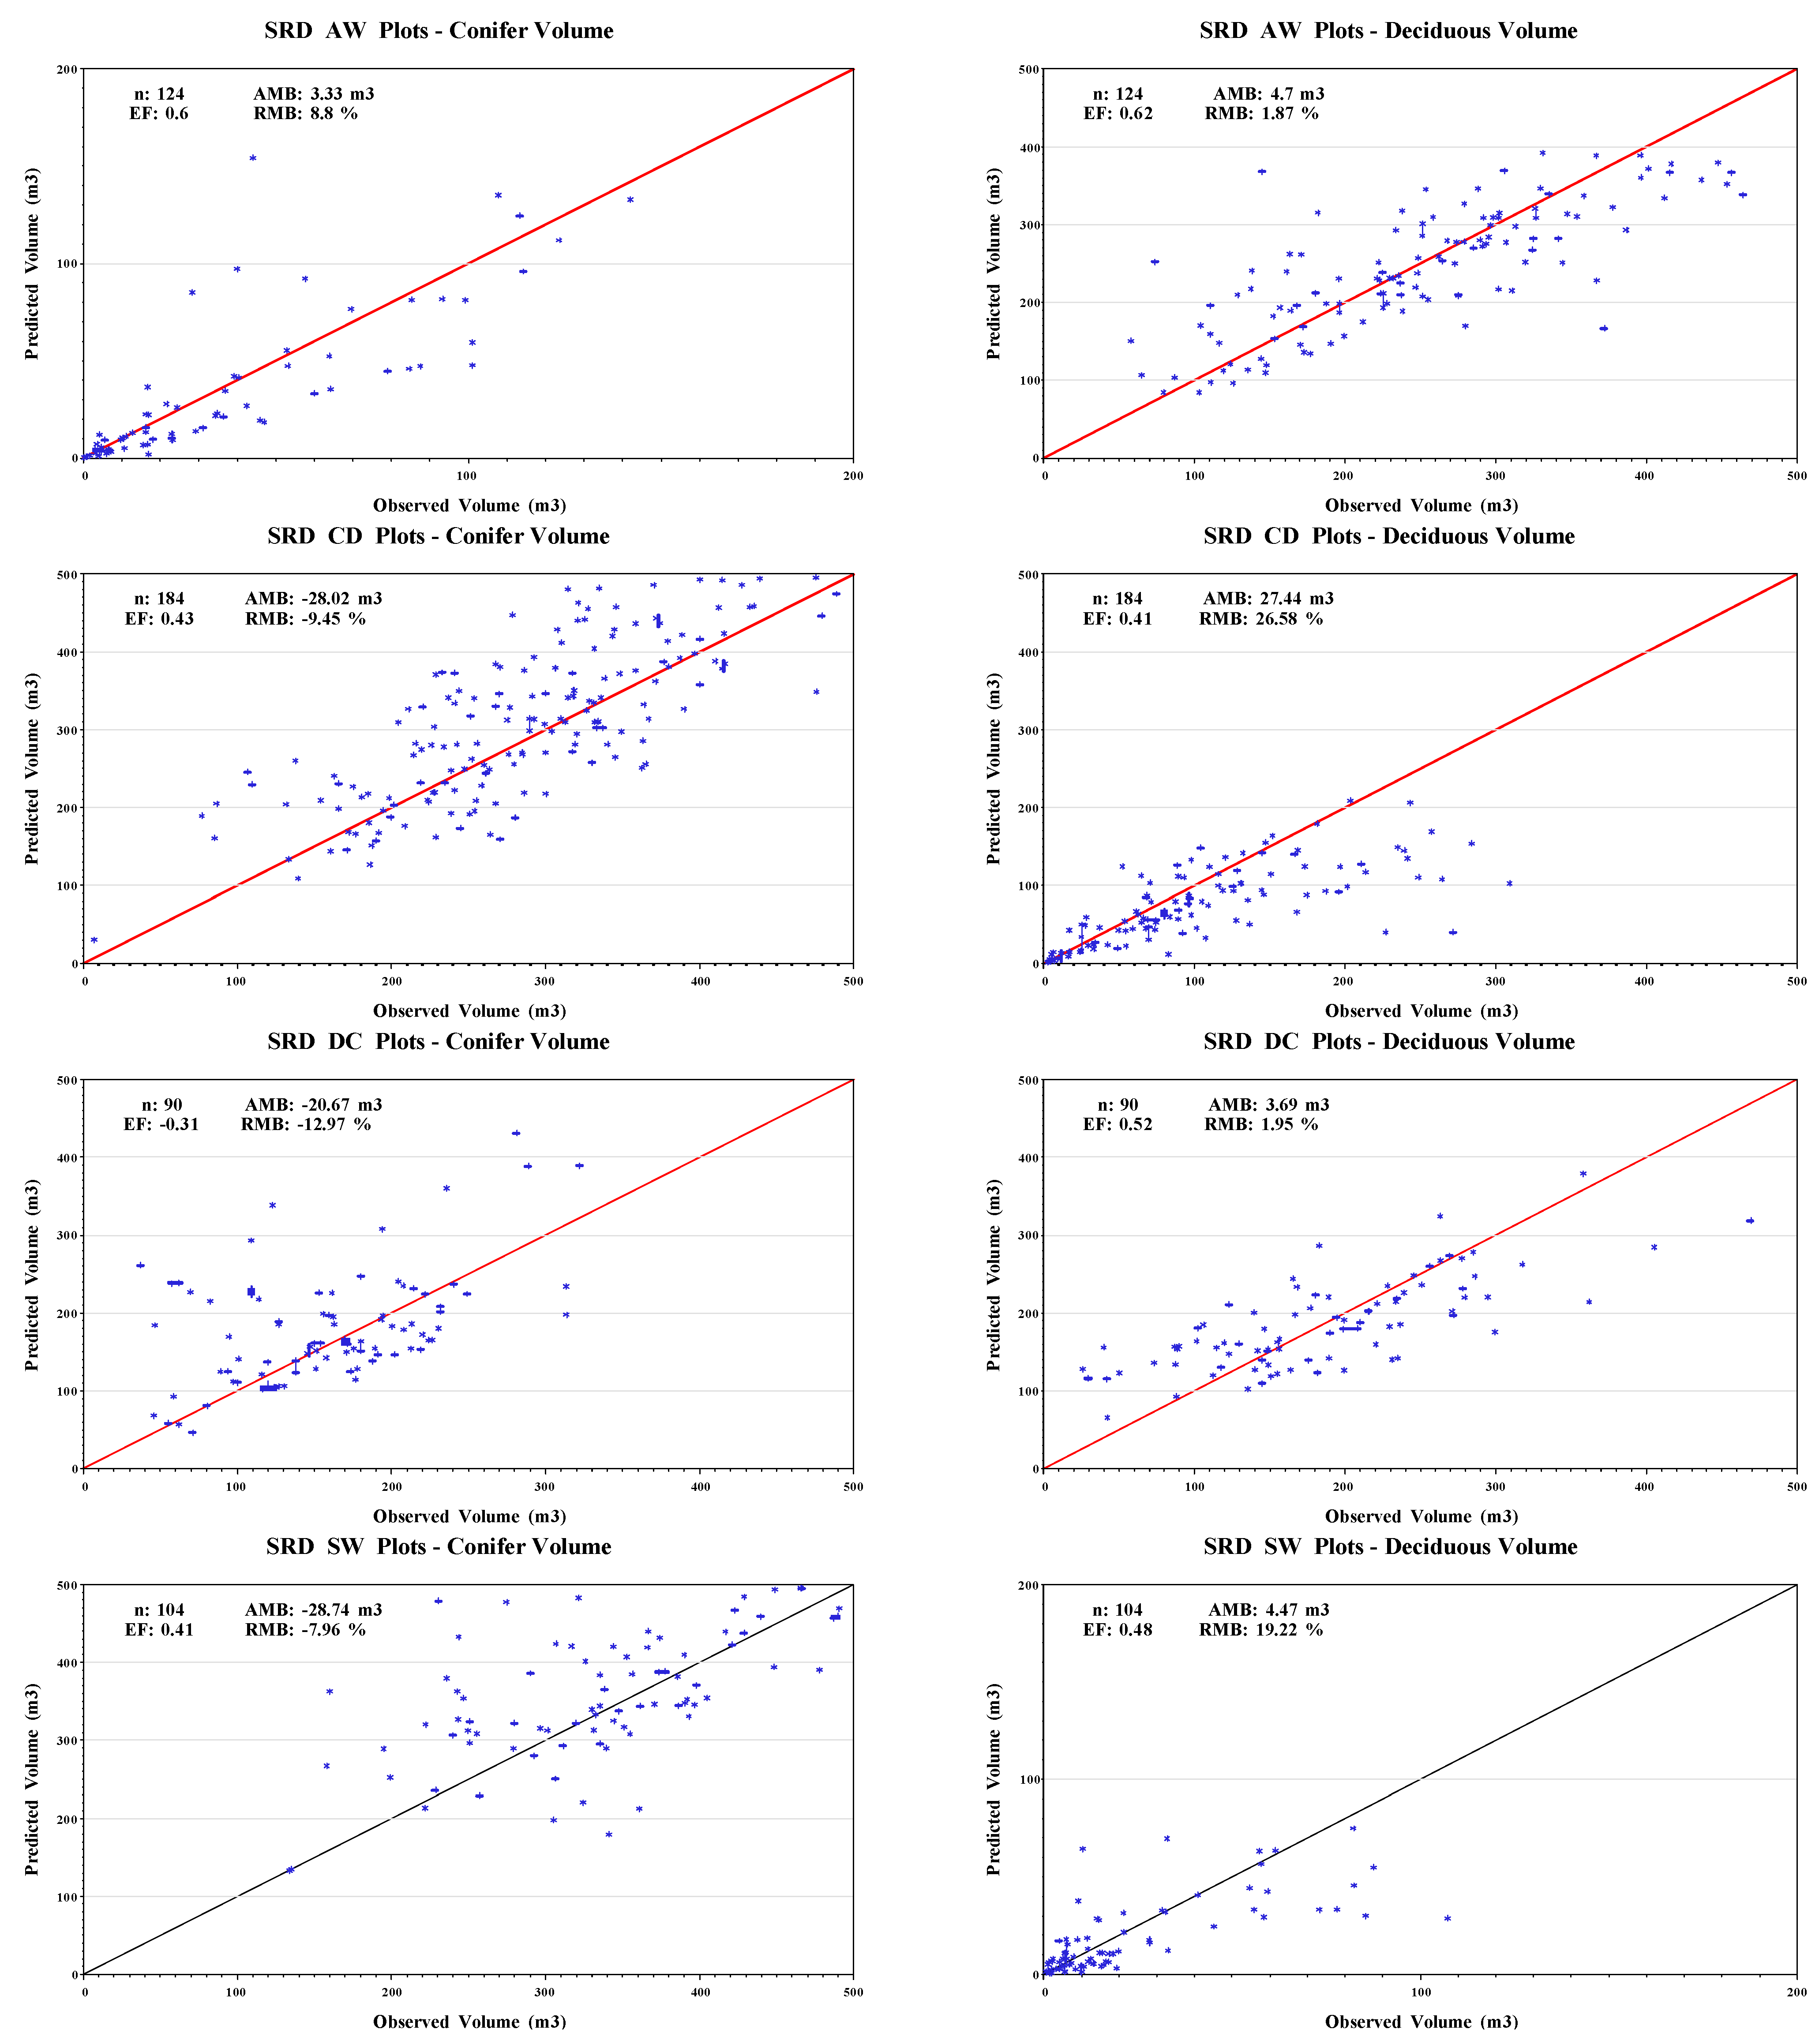
Plots of observed (Y ) vs. predicted Forests 04 00001 i001 data with a line Forests 04 00001 i002) representing the perfect fit were used to visually assess the goodness-of-fit and identify model biases [29,30]. Plots of residuals (predicted Forests 04 00001 i001 − observed (Y )) against stand characteristics such as site index and initial stand density, as well as projection length, were used to detect undesirable patterns in the residuals and a change in bias over the range of the parameter.
Five statistical metrics—average model bias (AMB), relative model bias percent (RMB), efficiency (EF) [7,11,29,31], the paired t-test for equivalence (EQ) [13,32] and the traditional t-test—were used to evaluate model performance. Average model bias (Equation (1)) is the average of the residual errors, presented in the units of the parameter being predicted, and is described by:
Forests 04 00001 i003
where (Yi), Forests 04 00001 i004 are as above and (n) is the number of observations. A model with an AMB of 0 would indicate no bias. Interpretation of the AMB should include an understanding of the significance of the error in terms of the accuracy of measurements for the different parameters.
The relative model bias (RMB, Equation (2)) relates the average mean bias to the observed mean estimator expressed as a percentage, providing an indication of the magnitude of the AMB (average error).
Forests 04 00001 i005
where Forests 04 00001 i006 
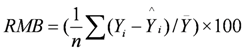
is the average of the observed values. These metrics have the statistical convention of being negative for overestimates and positive for underestimates. The combination of the two metrics, AMB and RMB, provide the end user with an overall assessment of bias.
Efficiency (Equation (3)) is a dimensionless statistic that relates the model predictions to the observed data in a manner similar to that of the coefficient of determination (R2) and is described by:
Forests 04 00001 i007
where the variables are as defined above. The efficiency statistic has a theoretical upper bound of one indicating a perfect model fit, a value of 0 indicates the model is no better than the mean. Unlike the coefficient of determination (R2, which has a lower bound of 0), an EF value of less than 0 indicates a poorer fit than simply using the overall mean. Poor efficiency indicates poor precision or large variability in the individual errors, thus providing some sense of how well the model will predict any single plot.
Equivalence (EQ) tests are frequently used for model evaluation [13]. Typically the test is used to determine whether model predictions fit the test data within a user defined range of deviation. This range can be absolute (e.g., ±20 m3 for volume) or relative (e.g., a percentage of the mean or standard error), and is chosen by the user (e.g., 10%, 20%). If the model is rejected at an initially chosen deviation, the user may well analyze for equivalence again with a wider deviation. Since the model may be the user’s only option, we feel a useful innovation was to reverse the equivalence test, and report which level of deviance the model would be deemed “just equivalent.” The user can then decide if this is an acceptable range.
In the paired t-test for equivalence (EQ), the null hypothesis (Equation (4)) is that the difference between the predicted and the observed values are significantly different. To obtain equivalence, there must be significant evidence to reject the null hypothesis and accept the alternative hypothesis (Equation (5)).
Forests 04 00001 i008
Forests 04 00001 i009
where p refers to the predicted and o the observed.
If Yi represents the observed and Forests 04 00001 i010 
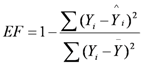
represents the predicted, the mean difference is Forests 04 00001 i011 with a standard deviation ( Forests 04 00001 i012 and standard error ( Forests 04 00001 i013).
The calculated t-statistic (td) defining the confidence interval is calculated as
Forests 04 00001 i014
The cutoff Forests 04 00001 i015 for a given probability level and criterion (ε) defines the region of indifference and is calculated as:
Forests 04 00001 i016
where Forests 04 00001 i017 denotes the quantile function of the F-distribution with 1, n− 1 degrees of freedom and the non-centrality parameter ( Forests 04 00001 i018 ) = n × ε [32]. Epsilon (ε) is a subjectively chosen but meaningful criterion, expressed relative to the standard deviation ( Forests 04 00001 i012 and represents the desired accuracy level (region of indifference) where any differences between observed and predicted are considered irrelevant.
When the t-statistic falls within the region of indifference (|t| < Forests 04 00001 i019 ), the null hypothesis is rejected and it is concluded that the two datasets are considered significantly similar, or equivalent. The power Forests 04 00001 i020 for a given criterion (ε) at a probability level (α) can be computed using:
Forests 04 00001 i021
where is the cumulative distribution function for the non-central t distribution [13].
Normally, the desired level of accuracy or cutoff is selected a priori, however, this leads simply to a result where we accept or reject the null hypothesis. Since the only factor that is not fixed is the criterion (ε) (if α is fixed at the usual 0.05 level), we solved for the criterion that represents the threshold where the test shifted from accepting the null hypothesis to rejecting it, while maintaining a power greater than 0.7. From a model validation perspective, the user needs to only decide if the criterion and associated power are acceptable for their application. In the case where the user would like to test different combinations of cutoff and power, we present sufficient information to complete these calculations.
For validating periodic annual increment, a t-test (α = 0.05) tested the null hypothesis that the AMB is not significantly different from 0 (H0μp -μo = 0). A t-statistic (Equation (9)) smaller than the critical t-value (Student’s t-table) will lead to the acceptance of the null hypothesis (p-value greater than 0.05) indicating no statistically significant bias.
Forests 04 00001 i022
where s is the standard deviation of the residual differences. p-values less than 0.05 indicate a statistically significant bias.

3. Results

3.1. ASRD—Mature PSPs

Figure 1 presents a sample of the scatter plots showing predicted volume vs. actual volume for the conifer and deciduous components in the four species groups found in the ASRD dataset. The full set of scatter plots for ASRD are presented online in Appendix A1 (supplemental material online). The scatter plots illustrate that, for the mature ASRD dataset, MGM is generally unbiased, with the amount of scatter around the 1:1 line varying by species group.
Figure 1. Scatter plots showing relationships between MGM predicted volume (m3 ha−1) and actual volume (m3 ha−1) for the four species groups in the ASRD dataset.
Forests 04 00001 g001
The validation statistics for yield variables in the ASRD dataset are presented in Table 2. AW density was slightly underestimated (RMB = 12.55%) with a trend indicating that the size of the underestimate increased with increasing AW density. In the CD stand types, the scatter plots showed that conifer components were slightly overpredicted. Large scatter around the 1:1 line for volume resulted in an EF of 0.43, however, the model was relatively unbiased with a RMB = −9.45%. For the DC group, deciduous top height is slightly overpredicted (RMB = −6.34%) but has a very low efficiency (EF = 0.16) underscoring the high variability in the predictions. In the SW species group, the scatter plot for volume does show substantial scatter around the 1:1 line while the model only slightly overpredicts volume (RMB = 7.96%). All EQ cutoffs were relatively low (<10% of the mean) with the exception of CD volume (EQ = ±38.55 m3) which was about ±13% of the mean.
Validation statistics for periodic annual increment are presented in Table 3. The negative values for volume increment AMB indicate that volume increment for all species groups is overestimated. The pure AW and SW have larger AMB (−1.485 and −1.856 m3 ha−1 y−1, respectively) while AMB is smaller for the mixed (CD and DC) species groups (−0.811 and −0.873 m3 ha−1 y−1, respectively). The p-values associated with the t-test are less than 0.05, indicating that model the volume increment predictions are significantly different than the observed. Other stand parameters such as DBH, average height and top height increments are also significant (with the exception of SW and DC DBH increments). The RMB values for top height increment for AW (RMB = 136.2%) and DC (RMB = 136.3%) show a clear overestimate which is consistent with expected stand dynamics occurring in these older mature deciduous stands. These stands are in decline, which is often indicated by dieback or windthrow of the top trees. For the SW and CD species groups, RMB for top height is much smaller. RMB is smallest for DBH increment in relation to other variables. The t-tests indicate that MGM is unbiased for diameter increment for the SW and DC groups.
Volume residual plots by site index, initial stand density and by projection length indicate that the model is unbiased over the range of these parameters with the exception of the CD group where there appears to be a trend to underestimate volume as site index increases (Appendix B1–3 supplemental material online).
Assessment of how residual volume increment changes with projection length for each of the species groups is shown in Table 4. The results indicate that the model is robust with respect to projection length. For the CD species group, the residual volume increment varies although the standard deviation decreases. For the AW, SW and DC species groups, the residual volume increments and their associated standard deviations tend to decrease as projection length increases. This is surprising as deviations usually increase with projection length.

3.2. SDS—PSPs

Results from validation against the SDS dataset are presented in Table 5 and the scatter plots are presented online in the Appendix A2 (supplemental material online). For the pure AW stand type, deciduous top height was slightly underpredicted (RMB = 12.52%), although AMB was only 1.25 m. For AW density, there was a slight overprediction (RMB of −9.7%) with large scatter around the 1:1 line. However this is not surprising given the large variability (SD = 2856 stems ha−1) and wide range (1000 to 36,000 stems ha−1) in observed final densities.
For the SW species group, the small sample size (13 plots) limits confidence. Nonetheless, the only noteworthy concerns are the poor prediction of the minor deciduous component and an overestimate of spruce density (RMB = −11.58%).
Within the MX species group, MGM performed well for all variables except conifer density (RMB = −12.35%). Deciduous density exhibited a large range (1000 to 15,250 stems ha−1) and variability (SD = 4262 stems ha−1), yet the model only slightly overpredicted deciduous density with a RMB = −4.16%. While RMB for deciduous average DBH (−18.5%) and average height (−14.25%) are large, the AMB is only −0.79 cm and −0.82 m, respectively. The efficiencies for the AW and MX deciduous components were low, due to the high variability in the predictions.
The validation statistics for periodic annual increment are presented in Table 6. Results show that DBH, height and top height increment for the pure and mixed species groups are statistically unbiased with the exception of AW top height and MX deciduous DBH increments. For these, the RMB was less than 21%.
Table 6. The summary of observed stand increment (the DBH increment (cm y−1), height increment (m y−1), and top height increment (m y−1)), and validation statistics (average mean bias (AMB), standard deviation of the residuals (SD_resid), relative mean bias (RMB), as well as the t-test statistics (t-statistic and p-value) for AMB, for the conifer and deciduous components by species group (AW, MX and SW) for the SDS dataset.
Species GroupVariableObservedStatistics of Model Fitt-test for AMB
nMeanAMBSD_ResidRMB (%)t-statisticp-value
AWDBH Inc (cm y−1)510.242−0.0010.075−0.27−0.0610.951
DeciduousHeight Inc (m y−1) 0.316−0.0040.071−1.14−0.3600.720
Top Height Inc (m y−1) 0.5420.0790.10514.555.373<0.001
MXDBH Inc (cm y−1)160.2650.0070.0812.470.3230.751
ConiferHeight Inc (m y−1) 0.239−0.0030.055−1.34−0.2330.819
Top Height Inc (m y−1) 0.3610.0300.0848.321.4390.171
MXDBH Inc (cm y−1)160.223−0.0470.084−20.96−2.2190.042
DeciduousHeight Inc (m y−1) 0.277−0.0510.108−18.51−1.9020.077
Top Height Inc (m y−1) 0.4560.0350.1277.761.1160.282
SWDBH Inc (cm y−1)130.2620.0020.1070.750.0660.948
ConiferHeight Inc (m y−1) 0.216−0.0110.052−5.13−0.7680.457
Top Height Inc (m y−1) 0.2970.0110.0813.730.4950.630

3.3. WESBOGY—PSPs

The validation statistics for the WESBOGY dataset are presented in Table 7 and the scatter plots are presented online in Appendix A3 (supplemental material online). The validation statistics for the WESBOGY data show that for the pure AW group, the deciduous density was underpredicted with a RMB of 16.97%. The scatter plots indicate that MGM is overestimating densities for stands with actual densities below 8000 stems ha−1 but that MGM is relatively unbiased for higher stand densities. This outcome may be a reflection of problems with accurate representation of stand density in small measurement plots, as well as to differences in self-thinning that may arise in low-density aspen stands. Several points in the scatter plots show underestimation of average DBH. These data come from plots in the Prince Albert and Big River installations in Saskatchewan. When compared to other WESBOGY installations, they have above average DBHs for both AW and SW, suggesting a regional growth difference. For the mixed species plots (MX), the deciduous top height showed similar issues as with the pure AW. For the pure spruce stand type (SW), DBH, average height, density and top height were all predicted well.
Statistics for validation of periodic annual increment for this dataset are presented in Table 8. The performance of the model shows that DBH, height and top height increments for the pure AW and SW species groups are statistically unbiased with the exception of SW top height increment. For the conifer in the CD species group, average height and top height increments and for the deciduous in the CD species group, DBH and top height are significantly different, however their RMB values are less than 22%.

3.4. Saskatchewan Mature PSPs

For the Saskatchewan dataset, scatter plots (Appendix A4, supplemental material online) and summary statistics (Table 9) show that for the pure AW plots, volume (RMB = 17.7%), BA (RMB = 15.03%) and density (RMB = 19.42%) were underestimated. The residuals showed a clear trend of increasing underestimation of density with increasing density. For the CD mixed species plots, all variables are predicted very well. Within the DC plots, trends are similar to those observed in the pure aspen group. Volume, BA and top height were underestimated; QMD was predicted very well. Density was slightly underpredicted with an RMB of 9.31%. All the variables within the pure SW stand type were predicted well. Efficiencies for the Saskatchewan data ranged from 0.19 to 0.98, with the exception of top height for the DC plots which had an EF of −0.98.

4. Discussion

4.1. Context and Application of MGM

Validation must be directly linked to the proposed use of the model. In application, MGM will be initialized using data from a random selection of stands in each inventory stratum. The projected yields will be the basis for the development of strata based yield curves needed for management planning and annual allowable cut determination. Predicted future stand composition will also be used to ensure that the future balance of species mixtures are maintained over the landscape.
Table 7. The summary of observed stand parameters (DBH (cm), height (m), density (stems ha−1) and top height (m)), as well as the validation statistics (average mean bias (AMB), standard deviation of the residuals (SD_resid), relative mean bias (RMB), efficiency (EF) and the equivalence cutoff (EQ) for the conifer and deciduous components by species group (AW, CD and SW) for the WESBOGY dataset.
Species GroupnVariableConiferDeciduous
ObservedStatistics of Model FitObservedStatistics of Model Fit
MeanMin Max SDAMBSD_residRMB (%)EFEQMeanMinMaxSDAMBSD_residRMB (%)EFEQ
AW93DBH (cm)---------4.441.458.561.67−0.050.94−1.130.680.31
Height (m)---------5.602.249.001.65−0.110.94−1.940.670.34
Density (stems ha−1)---------6967110030625766411822724.7316.970.851672.13
Top Height (m)---------7.572.7212.141.930.381.325.040.490.68
CD307DBH (cm)1.650.404.120.82−0.110.42−6.430.750.155.371.0813.542.320.291.395.320.630.43
Height (m)2.161.333.770.570.120.225.420.820.155.891.9910.281.78−0.031.13−0.510.590.24
Density (stems ha−1)701751225270−38.67125.97−5.510.7756.104030100393756055570.471649.9614.160.92765.70
Top Height (m)2.741.337.440.890.300.3310.990.770.367.442.6111.851.880.421.295.710.480.60
SW62DBH (cm)1.900.504.891.04−0.010.41−0.590.850.17---------
Height (m)2.181.343.900.620.060.222.790.870.11---------
Density (stems ha−1)7233251125259−31.9498.12−4.420.8457.84---------
Top Height (m)2.771.346.291.040.270.329.750.850.36---------
Table 8. The summary of the observed stand increment (the DBH increment (cm y−1), height increment (m y−1), and top height increment (m y−1)), the validation statistics (average mean bias (AMB), standard deviation of the residuals (SD_resid) as well as the t-test statistics (t-statistic and p-value) for AMB, for the conifer and deciduous components by species group (AW, MX and SW) in the WESBOGY dataset.
Species GroupVariableObservedStatistics of Model Fitt-test for AMB
nMeanAMBSD_ResidRMB (%)t-statisticp-value
AWDBH Inc (cm y−1)930.4160.00830.1612.000.4980.620
DeciduousHeight Inc (m y−1) 0.421−0.03270.166−7.77−1.8950.061
Top Height Inc (m y−1) 0.5490.05940.22410.822.5560.012
CDDBH Inc (cm y−1)3070.238−0.00180.133−0.78−0.2430.808
ConiferHeight Inc (m y−1) 0.2860.04340.12615.146.036<0.001
Top Height Inc (m y−1) 0.3790.07960.14621.019.557<0.001
CDDBH Inc (cm y−1)3070.5050.05420.20810.734.561<0.001
DeciduousHeight Inc (m y−1) 0.440−0.01770.198−4.03−1.5650.119
Top Height Inc (m y−1) 0.5450.06770.24612.424.834<0.001
SWDBH Inc (cm y−1)620.2920.00660.1012.250.5130.610
ConiferHeight Inc (m y−1) 0.327−0.00070.197−0.21−0.0270.978
Top Height Inc (m y−1) 0.4200.03310.2057.891.2730.208
Table 9. The summary of observed and predicted stand parameters (volume (m3 ha−1), basal area (m2 ha−1), QMD (cm), density (stems ha−1) and top height (m)), as well as the validation statistics (average mean bias (AMB), standard deviation of the residuals (SD_resid), relative mean bias (RMB), efficiency (EF) and the equivalence cutoff (EQ) for the combined conifer and deciduous components by species group (AW, CD, DC and SW) for the SSK dataset.
Species GroupnVariableCombined Conifer and Deciduous
ObservedStatistics of Model Fit
MeanMin Max SDAMBSD_ResidRMB (%)EFEQ
AW20Volume (m3 ha−1)268.96121.72420.5885.4047.6130.5817.700.5464.55
Basal Area (m2 ha−1)32.3217.5546.127.224.863.6715.030.267.76
QMD (cm)18.7812.6328.625.19−0.090.85−0.470.970.75
Density (stems ha−1)13585002263586263.81254.7719.420.60380.28
Top Height (m)21.5217.3028.103.430.981.074.560.821.51
CD20Volume (m3 ha−1)333.08229.83467.8364.45−0.6443.22−0.190.5529.98
Basal Area (m2 ha−1)38.7227.1946.286.14−0.624.50−1.600.453.10
QMD (cm)22.6017.0028.123.05−0.841.25−3.720.751.36
Density (stems ha−1)1028525185036171.03141.256.910.81133.58
Top Height (m)24.5820.2030.702.440.622.032.540.241.47
DC20Volume (m3 ha−1)360.64219.96509.7081.3654.7943.4115.190.2479.34
Basal Area (m2 ha−1)40.7726.3357.377.964.214.1510.320.437.34
QMD (cm)23.2515.4429.193.290.251.451.060.801.16
Density (stems ha−1)1023525215039795.19105.949.310.87143.15
Top Height (m)24.0621.0026.601.531.751.207.28−0.982.41
SW20Volume (m3 ha−1)340.76207.39472.8267.41−31.2451.35−9.170.1954.52
Basal Area (m2 ha−1)40.4425.7355.217.09−2.245.82−5.540.226.07
QMD (cm)23.0417.5730.333.66−0.771.01−3.330.881.38
Density (stems ha−1)1059550192542840.48141.863.820.8895.34
Top Height (m)24.0120.7029.602.110.671.152.790.601.20

4.2. Validation Metrics

The justification to use a model for forest management decision making is based on evidence that the model behaves logically under a range of typical conditions, is unbiased and performs within a specified allowable error. Since many validation metrics are potentially helpful in assessing model performance, the final chosen metrics should complement one another. Average model bias is a widely used metric, but does not provide sufficient information to fully characterize model bias. Relative mean bias (RMB) relates the AMB to the mean of the parameter, assessing the magnitude of the bias. However, the RMB can also be misleading when the mean parameter is small. Inconsequential deviations in size or yield (e.g., in juvenile datasets) may appear as a large RMB. For example a 10% variation in RMB may be smaller than the absolute measurement error (e.g., measurement errors for DBH and height are ±1 cm and ±0.5 m, respectively [17]). There is also a possibility that two very large opposing residual errors can offset one another to yield small average and relative model biases which prompts the need for a third metric to assess the variation of the residuals.
Efficiency provides an assessment of precision, with high efficiency indicating that there is little variation in the residual errors. The combination of AMB, RMB and efficiency provide a robust assessment of model behavior. The observed vs. predicted scatter plots provide a visual depiction of similar information and further illustrates where a model behaves poorly. For example, a model may be biased (large AMB) and have poor precision (low EF) overall. However, the scatter plot of the residuals might clearly show that the bias and poor precision are a result of poor performance in a specific region within the data (e.g., very old stands).
By plotting the residual errors against parameters such as site index, initial density or projection length, biases hidden in the data can be identified. For example, a model may tend to underestimate yield at low site indices and overestimate yield at high site indices. Examining how bias changes with projection length allows the user to assess whether the model bias is stable over all projections lengths or increases with projection length.
Another valuable model assessment metric is the equivalence test. We reversed the paired t-test for equivalence to identify the threshold value where the model shifts from being “not equivalent” to “equivalent”. This simplifies the problem of searching for an acceptable threshold when using equivalence testing. This, in essence, turns the equivalence test into a confidence interval depicting an allowable error. Model users need only decide if the deviations presented and the associated power are acceptable for their application. Frequently, deviations of less than ±10% of the mean are reasonable, however, in the absence of a better model, higher values may be accepted.
The use of a single metric to assess model behavior is not recommended, but rather a suite of metrics are needed to fairly assess model performance.

4.3. Data Partitioning

The ASRD mature, the SDS and a portion of the WESBOGY plot data used in this validation were also used in building and parameterizing the individual growth and mortality relationships used in MGM. The ideal dataset for validation is independent data which was not used in fitting the parameters for the model [10,31]. If the data for validation are not independent of the model-building data, then prediction errors are not independent and are less useful indicators of a models predictive ability [33]. Frequently, data are intentionally set aside for validation. However, the decision to set aside data when it is scarce may result in a model with inferior parameter estimates [31]. Kozak and Kozak [33] demonstrated that setting aside data provides little new information when evaluating regression models; their preferred method was the collection of new data. Comparing the model with the data from which it was developed can provide useful information relating to how well the model is working [7]. While it is possible to use data from a different region or population, regional differences in calibration may limit the assessment of model behavior in the region of interest.
The majority of the arguments for data splitting apply more appropriately to models represented by a single equation, rather than to more complex models which include many component relationships. For complex models like MGM, which consist primarily of a series of species-specific individual tree functions, a validation at the stand level represents a difference in scale and level of integration which distances the stand level validation data from the individual tree data used in model parameterization.
We acknowledge that a true independent validation dataset was not available given the limited data. We feel that, although the data used in this validation are not entirely independent of the tree-level parameterization, the conclusions drawn from this validation are valuable, especially given the need to assess stand-level performance for management purposes.

4.4. Summary of Model Performance

4.4.1. State Variables

In general MGM performs well for state variables when compared to data from a range of stand composition (pure and mixed aspen and spruce) and ages. The projections for both pure and mixed stands also indicate general agreement with the expected behavior of these stands as described in the literature [3,34,35,36,37,38]. Table 10 summarizes the range of relative mean biases over all datasets for the deciduous parameters in the AW and DC species group and coniferous parameters for the SW and CD species groups.
Table 10. The summary of the ranges of relative mean biases (RMB) in percent over all datasets by stand parameters (volume (m3 ha−1), basal area (m2 ha−1), DBH(cm) and QMD (cm), density (stems ha−1) and top height (m)).
Species GroupVariableRange of RMB%
MinMax
AW/DCVolume (m3 ha−1)−12.9717.70
DeciduousBasal Area (m2 ha−1)5.1515.03
DBH/QMD (cm)−18.55.15
Density (stems ha−1)−9.7419.42
Top Height (m)−6.4412.52
SW/CDVolume (m3 ha−1)−9.5−0.19
ConiferousBasal Area (m2 ha−1)−5.54−4.60
DBH/QMD (cm)−6.435.35
Density (stems ha−1)−12.357.11
Top Height (m)−3.0310.99
With respect to top height, the model is slightly biased, with the majority of relative mean bias (RMB) values being less than 10% for both conifer and deciduous components of these stands. A larger RMB can indicate poorer model performance as seen in deciduous top height in the SDS AW group (RMB = 12.52%, AMB = 1.25 m, EF = 0.39 and EQ = 1.7 m). However, this is not the case in the WESBOGY dataset where the CD conifer top height (RMB = 10.99%) is not indicative of poor model performance given the other metrics (top height mean of 2.74 m, AMB = 0.3 m, EF = 0.77, and EQ of 0.36). The large bias in deciduous top height increment in older stands (Table 3) is likely related to dieback of the aspen. In MGM, top height is projected using height vs. age and site index (“site”) curves [18,19,26]. For the top trees, there is little or no reduction in height increment in the model due to overtopping tree competition, therefore top height should be estimated well. Because the site curve is obtained from the literature, deviations in top height are likely caused by errors associated with the sampling or construction of these curves [39]. Alberta is currently evaluating a new set of permanent sample plot (PSP) based curves [40], rather than the current stem analysis-based ones, which may further improve top height behavior.
In most cases, average height was predicted well and was relatively unbiased with a maximum RMB of 14.25%. Unlike top height, average height is the mean of all trees, most of which have their height increments reduced due to competition from overtopping trees. Consequently, this indicates that the effects of competition on height are being modeled well within MGM.
Both conifer and deciduous average DBH are also projected well. In the juvenile SDS dataset, there appears to be an overprediction of deciduous DBH in the mixed species group (RMB = 18.5%), however, the EQ is 1.41 cm, which is similar to the SW conifer EQ of 1.53 cm which had a RMB of −0.89%. The remaining RMB values are below 7%, indicating the model is relatively unbiased with respect to DBH.
Densities for the mature deciduous and conifer components were predicted well. The exception is in the Saskatchewan dataset, where the pure AW plots had a RMB of 19.42% indicating underestimation of deciduous tree survival. This suggests that the survival functions for Saskatchewan may require refitting using regional data.
In the juvenile stages, the model performs well for height and DBH; however, difficulties in predicting juvenile mortality are evident. For the SDS dataset, the model tended to overestimate densities of both the conifer and deciduous components. For the tended WESBOGY dataset MGM underestimated deciduous density and slightly overestimated conifer density. Mortality is highly variable in juvenile stands, as factors unrelated to density and social position are also important. These factors include: competition from shrubs and grass [41,42], browsing [41,43,44,45], disease [46,47,48], insects [49], and climate [50,51].
Stand volume is probably the most important output variable for forest managers, and integrates the effects of height, diameter and density. Our juvenile PSP datasets are too young to contain enough stem volume to meaningfully compare predictions; however, for the mature ASRD data, the model is unbiased for deciduous components.
The residual errors over the range of a parameter such as site index, initial density and projection length showed no trends in bias with respect to these inputs.
For the Saskatchewan dataset, MGM provided unbiased estimates of conifer volume, but underestimated deciduous volume in the AW and DC plots. Again, the regional underestimation of density may be to blame, since heights and diameters were predicted well.

4.4.2. Increment Variables

Periodic annual volume increment assesses the growth components of the model in isolation since mortality, removals and ingress are accounted for. In contrast, under the state variable validation, yield predictions are assessed as a whole system where, for example, density underestimates can offset overestimates of DBH and height, resulting in yield estimates being unbiased. The validation of MGM using periodic annual volume increment with the ASRD dataset showed that overall MGM is overestimating volume increment for the four species groups (Table 3). Overestimates range from 0.8 m3 ha−1 y−1 to 1.85 m3 ha−1 y−1 with the pure stands showing the greatest overestimates. The performance in these mature stands may be attributed to a number of factors. Firstly, the average ages at the beginning of the projections are 74 years for AW, 108 years for DC, 147 for CD and 154 for SW. The average mortality rate in natural pure SW stands is 0.7% [52], however, in the SW and CD species group, 16% and 20% of the plots, respectively, showed an average mortality rate greater than 2.1%, more than three times the average rate. For the AW and DC species groups, these age ranges are associated with stands that are in the decline phase, where top trees are being replaced by new cohorts of the same species or understory spruce are emerging into the canopy. In these cases, stand dynamics are highly variable and difficult to model when the underlying causes (i.e., stem decay, stem breakage due to wind, ice and snow damage) are not explicitly represented in the model.
The model increment performance against the juvenile SDS and WEBOGY datasets was encouraging since these age ranges represent the ages where the model will be used in management planning. Results show that DBH increment predictions are unbiased with the exception of the WESBOGY CD deciduous DBH being underestimated by 5 mm y−1. In both juvenile datasets the deciduous top height is underestimated. The remaining SDS height and top height increments are unbiased. For the tended WESBOGY data, height and top height increments for the conifer in the CD are underestimated, since the pure SW species group is unbiased, this suggests that the influence of the deciduous on spruce growth needs further refinement.

4.5. Limitations of This Validation

Although this validation is rigorous, it cannot evaluate model performance outside the frame of the validation datasets. One concern is that we cannot assess rotation length projections of post-harvest stands because re-measured plots from such stands of sufficient age do not yet exist in the western boreal region. For now, we must assume that the dynamics of mature post-harvest stands will be similar to that of mature natural-origin stands. We also note a significant lack of stands of middle-age (25–60 years), and a serious lack of pure white spruce juvenile and mid-aged stands in the validation datasets. The lack of young spruce dominated plots largely reflects successional dynamics in these natural mixedwood stands, but is a concern since pure young spruce stands are frequently created under current management practices. This validation also assessed model performance for the tended juvenile aspen/spruce mixes found in the WESBOGY data. Although the model validated very well, some caution is required since the WESBOGY data is limited only to spruce/aspen mixes over a short assessment period (maximum 10 years).

5. Conclusions

Validation is an essential and important aspect of model evaluation for users and regulatory agencies. The objective of this validation was to assess the performance of the Mixedwood Growth Model (MGM). The validation draws on a suite of metrics that, in combination, support the use of MGM by forest managers in predicting the yield outcomes of many different species mixtures, stand structures and thinning or tending treatments. MGM worked well for both pure and mixed species stands of aspen and spruce. While the model performed well in young, post-harvest stands, this work indicated problems in capturing the highly variable mortality in aging deciduous and conifer stands. Nunifu [5] has also shown that the model works well for lodgepole pine. The sound performance of MGM is attributed to the individual tree modeling approach where growth and survival of each tree is influenced by its species, size and social position within the stand. This approach makes MGM responsive to changes in stand structure and allows projections of complex species mixtures and stand structures, especially following thinning or tending treatments.
There is still a need to continue model development to better represent managed/tended stands. Mortality could be improved for old stands with better representation of agents that cause periodic high mortality (insects, disease, severe wind events). A better regional calibration in Saskatchewan is also warranted.

Acknowledgments

MGM was originally developed by Stephen J. Titus and Bill Adams. Numerous graduate students have contributed model components. Members of the Western Boreal Growth and Yield Association (WESBOGY), the Mixedwood Management Association (MWMA) and the Forest Resource Improvement Association of Alberta (FRIAA) have provided funding and support. Strategic Development Team members, Gitte Grover, Yuqing Yang, Willi Fast, Greg Behuniak, Ken Greenway, Gordon Whitmore, and Victor Lieffers, provided invaluable input into the development of the model. We gratefully acknowledge the support provided by these individuals and organizations.

Conflict of Interest

The authors declare no conflict of interest.

Supplementary Files

  • Supplementary File 1:

    Supplementary Materials (ZIP, 720 KB)

  • References

    1. Bokalo, M.; Stadt, K.J.; Comeau, P.G.; Titus, S.J. Mixedwood Growth Model (MGM) (version MGM2010.xls). University of Alberta, Edmonton, Alberta, Canada. 2010. Available online: http://www.rr.ualberta.ca/Research/MixedwoodGrowthModel.aspx (accessed on 7 July 2011).
    2. Pitt, D.G.; Mihajlovich, M.; Proudfoot, L.M. Juvenile stand responses and potential outcomes of conifer release efforts on Alberta’s spruce–aspen mixedwood sites. For. Chronicle 2004, 80, 583–597. [Google Scholar]
    3. Comeau, P.G.; Kabzems, R.; McClarnon, J.; Heineman, J.L. Implications of selected approaches for regenerating and managing western boreal mixedwoods. For. Chronicle 2005, 81, 559–574. [Google Scholar]
    4. Farnden, C. An analysis framework for linking regeneration standards to desired future forest conditions. For. Chronicle 2009, 85, 285–292. [Google Scholar]
    5. Nunifu, T.K. Compatible diameter and height increment models for lodgepole pine, trembling aspen, and white spruce. Can. J. For. Res. 2009, 39, 180–192. [Google Scholar] [CrossRef]
    6. Pretzsch, H.; Biber, P.; von Gadow, K.; Hasenauer, H.; Kändler, G.; Kenk, G.; Kublin, E.; Nagel, J.; Pukkala, T.; Skovsgaard, J. Recommendations for standardized documentation and further development of forest growth simulators. Forstwiss. Centralbl. 2002, 121, 138–151. [Google Scholar] [CrossRef]
    7. Soares, P.; Tomé, M.; Skovsgaard, J.P.; Vanclay, J.K. Evaluating a growth model for forest management using continuous forest inventory data. For. Ecol. Manag. 1995, 71, 251–265. [Google Scholar] [CrossRef]
    8. Schmid, S.; Zingg, A.; Biber, P.; Bugmann, H. Evaluation of the forest growth model SILVA along an elevational gradient in Switzerland. Eur. J. For. Res. 2006, 125, 43–55. [Google Scholar] [CrossRef]
    9. Rykiel, E.J., Jr. Testing ecological models: The meaning of validation. Ecol. Model. 1996, 90, 229–244. [Google Scholar] [CrossRef]
    10. Yang, Y.; Monserud, R.A.; Huang, S. An evaluation of diagnostic tests and their roles in validating forest biometric models. Can. J. For. Res. 2004, 34, 619–629. [Google Scholar] [CrossRef]
    11. Pinjuv, G.; Mason, E.G.; Watt, M. Quantitative validation and comparison of a range of forest growth model types. For. Ecol. Manag. 2006, 236, 37–46. [Google Scholar] [CrossRef]
    12. Mayer, D.G.; Butler, D.G. Statistical validation. Ecol. Model. 1993, 68, 21–32. [Google Scholar] [CrossRef]
    13. Robinson, A.P.; Froese, R.E. Model validation using equivalence tests. Ecol. Model. 2004, 176, 349–358. [Google Scholar] [CrossRef]
    14. Pretzsch, H. Application and evaluation of the growth simulator SILVA 2.2 for forest stands, forest estates and large regions. Forstwiss. Centralbl. 2002, 121, 28–51. [Google Scholar]
    15. Marshall, P.; Parysow, P.; Akindele, S. Evaluating Growth Models: A Case Study Using Prognosis BC. In Proceedings of Third Forest Vegetation Simulator Conference, Fort Collins, CO, USA, 13–15 February 2007; pp. 167–185.
    16. McGaughey, R.J. Stand Visualization System (SVS) version 3.36; USDA Forest Service, Pacific Northwest Research Station: Portland, OR, USA. 2002. Available online: http://forsys.cfr.washington.edu (accessed on 12 December 2011).
    17. Alberta Lands and Forest Service (ALFS), Permanent Sample Plot Field Procedures Manual; Alberta Lands and Forest Service, Forest Management Division, Resource Analysis Centre: Edmonton, Alberta, Canada, 1998.
    18. Huang, S. A Subregion-Based Compatible Height-Site Index-Age Model for Young and Mature White Spruce in Alberta; Forest Management Research Note; Alberta Environmental Protection Land and Forest Service: Edmonton, Alberta, Canada, 1997; Publication NO. T/354. [Google Scholar]
    19. Huang, S.; Titus, S.J.; Morgan, D.J. A Compatible Height-Site Index-Age Model for Young and Mature Aspen Based on Natural Subregions; Forest Management Research Note; Alberta Environmental Protection Land and Forest Service: Edmonton, Alberta, Canada, 1997; Publication No. T/355. [Google Scholar]
    20. Huang, S. Ecologically Based Individual Tree Volume Estimation for Major Alberta Tree Species. Report #1. Individual Tree Volume Estimation Procedures for Alberta: Methods of Formulation and Statistical Foundations; Alberta Environmental Protection, Land and Forest Services, Forest Management Division: Edmonton, Alberta, Canada, 1994. [Google Scholar]
    21. Alberta Sustainable Resource Development (ASRD), Stand Dynamics System (SDS) Field Remeasurement Manual; Alberta Land and Forest Division: Edmonton, Alberta, Canada, 2003.
    22. Bokalo, M.; Comeau, P.G.; Humphries, S. Western Boreal Growth and Yield Association Long Term Study—Experimental Design, Data Collection and Database Maintenance Manual; University of Alberta: Edmonton, Alberta, Canada, 2012. [Google Scholar]
    23. Bokalo, M.; Comeau, P.G.; Titus, S.J. Early development of tended mixtures of aspen and spruce in western Canadian boreal forests. For. Ecol. Manag. 2007, 242, 175–184. [Google Scholar] [CrossRef]
    24. Timberline Forest Inventory Consultants Ltd. Weyerhaeuser Permanent Sample Plot, State of the Data; Weyerhaeuser Saskatchewan Forestlands: Prince Albert, Saskatchewan, Canada, 2005.
    25. Tansanu, C.; Bokalo, M. Evaluating the Predictive Performance of Several Growth Models Calibrated for Saskatchewan; Final Report; Saskatchewan Forest Centre: Prince Albert, Saskatchewan, Canada, 2006. Available online: http://www.environment.gov.sk.ca/Default.aspx?DN=eb4897fd-0c2e-45c4-a548-6f2a290155a4 (accessed on 15 July 2011).
    26. Cieszewski, C.J.; Bella, I.E.; Yeung, D.P. Preliminary Site-Index Height Growth Curves for Eleven Timber Species in Saskatchewan; draft unpublished report; Saskatchewan Forest Centre: Prince Albert, Saskatchewan, Canada, 1993. [Google Scholar]
    27. Gal, J.; Bella, I.E. New Stem Taper Functions for 12 Saskatchewan Timber SpeciesInformation report NOR–X– 338; CFS Northern Forestry Centre: Edmonton, Alberta, Canada, 1994. [Google Scholar]
    28. Pretzch, H. Forest Dynamics, Growth and Yield; Springer: Berlin and Heidelberg, Germany, 2009; pp. 56–58. [Google Scholar]
    29. Loague, K.; Green, R.E. Statistical and graphical methods for evaluating solute transport models: Overview and application. J. Contam. Hydrol. 1991, 7, 51–73. [Google Scholar] [CrossRef]
    30. Sterba, H.; Monserud, R.A. Applicability of the forest stand growth simulator prognaus for the Austrian part of the Bohemian Massif. Ecol. Model. 1997, 98, 23–34. [Google Scholar] [CrossRef]
    31. Vanclay, J.K.; Skovsgaard, J.P. Evaluating forest growth models. Ecol. Model. 1997, 98, 1–12. [Google Scholar] [CrossRef]
    32. Wellek, S. Testing Statistical Hypotheses of Equivalence and Noninferiority, 2nd ed; Chapman and Hall: London, England, 2009. [Google Scholar]
    33. Kozak, A.; Kozak, R. Does cross validation provide additional information in the evaluation of regression models? Can. J. For. Res. 2003, 33, 976–987. [Google Scholar] [CrossRef]
    34. Delong, C. Dynamics of Boreal Mixedwood Ecosystems. In Proceedings of the Symposium on Northern Mixedwoods, Fort St. John, British Columbia, Canada, 12–14 September, 1989; pp. 30–31.
    35. Lieffers, V.J.; Stewart, J.D.; Macmillan, R.B.; Macpherson, D.; Branter, K. Semi-natural and intensive silvicultural systems for the boreal mixedwood forest. For. Chronicle 1996, 72, 286–292. [Google Scholar]
    36. Man, R.; Lieffers, V.J. Are mixtures of aspen and white spruce more productive than single species stands? For. Chronicle 1999, 75, 505–513. [Google Scholar]
    37. Chen, H.Y.; Popadiouk, R.V. Dynamics of North American boreal mixedwoods. Environ. Rev. 2002, 10, 137–166. [Google Scholar] [CrossRef]
    38. Kabzems, R.; Garcia, O. Structure and dynamics of trembling aspen —white spruce mixed stands near Fort Nelson, B.C. Can. J. For. Res. 2004, 34, 384–395. [Google Scholar] [CrossRef]
    39. Mowrer, H.T.; Frayer, W.E. Variance propagation in growth and yield projections. Can. J. For. Res. 1986, 16, 1196–1200. [Google Scholar] [CrossRef]
    40. Huang, S.; Meng, S.X.; Yand, Y. A Growth and Yield Projection System (GYPSY) for Natural and Post-Harvest Stands in Alberta; Technical Report Pub. No.: T/216; Alberta Sustainable Resource Development: Edmonton, Alberta, Canada, 2009. [Google Scholar]
    41. Boateng, J.O.; Heineman, J.L.; Bedford, L.; Harper, G.J.; Linnell Nemec, A.F. Long-term effects of site preparation and postplanting vegetation control on Picea glauca survival, growth and predicted yield in boreal British Columbia. Scand. J. For. Res. 2009, 24, 111–129. [Google Scholar] [CrossRef]
    42. Pitt, D.G.; Comeau, P.G.; Parker, W.C.; MacIsaac, D.; McPherson, S.; Hoepting, M.K.; Stinson, A.; Mihajlovich, M. Early vegetation control for the regeneration of a single-cohort, intimate mixture of white spruce and trembling aspen on upland boreal sites. Can. J. For. Res. 2010, 40, 549–564. [Google Scholar] [CrossRef]
    43. Zimmerling, T.N.; Zimmerling, L.M. Effectiveness of a physical barrier in deterring vole and snowshoe hare feeding damage to Lodgepole pine seedlings. West. J. Appl. For. 1998, 13, 12–14. [Google Scholar]
    44. Brandt, J.P.; Cerezke, H.F.; Mallett, K.I.; Volney, W.J.A.; Weber, J.D. Factors affecting trembling aspen (Populus tremuloides Michx.) health in the boreal forest of Alberta, Saskatchewan, and Manitoba, Canada. For. Ecol. Manag. 2003, 178, 287–300. [Google Scholar] [CrossRef]
    45. Sullivan, T.P.; Sullivan, D.S.; Lindgren, P.M.F.; Ransome, D.B. Long-term responses of ecosystem components to stand thinning in young lodgepole pine forest: IV. Relative habitat use by mammalian herbivores. For. Ecol. Manag. 2007, 240, 32–41. [Google Scholar] [CrossRef]
    46. Perala, D.A. How endemic injuries affect early growth of aspen suckers. Can. J. For. Res. 1984, 14, 755–762. [Google Scholar] [CrossRef]
    47. Mallett, K.; Volney, W. The effect of Armillaria root disease on lodgepole pine tree growth. Can. J. For. Res. 1999, 29, 252–259. [Google Scholar] [CrossRef]
    48. Blenis, P.V. Impact of simulated aspen shoot blight on trembling aspen. Can. J. For. Res. 2007, 37, 719–725. [Google Scholar] [CrossRef]
    49. Pothier, D.; Mailly, D. Stand-level prediction of balsam fir mortality in relation to spruce budworm defoliation. Can. J. For. Res. 2006, 36, 1631–1640. [Google Scholar] [CrossRef]
    50. Hogg, E.; Wein, R.W. Impacts of drought on forest growth and regeneration following fire in southwestern Yukon, Canada. Can. J. For. Res. 2005, 35, 2141–2150. [Google Scholar] [CrossRef]
    51. Cortini, F.; Comeau, P.G.; Boateng, J.O.; Bedford, L.; McClarnon, J.; Powelson, A. Effects of climate on growth of lodgepole pine and white spruce following site preparation and its implications in a changing climate. Can. J. For. Res. 2011, 41, 180–194. [Google Scholar] [CrossRef]
    52. Feng, Z.; Stadt, K.J.; Lieffers, V.J. Linking juvenile white spruce density, dispersion, stocking, and mortality to future yield. Can. J. For. Res. 2006, 36, 3173–3182. [Google Scholar] [CrossRef]

    Share and Cite

    MDPI and ACS Style

    Bokalo, M.; Stadt, K.J.; Comeau, P.G.; Titus, S.J. The Validation of the Mixedwood Growth Model (MGM) for Use in Forest Management Decision Making. Forests 2013, 4, 1-27. https://doi.org/10.3390/f4010001

    AMA Style

    Bokalo M, Stadt KJ, Comeau PG, Titus SJ. The Validation of the Mixedwood Growth Model (MGM) for Use in Forest Management Decision Making. Forests. 2013; 4(1):1-27. https://doi.org/10.3390/f4010001

    Chicago/Turabian Style

    Bokalo, Mike, Kenneth J. Stadt, Philip G. Comeau, and Stephen J. Titus. 2013. "The Validation of the Mixedwood Growth Model (MGM) for Use in Forest Management Decision Making" Forests 4, no. 1: 1-27. https://doi.org/10.3390/f4010001

    Article Metrics

    Back to TopTop