Article

Response of Soil CO2 Emission to Addition of Biochar and Dissolved Organic Carbon along a Vegetation Restoration Gradient of Subtropical China

1
College of Resources and Environment, Fujian Agriculture and Forestry University, Fuzhou 350002, China
2
Fujian Academy of Forestry Science, Fuzhou 350012, China
3
College of Land Resources and Environment, Jiangxi Agricultural University, Nanchang 330045, China
*
Author to whom correspondence should be addressed.
Forests 2024, 15(5), 753; https://doi.org/10.3390/f15050753
Submission received: 7 April 2024 / Revised: 24 April 2024 / Accepted: 24 April 2024 / Published: 25 April 2024
(This article belongs to the Special Issue Soil Organic Matter and Soil Multifunctionality in Forest Ecosystems)

Abstract

:
Biochar, as a soil amendment, has been widely confirmed to increase soil carbon sequestration. However, how biochar addition affects soil carbon changes during the vegetation restoration process is still unclear, which constrains our ability to explore biochar’s application in the technology of soil carbon sequestration in forests. We conducted an incubation experiment on biochar and dissolved organic matter (DOM) addition to soil at three stages of revegetation (degraded land (DS), plantation forest (PS), and secondary natural forest (NS) in Changting County in Fujian province, China) to investigate the effects of vegetation restoration, biochar, DOM, and their interaction on soil CO2 emission and its relative mechanisms. We found that the accumulative release of CO2-C in the NS and PS soils was 7.6 and 6.8 times higher, respectively, in comparison to that from the DS soil. In the DS, biochar addition significantly increased the accumulative release of CO2-C, soil pH, NH4+-N content, qCO2, phenol oxidase, and peroxidase activities. Peroxidase activities were positively correlated with the accumulative release of CO2-C, and oxidase was the most important direct factor influencing the accumulative release of CO2-C in the DS. However, the accumulative release of CO2-C, soil NH4+-N content, qCO2, β-glucosidase, and N-acetylglucosaminidase activities was significantly reduced after the application of biochar in the PS and NS. These two hydrolases were positively associated with the accumulative release of CO2-C, and hydrolase was the most vital direct factor influencing the accumulative release of CO2-C from the PS and NS soils. The positive effect of DOM addition on CO2 emission under biochar application declined with a vegetation restoration age increase. Our results indicated that biochar could alter microbial physiological processes, inhibit qCO2 and hydrolase activities, and further decrease CO2 emission in relatively fertile soil from the PS and NS; but in the relatively barren soil from the DS, biochar might promote CO2 emission by stimulating microorganisms to enhance qCO2 and oxidase activities.

1. Introduction

Soil, as the second biggest carbon (C) store in Earth’s ecosystems, is crucial for maintaining global carbon balance [1] and climate change mitigation [2]. Recently, vegetation restoration has been expanding widely on a global scale [3], which has promoted C storage in soil from degraded land in the scenario of climate change [4]. Biochar (BC), a product made through the pyrolysis of biological mass in an anaerobic environment [5], is used as a good method of soil amelioration to boost soil fertility, raise carbon accumulation, and lower CO2 emissions [6,7,8]. While previous observations have focused on farming soil [9,10,11], fewer studies have paid attention to exploring how soil C sequestration varies after the application of biochar in forest soil, especially in the reforestation of degraded land. Owing to the ameliorative effect of biochar, understanding the response of forest soil C variation to biochar during revegetation is imperative for managing degraded ecosystems and decreasing soil C emission.
Previous studies on how applying biochar to forest soils affects the release of CO2 have revealed inconsistent results [12,13]. A recent study suggested that biochar addition reduced soil respiration by decreasing microbial activity in subtropical forests [14]. Meanwhile, Zhou et al. [12] indicated that biochar addition raised soil C mineralization by 20.3% in temperate forests, but it had a negligible impact on subtropical forests. The difference in CO2 emission after biochar addition may be correlated with soil properties (e.g., soil organic carbon content [15], pH [16], etc.) and the dosage of biochar [17]. For example, some findings have shown that adding biochar to soils with high rates of organic matter raises soil C mineralization [15,18]. However, according to some other results, in soils with low rates of organic matter, biochar has little impact on soil C mineralization [19,20]. Previous studies have also reported that the dose of biochar addition may affect soil CO2 emission. The majority of studies suggest that a low dose of biochar (<2%) addition inhibits soil C decomposition [21] and thus promotes soil C accumulation, while a high dose of biochar addition promotes a positive excitation effect of soil C [17,22]. Meanwhile, plant-derived carbon (e.g., dissolved organic carbon, etc.) in the ecosystem also affects the interaction of BC and soil C [23,24]. Wang et al. [24] showed that glucose addition could lead to a higher net accumulation of soil carbon under the condition of biochar addition. Therefore, exploring the function of C derived from plants in the process of biochar’s effect on soil CO2 emission might contribute to further biochar application in the technology of soil C preservation in restoration ecosystems.
Many studies have revealed that biochar application could alter the composition or function of microbial communities [25,26]. In some studies, biochar was shown to either enhance or inhibit microbial biomass [27,28], as well as an abundance of bacteria and fungi [29,30]. Wu et al. [31] discovered that dehydrogenase activities have little variation after applying biochar. It was reported that biochar addition increased soil dehydrogenase and catalase activities [32]. Microorganisms are a vital factor that affects soil C transformation. Firstly, differences in the carbon efficiency of substrate utilization by microorganisms after applying biochar might result in soil C stocking or loss [33,34]. A study revealed that microbes generated more microbial synthetic products per unit of carbon after applying biochar and less CO2 emission, which promoted soil C sequestration [35]. Secondly, soil microbial enzymes play a vital role in the carbon cycle for the transformation and mineralization of soil organic substances, and biochar addition might affect soil CO2 emission by influencing the strategies of microbial communities to secrete soil enzymes [36]. For example, β-glucosidase is responsible for the degradation of cellulose and labile carbon in soil [37], while phenol oxidase and peroxidase facilitate the degradation of soil organic substances (e.g., phenolic compounds, recalcitrant carbon, etc.), and phenol oxidase activity is the limiting step for the complete decomposition of litter or humus [36,38,39]. Different responses of oxidase and hydrolase enzymes to biochar addition may stimulate or inhibit C mineralization [36,39].
Under the scenario of intensive forest management and global climate change, applying biochar to forest ecosystems could be essential for vegetation restoration forests to improve productivity and increase the potential of soil carbon sequestration [30]. However, there is limited information about how adding biochar affects CO2 emission and its related microbial processes among vegetation restoration stages. Therefore, we conducted an incubation experiment, relying on soil in three vegetation restoration stages, with four biochar addition levels and two DOM addition rates, in order to explore the effect of revegetation, biochar, DOM, and their interaction on soil CO2 emission, microbial biomass carbon, pH, enzyme activities, and qCO2. The main hypotheses are as follows: (1) Due to the difference in soil carbon content in the three vegetation restoration stages, the inhibited effect of the accumulative release of CO2-C after applying biochar might gradually decline with incremental increases in the age of vegetation restoration. (2) Extra carbon addition may stimulate microbial activity, and DOM addition might weaken the inhibited effect of the accumulative release of CO2-C after applying biochar with vegetation a restoration age increase.

2. Materials and Methods

2.1. Soil Collection and Preparation

We collected soil samples from Changting County’s vegetation restoration region (116°18′–116°31′ E, 25°33′–25°48′ N), which lies in Fujian province in southern China. The climate in this region is typically subtropical monsoonal, with 1730 mm of precipitation on average per year, and a temperature of 18.3 °C on average per year. The soil is red soil, classified as Ferralsol according to the World Reference Base soil classification system [40]. Vegetation degradation in this area was quite severe in the mid-20th century, and vegetation restoration projects were widely implemented in this area in the 1970s [3].
Soils were collected along a revegetation gradient (DS: degraded land, PS: plantation forest, and NS: secondary natural forest). Soils from the DS were gathered from a small degraded vegetation region. The degraded region was retained for scientific and educational objectives. The DS suffers from water and soil erosion and has features such as rare vegetation and broken topography. The PS was restored in 1998, and the dominant tree species is Pinus massoniana Lamb. The age of the NS (protected by local farmers and monks as a “fengshui” site) is more than 70 years old, and the dominant species are Schima superba, Liquidambar formosana, Syzygium grijsii, and Ilex pubescens. A detailed description of the study site was given by Fang et al. [41].
At each revegetation stage, we selected three 100 m−2 plots randomly, and ensured all sites’ slopes and topographies were similar. Soils were collected from five subplots at 0–10 cm depths within each sampling plot in April 2017. All samples were passed through a 2 mm sieve to exclude visible stones and plant residues. Each sample, after sifting, was separated into two fractions. The first fraction was used to measure soil properties (Table 1), and the second fraction was air-dried or preserved at 4 °C for a subsequent incubation experiment.
Leaf litter of Pinus massoniana collected from the PS was used for DOM extrication. The oven-dried leaf litter was extracted for 48 h with a leaf/water ratio of 1:10. After that, a filter membrane (0.45 um) was utilized to filter the supernatant solution. The collected solution was stored at 4 °C. The DOC content of the extracts was 3.5 mg mL−1. The BC utilized in our study was prepared by high-temperature rapid pyrolysis of maize straw at a temperature of 650 °C in an anaerobic environment for 5 min. Ater that, the BC was sieved through 2 mm sieve and dried. The basic properties of the biochar were pH: 9.87, total nitrogen: 1.32 g/kg, specific surface area: 15.62 m2/g, DOC: 550.1 mg/kg, and organic carbon: 516.3 g/kg.

2.2. Incubation Experiment

The incubation experiment was designed with a nested factorial design with three different factors, including (1) the vegetation restoration stage with three levels (DS, PS, and NS), (2) DOM addition with two levels (addition of 3.5 mg or none), and (3) the biochar rate with four levels (CK: 0, LB: 1%, MB: 2.5%, and HB: 5%). This produced 24 treatment configurations, each with three duplicates. The soil, after preparation (70 g dry weight), was mixed with BC at the same rate as mentioned above, added into a 250 mL Erlenmeyer flask, and maintained a 60% water-holding capacity. A seal with small holes was placed on each flask to reduce water evaporation and maintain gas exchange. We pre-incubated all treatment samples at 25 °C in an incubator for 7 days. The DOM solution was then injected into the corresponding treatment as mentioned above. Water was injected into the incubation flasks to maintain the 60% water holding capacity every 4–5 days using a weighing method. An air compressor was used to inject a certain amount of fresh air into the incubators to avoid forming an anaerobic environment [42].

2.3. Gas Sample Collection and Measurement

The respired CO2 was sampled 1, 2, 3, 5, 7, 10, 13, 16, 20, 25, 30, 40, 50, and 60 days after the pre-incubation. Gas sample collection was conducted using the static chamber method. Before the gas collection, fresh air was used for flushing and standardizing the initial CO2 concentration of each flask. Then, the flask was sealed by a cap with a three-way valve. Closing the three-way valve, 40 mL of gas was collected from the flasks’ headspace into an aluminum foil bag to determine the initial CO2 concentration. After closing the three-way valve for 0.5 h, gas sample collection was repeated according to the abovementioned method. All gas samples were examined by gas chromatography (7890B, Agilent, CA, USA) within one day. According to Fang et al. [41], the CO2 flux (F) was estimated by the following equation:
F = Vfs/Ms × Cm/22.4 × Δct × 273/(273 + T)
where Vfs represents the volume of difference between the incubation flask and the soil, Ms is the weight of dry soil, Cm is the molar mass of C, Δct represents the mean difference in CO2 concentrations for each hour, and T is the incubation temperature. The molar volume of CO2 was dependent on the ideal gas law.
The accumulative release of CO2-C (Cc) was determined by following equation:
Cc = Cc−1 + (Ft + Ft−1)/2 × (D − D−1)
where F, t, and D represent the CO2 emission rate per day, CO2 collection period, and incubation day.

2.4. Soil Properties and Enzyme Analyses

At the end of incubation, each sample, after sifting (2 mm sieve), was separated into two sub-samples; one sub-sample was used for the determination of soil pH, nitrate nitrogen (NO3-N), and ammonium nitrogen (NH4+-N), and the other sub-sample was preserved at 4 °C for the examination of enzyme activities, microbial biomass carbon (MBC), and dissolved organic carbon (DOC).
Soil pH was examined with a ratio of soil to water volume of 1:2.5. Soil NO3-N, and NH4+-N content was examined using a 1 M KCl solution-leaching–spectrophotometric method [43]. The organic carbon content of the extracts was analyzed by a TOC analyzer (Shimadzu Corp., Kyoto, Japan). The difference in extracted carbon within fumigated and non-fumigated soils leached with potassium sulfate was used for calculating the MBC. Then, the non-fumigated samples’ extractable C was regarded as the DOC. The accumulative release of CO2-C was divided by the corresponding MBC to obtain the metabolic quotient (qCO2).
Soil enzymes, including β-glucosidase (BG), N-acetylglucosaminidase (NAG), polyphenol oxidase (PhOx), and peroxidase (Perox), which are involved in soil carbon acquisition, were analyzed. The determination of BG and NAG activities was carried out according to Tabatabai [44]. For the BG assay, a mixture of 1 g fresh soil, 1 mL of 0.025 M p-nitrophenyl-b-D-glucopyranoside, and 4 mL of amended common buffer (pH 6.0) was incubated in a constant-temperature shaker for one hour at 37 °C. Then, adding 0.1 M trihydroxymethyl aminomethane (pH 12.0) and 0.5 M CaCl2 brought the reactions to an end. After the reactions were stopped, p-nitrophenyl-b-D-glucopyranoside from the control group was added. The reaction products were filtered and then calorimetrically determined at 400 nm [44]. The method of NAG measurement was similar to that of BG, but the substrate was p-nitrophenyl-Nacetyl-b-D-glucosaminidine and the pH of the incubation system was 5.5. For PhOx activity, a mixture of 1 g fresh soil, 4.5 mL of 0.01 M L-3, 4-dihydroxy phenylalanine, and 4.5 mL amended common buffer (pH 5.0) was incubated in a constant-temperature shaker for one hour at 25 °C. The reactions were stopped by centrifuging the mixture at 12,000× g and 5 °C for 5 min. According to Fang et al. [45], the final products were filtered and then, at 450 nm, colorimetrically detected. Perox activity measurement was similar to that of PhOx, but before incubation, 0.3% H2O2 (1 mL) was added to the solution.

2.5. Statistical Analysis

Comparisons of soil properties in three stages of revegetation were performed using one-way ANOVA. The impacts of vegetation restoration, BC, DOM, and their interaction on the accumulative release of CO2-C, pH, NH4+-N, MBC, NO3-N, DOC, qCO2, and enzyme activities were determined using three-way ANOVA. The effects of BC, DOM, and their interaction on the accumulative release of CO2-C, pH, NH4+-N, MBC, NO3-N, DOC, qCO2, and enzyme activities in each vegetation restoration stage were explored using two-way ANOVA. In the conditions of each revegetation stage, the averages of the individual treatments at each DOM addition level were compared utilizing Duncan’s Multiple comparisons test. Pearson correlation was performed to examine the associations between the accumulative release of CO2-C emission, soil properties, and enzyme activities. All of these statistical analyses were conducted using SAS 9.2 (SAS Institute Inc., Cary, NC, USA). Statistical significance was determined at p < 0.05.
Structural Equation Modeling (SEM) was conducted to estimate the hypothesized direct or indirect impacts of pH, NH4+-N, MBC, NO3-N, DOC, qCO2, and enzyme activities on the accumulative release of soil CO2-C in three different vegetation restoration stages. For a good model fit, the χ2 test statistic should be insignificant (p > 0.05), RMSEA should be < 0.05, and both GFI and AGIF should be > 0.90 [46]. The lowest AICs of all the acceptable models were selected for the final models in our study. AMOS (Version 18.0; Amos Development, Syracuse, NY, USA) software was applied to perform SEM analysis. Oxidase (a composite variable containing polyphenol oxidase and peroxidase) and hydrolase (a composite variable containing β-glucosidase and N-acetylglucosaminidase) were treated as latent variables.

3. Results

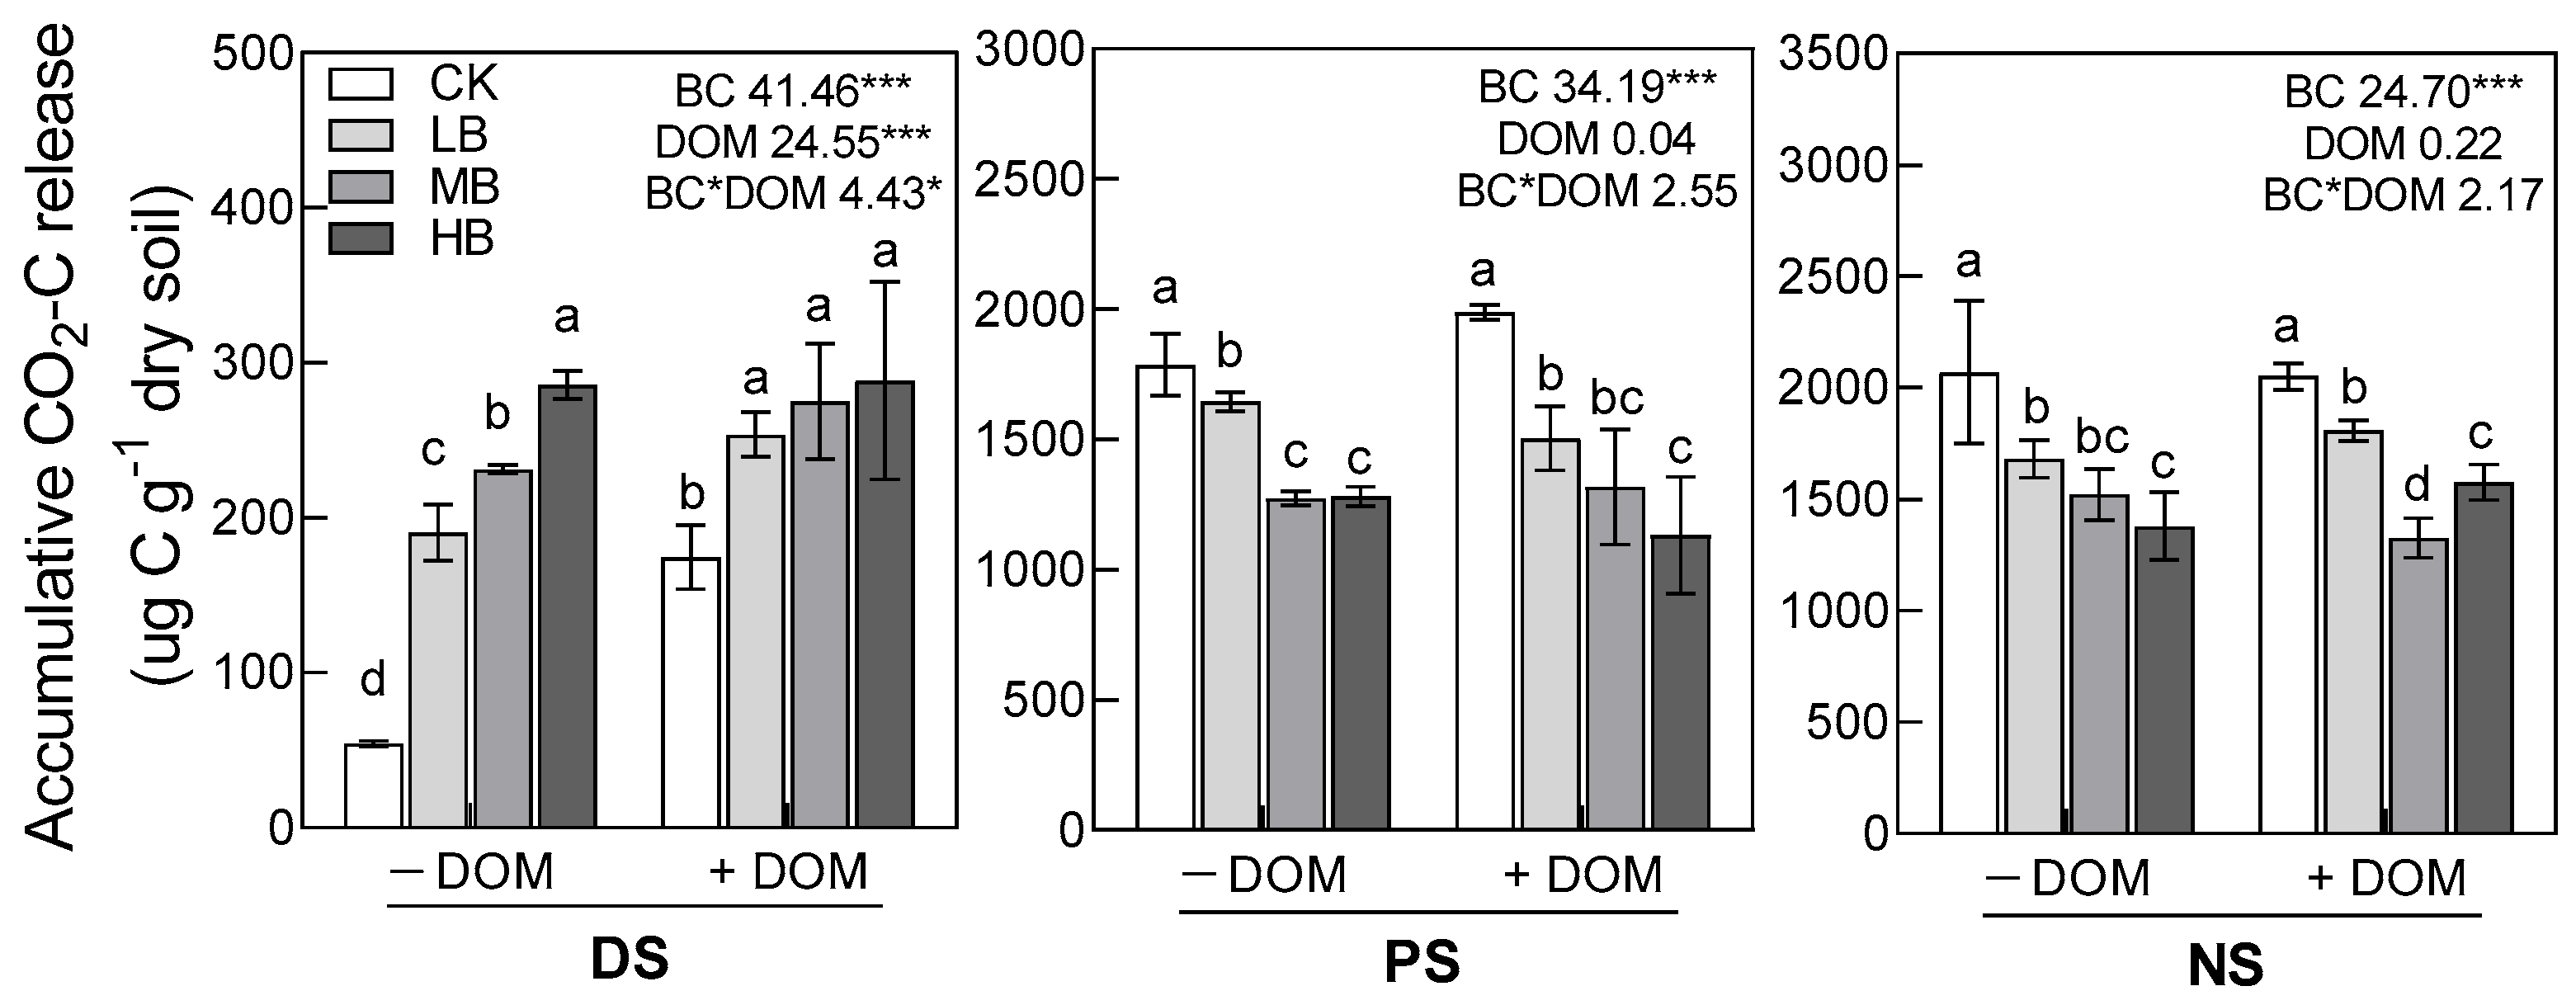
3.1. Soil CO2 Emission

Overall, the accumulative release of CO2-C was significantly influenced by vegetation restoration, biochar, and their interaction, but not influenced by DOM addition (Table 2). The accumulative release of CO2-C in the NS (1676.4 µg CO2-C g−1 dry soil) and PS (1491.0 µg CO2-C g−1 dry soil) were significantly higher compared to that in the DS (219.2 µg CO2-C g−1 dry soil). Biochar addition decreased (p < 0.001) the accumulative release of CO2-C in the NS and PS, but increased (p < 0.001) the accumulative release of CO2-C in the DS (Figure 1). DOM addition had no significant impact on CO2-C emission in the NS and PS, but enhanced the release of CO2-C in the DS. Moreover, both BC and DOM addition increased (p < 0.01) accumulative CO2-C emission in the NS and PS at the early stage (0–7 day) of incubation, but at the late stage (30–60 day) of incubation, DOM addition decreased (p < 0.01) CO2-C emission in the DS (Figure S1).

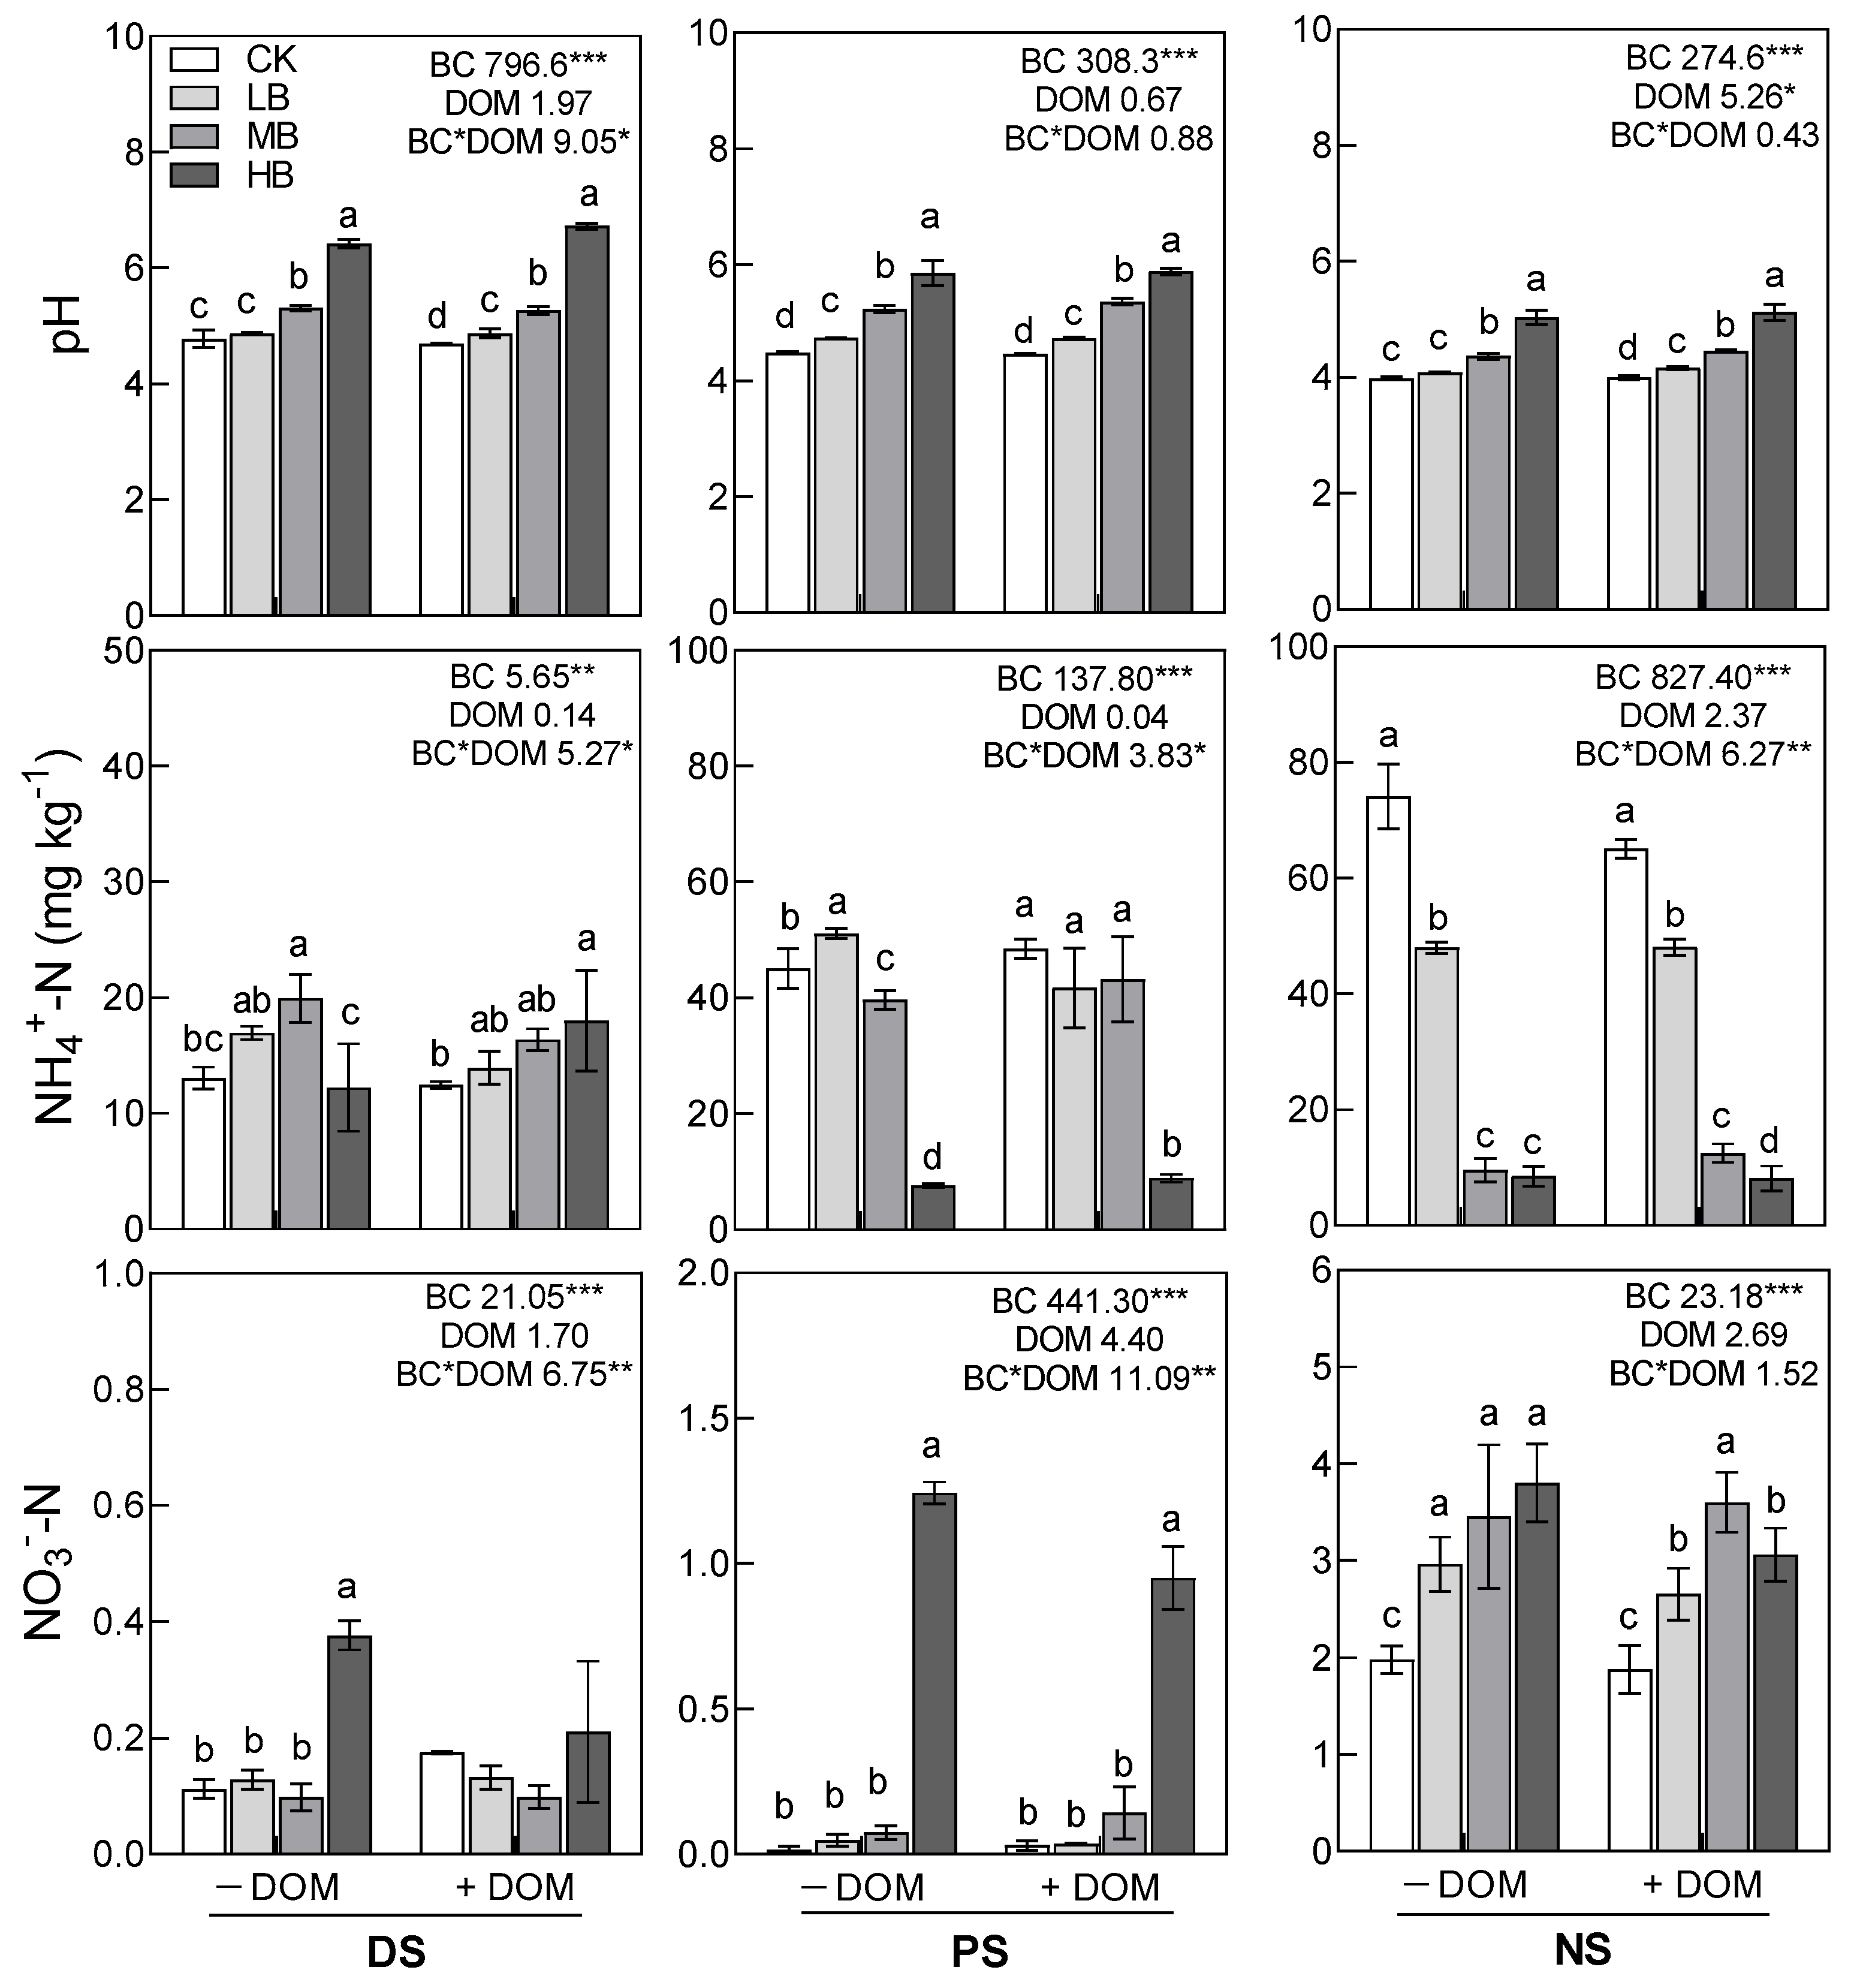
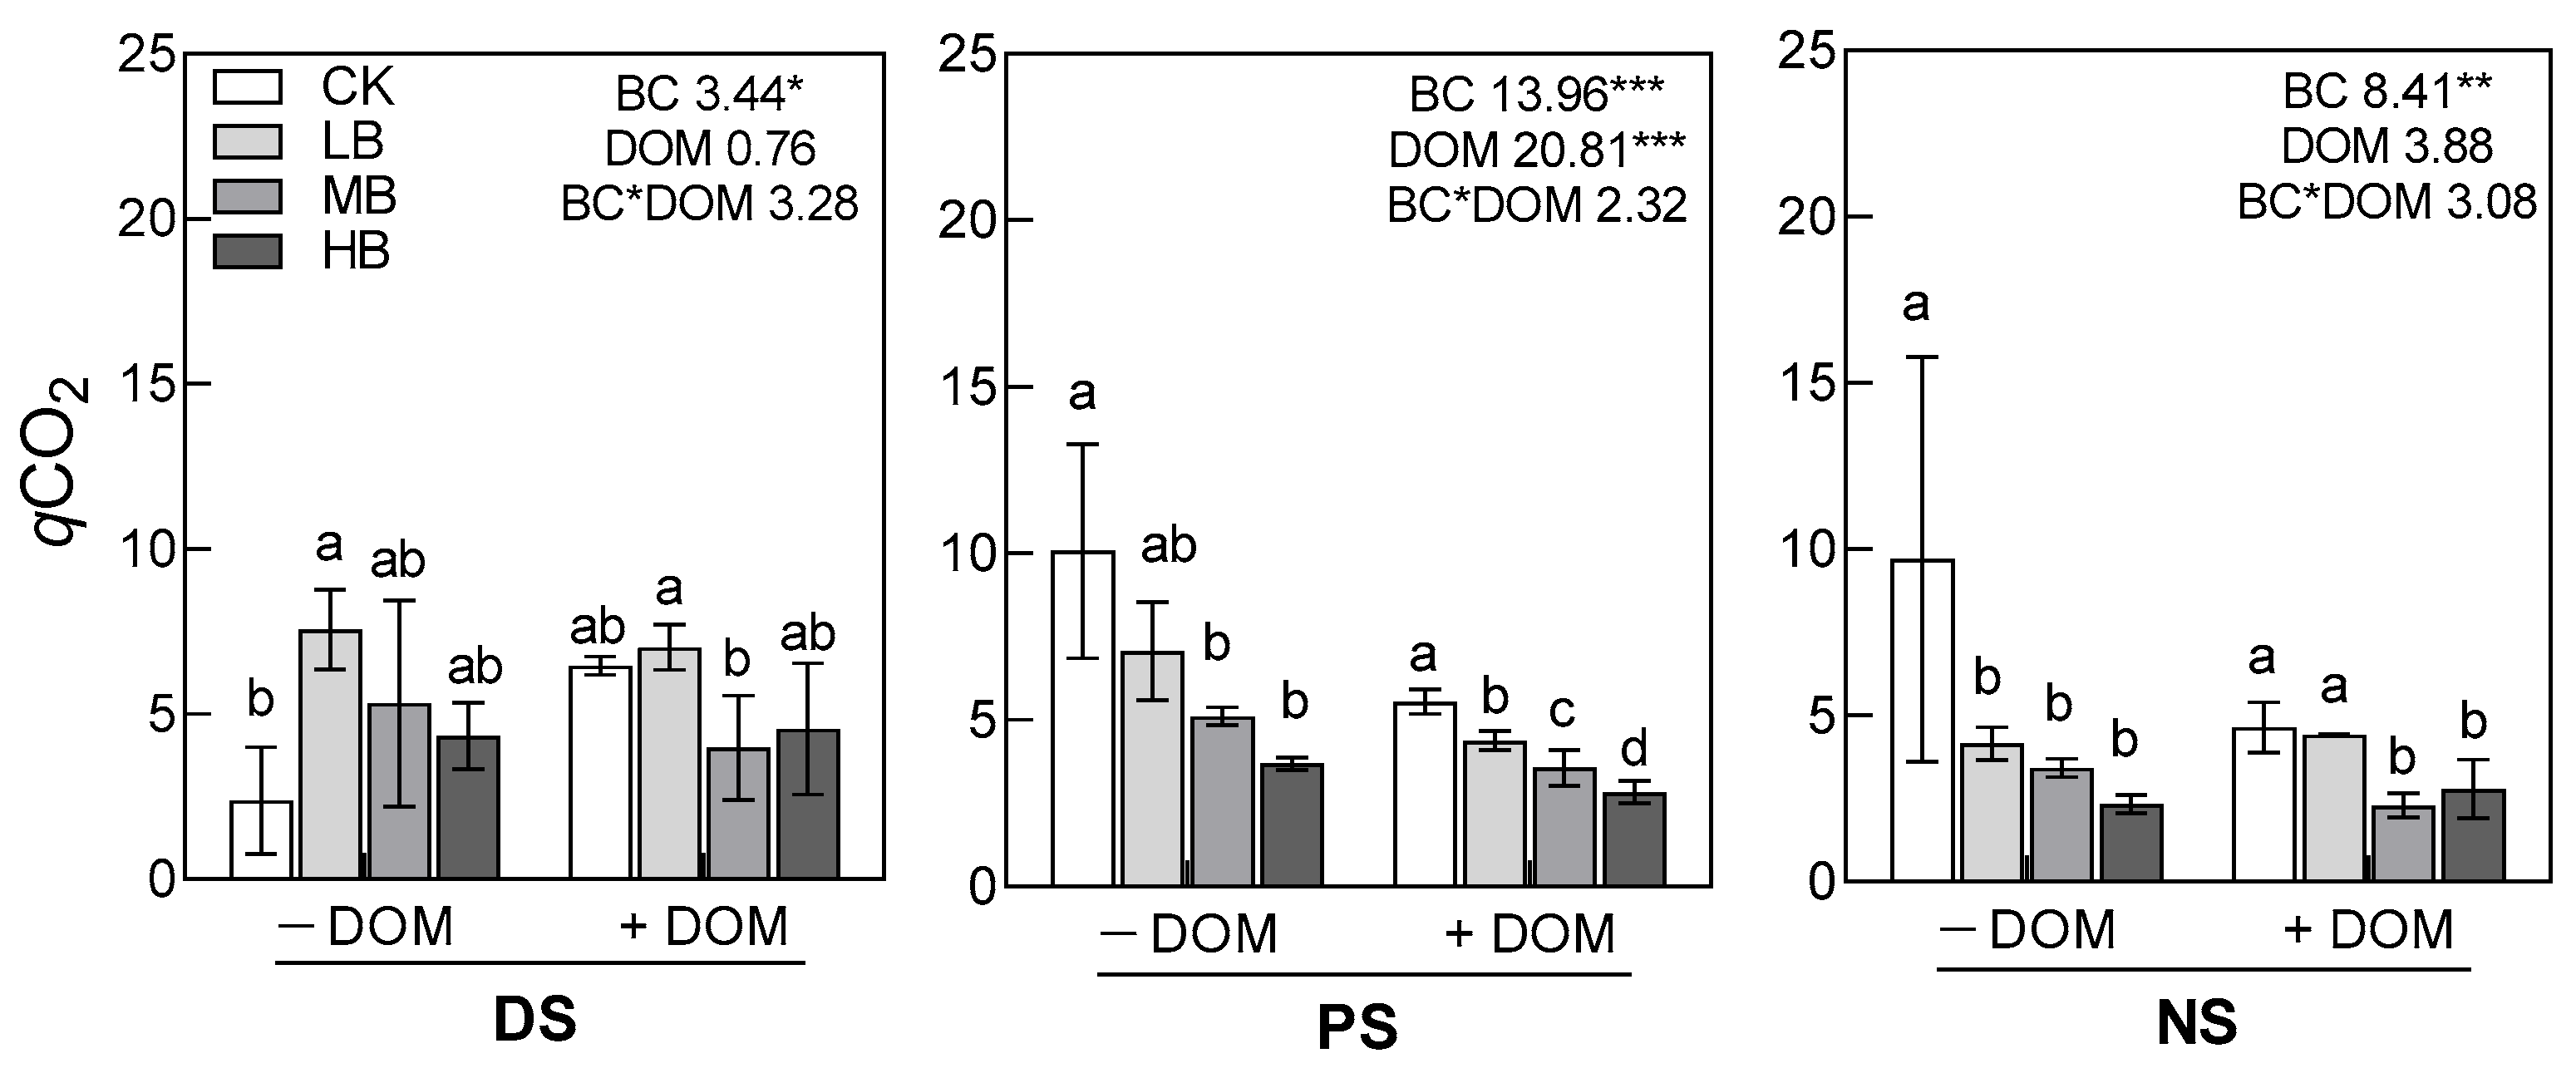
3.2. Soil pH, Available Nitrogen, MBC, DOC, and qCO2

After 60 days of incubation, soil NO3-N and NH4+-N contents and pH were significantly influenced by vegetation restoration, biochar, and their interaction, but not influenced by DOM addition (Table 2). In all soils along the vegetation restoration gradient, BC addition enhanced (p < 0.001) soil pH and NO3-N content (Figure 2). But BC addition reduced (p < 0.001) soil NH4+-N content in the PS and NS, and increased (p < 0.001) NH4+-N content from the DS soil.
The soil MBC and DOC contents increased (p < 0.001) with incremental increases in the age of vegetation restoration (Figure 3, Table 2). BC addition increased (p < 0.01) the MBC content but decreased (p < 0.001) the DOC content in all soils in the three stages of vegetation restoration. DOM addition increased (p < 0.05) the MBC content in the PS and NS soils and increased (p < 0.01) the DOC content in all soils in the three stages of vegetation restoration. In the PS and NS, both BC and DOM addition decreased (p < 0.01) qCO2 (Figure 4, Table 2). But in the DS, BC addition slightly enhanced (p < 0.05) qCO2, and DOM addition did not affect qCO2.

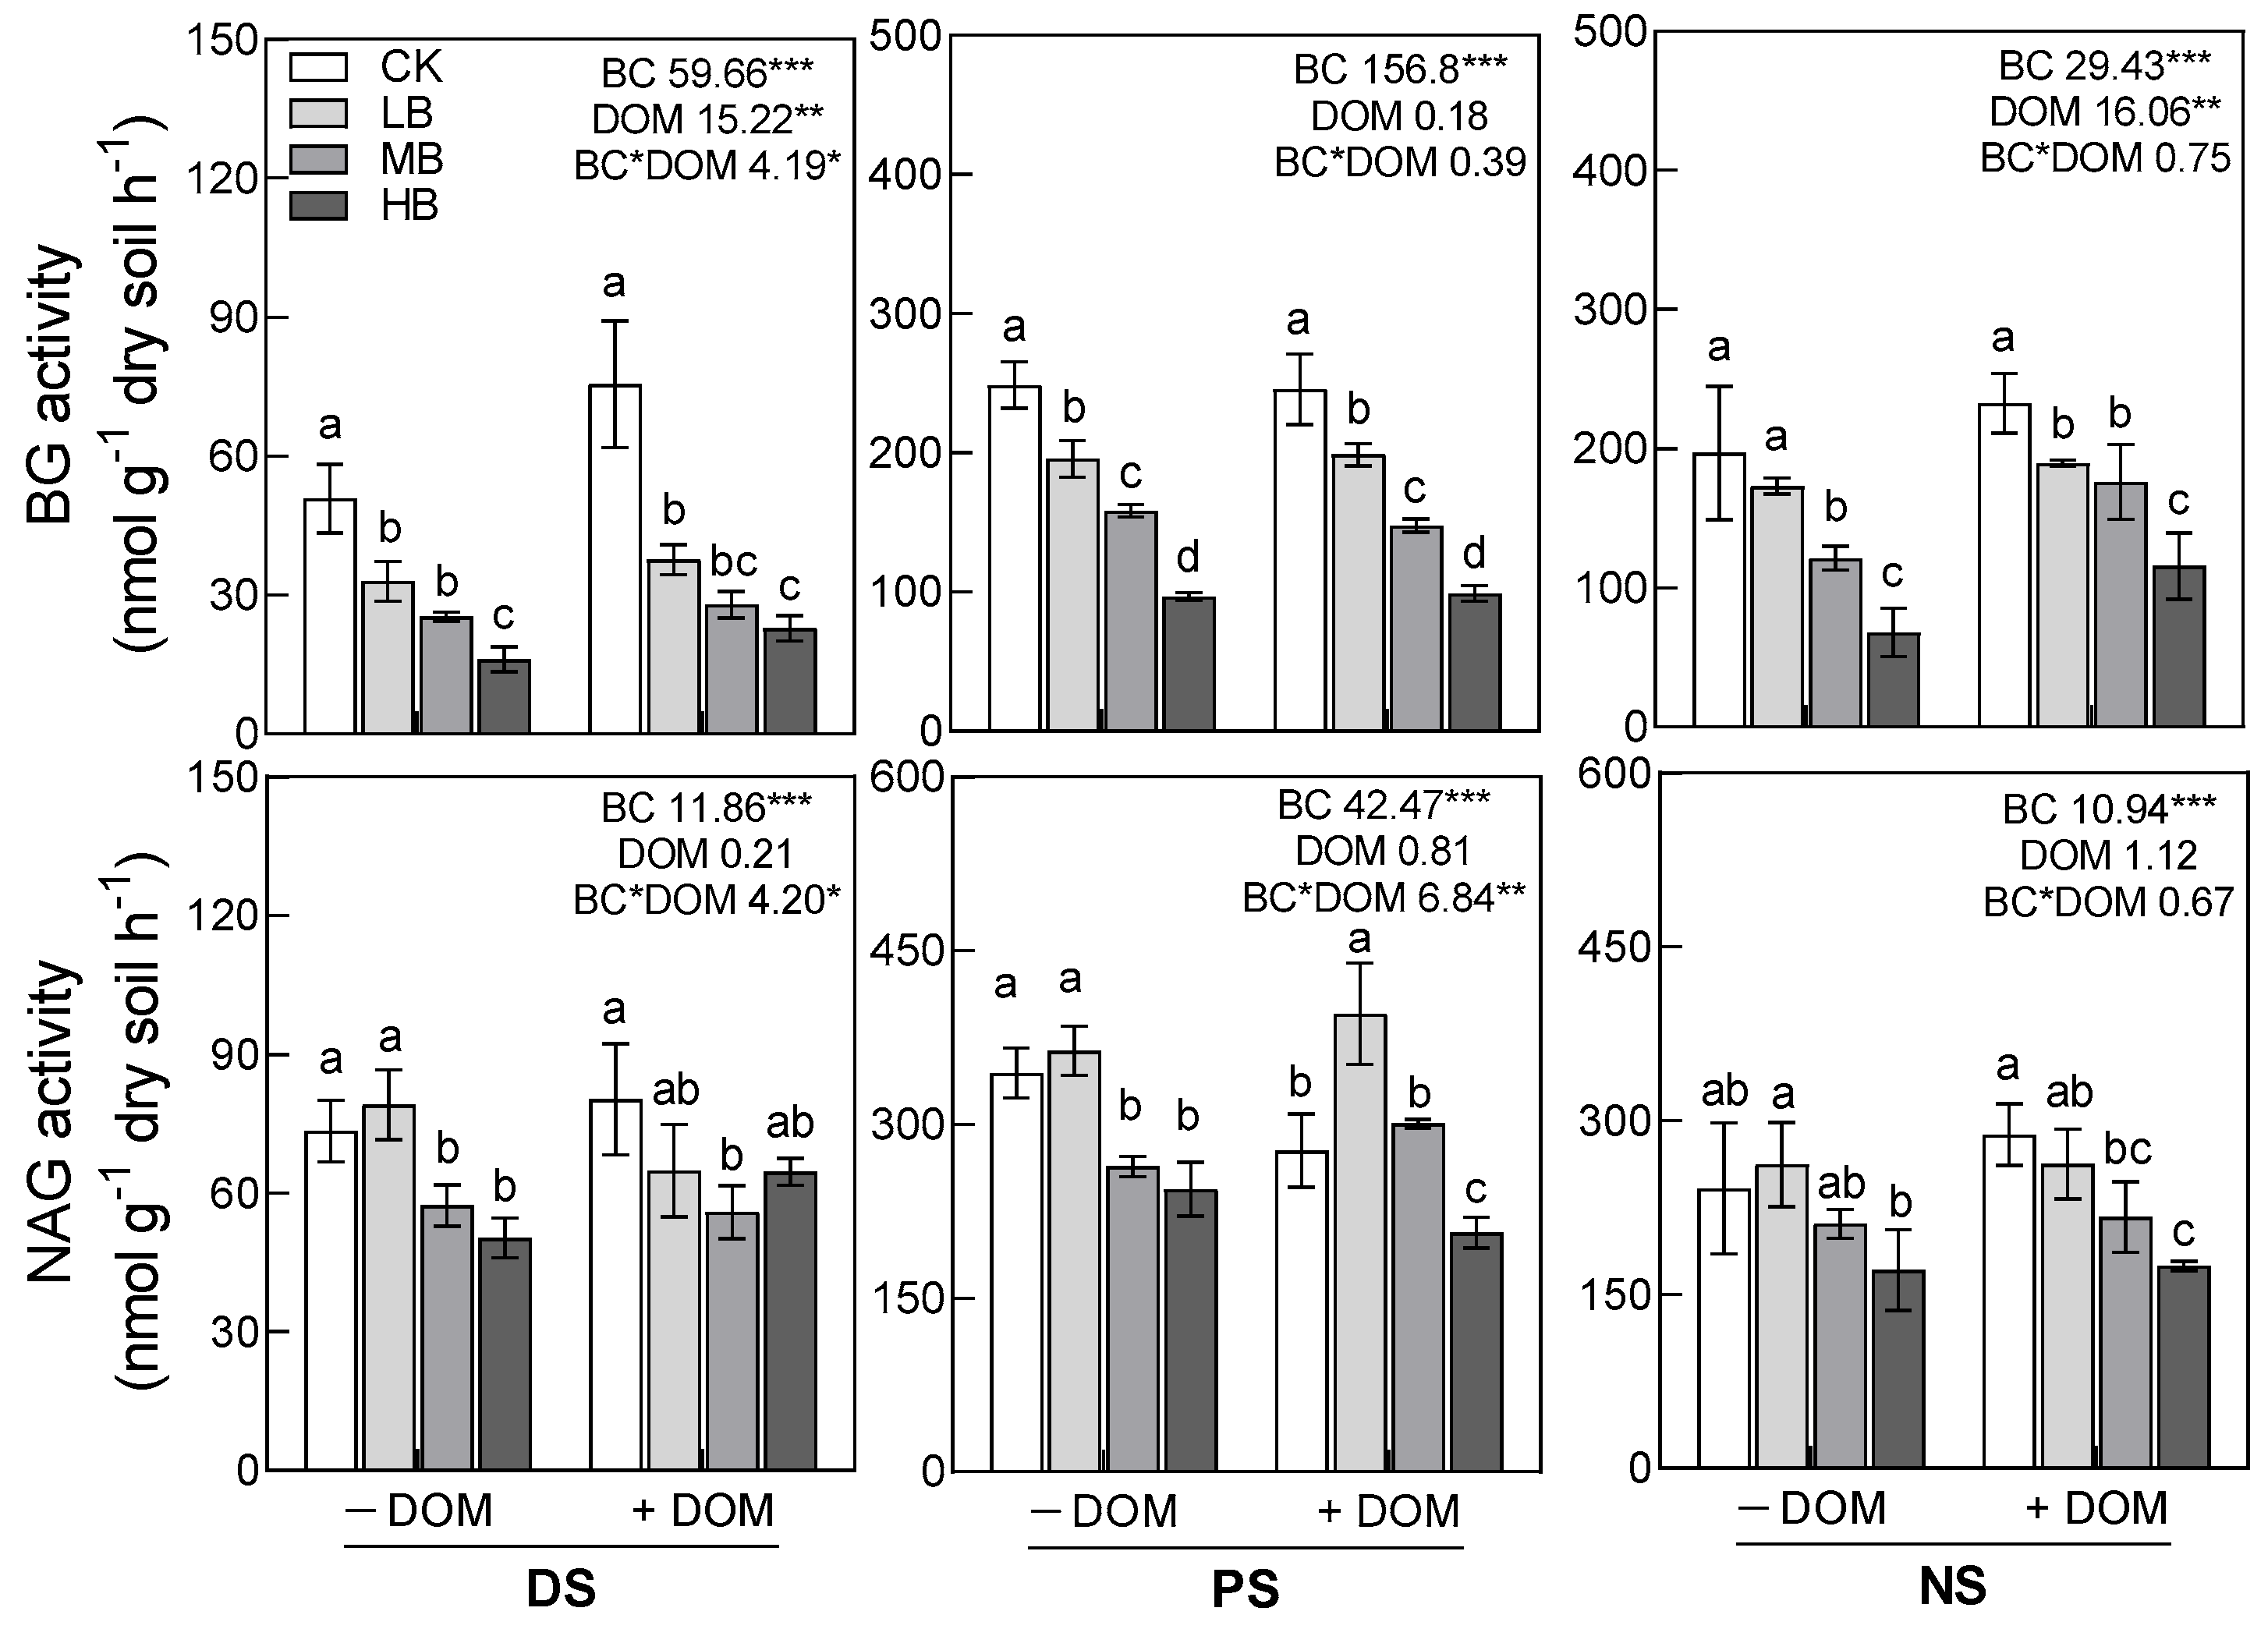
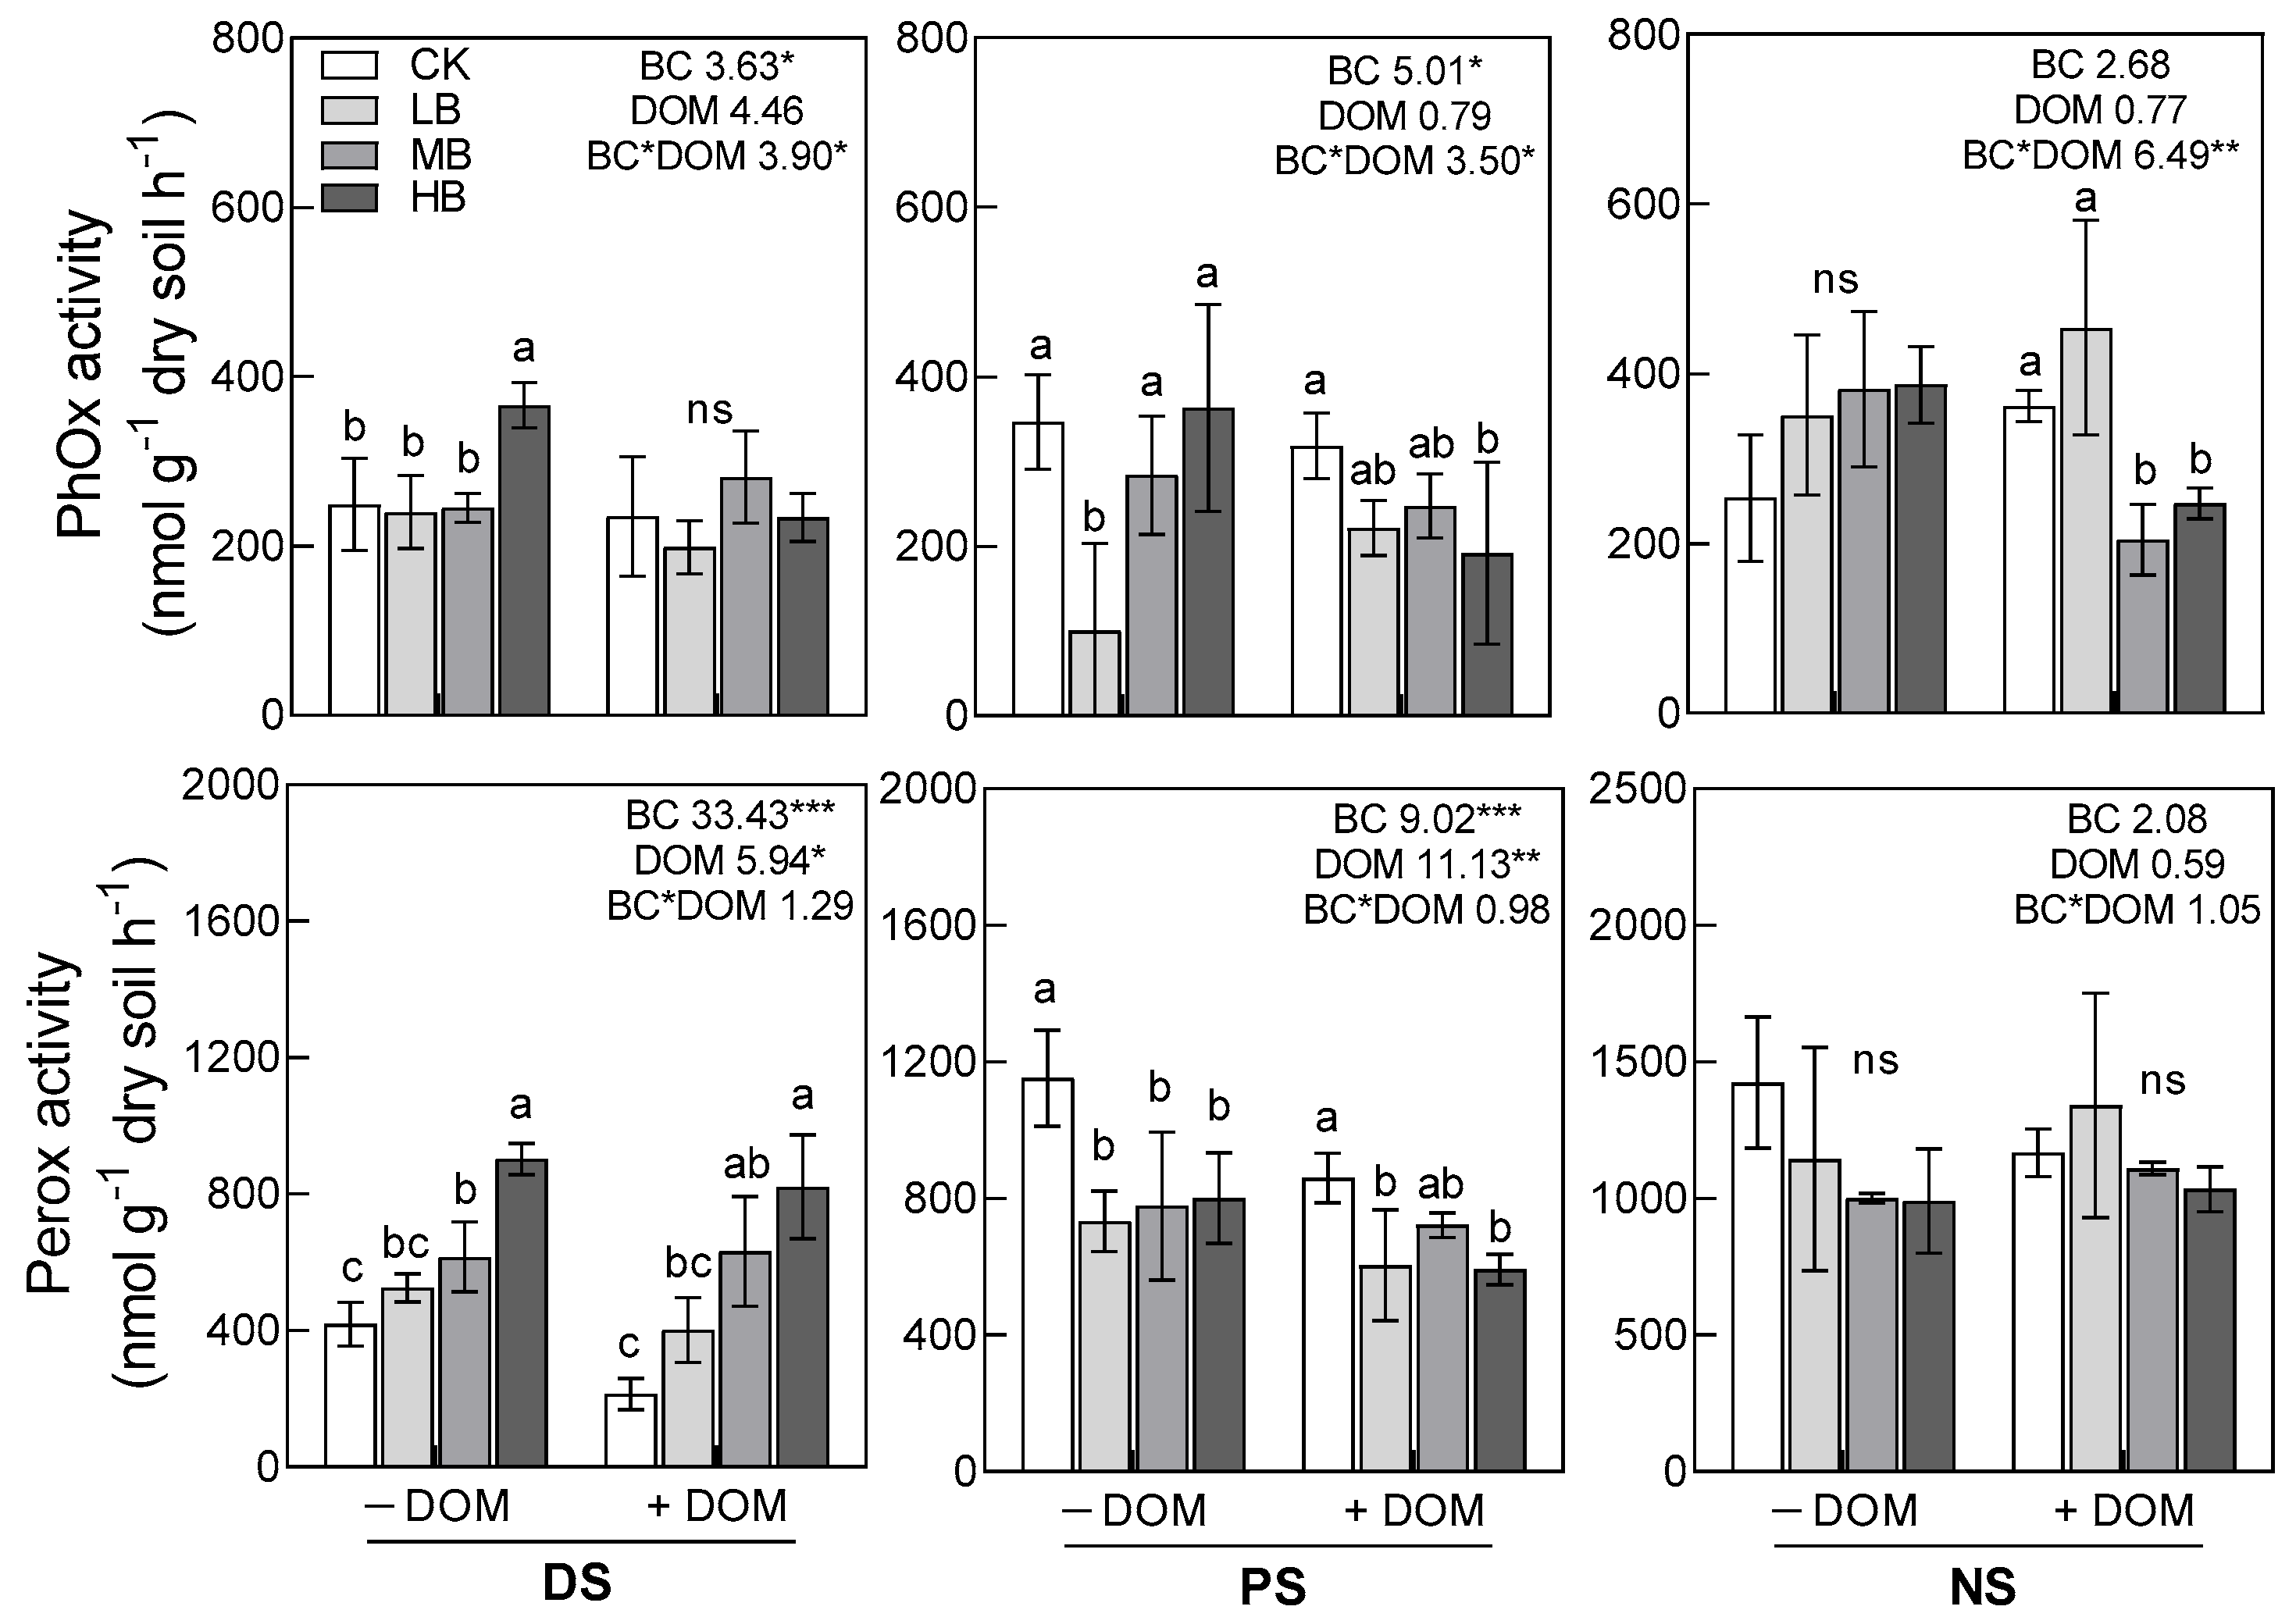
3.3. Soil Enzyme Activities

Overall, vegetation restoration had a significant influence on soil enzyme activities and BC addition only affected (p < 0.001) soil β-glucosidase and N-acetylglucosaminidase activities, but the interaction of vegetation restoration and BC addition had a significant impact on four kinds of soil enzyme activities (Table 1). In detail, in all soils along the vegetation restoration gradient, soil β-glucosidase and N-acetylglucosaminidase activities decreased (p < 0.001) with increasing amounts of BC addition (Figure 5). In the PS, BC addition also decreased phenol oxidase (p < 0.05) and peroxidase (p < 0.001). Although BC addition did not affect oxidase in the NS, these two oxidase activities tended to decrease with the quantity of BC addition (Figure 6). However, in the DS, BC addition increased phenol oxidase (p < 0.05) and peroxidase (p < 0.001). Meanwhile, DOM addition increased (p < 0.01) β-glucosidase activities in the NS and DS soils, and decreased (p < 0.05) peroxidase in the PS and DS soils.

3.4. Main Factors Influencing Changes in Soil CO2-C Emission

In the DS, the accumulative release of CO2-C was positively correlated with pH, MBC content, and peroxidase activities (p < 0.01), and negatively correlated with β-glucosidase activities (p < 0.01, Table 3). However, in the PS and NS, the accumulative release of CO2-C was negatively correlated with pH, MBC content, and NO3-N (p < 0.05), and positively correlated with NH4+-N, DOC, β-glucosidase, N-acetylglucosaminidase, and peroxidase activities (p < 0.01).
We used SEM to explore the relative importance and indirect or direct impacts of soil chemical properties, MBC, and enzyme activities on the accumulative release of CO2-C along the vegetation restoration gradient (Figure 7). Our models displayed an explanation of 49% to 76% of the variation in the accumulative release of CO2-C along the vegetation restoration gradient. Overall, BC addition influenced the accumulative release of CO2-C mainly through soil pH and enzyme activities. In the DS, soil oxidase was the most vital direct factor to influence the accumulative release of CO2-C, accounting for 68.3% of the variation. But in the PS and NS, soil hydrolase was the most vital direct factor influencing the accumulative release of CO2-C, accounting for 72.5% to 82.8% of the variation.

4. Discussion

Previous studies reported that SOC [4], MBC content [47], and microbial diversity [48] increased with vegetation restoration age increase, which further increased soil CO2 emission [49]. The accumulative release of CO2-C in the NS and the PS was significantly higher in comparison to that in the DS soil in our study (Figure 1, Table 2), which was similar to Zhang et al. [47], who indicated that SOC mineralization was increased six-fold following cropland-to-forest conversion. Changes in soil properties and microbes were significant causes of these results. In general, increased soil nutrition [47], SOC content, and microorganisms [48] could promote CO2 emission [30]. We also found that soil AP, TN, SOC content, DOC content, and MBC content in the NS and PS were indeed higher compared to those in the DS soil (Table 1).
Many studies have indicated that biochar enhances CO2 emission in soil with high rates of organic matter [18,19]. However, we found a different result, determining that biochar addition significantly decreased the accumulative release of CO2-C in the NS and PS (Figure 1). One reason was that biochar affected microbial carbon metabolism via its adsorptive protection [15,50]. Biochar, due to its strong ability for adsorption and large specific surface area, provides microhabitats [51]. Nutrients, DOC, and microbes co-localize on the biochar surface, thus forming higher microbial biomass, but decreasing qCO2 [35]. Another possible reason was that changes in soil enzyme activities may affect CO2 emission after applying biochar [36]. We discovered that β-glucosidase and N-acetylglucosaminidase activities in the PS and NS soils decreased with an increase in BC addition amount (Figure 5). The positive relationship results (between the accumulative release of CO2 and two hydrolases) and SEM results indicated that the decrease in the accumulative release of CO2-C in the PS and NS was partly attributed to the decreased hydrolases. Thus, the inhibited effect of biochar on the release of CO2 from the PS and NS soil might be due to the fact that BC addition can change the living environment of microorganisms through its adsorptive protection, further changing microbial physiological processes, and decreasing qCO2 and β-glucosidase and N-acetylglucosaminidase activities.
Notably, we also observed that biochar addition significantly increased CO2-C emission in the NS and PS at the early stage (0–7 day) of incubation (Figure S1). Our finding was similar to those of some studies [52,53] which showed that rapid increases in soil carbon emission could be seen when labile substrates were added into the soil. Most studies have discovered that the mechanism involved is an “r-strategy” of microbial growth. Microorganisms are adapted and respond rapidly to the input of new carbon substrates, decomposing soil nutrients and available carbon sources, and in the process, co-metabolizing soil organic matter, which is hard to degrade [52,54,55]. The sufficient DOC content in the NS and PS in the early stage of our study and the labile carbon source that biochar brought up [56] could stimulate microbial activity, further increasing CO2 emission.
In our study, the accumulative release of CO2-C in the DS significantly increased with the increased biochar addition amount, which is inconsistent with hypothesis one, which states that the inhibited effect of the accumulative release of CO2-C after applying biochar might gradually decline with incremental increases in the age of vegetation restoration. Kimetu et al. [18] also found that extra organic matter added into highly degraded soil may enhance SOC mineralization. Owing to the lower soil organic compounds in the degraded land, biochar provided labile C and increased pH and nutrition [52], further stimulating the reproduction and activity of microorganisms [35,57]. Our finding that biochar addition significantly increased (Figure 2) soil pH, NH4+-N, MBC content, and NO3-N and slightly enhanced qCO2 in the DS soil (Figure 4) could support this result. In addition, oxidases degraded organic matter by using oxygen or hydrogen peroxide as an electron donor [36]. The increased oxidases resulted from improving soil aeration after adding biochar promoted the accumulative release of CO2-C in the soil from the DS (Figure 6 and Figure 7, Table 3), which was consistent with Ouyang et al. [36], who found that boosted soil enzyme activities promoted SOC mineralization after applying biochar. Therefore, biochar addition might change microbial physiological processes by providing an exogenous carbon source and nutrients in the DS, and increase qCO2 and oxidase and peroxidase activities, further enhancing soil CO2 emission.
It is reported that the existence of corn straw offsets the negative impact of soil C mineralization after applying biochar [23]. According to Wang et al. [24], extra glucose addition might promote a positive impact of BC on soil C sequestration. We observed that DOM addition did not affect the accumulative release of CO2-C from the PS and NS soils after applying biochar, but magnified the effect of BC addition on the accumulative release of CO2-C from the DS soil (Figure 1). This was because DOM addition brought an extra available carbon source (DOC) and alleviated carbon limitation for microbes in the substrate-limited soil from the DS. Major et al. [58] indicated that a consistent increase in soil CO2 emission after applying biochar was attributed to the fact that increased plant biomass after applying BC enhanced the contribution of plant-sourced C to the soil. In addition, our finding that DOM addition did not affect CO2 emission after biochar application in the NS and PS might result from the encapsulation of biochar and different soil properties. Keith et al. [59] shown that in the late stage, the reversal and stability of the positive impact of DOM addition on BC-C mineralization was caused by several factors; for example, the labile carbon derived from DOM was sorptive by biochar, and biochar might be entrapped within soil aggregations. In our study, microorganisms might not have been limited by soil C resources as a result of the sufficient SOC content in the soil of the PS and NS (Table 1), and the soil properties of the plantation forest and secondary natural forest differed to those of degraded land, so DOM might be co-encapsulated by biochar and soil aggregation, further having no effect on the accumulative release of CO2-C emission from the NS and PS soils after applying biochar. Thus, DOM addition might have enhanced the impact of BC on the accumulative release of CO2-C from the DS soil by increasing available carbon sources, but had no impact on that from the PS and NS soils.

5. Conclusions

In our study, the accumulative release of CO2-C gradually decreased with vegetation restoration age increase. Biochar addition promoted the accumulative release of CO2-C from the DS soil, but inhibited that from the NS and PS soils. DOM addition enhanced the positive effect of biochar addition on CO2 emission in the DS, but did not affect that in the PS and NS. Biochar addition promoted qCO2, phenol oxidase, and peroxidase activities in the DS, but inhibited qCO2, β-glucosidase, and N-acetylglucosaminidase activities in the PS and NS soils. Peroxidase activities were positively correlated with the accumulative release of CO2-C from the DS soil, while positive correlations could be seen between β-glucosidase and both N-acetylglucosaminidase and the accumulative release of CO2-C from the PS and NS soils. These results suggested that biochar application in forests should have a promotive effect on soil CO2 emission in degraded land, and highlight that full consideration should be given to the comprehensive impact that biochar addition has on soil carbon dynamics by altering soil aeration and pH and affecting microbial community composition, plant root growth, and the interaction effect of biochar and roots on soil carbon sequestration and mineralization.

Supplementary Materials

The following supporting information can be downloaded at: https://www.mdpi.com/article/10.3390/f15050753/s1, Figure S1: Effects of biochar (BC) and dissolved organic matter (DOM) addition on cumulative CO2-C emission in soils of degraded vegetation (DS), a plantation (PS), and a secondary natural forest (NS) at three different incubation stages. Values are means ± SDs. Different superscript letters indicate significant differences among biochar treatments under the same DOM treatment level. F-values of the two-way ANOVA of BC, DOM, and their interaction (BC*DOM) are shown at each vegetation restoration stage. * p < 0.05, ** p < 0.01, *** p < 0.001.

Author Contributions

X.F. conceived and designed the experiment; Y.Z. and J.J. completed the experiment; Y.H. and X.T. analyzed the experimental data; Y.Z. wrote the paper. All authors have read and agreed to the published version of the manuscript.

Funding

This research was funded by the National Science Foundation of China (Grant Nos. 42267034), the 1000 Talents Plan award of Jiangxi province (jxsq2023101103), and the Key Science and Technology Research Project of Fujian Pine Forest Reconstruction and Upgrading Action (2021FKJ01).

Institutional Review Board Statement

Not applicable.

Informed Consent Statement

Not applicable.

Data Availability Statement

Data are contained within the article.

Conflicts of Interest

The authors declare no conflicts of interest.

References

  1. Bond-Lamberty, B.; Bailey, V.L.; Chen, M.; Gough, C.M.; Vargas, R. Globally rising soil heterotrophic respiration over recent decades. Nature 2018, 560, 80–83. [Google Scholar] [CrossRef]
  2. Stanturf, J.A.; Palik, B.J.; Dumroese, R.K. Contemporary forest restoration: A review emphasizing function. Forest Ecol. Manag. 2014, 331, 292–323. [Google Scholar] [CrossRef]
  3. Lu, F.; Hu, H.F.; Sun, W.J.; Zhu, J.J.; Liu, G.B.; Zhou, W.M.; Zhang, Q.F.; Shi, P.L.; Liu, X.P.; Wu, X.; et al. Effects of national ecological restoration projects on carbon sequestration in China from 2001 to 2010. Prac. Natl. Acad. Sci. USA 2018, 115, 4039–4044. [Google Scholar] [CrossRef]
  4. Pang, D.B.; Cui, M.; Liu, Y.G.; Wang, G.Z.; Cao, J.H.; Wang, X.R.; Dan, X.Q.; Zhou, J.X. Responses of soil labile organic carbon fractions and stocks to different vegetation restoration strategies in degraded karst ecosystems of southwest China. Ecol. Eng. 2019, 138, 391–402. [Google Scholar] [CrossRef]
  5. Jiang, X.Y.; Denef, K.; Stewart, C.E.; Cotrufo, M.F. Controls and dynamics of biochar decomposition and soil microbial abundance, composition, and carbon use efficiency during long-term biochar-amended soil incubations. Biol. Fert. Soils 2016, 52, 1–14. [Google Scholar] [CrossRef]
  6. Van Zwieten, L.; Kimber, S.; Morris, S.; Chan, K.Y.; Downie, A.; Rust, J.; Joseph, S.; Cowie, A. Effects of biochar from slow pyrolysis of papermill waste on agronomic performance and soil fertility. Plant Soil 2010, 327, 235–246. [Google Scholar] [CrossRef]
  7. Koide, R.T.; Nguyen, B.T.; Skinner, R.H.; Dell, C.J.; Peoples, M.S.; Adler, P.R.; Drohan, P.J. Biochar amendment of soil improves resilience to climate change. Glob. Change Biol. Bioenergy 2015, 7, 1084–1091. [Google Scholar] [CrossRef]
  8. Xiao, X.; Chen, B.L.; Chen, Z.M.; Zhu, L.Z.; Schnoor, J.L. Insight into multiple and multi-level structures of biochars and their potential environmental applications: A critical review. Environ. Sci. Technol. 2018, 52, 5027–5047. [Google Scholar] [CrossRef]
  9. Prayogo, C.; Jones, J.E.; Baeyens, J.; Bending, G.D. Impact of biochar on mineralisation of C and N from soil and willow litter and its relationship with microbial community biomass and structure. Biol. Fert. Soils 2014, 50, 695–702. [Google Scholar] [CrossRef]
  10. Zhang, K.L.; Chen, L.; Li, Y.; Brookes, P.C.; Xu, J.M.; Luo, Y. The effects of combinations of biochar, lime, and organic fertilizer on nitrification and nitrifiers. Biol. Fert. Soils 2017, 53, 77–87. [Google Scholar] [CrossRef]
  11. Zhang, X.; Zhang, Q.Q.; Zhan, L.P.; Xu, X.T.; Bi, R.Y.; Xiong, Z.Q. Biochar addition stabilized soil carbon sequestration by reducing temperature sensitivity of mineralization and altering the microbial community in a greenhouse vegetable field. J. Environ. Manag. 2022, 313, 114972. [Google Scholar] [CrossRef]
  12. Zhou, G.Y.; Zhou, X.H.; Zhang, T.; Du, Z.G.; He, Y.H.; Wang, X.H.; Shao, J.J.; Cao, Y.; Xue, S.G.; Wang, H.L.; et al. Biochar increased soil respiration in temperate forests but had no effects in subtropical forests. Forest Ecol. Manag. 2017, 405, 339–349. [Google Scholar] [CrossRef]
  13. Xu, L.; Fang, H.J.; Ying, J.Y.; Lv, J.W.; Shi, Y.J.; Zhou, G.M.; Zhou, Y.F. Biochar application increased ecosystem carbon sequestration capacity in a Moso bamboo forest. Forest Ecol. Manag. 2020, 475, 118447. [Google Scholar] [CrossRef]
  14. Li, Y.C.; Li, Y.F.; Chang, S.X.; Yang, Y.F.; Fu, S.L.; Jiang, P.K.; Luo, Y.; Yang, M.; Chen, Z.H.; Hu, S.D.; et al. Biochar reduces soil heterotrophic respiration in a subtropical plantation through increasing soil organic carbon recalcitrancy and decreasing carbon-degrading microbial activity. Soil Biol. Biochem. 2018, 122, 173–185. [Google Scholar] [CrossRef]
  15. Zimmerman, A.R.; Gao, B.; Ahn, M.Y. Positive and negative carbon mineralization priming effects among a variety of biochar-amended soils. Soil Biol. Biochem. 2011, 43, 1169–1179. [Google Scholar] [CrossRef]
  16. Sheng, Y.Q.; Zhan, Y.; Zhu, L.Z. Reduced carbon sequestration potential of biochar in acidic soil. Sci. Total Environ. 2016, 572, 129–137. [Google Scholar] [CrossRef]
  17. Wang, J.Y.; Xiong, Z.Q.; Kuzyakov, Y. Biochar stability in soil: Meta-analysis of decomposition and priming effects. Glob. Chang. Biol. Bioenergy 2016, 8, 512–523. [Google Scholar] [CrossRef]
  18. Kimetu, J.M.; Lehmann, J.; Kinyangi, J.; Cheng, C.; Thies, J.E.; Mugendi, D.N.; Pell, A.N. Soil organic C stabilization and thresholds in C saturation. Soil Biol. Biochem. 2009, 41, 2100–2104. [Google Scholar] [CrossRef]
  19. Six, J.; Conant, R.T.; Paul, E.A.; Paustian, K. Stabilization mechanisms of soil organic matter: Implications for C-saturation of soils: A Review. Plant Soil 2002, 241, 155–176. [Google Scholar] [CrossRef]
  20. Stewart, C.E.; Paustian, K.; Conan, R.T.; Plante, A.F.; Six, J. Soil carbon saturation: Concept, evidence and evaluation. Biogeochemistry 2007, 86, 19–31. [Google Scholar] [CrossRef]
  21. Stewart, C.E.; Zheng, J.Y.; Botte, J.; Cotrufo, M.F. Co-generated fast pyrolysis biochar mitigates green-house gas emissions and increases carbon sequestration in temperate soils. Glob. Change Biol. Bioenergy 2013, 5, 153–164. [Google Scholar] [CrossRef]
  22. Bruun, E.W.; Hauggaard-nielsen, H.; Ibrahim, N.; Egsgaard, H.; Ambus, P.; Jensen, P.A.; Dam-Johansen, K. Influence of fast pyrolysis temperature on biochar labile fraction and short-term carbon loss in a loamy soil. Biomass Bioenergy 2011, 35, 1182–1189. [Google Scholar] [CrossRef]
  23. Whitman, T.; Enders, A.; Lehmann, J. Pyrogenic carbon additions to soil counteract positive priming of soil carbon mineralization by plants. Soil Biol. Biochem. 2014, 73, 33–41. [Google Scholar] [CrossRef]
  24. Wang, J.Y.; Xiong, Z.Q.; Yan, X.Y.; Kuzyakov, Y. Carbon budget by priming in a biochar-amended soil. Eur. J. Soil Biol. 2016, 76, 26–34. [Google Scholar] [CrossRef]
  25. Zhou, Z.D.; Yan, T.T.; Zhu, Q.; Bu, X.L.; Chen, B.; Xue, J.H.; Wu, Y.B. Bacterial community structure shifts induced by biochar amendment to karst calcareous soil in southwestern areas of China. J. Soils Sediment 2019, 19, 356–365. [Google Scholar] [CrossRef]
  26. Chen, J.H.; Chen, D.; Xu, Q.F.; Fuhrmann, J.J.; Li, L.Q.; Pan, G.X.; Li, Y.F.; Qin, H. Organic carbon quality, composition of main microbial groups, enzyme activities, and temperature sensitivity of soil respiration of an acid paddy soil treated with biochar. Biol. Fert. Soils 2019, 55, 185–197. [Google Scholar] [CrossRef]
  27. Liu, S.W.; Zhang, Y.J.; Zong, Y.J.; Hu, Z.Q.; Wu, S.; Zhou, J.; Jin, Y.G.; Zou, J.W. Response of soil carbon dioxide fluxes, soil organic carbon and microbial biomass carbon to biochar amendment: A meta-analysis. Glob. Change Biol. Bioenergy 2016, 8, 392–406. [Google Scholar] [CrossRef]
  28. Bu, X.L.; Su, J.; Xue, J.H.; Wu, Y.B.; Zhao, C.X.; Wang, L.M. Effect of rice husk biochar addition on nutrient leaching and microbial properties of Calcaric Cambisols. J. Soil Water Conserv. 2019, 74, 172–179. [Google Scholar] [CrossRef]
  29. Chen, J.H.; Liu, X.Y.; Zheng, J.Y.; Zhang, B.; Lu, H.F.; Chi, Z.Z.; Pan, G.X.; Li, L.Q.; Zheng, J.F.; Zhang, X.H.; et al. Biochar soil amendment increased bacterial but decreased fungal gene abundance with shifts in community structure in a slightly acid rice paddy from Southwest China. Appl. Soil Ecol. 2013, 71, 33–44. [Google Scholar] [CrossRef]
  30. Li, Y.F.; Hu, S.D.; Chen, J.H.; Müller, K.; Li, Y.C.; Fu, W.J.; Lin, Z.W.; Wang, H.L. Effects of biochar application in forest ecosystems on soil properties and greenhouse gas emissions: A review. J. Soils Sediment 2018, 18, 546–563. [Google Scholar] [CrossRef]
  31. Wu, F.P.; Jia, Z.K.; Wang, S.G.; Chang, S.X.; Startsev, A. Contrasting effects of wheat straw and its biochar on greenhouse gas emissions and enzyme activities in a Chernozemic soil. Biol. Fert. Soils 2013, 49, 555–565. [Google Scholar] [CrossRef]
  32. Kumar, S.; Masto, R.E.; Ram, L.C.; Sarkar, P.; George, J.; Selvi, V.A. Biochar preparation from Parthenium hysterophorus and its potential use in soil application. Ecol. Eng. 2013, 55, 67–72. [Google Scholar] [CrossRef]
  33. Castellano, M.J.; Mueller, K.E.; Olk, D.C.; Sawyer, J.E.; Six, J. Integrating plant litter quality, soil organic matter stabilization, and the carbon saturation concept. Global Chang. Biol. 2015, 21, 3200–3209. [Google Scholar] [CrossRef]
  34. Geyer, K.M.; Kyker-Snowman, E.; Grandy, A.S.; Fery, S.D. Microbial carbon use efficiency: Accounting for population, community, and ecosystem-scale controls over the fate of metabolized organic matter. Biogeochemistry 2016, 127, 173–188. [Google Scholar] [CrossRef]
  35. Liu, Z.W.; Zhu, M.T.; Wang, J.M.; Liu, X.X.; Guo, W.J.; Zheng, J.F.; Bian, R.J.; Wang, G.M.; Zhang, X.H.; Cheng, K.; et al. The responses of soil organic carbon mineralization and microbial communities to fresh and aged biochar soil amendments. Glob. Chang. Biol. Bioenergy 2019, 11, 1408–1420. [Google Scholar] [CrossRef]
  36. Ouyang, L.; Tang, Q.; Yu, L.Q.; Zhang, R.D. Effects of amendment of different biochars on soil enzyme activities related to carbon mineralisation. Soil Res. 2014, 52, 706–716. [Google Scholar] [CrossRef]
  37. Awad, Y.M.; Blagodatskaya, E.; Ok, Y.K.; Kuzyakov, Y. Effects of polyacrylamide, biopolymer, and biochar on decomposition of soil organic matter and plant residues as determined by 14C and enzyme activities. Eur. J. Soil Biol. 2012, 48, 1–10. [Google Scholar] [CrossRef]
  38. Waldrop, M.P.; Zak, D.R.; Sinsabaugh, R.L.; Gallo, M.; Lauber, C. Nitrogen deposition modifies soil carbon storage through changes in microbial enzymatic activity. Ecol. Appl. 2004, 14, 1172–1177. [Google Scholar] [CrossRef]
  39. Freeman, C.; Ostle, N.; Kang, H. An enzymic ‘latch’ on a global carbon store—A shortage of oxygen locks up carbon in peatlands by restraining a single enzyme. Nature 2001, 409, 149. [Google Scholar] [CrossRef] [PubMed]
  40. IUSS Working Group WRB. Data from: World Reference Base for Soil Resources 2006—A Framework for International Classification, Correlation and Communication; World Soil Resources Reports; FAO: Rome, Italy, 2006; 103p. [Google Scholar]
  41. Fang, X.; Zhu, Y.L.; Liu, J.D.; Lin, X.P.; Sun, H.Z.; Tang, X.H.; Hu, Y.L.; Huang, Y.P.; Yi, Z.G. Effects of moisture and temperature on soil organic carbon decomposition along a vegetation restoration gradient of subtropical China. Forests 2022, 13, 578. [Google Scholar] [CrossRef]
  42. Whitaker, J.; Ostle, N.; McNamara, N.P.; Nottingham, A.T.; Stott, A.W.; Bardgett, R.D.; Salinas, N.; Ccahuana, A.J.Q.; Meir, P. Microbial carbon mineralization intropical lowland and montane forest soils of Peru. Front. Microbiol. 2014, 5, 720. [Google Scholar] [CrossRef]
  43. Liu, J.X.; Liu, S.G.; Li, Y.Y.; Liu, S.Z.; Yin, G.C.; Huang, J.; Xu, Y.; Zhou, G.Y. Warming effects on the decomposition of two litter species in model subtropical forests. Plant Soil 2017, 409, 277–287. [Google Scholar] [CrossRef]
  44. Tabatabai, M.A. Soil enzymes. In Methods of Soil Analysis. Part 2: Microbiological and Biochemical Properties; Weaver, R.W., Angle, S., Bottomley, P., Bezdicek, D., Smith, S., Tabatabai, A., Wollum, A., Eds.; SSSA Book Ser; SSSA: Madison, WI, USA, 1994; Volume 5, pp. 775–833. [Google Scholar]
  45. Fang, X.; Zhou, G.Y.; Qu, C.; Huang, W.J.; Zhang, D.Q.; Li, Y.L.; Yi, Z.G.; Liu, J.X. Translocating subtropical forest soils to a warmer region alters microbial communities and increases the decomposition of mineral-associated organic carbon. Soil Biol. Biochem. 2020, 142, 107707. [Google Scholar] [CrossRef]
  46. Liu, J.X.; Fang, X.; Tang, X.L.; Wang, W.T.; Zhou, G.Y.; Huang, W.J.; Wang, G.X.; Yan, J.H.; Ma, K.P.; Du, S.; et al. Patterns and controlling factors of plant nitrogen and phosphorus stoichiometry across China’s forests. Biogeochemistry 2019, 143, 191–205. [Google Scholar] [CrossRef]
  47. Zhang, K.R.; Li, X.S.; Cheng, X.L.; Zhang, Z.H.; Zhang, Q.F. Changes in soil properties rather than functional gene abundance control carbon and nitrogen mineralization rates during long-term natural revegetation. Plant Soil 2019, 443, 293–306. [Google Scholar] [CrossRef]
  48. Wu, X.; Xu, H.; Tuo, D.F.; Wang, C.; Fu, B.J.; Lv, Y.H.; Liu, G.H. Land use change and stand age regulate soil respiration by influencing soil substrate supply and microbial community. Geoderma 2020, 359, 113991. [Google Scholar] [CrossRef]
  49. Zhang, S.B.; Fang, Y.Y.; Luo, Y.; Li, Y.C.; Ge, T.D.; Wang, Y.X.; Wang, H.L.; Yu, B.; Song, X.Z.; Chen, J.H.; et al. Linking soil carbon availability, microbial community composition and enzyme activities to organic carbon mineralization of a bamboo forest soil amended with pyrogenic and fresh organic matter. Sci. Total Environ. 2021, 801, 149717. [Google Scholar] [CrossRef]
  50. Kaiser, K.; Guggenberger, G. The role of DOM sorption to mineral surfaces in the preservation of organic matter in soils. Org. Geochem. 2000, 31, 711–725. [Google Scholar] [CrossRef]
  51. Lehmann, J.; Rillig, M.C.; Thies, J.; Masiello, C.A.; Hockaday, W.C.; Crowley, D. Biochar effects on soil biota—A review. Soil Bio. Biochem. 2011, 43, 1812–1836. [Google Scholar] [CrossRef]
  52. Kuzyakov, Y.; Friedel, J.K.; Stahr, K. Review of mechanisms and quantification of priming effects. Soil Biol. Biochem. 2000, 32, 1485–1498. [Google Scholar] [CrossRef]
  53. Zhu, X.D.; Zhu, T.T.; Pumpanen, J.; Palviainen, M.; Zhou, X.; Kulmala, L.; Bruckman, V.J.; Köster, E.; Köster, K.; Aaltonen, H.; et al. Short-term effects of biochar on soil CO2 efflux in boreal Scots pine forests. Ann. Forest Sci. 2020, 77, 59. [Google Scholar] [CrossRef]
  54. Kuzyakov, Y. Priming effects: Interactions between living and dead organic matter. Soil Biol. Biochem. 2010, 42, 1363–1371. [Google Scholar] [CrossRef]
  55. Chen, Y.P.; Chen, G.S.; Robinson, D.; Yang, Z.J.; Guo, J.F.; Xie, J.S.; Fu, S.L.; Zhou, L.X.; Yang, Y.S. Large amounts of easily decomposable carbon stored in subtropical forest subsoil are associated with r-strategy-dominated soil microbes. Soil Biol. Biochem. 2016, 95, 233–242. [Google Scholar] [CrossRef]
  56. Smith, J.L.; Collins, H.P.; Bailey, V.L. The effect of young biochar on soil respiration. Soil Biol. Biochem. 2010, 42, 2345–2347. [Google Scholar] [CrossRef]
  57. Ameloot, N.; De Neve, S.; Jegajeevagan, K.; Yildiz, G.; Buchan, D.; Funkuin, Y.N.; Sleutel, S. Short-term CO2 and N2O emissions and microbial properties of biochar amended sandy loam soils. Soil Biol. Biochem. 2013, 57, 401–410. [Google Scholar] [CrossRef]
  58. Major, J.; Lehmann, J.; Rondon, M.; Goodale, C. Fate of soilapplied black carbon: Downward migration, leaching and soil respiration. Global Chang. Biol. 2010, 16, 1366–1379. [Google Scholar] [CrossRef]
  59. Keith, A.; Singh, B.; Singh, B.P. Interactive priming of biochar and labile organic matter mineralization in a smectite-rich soil. Environ. Sci. Technol. 2011, 45, 9611–9618. [Google Scholar] [CrossRef]
Figure 1. Effects of biochar (BC) and dissolved organic matter (DOM) addition on accumulative release of CO2-C from DS, PS, and NS soils. Values are means ± SDs. DS is degraded vegetation, PS is plantation, and NS is secondary natural forest. Under the same DOM addition level, different letters mean significant differences among different biochar rates. At each vegetation restoration stage, the effects of BC, DOM, and their interaction (BC*DOM) are shown as F-values obtained by two-way ANOVA. * and *** mean p < 0.05 and p < 0.001, respectively.
Forests 15 00753 g001
Figure 2. Effects of BC and DOM addition on pH, NH4+-N, and NO3-N in DS, PS, and NS soils. Values are means ± SDs. Under the same DOM addition level, different letters mean significant differences among different biochar rates. At each revegetation stage, the effects of BC, DOM, and their interaction (BC*DOM) are shown as F-values obtained by two-way ANOVA. *, **, and *** mean p < 0.05, p < 0.01, and p < 0.001, respectively.
Forests 15 00753 g002
Figure 3. Effects of BC and DOM addition on soil dissolved organic carbon (DOC) and microbial carbon (MBC) contents in DS, PS, and NS soils. Values are means ± SDs. Under the same DOM addition level, different letters mean significant differences among different biochar rates. At each revegetation stage, the effects of BC, DOM, and their interaction (BC*DOM) are shown as F-values obtained by two-way ANOVA. *, **, and *** mean p < 0.05, p < 0.01, and p < 0.001, respectively.
Forests 15 00753 g003
Figure 4. Effects of BC and DOM addition on metabolic quotient (qCO2) in DS, PS, and NS soils. Values are means ± SDs. Under the same DOM addition level, different letters mean significant differences among different biochar rates. At each revegetation stage, the effects of BC, DOM, and their interaction (BC*DOM) are shown as F-values obtained by two-way ANOVA. *, **, and *** mean p < 0.05, p < 0.01, and p < 0.001, respectively.
Forests 15 00753 g004
Figure 5. Effects of BC and DOM addition on N-acetylglucosaminidase (NAG) and β-glucosidase (BG) activity in DS, PS, and NS soils. Values are means ± SDs. Under the same DOM addition level, different letters mean significant differences among different biochar rates. At each revegetation stage, the effects of BC, DOM, and their interaction (BC*DOM) are shown as F-values obtained by two-way ANOVA. *, **, and *** mean p < 0.05, p < 0.01, and p < 0.001, respectively.
Forests 15 00753 g005
Figure 6. Effects of BC and DOM addition on peroxidase (Perox) and phenol oxidase (PhOx) activity in DS, PS, and NS soils. Values are means ± SDs. Under the same DOM addition level, different letters mean significant differences among different biochar rates. At each revegetation stage, the effects of BC, DOM, and their interaction (BC*DOM) are shown as F-values obtained by two-way ANOVA. *, **, and *** mean p < 0.05, p < 0.01, and p < 0.001, respectively.
Forests 15 00753 g006
Figure 7. Structural equation models fitted to accumulative release of CO2-C from DS, PS, and NS soils. Significant and unapparent impacts are represented by solid and dashed arrows, respectively. The strength of the relationship of causality is shown by line thickness. Standardized path coefficients are denoted by numbers on the arrows, indicating the relationship effect size. Hydrolase—composite variable containing β-glucosidase and N-acetylglucosaminidase; oxidase—composite variable containing phenol oxidase and peroxidase; R2—the explained variance proportion. Model goodness-of-fit values for DS are χ2 = 59.334, df = 26, p < 0.05, and RMSEA = 0.236; for PS are χ2 = 59.128, df = 18, p < 0.05, and RMSEA = 0.315; and for NS are χ2 = 45.924, df = 19, p < 0.01, and RMSEA = 0.248. *, **, and *** mean p < 0.05, p < 0.01, and p < 0.001, respectively.
Forests 15 00753 g007
Table 1. Three vegetation restoration stages’ soil properties.
ParametersVegetation Restoration Stages
DSPSNS
pH4.56 ± 0.05 a4.21 ± 0.15 b4.00 ± 0.12 b
SOC (g kg−1)3.53 ± 0.25 c16.03 ± 3.38 b34.13 ± 4.56 a
NH4+-N (mg kg−1)1.71 ± 0.24 b2.06 ± 0.40 b13.02 ± 3.40 a
NO3-N (mg kg−1)0.04 ± 0.020 c0.44 ± 0.11 b0.69 ± 0.04 a
AP (mg kg−1)0.20 ± 0.08 c0.63 ± 0.20 b2.84 ± 0.33 a
TN (g kg−1)1.23 ± 0.11 b1.78 ± 0.30 b2.94 ± 0.37 a
TP (g kg−1)0.04 ± 0.00 c0.08 ± 0.01 b0.13 ± 0.01 a
MBC (mg kg−1)206.6 ± 52.4 b931.9 ± 190.2 a963.9 ± 45.4 a
DOC (mg kg−1)154.9 ± 24.5 c483.9 ± 160.0 b709.3 ± 40.8 a
DS: degraded land, PS: plantation forest, NS: secondary natural forest. SOC: soil organic carbon, TN: total nitrogen, AP: available phosphorus, TP: total phosphorus, DOC: dissolved organic carbon, MBC: microbial biomass carbon. Significant differences at different stages of revegetation are indicated by a, b, and c.
Table 2. Effects of vegetation restoration(R), biochar (BC), dissolved organic matter (DOM), and their interaction on accumulative release of CO2-C (Rs), pH, NH4+-N, MBC, NO3-N, DOC, phenol oxidase (PhOx), peroxidase (Perox), β-glucosidase (BG), and N-acetylglucosaminidase (NAG) activities, and metabolic quotients (qCO2).
Main Effect
or Interaction
Dependent Variable
RspHNH4+-NNO3-NMBCDOCBGNAGPhOxPeroxqCO2
Vegetation restoration1190.1 ***985.94 ***350.49 ***1084.9 ***288.72 ***810.63 ***548.50 ***611.48 ***9.39 ***77.70 ***4.78 *
Biochar43.30 ***1240.6 ***423.87 ***50.33 ***18.54 ***139.96 ***142.75 ***45.76 ***1.210.9813.82 ***
R×BC22.12 ***42.16 ***206.03 ***21.60 ***4.87 ***19.26 ***14.36 ***9.48 ***5.21 **10.33 ***4.28 **
DOM0.876.36 **1.144.46 *29.76 ***56.08 ***17.07 ***0.153.834.49 *7.37 **
R×DOM0.550.380.361.674.94 **0.6210.59 ***1.400.052.156.50 **
BC×DOM1.154.03 **4.21 **3.71 **3.92 **2.630.480.728.58 ***2.430.84
R×BC×DOM3.00 **2.69 **4.94 ***0.721.702.50 *1.023.99 **2.85 *0.384.07 **
The levels of significance and their F-values are listed in the table. *, **, and *** mean p < 0.05, p < 0.01, and p < 0.001, respectively.
Table 3. Correlation coefficients (Spearman) between soil pH, NH4+-N, NO3-N, MBC, DOC, BG, NAG, PhOx, Perox, and the accumulative release of CO2-C in the DS, PS, and NS are listed in the table (n = 24). *, **, and *** mean p < 0.05, p < 0.01, and p < 0.001, respectively.
Accumulative Release of CO2-C
DSPSNS
pH0.622 **−0.845 ***−0.626 **
NH4+-N0.3050.649 **0.871 ***
NO3-N0.281−0.551 *−0.778 ***
MBC0.491 *−0.277−0.617 **
DOC−0.2040.809 ***0.811 ***
BG−0.61 **0.867 ***0.654 **
NAG−0.5770.448 *0.466 *
PhOx0.240.0830.025
Perox0.602 **0.427 *0.387
Disclaimer/Publisher’s Note: The statements, opinions and data contained in all publications are solely those of the individual author(s) and contributor(s) and not of MDPI and/or the editor(s). MDPI and/or the editor(s) disclaim responsibility for any injury to people or property resulting from any ideas, methods, instructions or products referred to in the content.

