
Dynamic Estimation of Mangrove Carbon Storage in Hainan Island Based on the InVEST-PLUS Model
by
 and
and
Xian Shi
1,2, 
Lan Wu
2,
Yinqi Zheng
2,
Xiang Zhang
2,
Yijia Wang
2,
Quan Chen
2,
Zhongyi Sun
2,3,* and
and
Tangzhe Nie
1,4,*
1
School of Water Conservancy and Electric Power, Heilongjiang University, Harbin 150006, China
2
Ecology and Environment College, Hainan University, Haikou 570228, China
3
Key Laboratory of Agroforestry and Ecological Process Regulation of Hainan Province, Haikou 570228, China
4
Key Laboratory of Effective Utilization of Agricultural Water Resources, Ministry of Agriculture and Rural Affairs, Northeast Agricultural University, Harbin 150030, China
*
Authors to whom correspondence should be addressed.
Forests 2024, 15(5), 750; https://doi.org/10.3390/f15050750
Submission received: 16 March 2024
/
Revised: 19 April 2024
/
Accepted: 23 April 2024
/
Published: 25 April 2024
(This article belongs to the Special Issue Aboveground and Belowground Interaction and Forest Carbon Cycling—Volume II)
Abstract
:Mangrove ecosystems are pivotal to the global carbon budget. However, there is still a dearth of research addressing the impact of regional mangrove land use and land cover change (LUCC) on carbon sequestration and its associated spatial distribution patterns. To investigate the impact of different development scenarios on the carbon storage capacity of mangrove ecosystems, we focused on Hainan Island. We used LUCC data from 2010 to 2020 from mangrove-inhabited regions. The Markov-PLUS model was applied to predict the spatiotemporal dynamics of mangrove coverage under the natural increase scenario (NIS) and the mangrove protection scenario (MPS) over the next 40 years. Carbon storage was estimated using the InVEST model based on field-measured carbon density data. The outcomes show the following: (1) The Markov-PLUS model, with an overall accuracy of 0.88 and a Kappa coefficient of 0.82, is suitable for predicting mangrove distribution patterns on Hainan Island. (2) Environmental factors were the main drivers of historical mangrove changes on Hainan Island, explaining 54% of the variance, with elevation, temperature, and precipitation each contributing over 13%. (3) From 2025 to 2065, the mangrove area on Hainan Island is projected to increase by approximately 12,505.68 ha, mainly through conversions from forest land (12.73% under NIS and 12.37% under MPS) and agricultural land (39.72% under NIS and 34.53% under MPS). (4) The carbon storage increment within Hainan Island’s mangroves is projected at 2.71 TgC over the whole island, with notable increases expected in the eastern, northern, and northwestern regions, and modest gains in other areas. In this study, we comprehensively investigated the spatiotemporal dynamics and future trends of carbon storage in the mangroves of Hainan Island, offering invaluable guidance for the long-term management of mangrove ecosystems and the realization of carbon neutrality goals by 2060.
1. Introduction
Mangrove ecosystems, which are a cornerstone of marine carbon sequestration, significantly contributes to the mitigation of global climate change [1]. Throughout the past half-century, mangrove ecosystems have been subjected to widespread deforestation [2], transitioning into aquaculture, agricultural lands, plantations, and urban developments [3]. These land-use changes have precipitated considerable carbon emissions, attributed to the inherently high carbon density of mangrove ecosystems [4,5]. In recent years, China has distinguished itself through notable progress in the protection and restoration of mangrove habitats, becoming one of the select global nations to achieve a net gain in mangrove coverage [6]. Despite the increased focus on mangroves and their carbon sequestration capabilities, the dynamic impact of changes in mangrove cover on regional carbon sequestration in these ecosystems remains largely unexplored [7,8]. Furthermore, the research community has yet to extensively investigate the spatial distribution patterns of mangroves and their correlated carbon storage, highlighting a critical gap in the current understanding.
Globally, land use and cover change (LUCC) in areas containing mangroves has been assessed and predicted [9]. Ahmod et al. [10] developed a hybrid model incorporating cellular automata (CA) to forecast four LUCC types, including mangroves, in the Sundarbans Delta area for 2030 and 2050. Bagaria et al. [11] combined a cellular automata Markov model (CAMM) to predict the LUCC of mangrove landscapes in the Indus Delta, while Wang et al. [12] combined the MaxEnt model with the Dynamic Conversion of Land Use and its Impacts (Dyna-CLUE) model to estimate the LUCC of mangrove forests in Guangdong Province in 2030. These LUCC prediction models have evolved through various versions and have been extensively applied to simulate LUCC across different future scenarios [13]. Advanced models like the Future Land Use Simulation (FLUS) model [14], Dyna-CLUE model [12], CA model [10], and Patch-generating Land Use Simulation (PLUS) model [15] have been applied in empirical studies. Recent findings have indicated the PLUS model’s superior accuracy over alternative models. Originating from the FLUS model, the PLUS model represents an innovative approach for precise land use forecasting that incorporates spatial policy-driven effects [16]. This model offers significant benefits in identifying the driving forces behind land use changes and in simulating varied land use evolution scenarios, overcoming the limitations present in existing land use prediction models regarding the simulation of different patch scales [17]. In this study, we utilized the PLUS model to simulate and predict the dynamic evolution of LUCC in the mangroves of Hainan Island, exploring its dynamic impact on regional carbon sequestration. This further complements the scientific understanding of the spatial distribution patterns of regional mangroves and their associated carbon storage, addressing existing gaps in knowledge within the scientific community.
At present, there are two methodologies that are commonly used for the estimation of carbon storage: a quantitative approach anchored in geophysical and chemical processes [18], and a geographic method grounded in carbon density and LUCC [19]. Research parameters derived from geophysical and chemical processes, can lead to suboptimal accuracy in large-scale carbon storage evaluations and notable variances in the outcomes of different models [20]. The Integrated Valuation of Ecosystem Services and Trade-offs (InVEST) model, conceived by Stanford University, has demonstrated high performance efficacy in numerous large-scale assessments of carbon storage, utilizing carbon density and LUCC [21]. The model investigates the spatiotemporal variation of carbon storage in terrestrial ecosystems from the perspective of past and potential land use variability and its determinants [22]. Several studies employing the InVEST model have investigated historical carbon storage trends based on past land use alterations, exploring the underlying reasons for these shifts [23,24,25]. Additionally, some studies have merged the InVEST model with land use simulation models to probe the spatiotemporal variations in carbon storage under diverse scenarios and to reveal the impacts of land use changes on carbon stock dynamics [26,27,28,29]. Furthermore, Shi et al. [6] integrated the InVEST and MaxEnt models to forecast potential mangrove expansion zones in Hainan Island and calculated the carbon storage increase within mangrove ecosystems. Unlike complex mechanistic process models, the InVEST model requires simpler parameters and can be efficiently paired with models like PLUS, rendering it an exemplary tool for examining the dynamic alterations in LUCC carbon storage at a regional scale [30].
Contemporary studies on LUCC often involve a comparative analysis across a limited selection of different years [31], failing to reveal more detailed changes and seldom involving long-term analysis and prediction for specific change types such as mangrove distribution across large regions. Studies on carbon storage have primarily concentrated on specific periods of land use and administrative regions, like forests [32], Dongzhai Harbor mangroves [33], and Qinglan Bay mangroves [34]. Although there have been inquiries into the spatiotemporal development and driving forces behind historical mangrove carbon storage or carbon sinks in Hainan Island [1,35], predictive studies on how future policies might shape the distribution patterns of mangrove carbon storage are conspicuously absent [36].
Hainan Island, a rapidly evolving economic zone in China, encounters pronounced tensions between human activities and environmental preservation. It is the most species-rich area in China, and has the highest national carbon density with respect to mangroves; it also has the highest carbon density in East Asia [37,38]. The island has diverse geographical characteristics and forest structure patterns and is a representative location for carbon stock estimation research with respect to mangrove ecosystems [39]. Limited space exacerbates the conflict between human activities and the environment, especially in terms of coastal development. The current area of mangroves is less than half of the historical levels. The Chinese government is intensifying efforts to protect and restore mangroves on Hainan Island, where mangrove changes are relatively frequent, making it a valuable area for research. To forecast the future evolutionary trends of mangroves and their carbon storage, we sought to address two core inquiries: (1) What is the predictive accuracy of the coupled models regarding mangrove distribution and carbon storage under multiple scenarios, and what are the primary factors influencing mangrove alterations? (2) How will the spatiotemporal pattern of mangrove carbon storage evolve in the quest for carbon neutrality?
The United Nations has stated that achieving carbon neutrality by 2050 is the most urgent mission of the world today. Governments of all countries must comply with the obligations of the Paris Agreement, set ambitious targets every five years, and submit strengthened commitments called “nationally determined contributions” (NDCs), which must demonstrate each country’s ambition to achieve carbon neutrality. China has pledged to achieve this goal by 2060. In this study, we selected the period from 2025 to 2065 as the future prediction interval, with five-year intervals, to estimate the changes in carbon storage of mangroves on Hainan Island. The aim of the research is to provide theoretical guidance for China’s carbon neutrality goal, support data for China’s five-year NDCs, and offer a Chinese solution for global nature-based solutions. By addressing these questions, we endeavor to provide theoretical underpinnings for the restoration, proliferation, and carbon sequestration of regional mangroves under various developmental scenarios. This has significant implications for protecting, restoring, and evaluating the role of mangrove ecosystems in the global carbon balance.
2. Materials and Methods
2.1. Study Area
This study was conducted on Hainan Island (China), which has a monsoon climate in the tropics. The island experiences a mean annual temperature ranging between 22 °C and 26 °C, accompanied by average annual precipitation of 1000 to 2600 mm [6]. Home to approximately 6100 ha of mangrove ecosystems, Hainan Island hosts the entire spectrum of mangrove species found in China, encompassing 20 families and 38 species [39]. However, rapid population growth and economic development, coupled with unsustainable practices such as land reclamation, pond aquaculture, pollution discharge, and tourism development, pose significant threats to the mangrove ecosystems of Hainan Island. Over the past century, the mangroves on Hainan Island have experienced a historical trend of sharp decline and slow recovery [40]. The maximum historical mangrove coverage on Hainan Island reached 12,506 ha, which is now less than half of what it used to be [41]. The mangroves of Hainan Island are primarily situated along the coastal fringes of the island, with significant concentrations in the northeastern territories, notably the Dongzhai Harbor National Nature Reserve (Figure 1d) and the Qinglan Bay Provincial Nature Reserve (Figure 1e), the northern locales inclusive of Maniao Bay and Huachang Bay (Figure 1c), and the northwestern areas, for instance, Xinying Bay (Figure 1a) and Xinying Harbor (Figure 1b). Lesser extents of mangrove habitats have also been identified in the southern vicinities (Qingmei Harbor and Tielu Harbor), the southeastern territories (Lingshui), southwestern sectors such as Dongfang (Figure 1g) and Ledong, and southern regions like Sanya (Figure 1f). We selected seven specific regions as study blocks, as shown in Figure 1. These areas constitute the largest contiguous mangrove distribution on Hainan Island. Additionally, they are areas where human activities are relatively frequent, making them more representative. Therefore, the focal area of this study encompassed the mangrove distribution zones from 2010 to 2020, with a delineated 5 km buffer zone surrounding the distribution area (where mangroves persisted throughout the duration of the study) earmarked as the target research area (Figure 1) [6].
2.2. Data Sources
The LUCC data integrate mangrove distribution with prevailing land use classifications such as cropland, forest land, grassland, water bodies, built-up areas, and unused land, culminating in a comprehensive categorization of seven distinct land use types. Additional driving factors were chosen with a focus on data completeness and accessibility, as established by prior research [42]. These encompass socio-economic variables, natural endowments, and locational attributes (Table 1).
2.3. Methods
The study was primarily divided into three parts: (1) Analysis of historical mangrove LUCC on Hainan Island from 2010 to 2020; (2) Simulation of multiple scenarios of man-grove LUCC change over the next 40 years, including NIS and MPS; (3) Estimation and comparison of mangrove carbon storage on Hainan Island. Figure 2 illustrates the overall research flow of this study.
2.3.1. The InVEST Model Estimates Carbon Storage
The InVEST model, developed by Stanford University’s Natural Capital Program, is a mechanism for assessing and maintaining the value of ecosystem services [44]. Within its wide range of tools, the carbon module stands out due to its capability to assess carbon storage and sequestration capabilities within terrestrial biomes [45]. This particular module’s evaluative framework is based on the foundational premise that diverse land use classes sustain distinct carbon density levels across four principal compartments: subterranean biomass, arboreal biomass, necromass, and pedologic organic carbon. The aggregate of these carbon densities epitomizes the total carbon density attributable to a specific land use category, while the cumulative carbon storage of each land class embodies the total carbon stock of the region. In ecosystems characterized by mangroves, the intricacies of carbon storage dynamics are underscored by the interplay between carbon accretions, attributable to detritus deposition, and carbon discharges facilitated by microbial decomposition. This interaction tends to stabilize a quasi-dynamic equilibrium. Furthermore, tidal phenomena may redistribute waste from its initial deposition site, complicating collection methods and potentially leading to inaccurate estimates of metabolic carbon content. With this in mind, we strategically omitted cadaveric carbon from the analysis [6]. The most crucial aspect of calculating carbon storage in the InVEST model is the selection of carbon density. The carbon density data required for the model are all based on field measurements from relevant studies and were corrected using carbon density correction formulas [6,35,46,47,48]. These data integrate factors such as vegetation, soil type, climate, and physical conditions to calculate the carbon density of the study area [49]. The carbon density dataset used in this study includes empirical metrics of arboreal carbon density, below-ground carbon density, and soil carbon density in different regions of Hainan Island, as shown in Table 2. For enhanced clarity, the nomenclature ‘mangrove-n’, ‘mangrove-e’, ‘mangrove-w’ and ‘mangrove-s’ within Table 2 indicates mangrove sectors located in the northern, eastern, western, and southern quadrants of Hainan Island, respectively.
2.3.2. PLUS Model
The PLUS model is a patch-generated land use change simulator that contains the Land Expansion Analysis Strategy (LEAS) model and the CA model based on multiple random patch seeds (CARS) [15]. In the execution of this study, twelve driving factors were selected for the simulation of land use, leveraging the Markov chain method to forecast future demands based on historical trends and data. This methodological approach facilitates a nuanced prediction of future land-use shifts, accounting for both the temporal dynamics of land use evolution and the spatial distribution of various land use types.
- (1)
- The Markov module
The Markov module is widely utilized for its robustness in making long-term quantitative predictions, and is adept at computing the probabilities of LUCC between various years and estimating future LUCC demands [50]. Through the manipulation of transition probabilities contingent upon various land use typologies, it is feasible to establish divergent regional development paradigms. Consequently, this methodology facilitates the forecasting of the structural composition of land use in forthcoming scenarios, underscoring the adaptability of the approach in predicting land use dynamics across distinct developmental trajectories.
- (2)
- The LEAS module
In the transformation rule mining module, random sampling is employed to analyze the expansion areas and driving factors between two periods of land use types. Training is then conducted separately based on different land use types. The random forest classification (RFC) algorithm is utilized to identify the relationship between the two periods of data. This approach enables the ascertainment of development probabilities associated with various land use categories [51]. The ability of the RFC algorithm to quantify the impact of each driver on the proliferation of each land use type was utilized within the context of the LEAS module. The magnitude of a driving factor’s contribution is directly proportional to its impact on the alterations observed within a particular land category, a notion that was instrumental in identifying the underlying catalysts for mangrove evolution within the scope of this analysis.
- (3)
- The CARS module
The CARS module presents a sophisticated approach to simulating regional land use dynamics, integrating the utility of various random patch seeds alongside a decay mechanism for thresholds within the framework of cellular automata. This methodology leverages development probabilities calculated for each land use type, employing specific neighborhood weights and transition matrices to align the simulation outcomes with projected macroscopic land demands [30]. By adjusting these parameters, the CARS module can simulate complex land use changes while adhering to overarching future land requirements, ensuring that the simulated distribution of land use types is consistent with expected demand patterns. The module’s design allows for the incorporation of policy constraints that may limit land type conversions in specific areas, such as aquatic environments and protected natural reserves. However, we did not apply these restrictions, focusing instead on the theoretical potential for land use conversion based on ecological and socio-economic factors alone.
- (4)
- Scenario Setup
The conversion cost matrix is a pivotal component in simulating land use changes, serving as a quantifiable measure of the challenges associated with transitioning one land-use type to another. In this metaphor, a value of 1 signifies the feasibility of conversion between specific land types, indicating that such a transformation is possible under the defined conditions. Conversely, a value of 0 denotes prohibition of the conversion, reflecting either a physical impossibility or a regulatory constraint that prevents the change in land use from occurring [52]. Consistent with the approach adopted in existing studies, we introduce two contrasting scenarios: the natural increase scenario (NIS) and the mangrove protection scenario (MPS). These scenarios are predicated on divergent policy frameworks, with the NIS focusing on the natural enlargement of land-use types in the absence of any intervention, and the MPS emphasizing the conservation and restoration of mangrove ecosystems through targeted policy measures. The delineation of conversion rules within these scenarios is detailed in Table 3, offering a comprehensive overview of the permissible land use transitions under each policy framework. This approach not only provides insight into potential land-use dynamics, but also emphasizes the importance of scenario-specific planning to achieve desired environmental and development outcomes.
- NIS: The scenario is based on land use data from three periods between 2010 and 2020, and utilizes Markov chains to forecast the demand for different land use types. This scenario extends the historical trends of land use change in the study area, considering areas without functional restrictions and planned development zones.
- MPS: This scenario takes into account a series of policy influences, including the “Special Action Plan for the Protection and Restoration of Mangroves (2020–2025)”, the “Opinions of the Central Committee of the Communist Party of China and the State Council on Fully, Accurately, and Comprehensively Implementing the New Development Concept and Doing Well in Carbon Peaking and Carbon Neutrality Work”, the “Overall Plan for the Protection and Restoration of Important Ecological Systems in China (2021–2035)”, and the “Coastal Protection and Restoration Engineering Work Plan”, among others. In this scenario, in response to these policies, efforts are made to scientifically construct mangroves. Based on the current status of mangrove resources, scientific arguments and reasonable determinations are made regarding suitable areas for mangrove restoration. Building upon the clearance of fish ponds within nature reserves, priority is given to implementing ecological restoration of mangroves, adhering to the principle of “planting trees wherever possible”, prioritizing the use of local mangrove species, and expanding mangrove areas. Rare mangrove species are protected. Requirements for strengthened regional control and land use planning are implemented to limit the conversion of mangrove species. The aim of this scenario is to reflect the increased enforcement of mangrove protection policies by the local government in the research area, encourage the implementation of comprehensive mangrove protection, and prioritize the protection of mangrove ecosystems. In delineating ecological protection redlines, based on the principles of “all suitable areas should be delineated, and all delineated areas should be protected”, mangroves in relevant natural reserves, as well as areas outside natural reserves suitable for mangrove restoration, are all included in the ecological protection redline for strict protection. Referring to existing research designs and aligning with our experimental goals [53,54], the model was set as follows: (1) Strictly limiting the transition of mangroves to other land use types; (2) Increasing the probability of converting forests and cultivated land into mangroves by 80%, reducing the probability of converting grasslands and residential land into mangroves by 80%, and increasing the probability of converting water bodies and unused land into mangroves by 60%; (3) Establishing a five-kilometer buffer zone around the existing mangrove distribution range to meet the distribution requirements of suitable mangrove habitats.
3. Results
3.1. Validation of Model Accuracy and Identification of Historical Drivers of Change
From 2010 to 2020, the mangrove coverage on Hainan Island underwent an expansion of 808.16 ha, predominantly through the transformation of forest lands and aquatic zones, which together contributed to 82.93% of the overall increase in mangrove area. Meanwhile, the carbon storage across the whole island increased by a total of 0.15 TgC. To validate the model’s fidelity, consistency assessments comparing the simulated outcomes with the actual LUCC observed in 2020 were undertaken, as detailed in Table 4. The simulation’s precision for the principal mangrove habitats across Hainan Island is explained in Table 4. The computation of the overall Kappa coefficient yielded a value of 0.82, and the overall accuracy (OA) coefficient was determined to be 0.88, surpassing the thresholds set for this research. These metrics underscore the model’s competency in projecting future mangrove distributions accurately [55].
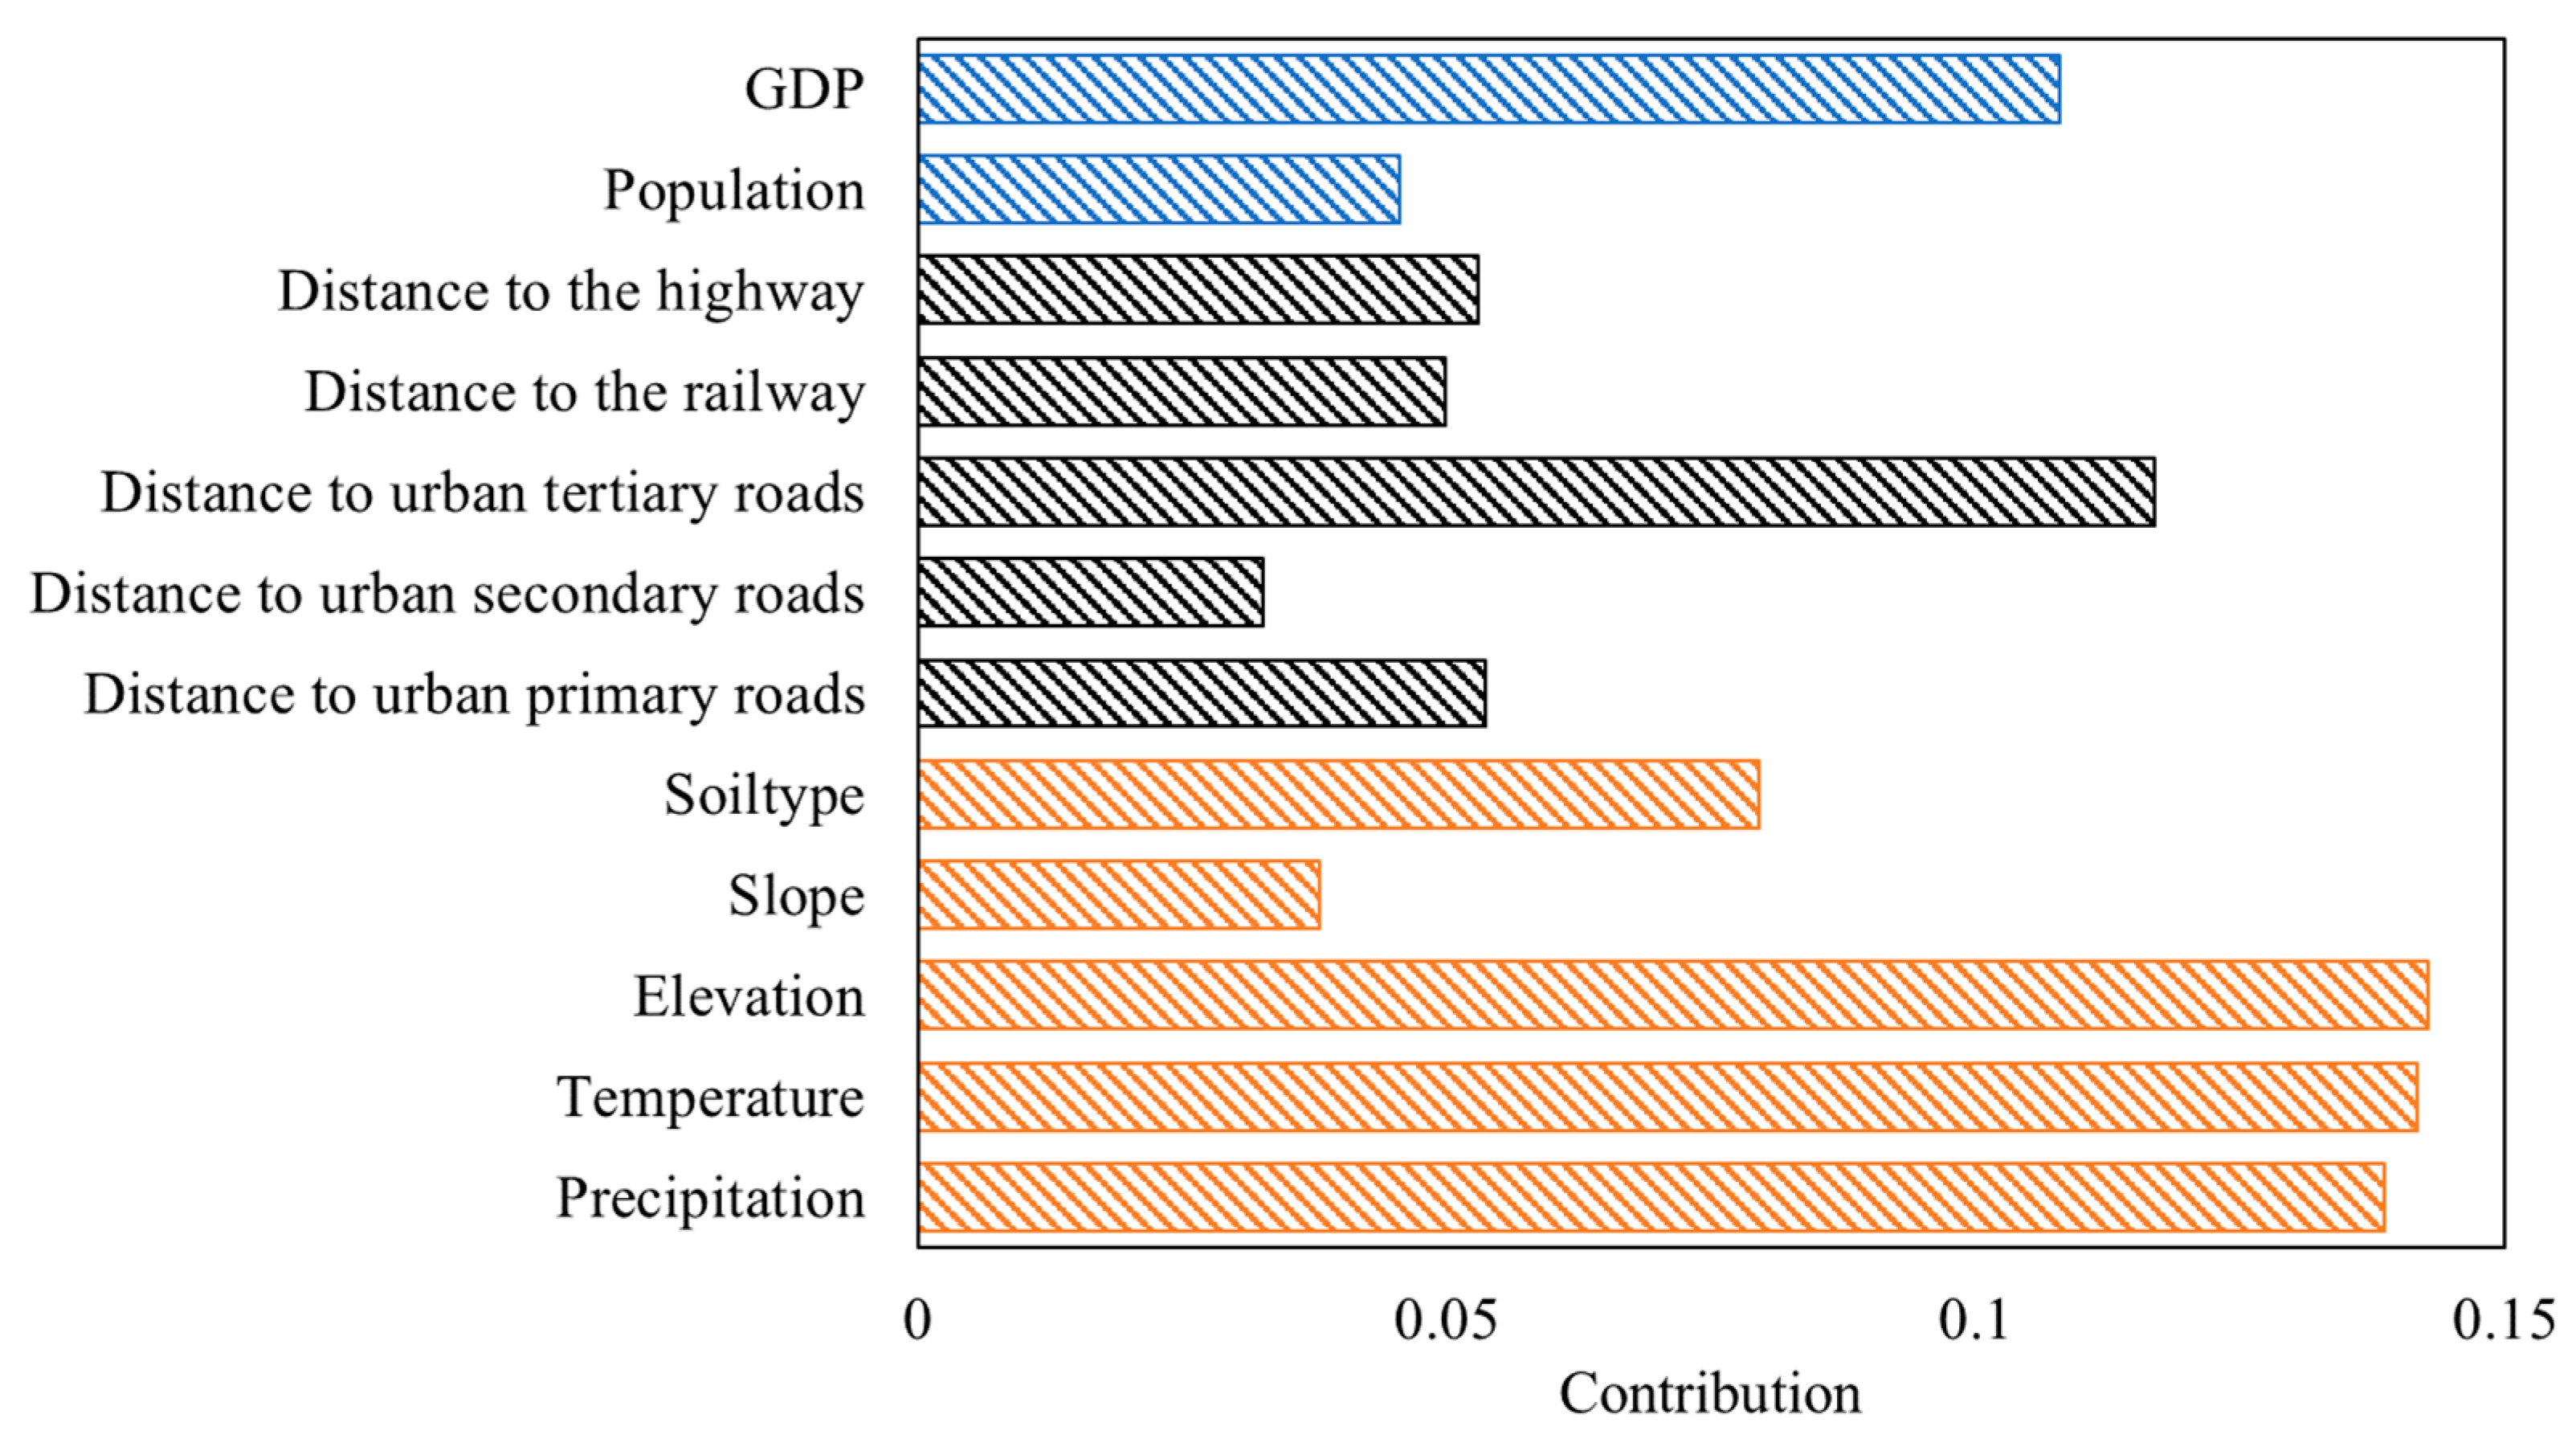
The findings pertaining to the contribution rates of various driving factors, as illustrated in Figure 3, reveal that environmental factors (depicted by orange bars in the figure) have the most significant influence on alterations in mangrove distribution, accounting for 54% of the changes. Within this category, elevation, temperature, and precipitation stand out as the primary contributors, each with a contribution rate exceeding 13%. Following environmental factors, locational attributes (represented by black bars in the figure) play a substantial role, contributing around 31% to the distribution changes, with the proximity to urban tertiary roads being the most significant with a 12% contribution rate. Social and economic influences (indicated by blue bars in the figure), in contrast, have a relatively minor effect on mangrove distribution changes, constituting 15% of the overall impact.
3.2. Multiscenario Mangrove Distribution
The projected spatial distribution of mangroves on Hainan Island over the next four decades indicates a pronounced trend of expansion in the already substantial (Figure 4 and Figure 5), continuous mangrove zones such as Dongzhai Harbor, Qinglan Bay, and Xinying Bay, with expected increases of 3569.13 ha, 2567.25 ha, and 1394.10 ha, respectively. These expansions underscore the potential for significant mangrove growth in these areas. In contrast, other regions exhibit more modest growth, with Huachang Bay expected to expand by 921.42 ha, Dongfang by 894.96 ha, Xinying Harbor by 710.46 ha, and Sanya by 568.44 ha. The dynamics of land conversion, particularly the transformation of arable and forest lands into mangrove habitats, emerge as predominant contributors to this expansion. Notably, such conversions are marginally less prevalent under the NIS compared to the MPS, indicating a strategic emphasis on conservation under the latter. In a comparative analysis across the seven highlighted areas of Hainan Island, it was observed that under a consistent area of expansion, the MPS more stringently regulates mangrove conversions (Table 5 and Table 6). Specifically, Dongzhai Harbor exhibits the most significant conversion of forest land to mangroves without any grassland conversions. Qinglan Bay is distinguished by the highest conversion rate from arable land to mangroves and the lowest from grassland. Xinying Bay, under both scenarios, sees the highest conversion rate from arable land, followed by water bodies. Xinying Harbor experiences the most water body conversions into mangroves, with arable land also contributing significantly. Dongfang’s expansion is primarily achieved through the conversion of water bodies, with no changes from grassland or unused land. Huachang Bay shows a trend of converting forest land to mangroves, avoiding unused land conversions. Lastly, Sanya is marked by a predominant conversion of forest land, with minimal grassland transformations. This detailed analysis highlights the varied impact of land conversion dynamics on mangrove expansion across different areas of Hainan Island under the specified scenarios.
3.3. Estimating Mangrove Carbon Storage on Hainan Island
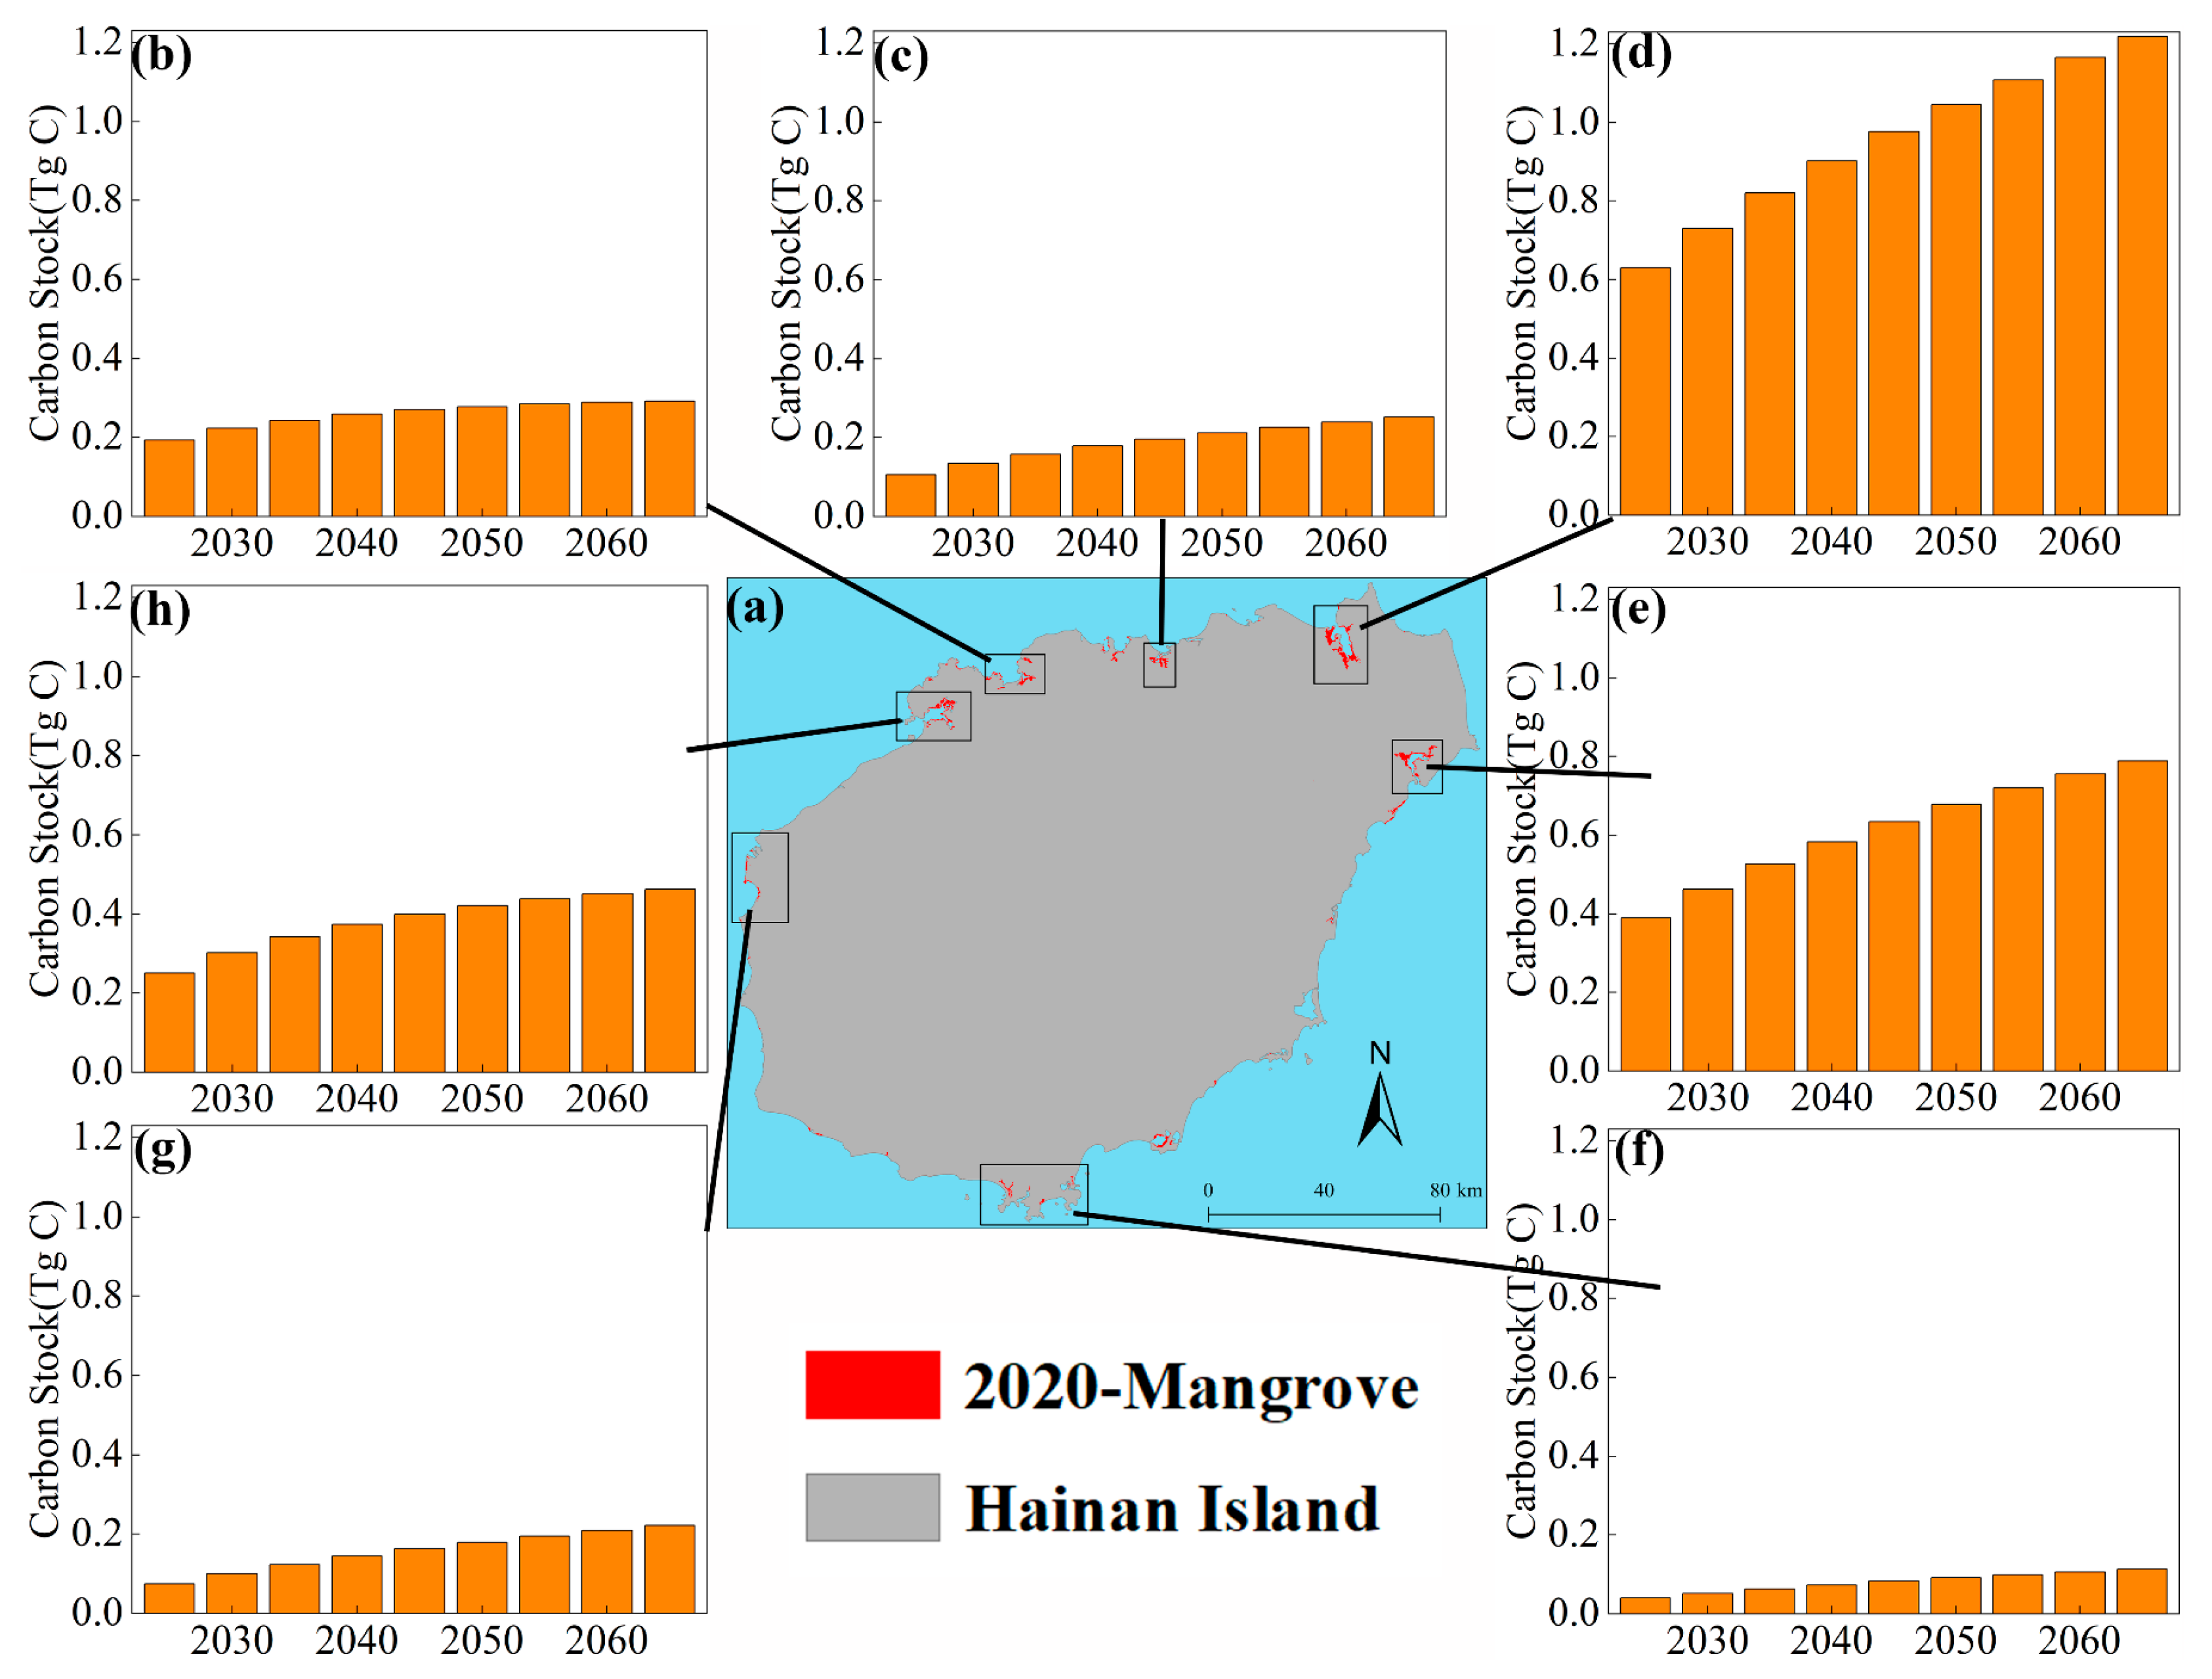
The projected mangrove carbon stocks in Hainan Island from 2025 to 2065, as illustrated in Figure 6, reveal a temporal trend of overall increase; the total cumulative increase in carbon storage across the entire island is 2.14 TgC. Spatially, the distribution of carbon storage demonstrates a pattern of higher concentrations in the eastern regions as opposed to the western, and higher concentrations in the northern parts in comparison to the southern. Dongzhai Harbor is marked by a significant expansion pattern, with a cumulative increase in carbon storage of approximately 0.70 TgC, and an annual growth rate of about 0.08 TgC/year, indicating a trend of consistent substantial growth throughout the study period (as depicted in Figure 6d). Qinglan Bay’s carbon storage increase by roughly 0.48 TgC, with an annual enhancement rate of around 0.05 TgC/year, although this rate begins to decelerate post-2045 (Figure 6e). Xinying Bay also experiences a significant increase in carbon storage, tallying approximately 0.27 TgC, with an annual growth rate of about 0.03 TgC/year, and a slowdown in growth rate post-2055 (Figure 6h). Dongfang (Figure 6g) and Huachang Bay (Figure 6c) exhibit similar growth trajectories, each with an approximate annual increase of 0.02 TgC/year, and seeing nearly equal total increments of around 0.17 TgC and 0.18 TgC, respectively, with growth plateauing after 2055. Xinying Harbor (Figure 6b) and Sanya (Figure 6f) display the lowest growth rates, at approximately 0.01 TgC/year, with Sanya having a minimal total increase of about 0.08 TgC. The growth rate in Sanya gradually diminishes after 2040 and stagnates post-2060, whereas Xinying Harbor sees a total rise of about 0.14 TgC, with growth essentially halting after 2055.
4. Discussion
The integration of the Markov-PLUS and InVEST models in this research was intended to quantitatively evaluate the ramifications of policy-driven land use modifications on carbon storage across varied development scenarios [43]. The findings of this research generally align with Shi et al.’s predictions regarding suitable mangrove habitats on Hainan Island, showcasing a projected expansion of mangroves ranging from 2000 to 7000 ha, predominantly within the eastern, northern, and northwestern sectors of the island. This concurrence serves to reaffirm the simulation’s precision within this study [6]. The InVEST model’s computation posits the average carbon density of Hainan Island’s mangrove ecosystems at 217.00 t/ha. This estimation, while lower than the average carbon densities reported by Bai et al. [35] (310.75 t/ha) and Gao et al. [56] (426.57 t/ha), surpasses the figure presented by Meng et al. [1] (192.00 t/ha). It falls within the confidence interval (192.00~426.57 t/ha) derived from integrating previous research findings, albeit slightly lower than the mean value. Despite residing on the conservative side of this spectrum, the calculated average signifies a potentially modest underestimation of the prospective increase in carbon storage within the mangrove ecosystems of Hainan Island, highlighting a critical area for further scrutiny and adjustment in future modeling efforts. Furthermore, the carbon density of mangroves may be determined by the joint influence of climate factors such as temperature, precipitation, biomass variables, and other factors. Research by Bachelet et al. suggests that moderate temperature increases lead to an increase in regional vegetation density and carbon fixation, while significant temperature rises result in carbon loss [57]. In another review, Wu et al. concluded that reduced precipitation can decrease respiration, biomass, and productivity, further lowering carbon density [58]. Ray et al. found that tree species with a larger diameter at breast height (DBH) and higher wood specific gravity (WSG) typically have higher carbon density [59]. Additionally, Bunker et al. reported that introducing species with high WSG into artificial forests may increase their aboveground carbon storage by 75% [60]. In terms of spatial distribution, we observed that the carbon storage of mangroves on Hainan Island is higher in the eastern than the western regions, and higher in the northern than the southern regions. This may be attributed to the suitable temperature and precipitation conditions in the northeastern part of Hainan Island. Furthermore, the northern and eastern regions of the island, such as Dongzhai Harbor, mostly consist of older trees with larger DBH, and are predominantly national and provincial-level mangrove conservation areas with minimal human disturbance.
We employed the spatially constrained multi-scenario setup of the PLUS model, meaning that under different mangrove development scenarios, the Markov module predicted consistent quantities of land cover types’ demand across various locations, with differences only in their spatial distribution. Furthermore, the calculation of their ecosystem service value (such as estimating carbon storage using the InVEST model in this paper) remained constant, with only spatial variations [61]. However, to further investigate the dynamic spatial patterns of mangrove carbon storage under the two scenario distributions in the future, we will focus on the following two limitations of the InVEST model: (1) The model assumes that any LUCC type in the landscape does not increase or decrease carbon over time. According to this assumption, the only change in carbon storage over time is due to transitions between LUCC types. However, in reality, many areas are recovering from past land use or undergoing natural succession. This issue can be addressed by categorizing mangrove LUCC types into age classes (essentially adding more LUCC types), such as three age classes of forests. Then, plots can move from one age class to another within the scenario, thereby changing their carbon storage values [62]. This is also a key point for further consideration in this study. (2) Since the model relies on estimates of carbon storage for each LUCC type, its results are only associated with the LUCC classification used and the provided carbon pool values. There are significant differences in carbon storage between different LUCC types, and often significant variations within a single LUCC type. For example, the carbon storage of mangroves is influenced by factors such as temperature, altitude, and years since disturbance (e.g., tropical cyclones) [63]. By using LUCC classification systems and relevant carbon pool tables, the carbon storage changes between roughly defined LUCC types and related environmental and management variables can be partially restored. For example, mangrove LUCC types can be stratified based on altitude, climate zones, or time intervals after significant disturbances. Of course, this more detailed approach requires data describing the amount of carbon stored in each more refined LUCC class. We plan to consider these limitations in the future, further exploring the depth and breadth of mangrove carbon storage and its future evolution on Hainan Island, to provide scientific support for guiding mangrove restoration and expansion practices.
The PLUS model predicts the probability of exploitation of individual land types, using socio-economic, climatic, and environmental data as the main drivers, highlighting the multifaceted nature of LUCC influenced by an amalgam of natural conditions, socio-economic factors, and human activities. Despite the inclusion of historical and contemporary transportation plans and policy directives as model drivers, there is a noted shortfall in the consideration of future socio-economic variables, such as population growth and GDP, alongside climatic factors like temperature and precipitation, within existing research paradigms [64,65]. Determining how to incorporate such factors is the focus of the next step. We aimed to bridge this gap by incorporating these elements into the modeling process. Additionally, to meet diverse development needs, we integrated historical LUCC transition matrices of mangroves on Hainan Island, nature-based Solutions (NbSs), and the Mangrove Protection and Restoration Action Plan (2020–2025). This was done to refine predictions of future LUCC changes under different scenarios by manipulating transition probabilities, matrices, and developmental constraints [27]. Specifically, two future development scenarios were devised: the NIS and the MPS, which essentially encompass various potential development patterns in the future [66]. Given that land use acts as a significant anthropogenic determinant of carbon storage in terrestrial ecosystems—wherein carbon storage can also mirror land use patterns—the analysis from 2020 to 2065 underscores a noteworthy increase in mangrove coverage by 12,505.68 ha on Hainan Island; the carbon storage across the entire island increased by 2.71 TgC, which was principally attributed to the conversion from forests and croplands. The NIS and MPS contribute 52.45% and 46.89% to this expansion, respectively, reflecting the profound impact of policy reforms and economic progression. To augment the carbon sequestration capability of Hainan Island’s mangrove ecosystems, it is imperative to bolster the protection of coastal wetlands, strictly uphold ecological development boundaries, and ensure rational territorial land use planning. However, the development trajectories outlined in this research may deviate from actual future scenarios and fail to encapsulate all possible outcomes. Thus, future research on simulating LUCC within mangrove ecosystems will pivot on harmonizing policy configurations with anticipated land use demands, aiming to address the disparity between modeled development scenarios and real-world development trajectories. In the future, our goal is to enhance the performance of the coupled model to enable its broader application. Firstly, we will utilize a climate system model to forecast climate change in Hainan Island. Considering future climate change, the Markov-PLUS model can simulate long-term changes in mangrove LUCC. Secondly, on a long-term scale, warmer and more humid climates will result in changes in vegetation patterns and soil carbon density [67]. Therefore, we will quantify the impact of climate change on carbon density through experimental heating, which can improve the simulation accuracy of the InVEST model. We anticipate that these adjustments will enable the coupled model to be used for long-term forecasting.
Beyond the limitations delineated herein, this study was subject to some uncertainties. The firstly of these was carbon density data. The InVEST model’s estimations of carbon storage pivot on the precision of carbon density metrics across varied land cover typologies. Although we endeavored to amalgamate extant scholarly discourse and field observations to ascertain carbon densities, we did not account for the impact of vegetative growth on these densities [1,6]. This oversight may have resulted in precipitate discrepancies in the calculation of carbon storage. The second limitation was water resource constraints. The PLUS model has the capability to embed water resource limitations to curtail land use alterations contingent upon water consumption parameters. Nevertheless, the experimental schema of this study precluded any such water resource constraints. This exclusion might have neglected the potential enhancements in water use efficiency attributable to technological progress, which could, in turn, facilitate expansions in agricultural and urban expanses, thereby influencing mangrove ecosystem dynamics [68]. Despite these challenges, we forecasted the distribution patterns and changes in carbon storage in respect of mangroves on Hainan Island over the next 40 years, based on historical trajectories. This endeavor provides data support for major strategic issues in China, such as striving for carbon neutrality by 2060 and national carbon trading negotiations. It also offers theoretical foundations for the layout and strategy formulation of artificial mangrove restoration and expansion. Furthermore, it provides insights for accurately analyzing, accounting for, and enhancing the natural resource utilization and carbon sequestration capacity of coastal mangrove ecosystems, as well as addressing global change core scientific issues such as global ecosystem carbon cycling response and climate change adaptation. It not only has profound scientific theoretical value but also extensive socio-economic value.
5. Conclusions
Due to the swift economic development in China, the transformation from land types with high carbon density values to those with low carbon density values stands as the primary cause for the decline in regional carbon storage. To bolster carbon sequestration in Hainan Island, prudent management of the conversion from cultivated land and forested areas to alternative land types is imperative, alongside the strategic expansion of high-carbon-storage land types like mangroves. Forecasting the spatial distribution of mangrove ecosystems is crucial for mangrove restoration planning and management, especially considering land use demands. The spatial distribution of mangroves depends not only on environmental factors but also on land development activities such as urbanization, agriculture, and aquaculture. We integrated the Markov-PLUS and InVEST models to assess the predictive accuracy of mangrove distribution and examine the carbon storage dynamics in mangrove ecosystems over 40 years under two developmental scenarios on Hainan Island. The results show that the integrated models performed well in simulating mangrove coverage on Hainan Island, with natural factors, particularly elevation, temperature, and precipitation, being the main drivers of mangrove expansion and carbon sequestration capability. The projected increase in mangrove area over the next 40 years is estimated at approximately 12,505.68 ha, mainly due to conversion from forest and agricultural lands. The MPS, which prioritizes mangrove conservation, optimizes carbon sequestration potential, with an estimated increase in mangrove carbon storage of 2.71 TgC from 2025 to 2065 over the whole island. The expected expansion of mangroves is particularly due to take place in the eastern, northern, and northwestern parts of the island. This study advances the understanding of the relationship between mangrove land use and changes in carbon storage in tropical regions. Furthermore, the outcomes of multi-scenario modeling offer insights into balancing regional carbon storage benefits with economic development, thereby fostering the ecological sustainability of Hainan Island and providing theoretical underpinnings for China’s carbon neutrality objectives. Providing solutions to core scientific issues such as understanding and adapting to global changes, including responses in global ecosystem carbon cycling and climate change, offers pathways for addressing these challenges.
Author Contributions
Conceptualization, methodology, and writing—original draft preparation, X.S.; supervision, project administration, and funding acquisition, L.W.; data collection, Y.Z.; data processing and visualization, X.Z.; investigation and proofreading the manuscript, Y.W.; visualization, resources and investigation, Q.C.; research design and reviewing and editing the manuscript, Z.S.; reviewing and editing the manuscript, T.N. All authors have read and agreed to the published version of the manuscript.
Funding
This research was funded by the National Key R&D Program of China (Grant No. 2021YFD2200404), the National Natural Science Foundation of China (Grant No. 32360276), Hainan Provincial Key R&D Program (Grant No. ZDYF2022SHFZ111), High-level Talent Project of the Natural Science Foundation of Hainan Province (Grant No. 322RC580) and Hainan Provincial Key Laboratory of Marine Geological Resources and Environmental Open Fund (Grant No. 23-HNHYDZZYHJKF035).
Data Availability Statement
Data are contained within the article.
Acknowledgments
The authors would like to thank the editors and the anonymous reviewers for their crucial comments, which improved the quality of this paper.
Conflicts of Interest
The authors declare no conflicts of interest.
References
- Meng, Y.; Gou, R.; Bai, J.; Moreno-Mateos, D.; Davis, C.C.; Wan, L.; Song, S.; Zhang, H.; Zhu, X.; Lin, G. Spatial patterns and driving factors of carbon stocks in mangrove forests on Hainan Island, China. Glob. Ecol. Biogeogr. 2022, 31, 1692–1706. [Google Scholar] [CrossRef]
- Alongi, D.M. Present state and future of the world’s mangrove forests. Environ. Conserv. 2002, 29, 331–349. [Google Scholar] [CrossRef]
- Richards, D.R.; Friess, D.A. Rates and drivers of mangrove deforestation in Southeast Asia, 2000–2012. Proc. Natl. Acad. Sci. USA 2016, 113, 344–349. [Google Scholar] [CrossRef] [PubMed]
- Donato, D.C.; Kauffman, J.B.; Murdiyarso, D.; Kurnianto, S.; Stidham, M.; Kanninen, M. Mangroves among the most carbon-rich forests in the tropics. Nat. Geosci. 2011, 4, 293–297. [Google Scholar] [CrossRef]
- Hamilton, S.E.; Casey, D. Creation of a high spatio-temporal resolution global database of continuous mangrove forest cover for the 21st century (CGMFC-21). Glob. Ecol. Biogeogr. 2016, 25, 729–738. [Google Scholar] [CrossRef]
- Shi, X.; Nie, T.; Xiong, Q.; Liu, Z.; Zhang, J.; Liu, W.; Wu, L.; Cui, W.; Sun, Z. Assessment of carbon stock and sequestration of the mangrove ecosystems on Hainan Island based on InVEST and MaxEnt models. J. Trop. Biol. 2023, 14, 298–306. [Google Scholar] [CrossRef]
- Atwood, T.B.; Connolly, R.M.; Almahasheer, H.; Carnell, P.E.; Duarte, C.M.; Ewers Lewis, C.J.; Irigoien, X.; Kelleway, J.J.; Lavery, P.S.; Macreadie, P.I.; et al. Global patterns in mangrove soil carbon stocks and losses. Nat. Clim. Change 2017, 7, 523–528. [Google Scholar] [CrossRef]
- Hamilton, S.E.; Friess, D.A. Global carbon stocks and potential emissions due to mangrove deforestation from 2000 to 2012. Nat. Clim. Change 2018, 8, 240–244. [Google Scholar] [CrossRef]
- Kafy, A.-A.; Al Rakib, A.; Roy, S.; Ferdousi, J.; Raikwar, V.; Kona, M.A.; Al Fatin, S.A. Predicting changes in land use/land cover and seasonal land surface temperature using multi-temporal landsat images in the northwest region of Bangladesh. Heliyon 2021, 7, e07623. [Google Scholar] [CrossRef] [PubMed]
- Ahmad, H.; Abdallah, M.; Jose, F.; Elzain, H.E.; Bhuyan, M.S.; Shoemaker, D.J.; Selvam, S. Evaluation and mapping of predicted future land use changes using hybrid models in a coastal area. Ecol. Inform. 2023, 78, 102324. [Google Scholar] [CrossRef]
- Babbar, D.; Areendran, G.; Sahana, M.; Sarma, K.; Raj, K.; Sivadas, A. Assessment and prediction of carbon sequestration using Markov chain and InVEST model in Sariska Tiger Reserve, India. J. Clean. Prod. 2021, 278, 123333. [Google Scholar] [CrossRef]
- Wang, Y.; Chao, B.; Dong, P.; Zhang, D.; Yu, W.; Hu, W.; Ma, Z.; Chen, G.; Liu, Z.; Chen, B. Simulating spatial change of mangrove habitat under the impact of coastal land use: Coupling MaxEnt and Dyna-CLUE models. Sci. Total Environ. 2021, 788, 147914. [Google Scholar] [CrossRef] [PubMed]
- Mohamed, A.; Worku, H. Simulating urban land use and cover dynamics using cellular automata and Markov chain approach in Addis Ababa and the surrounding. Urban Clim. 2020, 31, 100545. [Google Scholar] [CrossRef]
- Tan, Z.; Guan, Q.; Lin, J.; Yang, L.; Luo, H.; Ma, Y.; Tian, J.; Wang, Q.; Wang, N. The response and simulation of ecosystem services value to land use/land cover in an oasis, Northwest China. Ecol. Indic. 2020, 118, 106711. [Google Scholar] [CrossRef]
- Liang, X.; Guan, Q.; Clarke, K.C.; Liu, S.; Wang, B.; Yao, Y. Understanding the drivers of sustainable land expansion using a patch-generating land use simulation (PLUS) model: A case study in Wuhan, China. Comput. Environ. Urban Syst. 2021, 85, 101569. [Google Scholar] [CrossRef]
- Luo, S.; Hu, X.; Sun, Y.; Yan, C.; Zhang, X. Multi-scenario land use change and its impact on carbon storage based on coupled Plus-Invest model. Chin. J. Eco-Agric. 2023, 31, 300–314. [Google Scholar]
- Sun, X.-x.; Xue, J.-h.; Dong, L.-n. Spatiotemporal change and prediction of carbon storage in Nanjing ecosystem based on plus model and InVEST model. J. Ecol. Rural. Environ. 2023, 39, 41–51. [Google Scholar]
- Wang, Q.; Watanabe, M.; Ouyang, Z. Simulation of water and carbon fluxes using BIOME-BGC model over crops in China. Agric. For. Meteorol. 2005, 131, 209–224. [Google Scholar] [CrossRef]
- Quesada, B.; Arneth, A.; Robertson, E.; de Noblet-Ducoudré, N. Potential strong contribution of future anthropogenic land-use and land-cover change to the terrestrial carbon cycle. Environ. Res. Lett. 2018, 13, 064023. [Google Scholar] [CrossRef]
- Fatichi, S.; Leuzinger, S.; Körner, C. Moving beyond photosynthesis: From carbon source to sink-driven vegetation modeling. New Phytol. 2014, 201, 1086–1095. [Google Scholar] [CrossRef] [PubMed]
- Thompson, T.M. Modeling the climate and carbon systems to estimate the social cost of carbon. Wiley Interdiscip. Rev. Clim. Change 2018, 9, e532. [Google Scholar] [CrossRef]
- Liu, X.; Li, X.; Liang, X.; Shi, H.; Ou, J. Simulating the change of terrestrial carbon storage in China based on the FLUS-InVEST model. Trop. Geogr. 2019, 39, 397–409. [Google Scholar]
- Liao, L.; Zhou, L.; Wang, S.; Wang, X. Carbon sequestration potential of biomass carbon pool for new afforestation in China during 2005–2013. Acta Geogr. Sin. 2016, 71, 1939–1947. [Google Scholar]
- Zhao, M.; Yue, T.; Zhao, N.; Sun, X.; Zhang, X. Combining LPJ-GUESS and HASM to simulate the spatial distribution of forest vegetation carbon stock in China. J. Geogr. Sci. 2014, 24, 249–268. [Google Scholar] [CrossRef]
- Tao, Y.; Li, F.; Liu, X.; Zhao, D.; Sun, X.; Xu, L. Variation in ecosystem services across an urbanization gradient: A study of terrestrial carbon stocks from Changzhou, China. Ecol. Model. 2015, 318, 210–216. [Google Scholar] [CrossRef]
- Zhang, Y.; Shi, X.; Tang, Q. Carbon storage assessment in the upper reaches of the Fenhe River under different land use scenarios. Acta Ecol. Sin. 2021, 41, 360–373. [Google Scholar]
- Liang, Y.; Hashimoto, S.; Liu, L. Integrated assessment of land-use/land-cover dynamics on carbon storage services in the Loess Plateau of China from 1995 to 2050. Ecol. Indic. 2021, 120, 106939. [Google Scholar] [CrossRef]
- Wang, Z.; Li, X.; Mao, Y.; Li, L.; Wang, X.; Lin, Q. Dynamic simulation of land use change and assessment of carbon storage based on climate change scenarios at the city level: A case study of Bortala, China. Ecol. Indic. 2022, 134, 108499. [Google Scholar] [CrossRef]
- Hou, J.-K.; Chen, J.-J.; Zhang, K.-Q.; Zhou, G.-Q.; You, H.-T.; Han, X.-W. Temporal and spatial variation characteristics of carbon storage in the source region of the Yellow River based on InVEST and GeoSoS-FLUS models and its response to different future scenarios. Huan Jing Ke Xue Huanjing Kexue 2022, 43, 5253–5262. [Google Scholar]
- Zhao, H.; Guo, B.; Wang, G. Spatial–Temporal Changes and Prediction of Carbon Storage in the Tibetan Plateau Based on PLUS-InVEST Model. Forests 2023, 14, 1352. [Google Scholar] [CrossRef]
- Qiang, L.; Zhongyang, Y.; Yiqing, C.; Jinrui, L.; Zongzhu, C.; Xiaohua, C. Multi-scenario simulation of land use change and its eco-environmental effect in Hainan Island based on CA-Markov model. Ecol. Environ. 2021, 30, 1522. [Google Scholar]
- Fang, J.; Chen, A.; Peng, C.; Zhao, S.; Ci, L. Changes in Forest Biomass Carbon Storage in China Between 1949 and 1998. Science 2001, 292, 2320–2322. [Google Scholar] [CrossRef] [PubMed]
- Hu, J.; Xin, K.; Li, Z.; Gao, C.; Yan, K. Carbon storage and sequestration function evaluation in Dongzhaigang mangrove reserve of Hainan. Wetl. Sci. 2015, 13, 338–343. [Google Scholar]
- Jia, P.; Huang, W.; Zhang, Z.; Cheng, J.; Xiao, Y. The Carbon Sink of Mangrove Ecological Restoration between 1988–2020 in Qinglan Bay, Hainan Island, China. Forests 2022, 13, 1547. [Google Scholar] [CrossRef]
- Bai, J.; Meng, Y.; Gou, R.; Lyu, J.; Dai, Z.; Diao, X.; Zhang, H.; Luo, Y.; Zhu, X.; Lin, G. Mangrove diversity enhances plant biomass production and carbon storage in Hainan island, China. Funct. Ecol. 2021, 35, 774–786. [Google Scholar] [CrossRef]
- Fang, X.; Zou, J.; Wu, Y.; Zhang, Y.; Zhao, Y.; Zhang, H. Evaluation of the sustainable development of an island “Blue Economy”: A case study of Hainan, China. Sustain. Cities Soc. 2021, 66, 102662. [Google Scholar] [CrossRef]
- Gao, Y.; Zhou, J.; Wang, L.; Guo, J.; Feng, J.; Wu, H.; Lin, G. Distribution patterns and controlling factors for the soil organic carbon in four mangrove forests of China. Glob. Ecol. Conserv. 2019, 17, e00575. [Google Scholar] [CrossRef]
- Wang, G.; Guan, D.; Peart, M.; Chen, Y.; Peng, Y. Ecosystem carbon stocks of mangrove forest in Yingluo Bay, Guangdong Province of South China. For. Ecol. Manag. 2013, 310, 539–546. [Google Scholar] [CrossRef]
- Fang, F.; Li, Z.; Gui, H. Investigation and Research on Current Situation of Mangrove in Hainan. Trop. For. 2022, 50, 42–49. [Google Scholar]
- Fu, C.; Song, X.; Xie, Y.; Wang, C.; Luo, J.; Fang, Y.; Cao, B.; Qiu, Z. Research on the Spatiotemporal Evolution of Mangrove Forests in the Hainan Island from 1991 to 2021 Based on SVM and Res-UNet Algorithms. Remote Sens. 2022, 14, 5554. [Google Scholar] [CrossRef]
- Liao, B.; Zhang, Q. Area, Distribution and Species Composition of Mangroves in China. Wetl. Sci. 2014, 12, 435–440. [Google Scholar] [CrossRef]
- Wang, B.; Liao, J.; Zhu, W.; Qiu, Q.; Wang, L.; Tang, L. The weight of neighborhood setting of the FLUS model based on a historical scenario: A case study of land use simulation of urban agglomeration of the Golden Triangle of Southern Fujian in 2030. Acta Ecol. Sin. 2019, 39, 4284–4298. [Google Scholar]
- Liu, Q.; Yang, D.; Cao, L.; Anderson, B. Assessment and prediction of carbon storage based on land use/land cover dynamics in the tropics: A case study of hainan island, China. Land 2022, 11, 244. [Google Scholar] [CrossRef]
- Huang, C.; Zhang, C.; Li, H. Assessment of the impact of rubber plantation expansion on regional carbon storage based on time series remote sensing and the invest model. Remote Sens. 2022, 14, 6234. [Google Scholar] [CrossRef]
- Zhang, K.; Chen, J.; Hou, J.; Zhou, G.; You, H.; Han, X. Study on sustainable development of carbon storage in Guilin coupled with InVEST and GeoSOS-FLUS model. China Environ. Sci. 2022, 42, 2799–2809. [Google Scholar]
- Li, Y.; Liu, Z.; Li, S.; Li, X. Multi-scenario simulation analysis of land use and carbon storage changes in changchun city based on FLUS and InVEST model. Land 2022, 11, 647. [Google Scholar] [CrossRef]
- Xin, K.; Yan, K.; Gao, C.; Li, Z. Carbon storage and its influencing factors in Hainan Dongzhangang mangrove wetlands. Mar. Freshw. Res. 2018, 69, 771–779. [Google Scholar] [CrossRef]
- Jin, F.; Yang, H.; Cai, Z.; Zhao, Q. Calculation of density and reserve of organic carbon in soils. Acta Pedol. Sin. 2001, 38, 522–528. [Google Scholar]
- Ren, B.; Wang, Q.; Zhang, R.; Zhou, X.; Wu, X.; Zhang, Q. Assessment of ecosystem services: Spatio-temporal analysis and the spatial response of influencing factors in hainan province. Sustainability 2022, 14, 9145. [Google Scholar] [CrossRef]
- Xu, L.; Liu, X.; Tong, D.; Liu, Z.; Yin, L.; Zheng, W. Forecasting urban land use change based on cellular automata and the PLUS model. Land 2022, 11, 652. [Google Scholar] [CrossRef]
- Wang, Q.; Guan, Q.; Sun, Y.; Du, Q.; Xiao, X.; Luo, H.; Zhang, J.; Mi, J. Simulation of future land use/cover change (LUCC) in typical watersheds of arid regions under multiple scenarios. J. Environ. Manag. 2023, 335, 117543. [Google Scholar] [CrossRef] [PubMed]
- Wang, X.; Wang, C.-Y.; Lyu, F.-N.; Chen, S.-L.; Yu, Z.-R. Temporal and spatial variations of carbon storage and carbon sink improvement strategy at the district and county level based on PLUS-InVEST model: Taking Yanqing District as an example. Ying Yong Sheng Tai Xue Bao J. Appl. Ecol. 2023, 34, 3373–3384. [Google Scholar]
- Zhou, W.; Wang, J.; Han, Y.; Yang, L.; Que, H.; Wang, R. Scenario Simulation of the Relationship between Land-Use Changes and Ecosystem Carbon Storage: A Case Study in Dongting Lake Basin, China. Int. J. Environ. Res. Public Health 2023, 20, 4835. [Google Scholar] [CrossRef] [PubMed]
- Wu, Z.; Liu, X.; Zeng, J. Spatio-temporal change and prediction of carbon storage in Dongjiang River source watershed based on InVEST- PLUS model. Acta Sci. Circumstantiae 2024, 44, 419–430. [Google Scholar] [CrossRef]
- Huang, Z.; Li, X.; Du, H.; Mao, F.; Han, N.; Fan, W.; Xu, Y.; Luo, X. Simulating Future LUCC by Coupling Climate Change and Human Effects Based on Multi-Phase Remote Sensing Data. Remote Sens. 2022, 14, 1698. [Google Scholar] [CrossRef]
- Gao, T.; Ding, D.; Guan, W.; Liao, B. Carbon stocks of coastal wetland ecosystems on Hainan Island, China. Pol. J. Environ. Stud. 2018, 27, 1061–1069. [Google Scholar] [CrossRef] [PubMed]
- Bachelet, D.; Neilson, R.P.; Lenihan, J.M.; Drapek, R.J. Climate change effects on vegetation distribution and carbon budget in the United States. Ecosystems 2001, 4, 164–185. [Google Scholar] [CrossRef]
- Wu, Z.; Dijkstra, P.; Koch, G.W.; Peñuelas, J.; Hungate, B.A. Responses of terrestrial ecosystems to temperature and precipitation change: A meta-analysis of experimental manipulation. Glob. Change Biol. 2011, 17, 927–942. [Google Scholar] [CrossRef]
- Ray, R.; Ganguly, D.; Chowdhury, C.; Dey, M.; Das, S.; Dutta, M.K.; Mandal, S.K.; Majumder, N.; De, T.K.; Mukhopadhyay, S.K.; et al. Carbon sequestration and annual increase of carbon stock in a mangrove forest. Atmos. Environ. 2011, 45, 5016–5024. [Google Scholar] [CrossRef]
- Bunker, D.E.; DeClerck, F.; Bradford, J.C.; Colwell, R.K.; Perfecto, I.; Phillips, O.L.; Sankaran, M.; Naeem, S. Species loss and aboveground carbon storage in a tropical forest. Science 2005, 310, 1029–1031. [Google Scholar] [CrossRef] [PubMed]
- Li, C.; Gao, B.; Wu, Y.; Zheng, K.; Wu, Y. Dynamic simulation of landscape ecological risk in mountain towns based on PLUS model. J. Zhejiang AF Univ. 2022, 39, 84–94. [Google Scholar] [CrossRef] [PubMed]
- Zhao, M.; He, Z.; Du, J.; Chen, L.; Lin, P.; Fang, S. Assessing the effects of ecological engineering on carbon storage by linking the CA-Markov and InVEST models. Ecol. Indic. 2019, 98, 29–38. [Google Scholar] [CrossRef]
- Wu, L.; Guo, E.; An, Y.; Xiong, Q.; Shi, X.; Zhang, X.; Sun, Z. Evaluating the Losses and Recovery of GPP in the Subtropical Mangrove Forest Directly Attacked by Tropical Cyclone: Case Study in Hainan Island. Remote Sens. 2023, 15, 2094. [Google Scholar] [CrossRef]
- Zhu, G.; Qiu, D.; Zhang, Z.; Sang, L.; Liu, Y.; Wang, L.; Zhao, K.; Ma, H.; Xu, Y.; Wan, Q. Land-use changes lead to a decrease in carbon storage in arid region, China. Ecol. Indic. 2021, 127, 107770. [Google Scholar] [CrossRef]
- Sun, Z.; An, Y.; Kong, J.; Zhao, J.; Cui, W.; Nie, T.; Zhang, T.; Liu, W.; Wu, L. Exploring the spatio-temporal patterns of global mangrove gross primary production and quantifying the factors affecting its estimation, 1996–2020. Sci. Total Environ. 2024, 908, 168262. [Google Scholar] [CrossRef] [PubMed]
- Kong, J.; Yang, R.; Su, Y.; Fu, Z. Effect of land use and cover change on carbon stock dynamics in a typical desert oasis. Acta Ecol. Sin. 2018, 38, 7801–7812. [Google Scholar]
- Pliscoff, P.; Luebert, F.; Hilger, H.H.; Guisan, A. Effects of alternative sets of climatic predictors on species distribution models and associated estimates of extinction risk: A test with plants in an arid environment. Ecol. Model. 2014, 288, 166–177. [Google Scholar] [CrossRef]
- Gao, F.; Xin, X.; Song, J.; Li, X.; Zhang, L.; Zhang, Y.; Liu, J. Simulation of LUCC Dynamics and Estimation of Carbon Stock under Different SSP-RCP Scenarios in Heilongjiang Province. Land 2023, 12, 1665. [Google Scholar] [CrossRef]
Figure 1.
Map depicting the distribution of mangroves on Hainan Island and their surrounding 5 km buffer zones includes: (a) Xinying Bay; (b) Xinying Harbor; (c) Huachang Bay; (d) Dongzhai Harbor; (e) Qinglan Bay; (f) Sanya; (g) Dongfang, as referenced herein.
Figure 1.
Map depicting the distribution of mangroves on Hainan Island and their surrounding 5 km buffer zones includes: (a) Xinying Bay; (b) Xinying Harbor; (c) Huachang Bay; (d) Dongzhai Harbor; (e) Qinglan Bay; (f) Sanya; (g) Dongfang, as referenced herein.
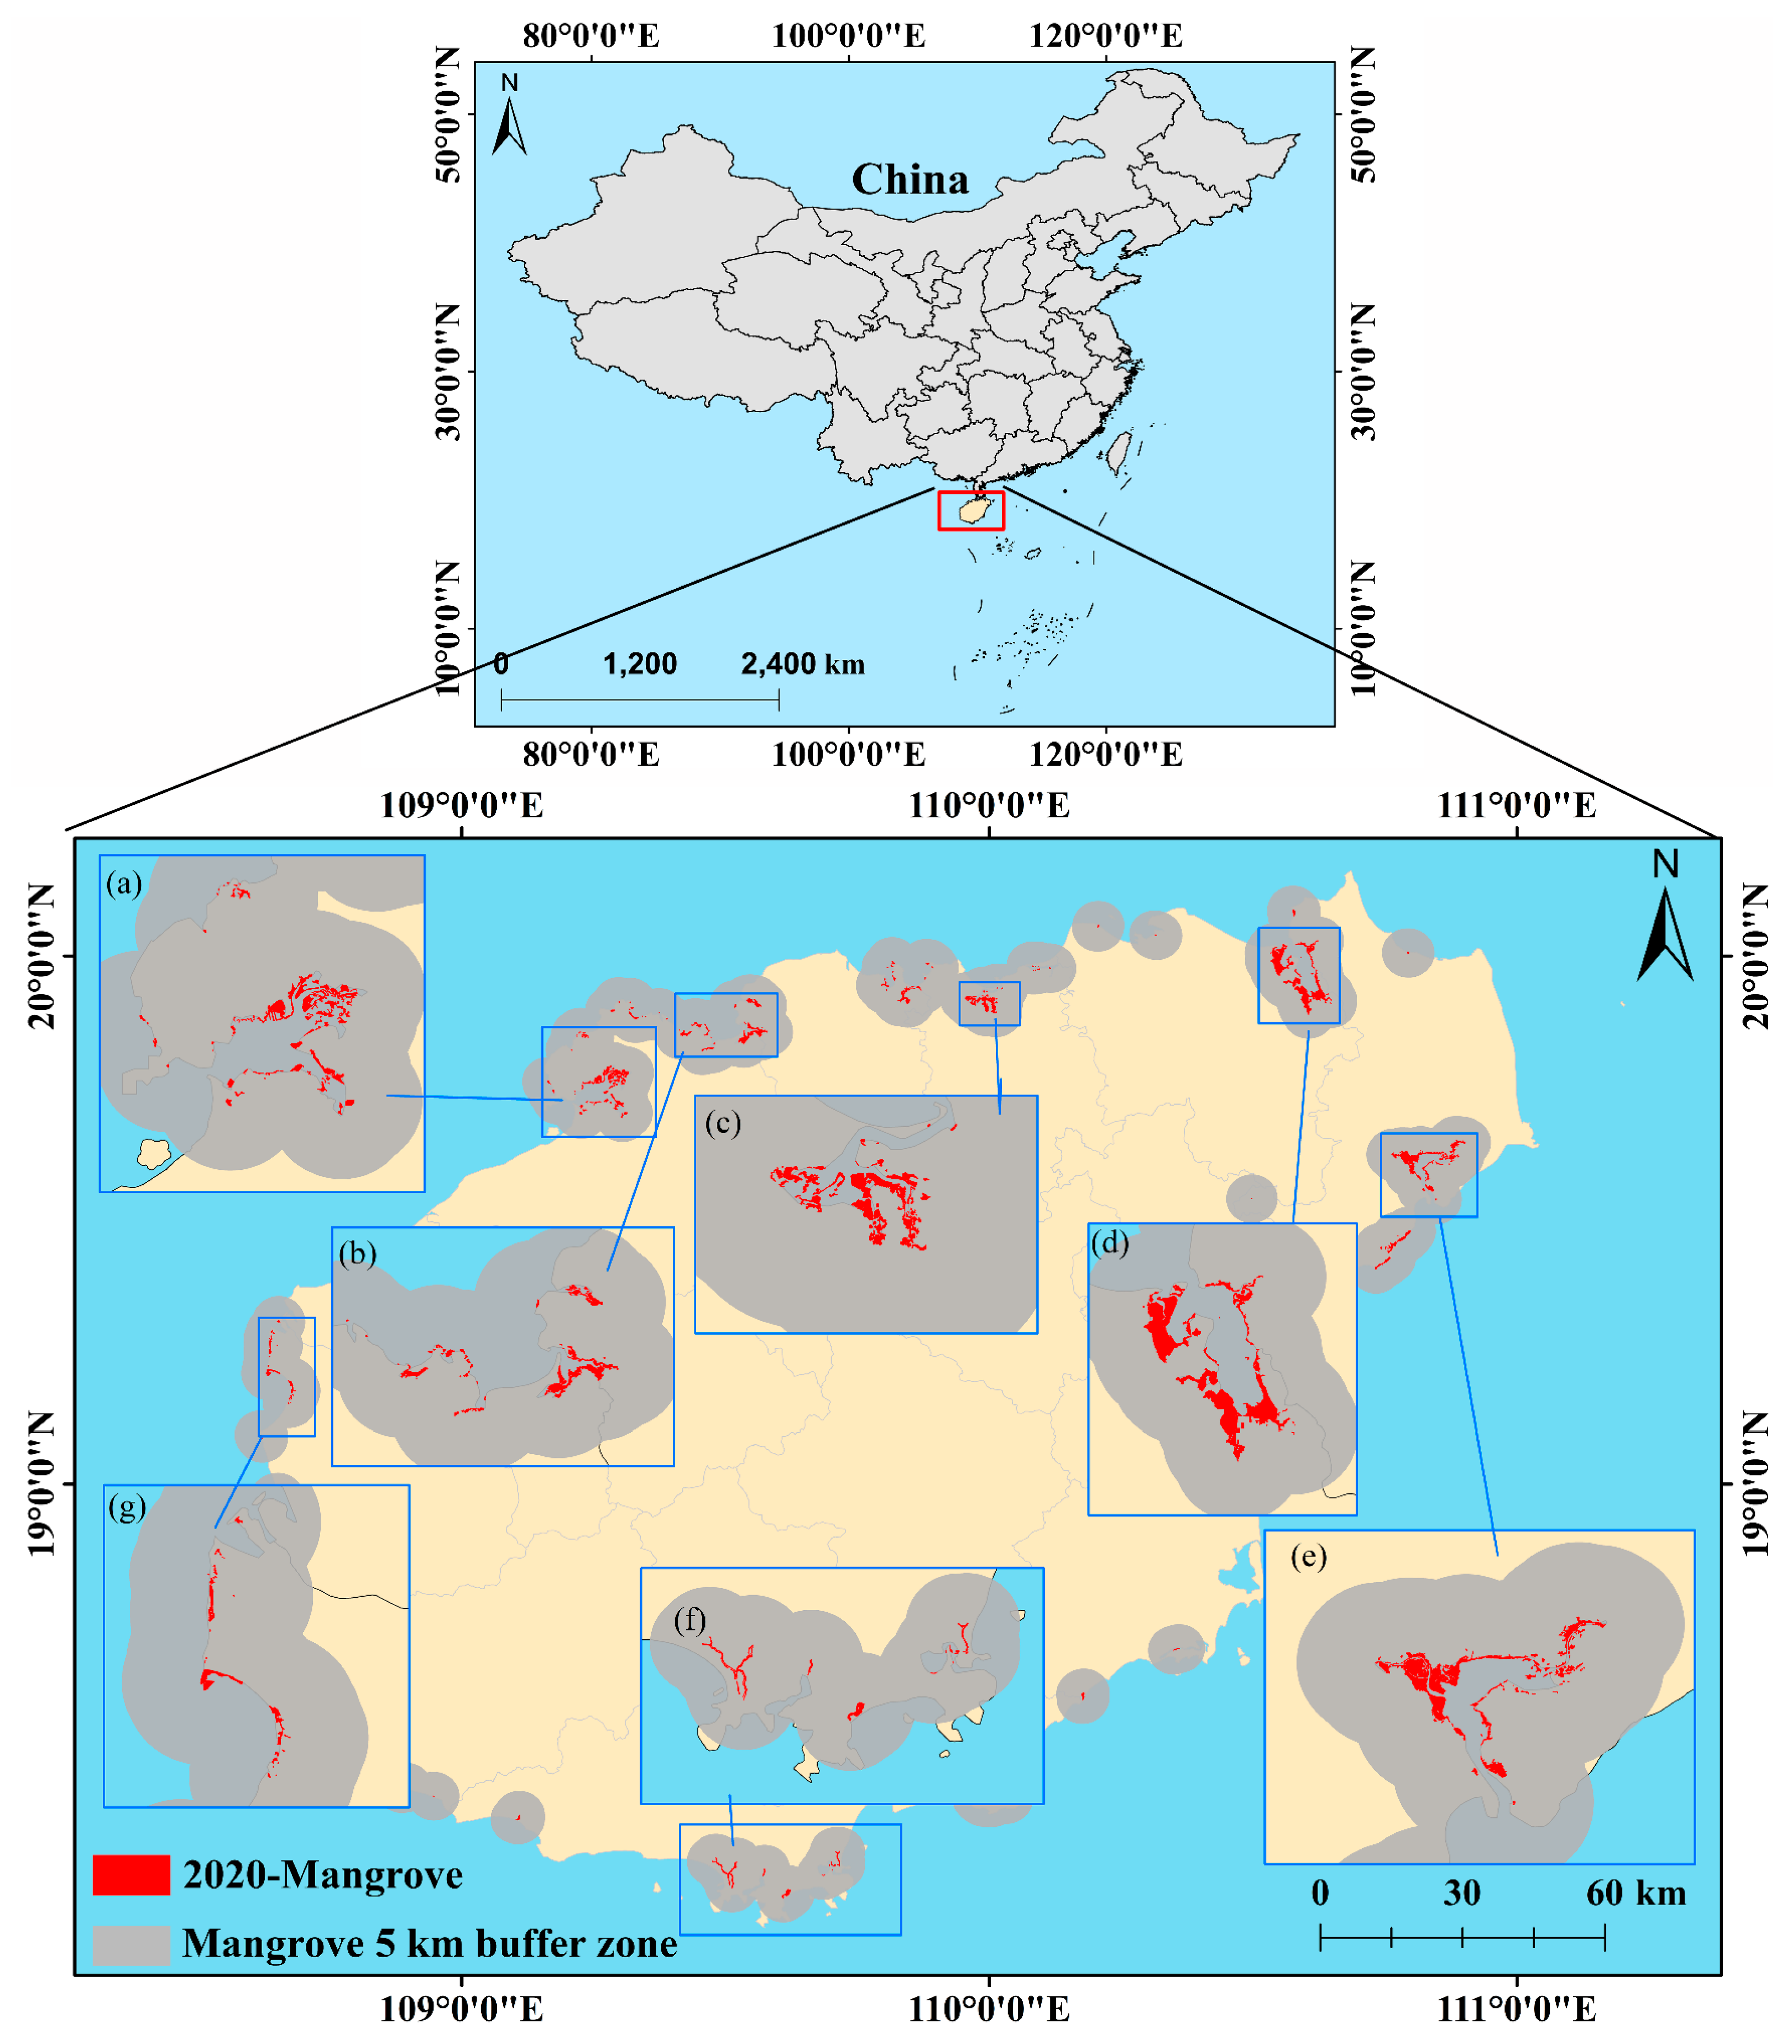
Figure 2.
Research flowchart of this study (refer to [43] for plotting).
Figure 2.
Research flowchart of this study (refer to [43] for plotting).

Figure 3.
Contribution ranking of driving factors to mangrove distribution changes (blue represents socioeconomic factors, black represents location factors, and orange represents natural factors).
Figure 3.
Contribution ranking of driving factors to mangrove distribution changes (blue represents socioeconomic factors, black represents location factors, and orange represents natural factors).

Figure 4.
Predicted mangrove distribution map for the next 40 years under the natural increase scenario: (a) Xinying Bay; (b) Xinying Harbor; (c) Huachang Bay; (d) Dongzhai Harbor; (e) Qinglan Bay; (f) Sanya; (g) Dongfang (the yellow area represents the land portion of the entire Hainan Island, the grey area represents the land portion of the seven sub-regions).

Figure 5.
Predicted mangrove distribution map for the next 40 years under the mangrove protection scenario: (a) Xinying Bay; (b) Xinying Harbor; (c) Huachang Bay; (d) Dongzhai Harbor; (e) Qinglan Bay; (f) Sanya; (g) Dongfang (the yellow area represents the land portion of the entire Hainan Island, the grey area represents the land portion of the seven sub-regions).
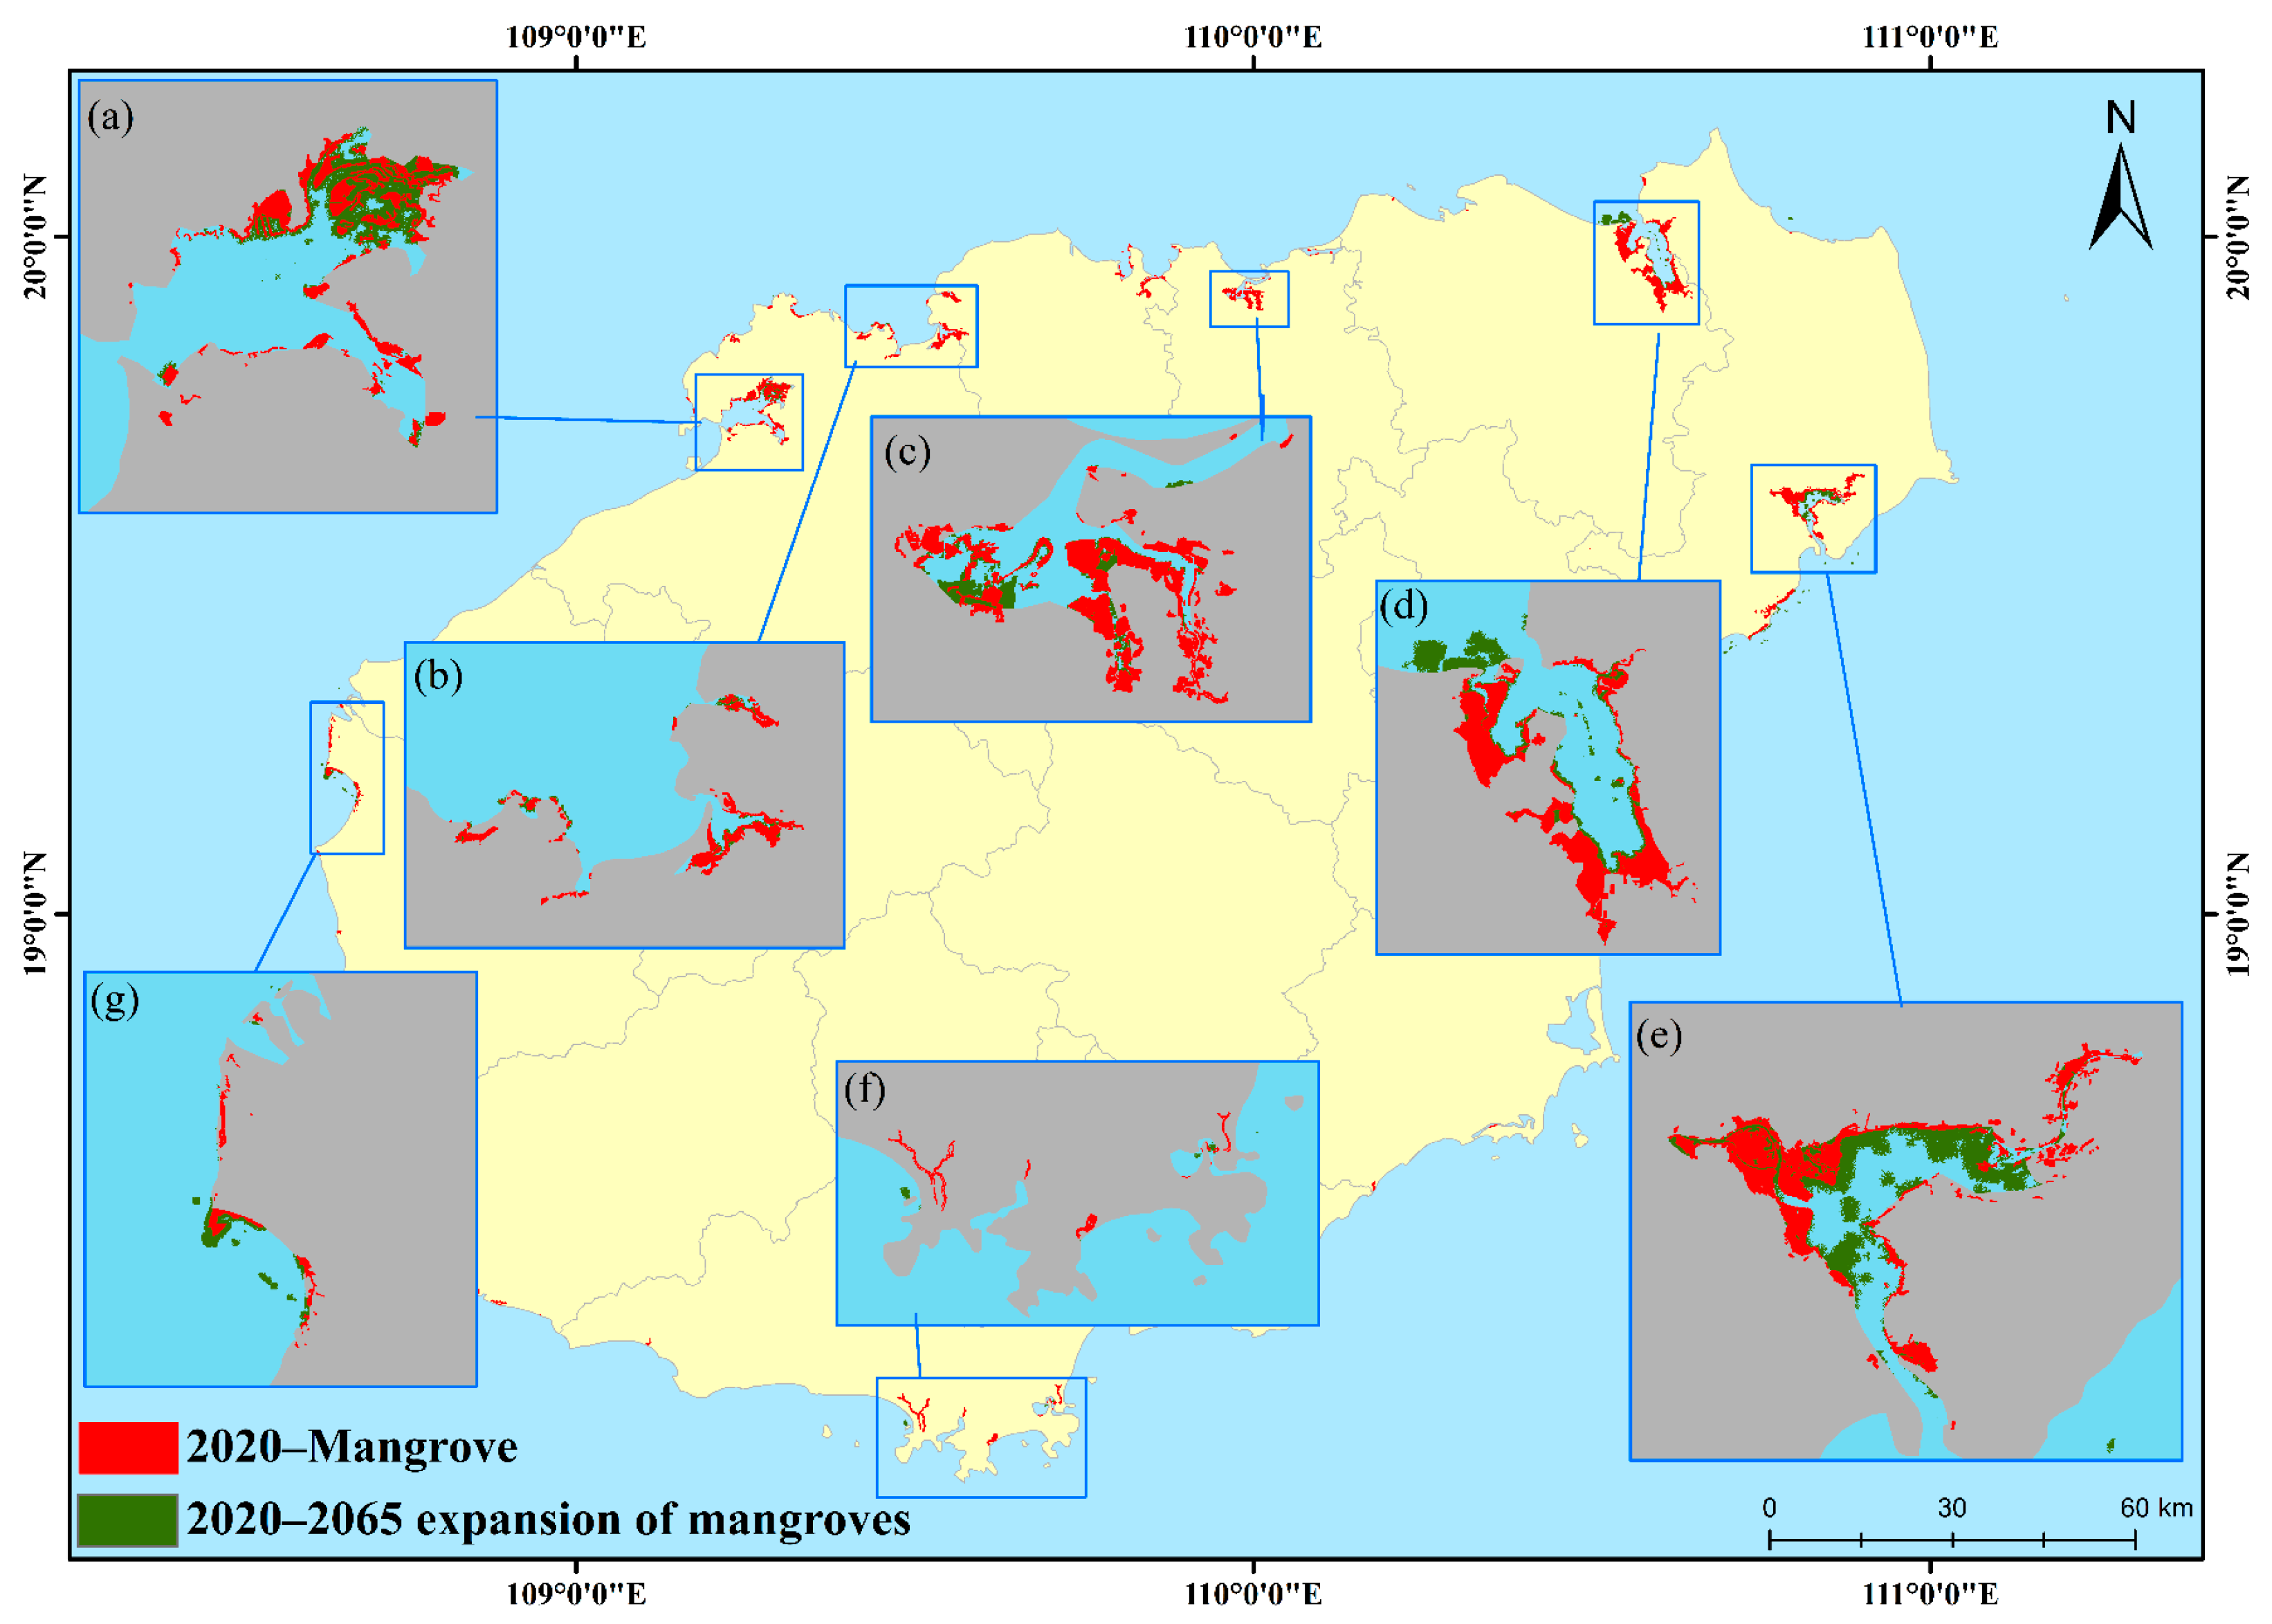
Figure 6.
Prediction of temporal evolution in mangrove carbon storage on Hainan Island over the next 40 years: (a) Hainan Island; (b) Xinying Harbor; (c) Huachang Bay; (d) Dongzhai Harbor; (e) Qinglan Bay; (f) Sanya; (g) Dongfang; (h) Xinying Bay (the bar chart in the figure represents the temporal change sequence of carbon stock in seven zones of Hainan Island over the next 40 years, with the unit TgC).

Table 1.
Driving factor data.
| Data Category | Data Description | Resolution | Data Source |
|---|---|---|---|
| Land Use Data | Land use data for Hainan Island for the years 2010, 2015, and 2020 | 30 m | Resource and Environment Science and Data Center (http://www.resdc.cn/ accessed on 15 March 2024) |
| Socioeconomic Data | Population density (POP) | 1000 m | Resource and Environment Science and Data Center (http://www.resdc.cn/ accessed on 15 March 2024) |
| Density of gross domestic product (GDP) | 1000 m | - | |
| Natural Resource Data | 2010–2020 mean temperature | 1000 m | Resource and Environment Science and Data Center (http://www.resdc.cn/ accessed on 15 March 2024) |
| 2010–2020 mean precipitation | 1000 m | - | |
| Spatial distribution data of soil types | 1000 m | World Soil Database (https://www.fao.org/soils-portal/soil-survey/soil-maps-and-databases/harmonized-world-soil-database-v12/en/ accessed on 15 March 2024) | |
| DEM | 90 m | Geospatial Data Cloud (https://www.gscloud.cn/ accessed on 15 March 2024) | |
| Slope | |||
| Location Factor Data | Distance to highway, railway, urban primary (secondary and tertiary) roads | Shapefile | Geospatial Data Cloud (https://www.gscloud.cn/ accessed on 15 March 2024) |
| Mangrove Distribution Data | Mangrove distribution data for Hainan Island for the years 2010, 2015, and 2020 | Shapefile | GMF30_2000–2020 https://data.casearth.cn/en/sdo/detail/62ff50eb08415d271ab1ba98/ accessed on 15 March 2024 |
Table 2.
Carbon density data for Hainan Island (C_above is indicative of arboreal carbon density; C_below denotes subterranean carbon density; C_soil indicates edaphic carbon density. The units are all (t/ha)).
Table 2.
Carbon density data for Hainan Island (C_above is indicative of arboreal carbon density; C_below denotes subterranean carbon density; C_soil indicates edaphic carbon density. The units are all (t/ha)).
| Name | C_Above (t/ha) | C_Below (t/ha) | C_Soil (t/ha) |
|---|---|---|---|
| mangrove-n | 44.4 | 19.98 | 131.232 |
| mangrove-e | 41.4 | 18.63 | 127.842 |
| mangrove-w | 44.8 | 20.16 | 131.684 |
| mangrove-s | 27.8 | 12.51 | 112.474 |
Table 3.
Land use conversion cost matrices in two scenarios (A represents cultivated land; B represents grassland; C represents woodland; D represents water area; E represents construction land; F represents unused land; G represents mangroves).
Table 3.
Land use conversion cost matrices in two scenarios (A represents cultivated land; B represents grassland; C represents woodland; D represents water area; E represents construction land; F represents unused land; G represents mangroves).
| 2010–2020 | Natural Increase Scenario | Mangrove Protection Scenario | ||||||||||||
|---|---|---|---|---|---|---|---|---|---|---|---|---|---|---|
| A | B | C | D | E | F | G | A | B | C | D | E | F | G | |
| A | 1 | 1 | 1 | 1 | 1 | 1 | 1 | 1 | 1 | 1 | 1 | 1 | 1 | 1 |
| B | 1 | 1 | 1 | 1 | 1 | 1 | 1 | 1 | 1 | 1 | 1 | 1 | 1 | 1 |
| C | 1 | 1 | 1 | 1 | 1 | 1 | 1 | 1 | 1 | 1 | 1 | 1 | 1 | 1 |
| D | 1 | 1 | 1 | 1 | 1 | 1 | 1 | 1 | 1 | 1 | 1 | 1 | 1 | 1 |
| E | 0 | 0 | 0 | 0 | 1 | 0 | 1 | 1 | 1 | 1 | 1 | 1 | 1 | 1 |
| F | 1 | 1 | 1 | 1 | 1 | 1 | 0 | 1 | 1 | 1 | 1 | 1 | 1 | 1 |
| G | 1 | 1 | 1 | 1 | 1 | 1 | 1 | 0 | 0 | 0 | 0 | 0 | 0 | 1 |
Table 4.
Accuracy coefficients for 7 representative mangrove zones and overall accuracy in Hainan Island (HCW is Huachang Bay; DF is Dongfang; XYG is Xinying Harbor; DZG is Dongzhai Harbor; XYW is Xinying Bay; SY is Sanya; QLW is Qinglan Bay.).
Table 4.
Accuracy coefficients for 7 representative mangrove zones and overall accuracy in Hainan Island (HCW is Huachang Bay; DF is Dongfang; XYG is Xinying Harbor; DZG is Dongzhai Harbor; XYW is Xinying Bay; SY is Sanya; QLW is Qinglan Bay.).
| Coefficient | HCW | DF | XYG | DZG | XYW | SY | QLW | Overall |
|---|---|---|---|---|---|---|---|---|
| Kappa | 0.76 | 0.90 | 0.88 | 0.86 | 0.76 | 0.75 | 0.82 | 0.82 |
| OA | 0.83 | 0.94 | 0.92 | 0.90 | 0.85 | 0.82 | 0.87 | 0.88 |
Table 5.
Mangrove land conversion matrix for the next 40 years under NIS (ha) (XYW: Xin’ying Bay; XYG: Xinying Harbor; HCW: Huachang Bay; DZG: Dongzhai Harbor; QLW: Qinglan Bay; SY: Sanya; DF: Dongfang, the same codes apply to subsequent sections).
Table 5.
Mangrove land conversion matrix for the next 40 years under NIS (ha) (XYW: Xin’ying Bay; XYG: Xinying Harbor; HCW: Huachang Bay; DZG: Dongzhai Harbor; QLW: Qinglan Bay; SY: Sanya; DF: Dongfang, the same codes apply to subsequent sections).
| Region | Mangrove | Forest | Agriculture | Unused Land | Water | Built-up | Grassland |
|---|---|---|---|---|---|---|---|
| DZG | 2588.85 | 2562.3 | 353.52 | 393.3 | 203.58 | 25.11 | 0 |
| QLG | 1358.1 | 324.27 | 859.5 | 501.57 | 320.22 | 15.12 | 12.42 |
| XYW | 733.32 | 105.75 | 961.92 | 0.54 | 514.71 | 23.22 | 8.91 |
| XYG | 730.08 | 37.71 | 150.03 | 78.3 | 426.69 | 20.16 | 41.58 |
| DF | 220.59 | 236.07 | 231.03 | 0 | 439.02 | 1.62 | 0 |
| HCW | 361.89 | 244.08 | 64.8 | 0 | 47.07 | 19.26 | 5.22 |
| SY | 94.86 | 596.34 | 11.43 | 0 | 6.75 | 26.64 | 1.71 |
Table 6.
Mangrove land conversion matrix for the next 40 years under MPS (ha).
| Region | Mangrove | Forest | Agriculture | Unused Land | Water | Built-up | Grassland |
|---|---|---|---|---|---|---|---|
| DZG | 2662.92 | 2594.07 | 350.82 | 387.09 | 199.89 | 22.86 | 0 |
| QLG | 1631.43 | 327.42 | 949.77 | 525.87 | 528.66 | 23.31 | 13.05 |
| XYW | 954.27 | 99.63 | 834.84 | 0.54 | 427.86 | 23.58 | 7.65 |
| XYG | 774.09 | 38.07 | 121.5 | 86.04 | 402.93 | 21.51 | 40.41 |
| DF | 233.37 | 232.74 | 227.34 | 0 | 433.53 | 1.35 | 0 |
| HCW | 366.39 | 243.99 | 65.88 | 0 | 47.34 | 24.48 | 5.04 |
| SY | 169.29 | 485.46 | 10.08 | 0 | 6.03 | 65.25 | 1.62 |
Disclaimer/Publisher’s Note: The statements, opinions and data contained in all publications are solely those of the individual author(s) and contributor(s) and not of MDPI and/or the editor(s). MDPI and/or the editor(s) disclaim responsibility for any injury to people or property resulting from any ideas, methods, instructions or products referred to in the content. |
© 2024 by the authors. Licensee MDPI, Basel, Switzerland. This article is an open access article distributed under the terms and conditions of the Creative Commons Attribution (CC BY) license (https://creativecommons.org/licenses/by/4.0/).
Share and Cite
MDPI and ACS Style
Shi, X.; Wu, L.; Zheng, Y.; Zhang, X.; Wang, Y.; Chen, Q.; Sun, Z.; Nie, T. Dynamic Estimation of Mangrove Carbon Storage in Hainan Island Based on the InVEST-PLUS Model. Forests 2024, 15, 750. https://doi.org/10.3390/f15050750
AMA Style
Shi X, Wu L, Zheng Y, Zhang X, Wang Y, Chen Q, Sun Z, Nie T. Dynamic Estimation of Mangrove Carbon Storage in Hainan Island Based on the InVEST-PLUS Model. Forests. 2024; 15(5):750. https://doi.org/10.3390/f15050750
Chicago/Turabian StyleShi, Xian, Lan Wu, Yinqi Zheng, Xiang Zhang, Yijia Wang, Quan Chen, Zhongyi Sun, and Tangzhe Nie. 2024. "Dynamic Estimation of Mangrove Carbon Storage in Hainan Island Based on the InVEST-PLUS Model" Forests 15, no. 5: 750. https://doi.org/10.3390/f15050750
Note that from the first issue of 2016, this journal uses article numbers instead of page numbers. See further details here.