Article

Response of C:N:P Stoichiometry to Phosphorus Addition and Homeostasis of Plant Tissues in a Subtropical Slash Pine Plantation

Jiangxi Provincial Key Laboratory of Silviculture, 2011 Collaboration Innovation Center of Jiangxi Typical Trees Cultivation and Utilization, Jiangxi Agricultural University, Nanchang 330045, China
*
Author to whom correspondence should be addressed.
Forests 2023, 14(7), 1355; https://doi.org/10.3390/f14071355
Submission received: 19 June 2023 / Revised: 25 June 2023 / Accepted: 27 June 2023 / Published: 30 June 2023
(This article belongs to the Topic Plants Nutrients)

Abstract

:
Phosphorus (P) fertilizer is commonly used in subtropical plantations to augment nutrients including carbon (C), nitrogen (N), and P to maintain plants engaged in metabolism. Stoichiometric homeostasis reflects the adaptation of plants to various environments (including P fertilizer supply rates). It is thus of great significance to understand C:N:P stoichiometry in the plant–litter–soil system under P addition and the stoichiometric homeostasis of plant tissues for the P fertilization management of slash pine (Pinus elliottii Engelm) plantations. In subtropical China, we measured the C, N, and P contents in root, branch, needle, litter, and soil in slash pine plantations fertilized with four treatments, P1 (25 kg P ha1 yr1), P2 (50 kg P ha1 yr1), P3 (100 kg P ha1 yr1), and a control (CK), and calculated the stoichiometric homeostasis of plant tissues. The results show that P3 treatment increased the C, N, and P contents of the needle. P2 and P3 treatments increased the P content of the litter and the N:P ratio of the root while decreasing the C:N ratio of the root. P addition treatments increased C and P element accumulation in soil but had no effect on soil stoichiometry. The nutrient contents of needle and branch were higher than those of root and litter, indicating that slash pine was more inclined to allocate nutrients to the aboveground tissues. The stoichiometric homeostasis of C, N, and P among plant tissues was graded as follows: root > branch > needle. The needle’s nutritional homeostasis was C > N > P, with 1/H values of 0.08, 0.34, and 0.74, respectively. These findings demonstrate that during P addition, the C, N, and P stoichiometric homeostasis varied among plant tissues and element types. In conclusion, P application altered nutrient distribution in the plant–litter–soil system, alleviating P restriction in slash pine forests in southern China. P addition levels should be finely adjusted in the future for longer-term observation trials, and the trade-off between P addition rates and economic and ecological advantages should be properly examined.

Graphical Abstract

1. Introduction

Phosphorus (P) is a mineral that is required for plant development and nutrient absorption. It is involved in the creation of the nucleus, cell division and differentiation, the blooming and fruiting of plants, and other physiological metabolic functions [1]. However, P is frequently regarded as a restricting factor in subtropical Chinese wooded ecosystems [2], since it is frequently fixed by some metal oxides and is difficult for plants to directly utilize [3]. P fertilizer application has recently gained popularity as a means to improve plant form and boost yield [4]. Previous studies have suggested that the deposition of P in the form of dust is a viable route for fresh P input to mitigate P constraints in many ecosystems [5]. There is, however, a trade-off between the quantity of P supplied and its advantages. The excess P intake may result in eutrophication and pollution [6]. Therefore, it is critical to investigate the optimal P addition rate for plantations.
The absorption capacity of plants for nutrients is the basis of their material accumulation and determines their morphogenesis. The degree to which plants are able to acquire C, N, and P, in particular, is a direct indication of their capacity to adapt to various conditions [7]. Ecological stoichiometry is considered a tool to measure the relationship between organismic characteristics and ecosystemic chemical elements [8], so as to understand the adaptability of plants to changing environments and the limitations of soil nutrient conditions [9]. C provides a structural basis for plants and constitutes the majority of the dry matter of plants [10]. N and P participate in the synthesis of phosphate and protein and provide energy for material transformation in plants. The synergistic effect of C, N, and P not only affects the function of plants but also affects their function in the ecosystem [11]. C:N:P stoichiometry is associated with the proportions and relationships of C, N, and P in soil and leaves. Soil C:N:P stoichiometry, on the other hand, symbolizes the fertility of the soil and affects plant development and nutritional status [12]. Meanwhile, the ratio of soil C:N:P varies with substrate input in the forest. On the other hand, the C:N:P ratio of leaves varies extensively [13], and the ratio of N to P in leaves reveals the environmental scarcity of N and P [14]. However, scholars have paid more attention to stoichiometry in leaves and less to that in roots and branches due to the limitations of sampling methods [15], and the specific driving mechanism and the interaction between the plant and soil stoichiometry have not been revealed. Moreover, how P addition affects the distribution of C, N, and P in the system of plant tissues, litter, and soil in P-limited areas remains to be elucidated.
Stoichiometric homeostasis, a fundamental notion of stoichiometry, is the ability of lifeforms to respond to changes in their surroundings by regulating the concentrations and ratios of chemical elements and maintaining a relatively stable chemical composition [16]. It is helpful to understand how lifeforms adapt to alterations in their circumstances [17]. The efficiency of stoichiometric homeostasis in living organisms is quantified by calculating the stoichiometric homeostatic coefficient (H), a continuously fluctuating control parameter [16]. A greater value of plant H implies that the nutrient ratio of the plant is more stable [18]. Hence, it is feasible to predict the response of plants to nutrient environments by stoichiometric homeostasis, which also provides a basis for the fertilization of plantations [19]. Existing studies on stoichiometric homeostasis often regard the leaves, soil, and microorganisms as a whole system to analyze their relationships, ignoring the contributions of the branch, root, and litter to stoichiometric homeostasis. In fact, the homeostasis of plant tissues in response to external changes is different [20]. Meanwhile, numerous studies have examined the impact of N addition or N and P additions on plant nutrient levels [18], but there is little information to reflect the homeostasis relationship between plant organs and soil under the addition of P alone. Therefore, it is essential to carry out an in-depth investigation of stoichiometric homeostasis in plant organs (root–branch–leaf), litter and soil under P supply conditions.
The slash pine (Pinus elliottii Engelm), a reforestation tree with rapid growth in southern China, was chosen for our study. In order to explore the C, N, and P contents, as well as stoichiometry and homeostasis, in response to P fertilization in slash pine plantations, samples of plant tissues (including needle, branch, and root), litter, and soil were taken. This study enables us to comprehend the trend of nutrient content and stoichiometric ratio of plant tissues, detritus, and soil at various P addition levels. This will help us choose the optimal P addition treatment to enhance the soil’s nutrient environment and plants’ ability to absorb nutrients. These studies establish a foundation for regulating P fertilization in slash pine forests.
In this study, two hypotheses were proposed: (1) the contents of C, N, and P and stoichiometric proportions have distinct tendencies in the system of plant tissues, litter, and soil responding to variable P supply levels in slash pine plantations; and (2) the stoichiometric homeostasis properties of plants and litter with soil vary among tissues and element types.

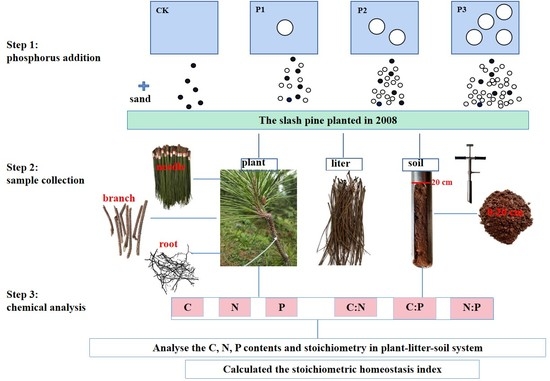
2. Materials and Methods
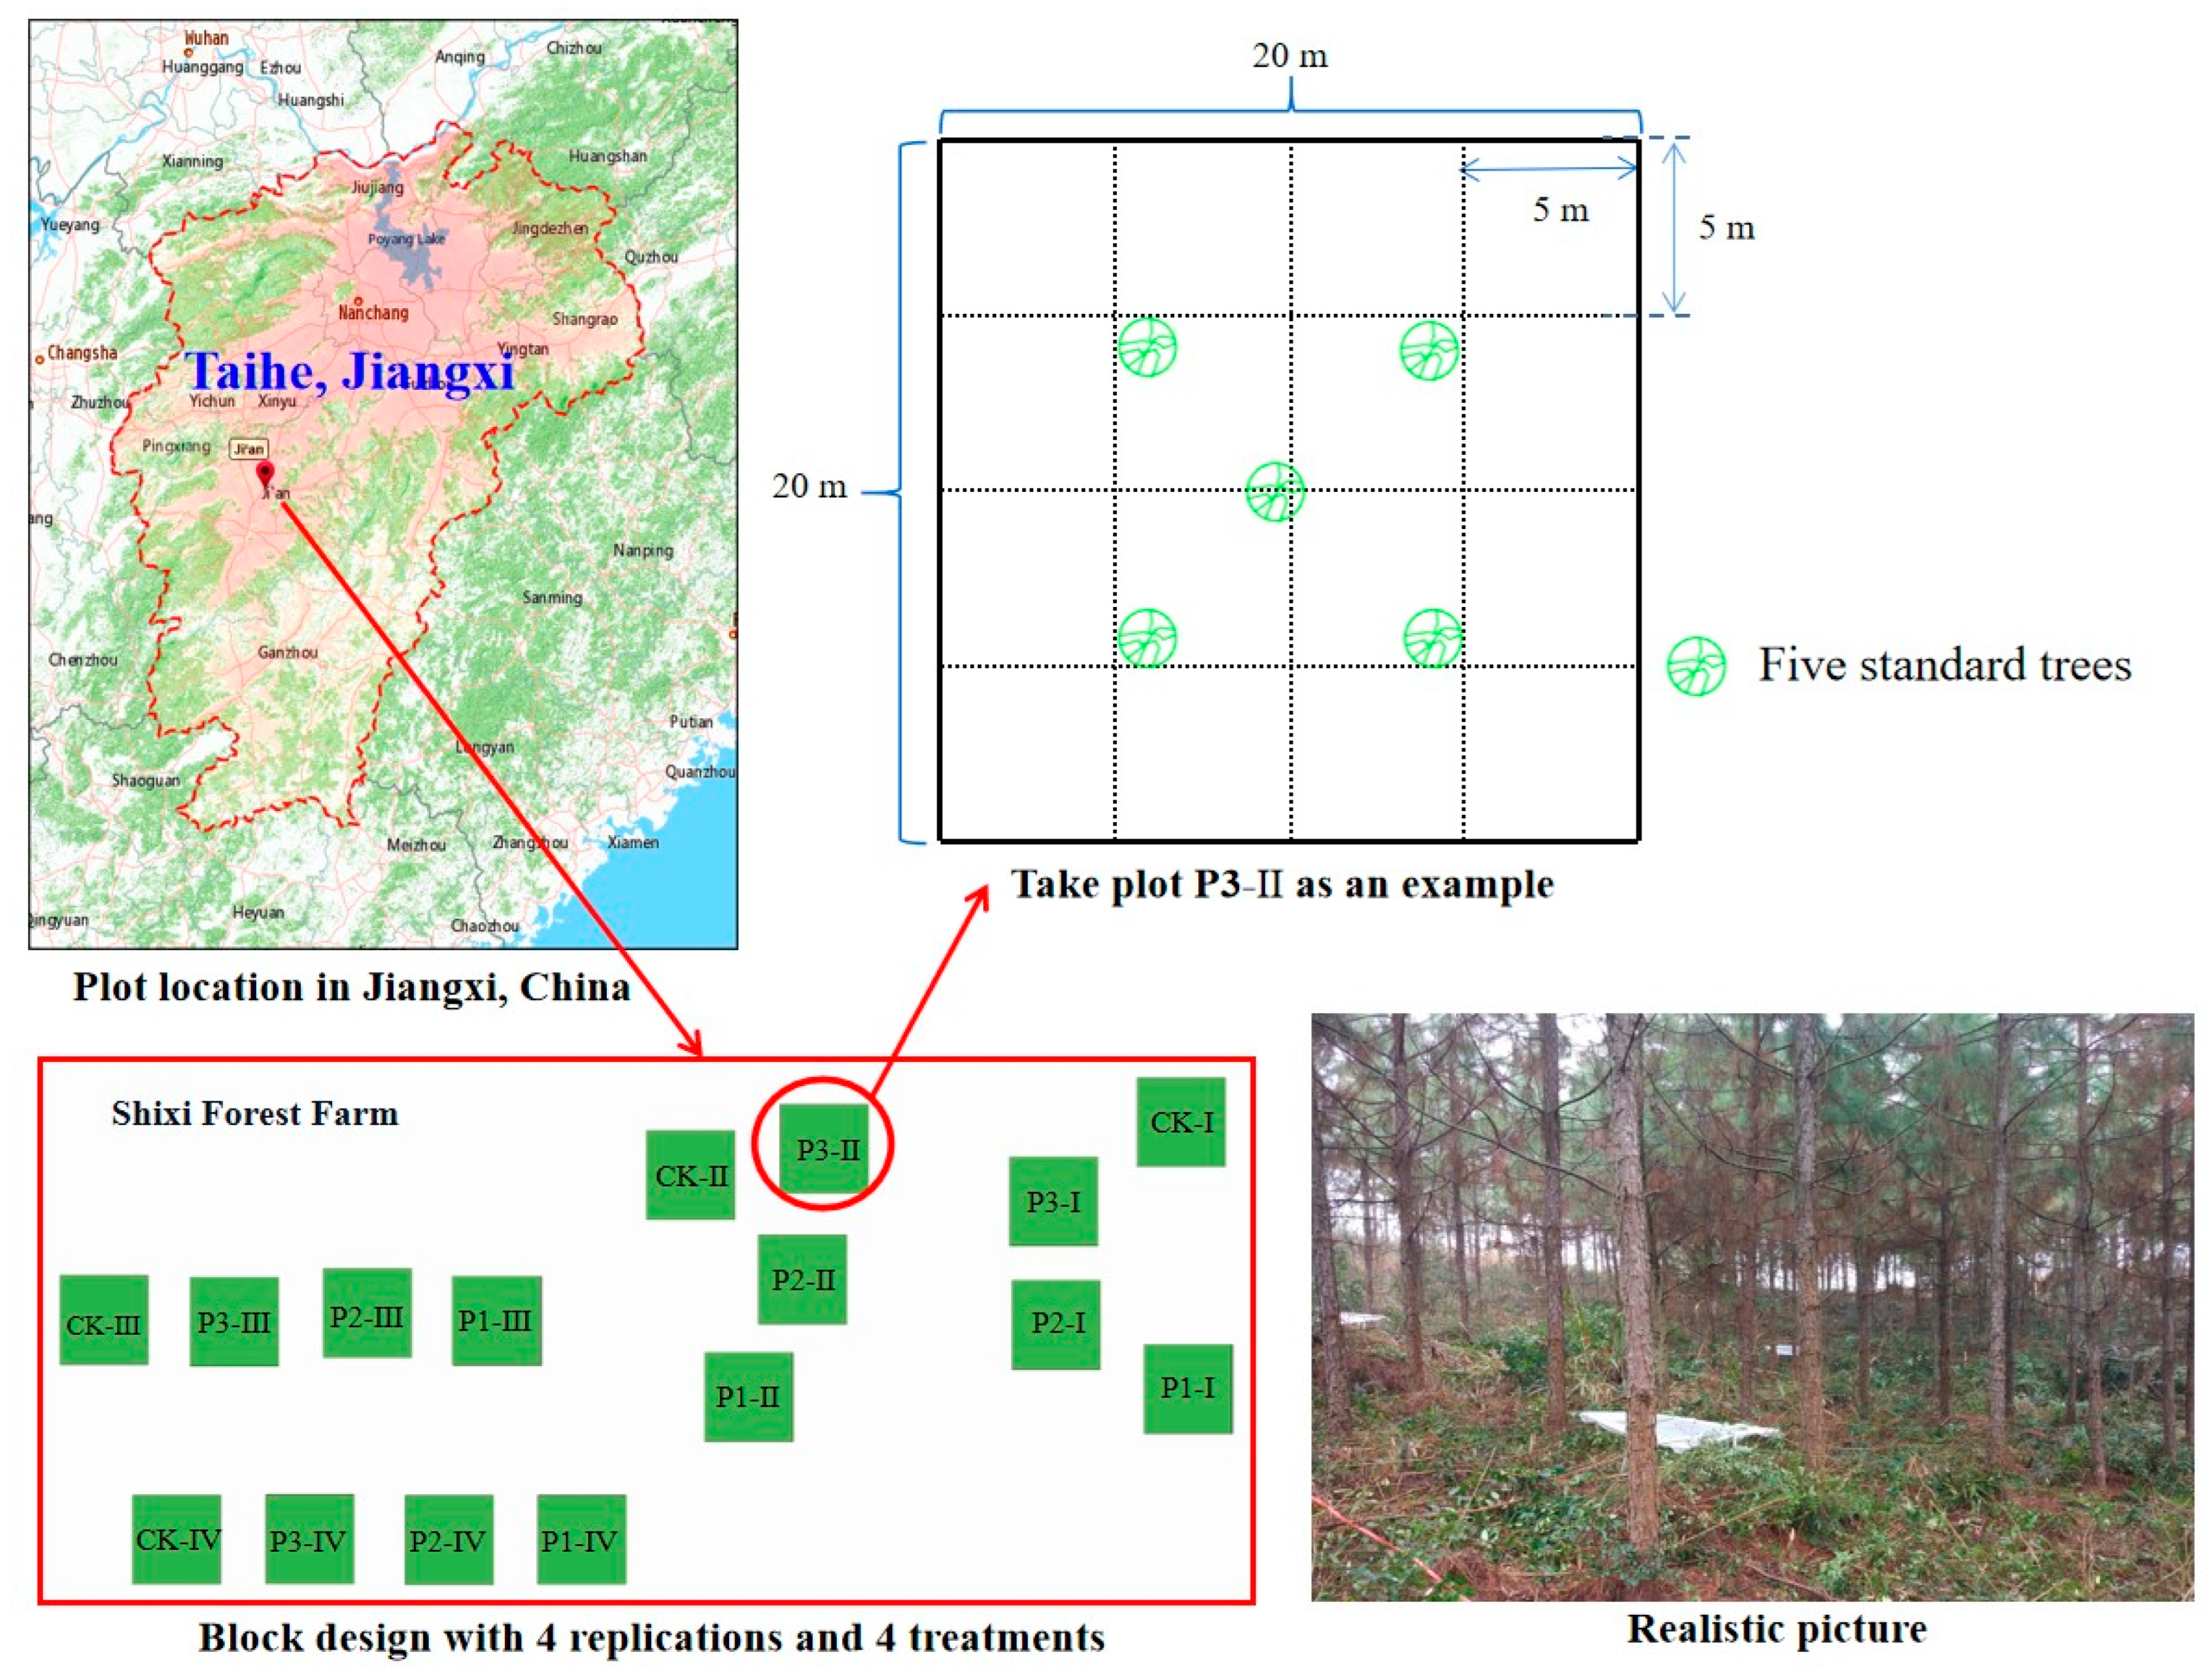
2.1. Study Region

The experiment was operated in a ten-year-old slash pine plantation in Shixi forest farm (26°43’ N, 115°6’ E), Jiangxi Province, China. The average altitude was 80–120 m, and the average slope was 0–8% [21]. The climate of the study area is clearly subtropical wet monsoon, with an annual average of 1458 mm of precipitation and an air temperature of roughly 18.8 °C, and a characteristic low mountain hilly landform with red soil (pH = 4.73). The soil contains 10.19 g kg−1 of organic C, 1.06 g kg−1 of total N, 0.50 g kg−1 of total P, and 2.45 g kg−1 of total potassium (K). The slash pine trees in the plantation were spaced at 2 m by 3 m when they were first planted in 2008, and their average height and DBH were 11.19 m and 13.66 cm, respectively. Under the canopy of the forest, 5%–8% of the area was occupied by some shrubs and herbs.

2.2. Experimental Design

In December 2017, a P fertilization experiment was initiated in a slash pine forest, consisting of a randomized full block with four replicates [21]. In every single square, four 20 m × 20 m plots with the following interventions were randomly arranged: P1 (25 kg P ha1 yr1), P2 (50 kg P ha1 yr1), P3 (100 kg P ha1 yr1), and the control (CK, without P addition) [21]. There was a buffer zone of at least 20 m separating the plots. After removal of miscellaneous shrubs, the P fertilizer was added to each plot twice a year (50% in June and 50% in December) on sunny days by mixing it with clean, dried fine sand [21]. P fertilizer in the form of NaH2PO4·2H2O was applied. Each 20 m × 20 m quadrat was divided into sixteen 5 m × 5 m plots to standardize fertilizer application [22]. Figure 1 shows this study’s plots and sample distribution.

2.3. Sample Collection

Based on the thickness and height of the trees in each plot, five healthy, pest-free trees of standard size and kind were chosen in July 2020 to collect samples. A 20 m retractable pruning shear was used to harvest needle and branch samples from the central regions of the crowns. All of the fine roots with diameters of less than 2 mm were extracted from the top 10 cm of the soil layer. Moreover, litter samples were harvested beneath the canopies of five standard trees in every single plot. After the removal of the litter layer, soil samples from 0 to 20 cm in depth were gathered using 50 mm diameter soil cores in each plot. A total of 400 samples were obtained. In the laboratory, the plant materials were first dried at 115 degrees Celsius for half an hour, and then they were dried at 60 degrees Celsius until they reached a constant weight. Air-dried soil samples were removed from debris and gravel. Then, all samples were pulverized and sent through a sieve with 1 mm apertures to measure the C, N, and P contents.

2.4. Chemical Analysis

We weighed 0.1 g of plant samples and 0.2 g of soil samples into digestion tubes (diameter x length = 40 mm × 300 mm), and then digested the samples with H2SO4-H2O2 and H2SO4-HCIO4-H2O2 at 425 °C, respectively. Based on the Kjeldahl method [23], we made some modifications to determine the N content; molybdenum antimony colorimetry was used to calculate the total amount of P [24]; and the content of total organic C was analyzed by the potassium dichromate–oxidation external heating (by oil bathing) method [25]. Finally, the stoichiometry was computed according to the proportions of C:N:P.
H = lg ( x ) lg ( y ) lg ( c )

2.5. Statistical Analyses

The stoichiometric homeostasis index (H) is calculated as follows [16]:
In the formula, H represents the homeostasis index, x represents the C, N, and P contents and their stoichiometry of soil, and y represents the C, N, and P contents and their stoichiometry of needle, branch, root, and litter. The c stands for the fitting constant. Persson’s method for determining the degree of stoichiometric homeostasis in an organism was utilized [26].
A one-way ANOVA followed by multiple comparisons was used to examine the effects of P addition on the C, N, and P contents and their stoichiometry. The data were analyzed for correlation using Pearson’s correlation method. We conducted principal component analysis (PCA) to comprehend the connections in C:N:P stoichiometry in Canoco 5.0. For the purpose of determining the stoichiometric homeostasis of plant tissues, linear regression analysis was carried out. All of the results reported were significant at the 0.05 level. All of the data were analyzed by SPSS 20.0, and figures were mapped with Origin Pro 2018.

3. Results

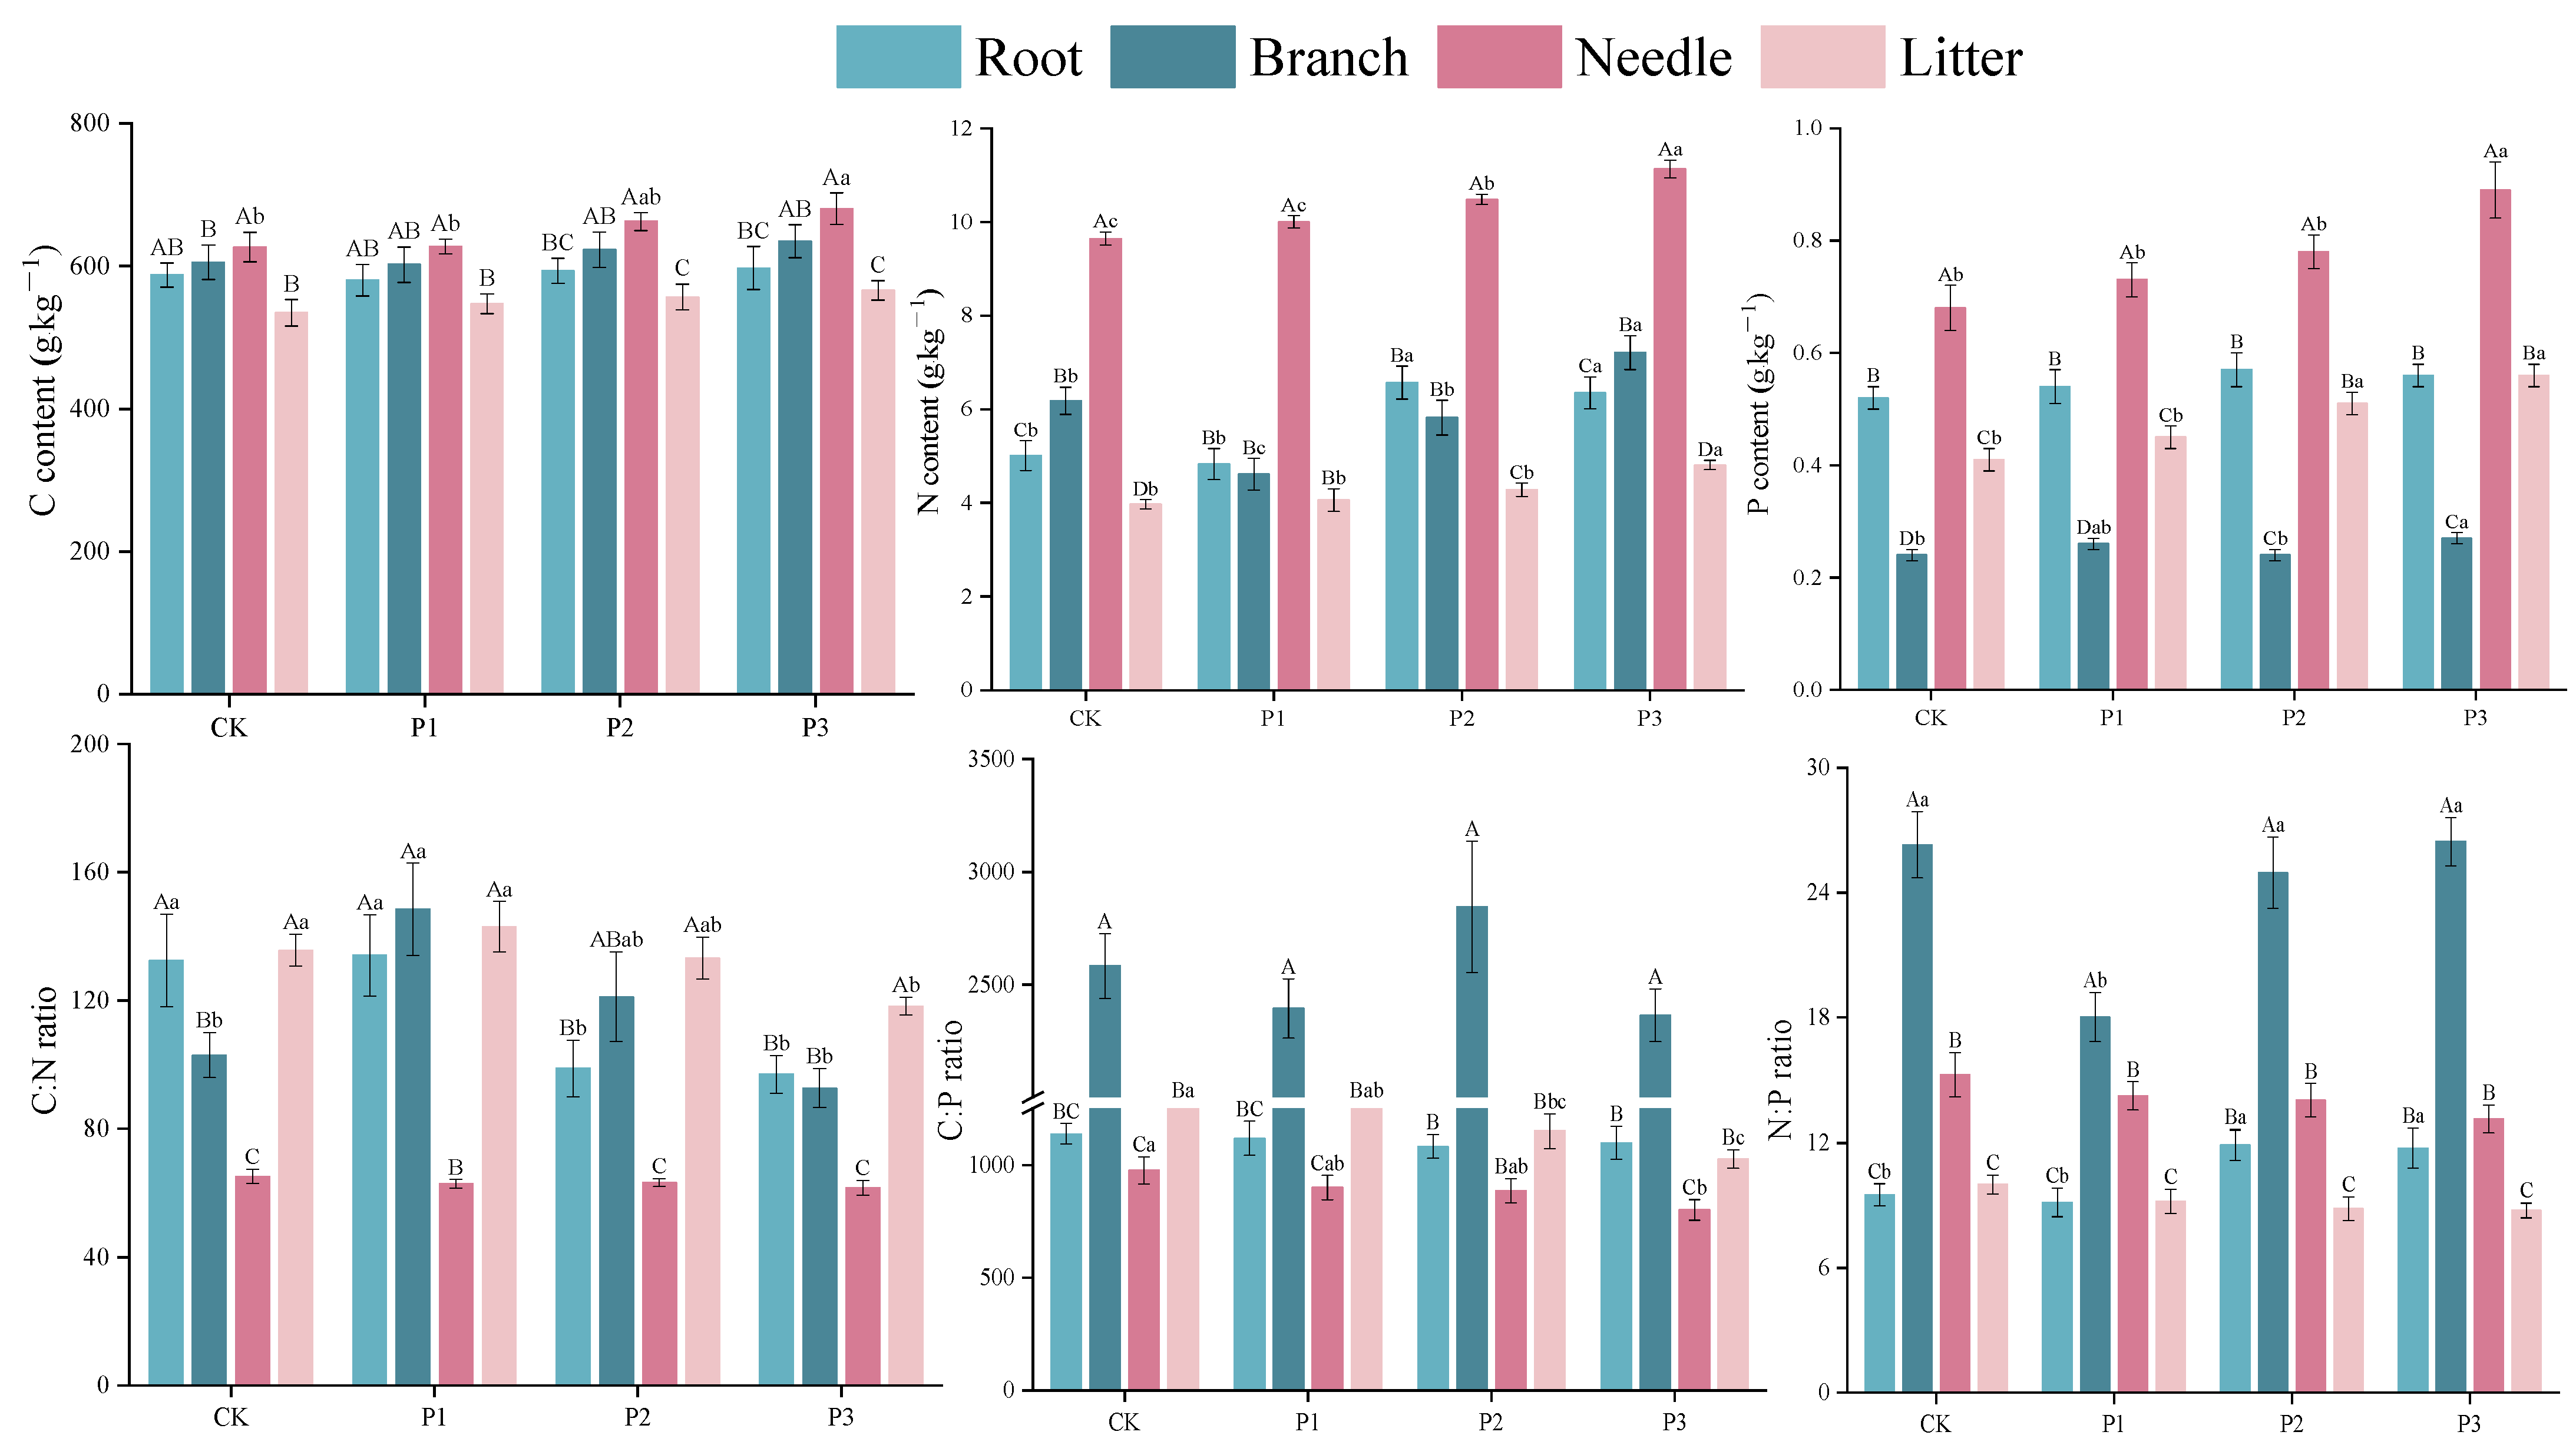
3.1. The Contents of C, N, and P and the C:N:P Stoichiometry in Plant Tissues

For the content of C, P3 treatment only increased the content of C in the needle (p ≤ 0.05). The content of N in the branch, needle, and litter and the content of P in the branch and needle with P3 treatments were vastly larger than those obtained with the other treatments. The content of N in the root and the content of P in the litter with the P2 and P3 treatments were larger than those of the P1 and CK treatments. In addition, the C:N ratio of roots with the P2 and P3 treatments (98.77, 96.93, respectively) was lower than that of the CK and P1 treatments (132.55 and 134.08), while the N:P ratio (11.89, 11.74, respectively) was higher than that of the CK and P1 treatments (9.51 and 9.14) (Figure 2).
The contents of C, N, and P and C:N:P stoichiometry differed across organs (p ≤ 0.01). According to the mean values of the treatments (Figure 2), the contents of C and N in the needle were the highest, followed by branch, and then root and litter. The P content varied from 0.25 g kg−1 to 0.78 g kg−1 in the order needle > root > litter > branch. The C:N proportion in the needle varied from 61.64 to 65.21 and was lower than other tissues. Additionally, the C:P proportion in the branch was 2.86, 2.30, and 2.13 times higher than that of needle, root, and litter, respectively. The N:P proportion in the branch was larger than that in the needle, followed by the litter. (p ≤ 0.05).

3.2. The C, N, and P Contents and the C:N:P Stoichiometry of Soil

With the increase in P addition level, the contents of C, N, and P and the ratio of C:N in the soil all showed an upward trend. Especially in contrast to the treatment of CK, P3 treatment improved the contents of C and P (p0.05). However, soil N and the proportion of C:N, C:P, and N:P showed no distinction among various treatments (p > 0.05). The C:P ratio of the soil was the highest with P2 treatment, at 18.04. The C:N ratio was the highest at 14.13, while the N:P ratio was the lowest at 1.29 with the P3 treatment (Table 1).

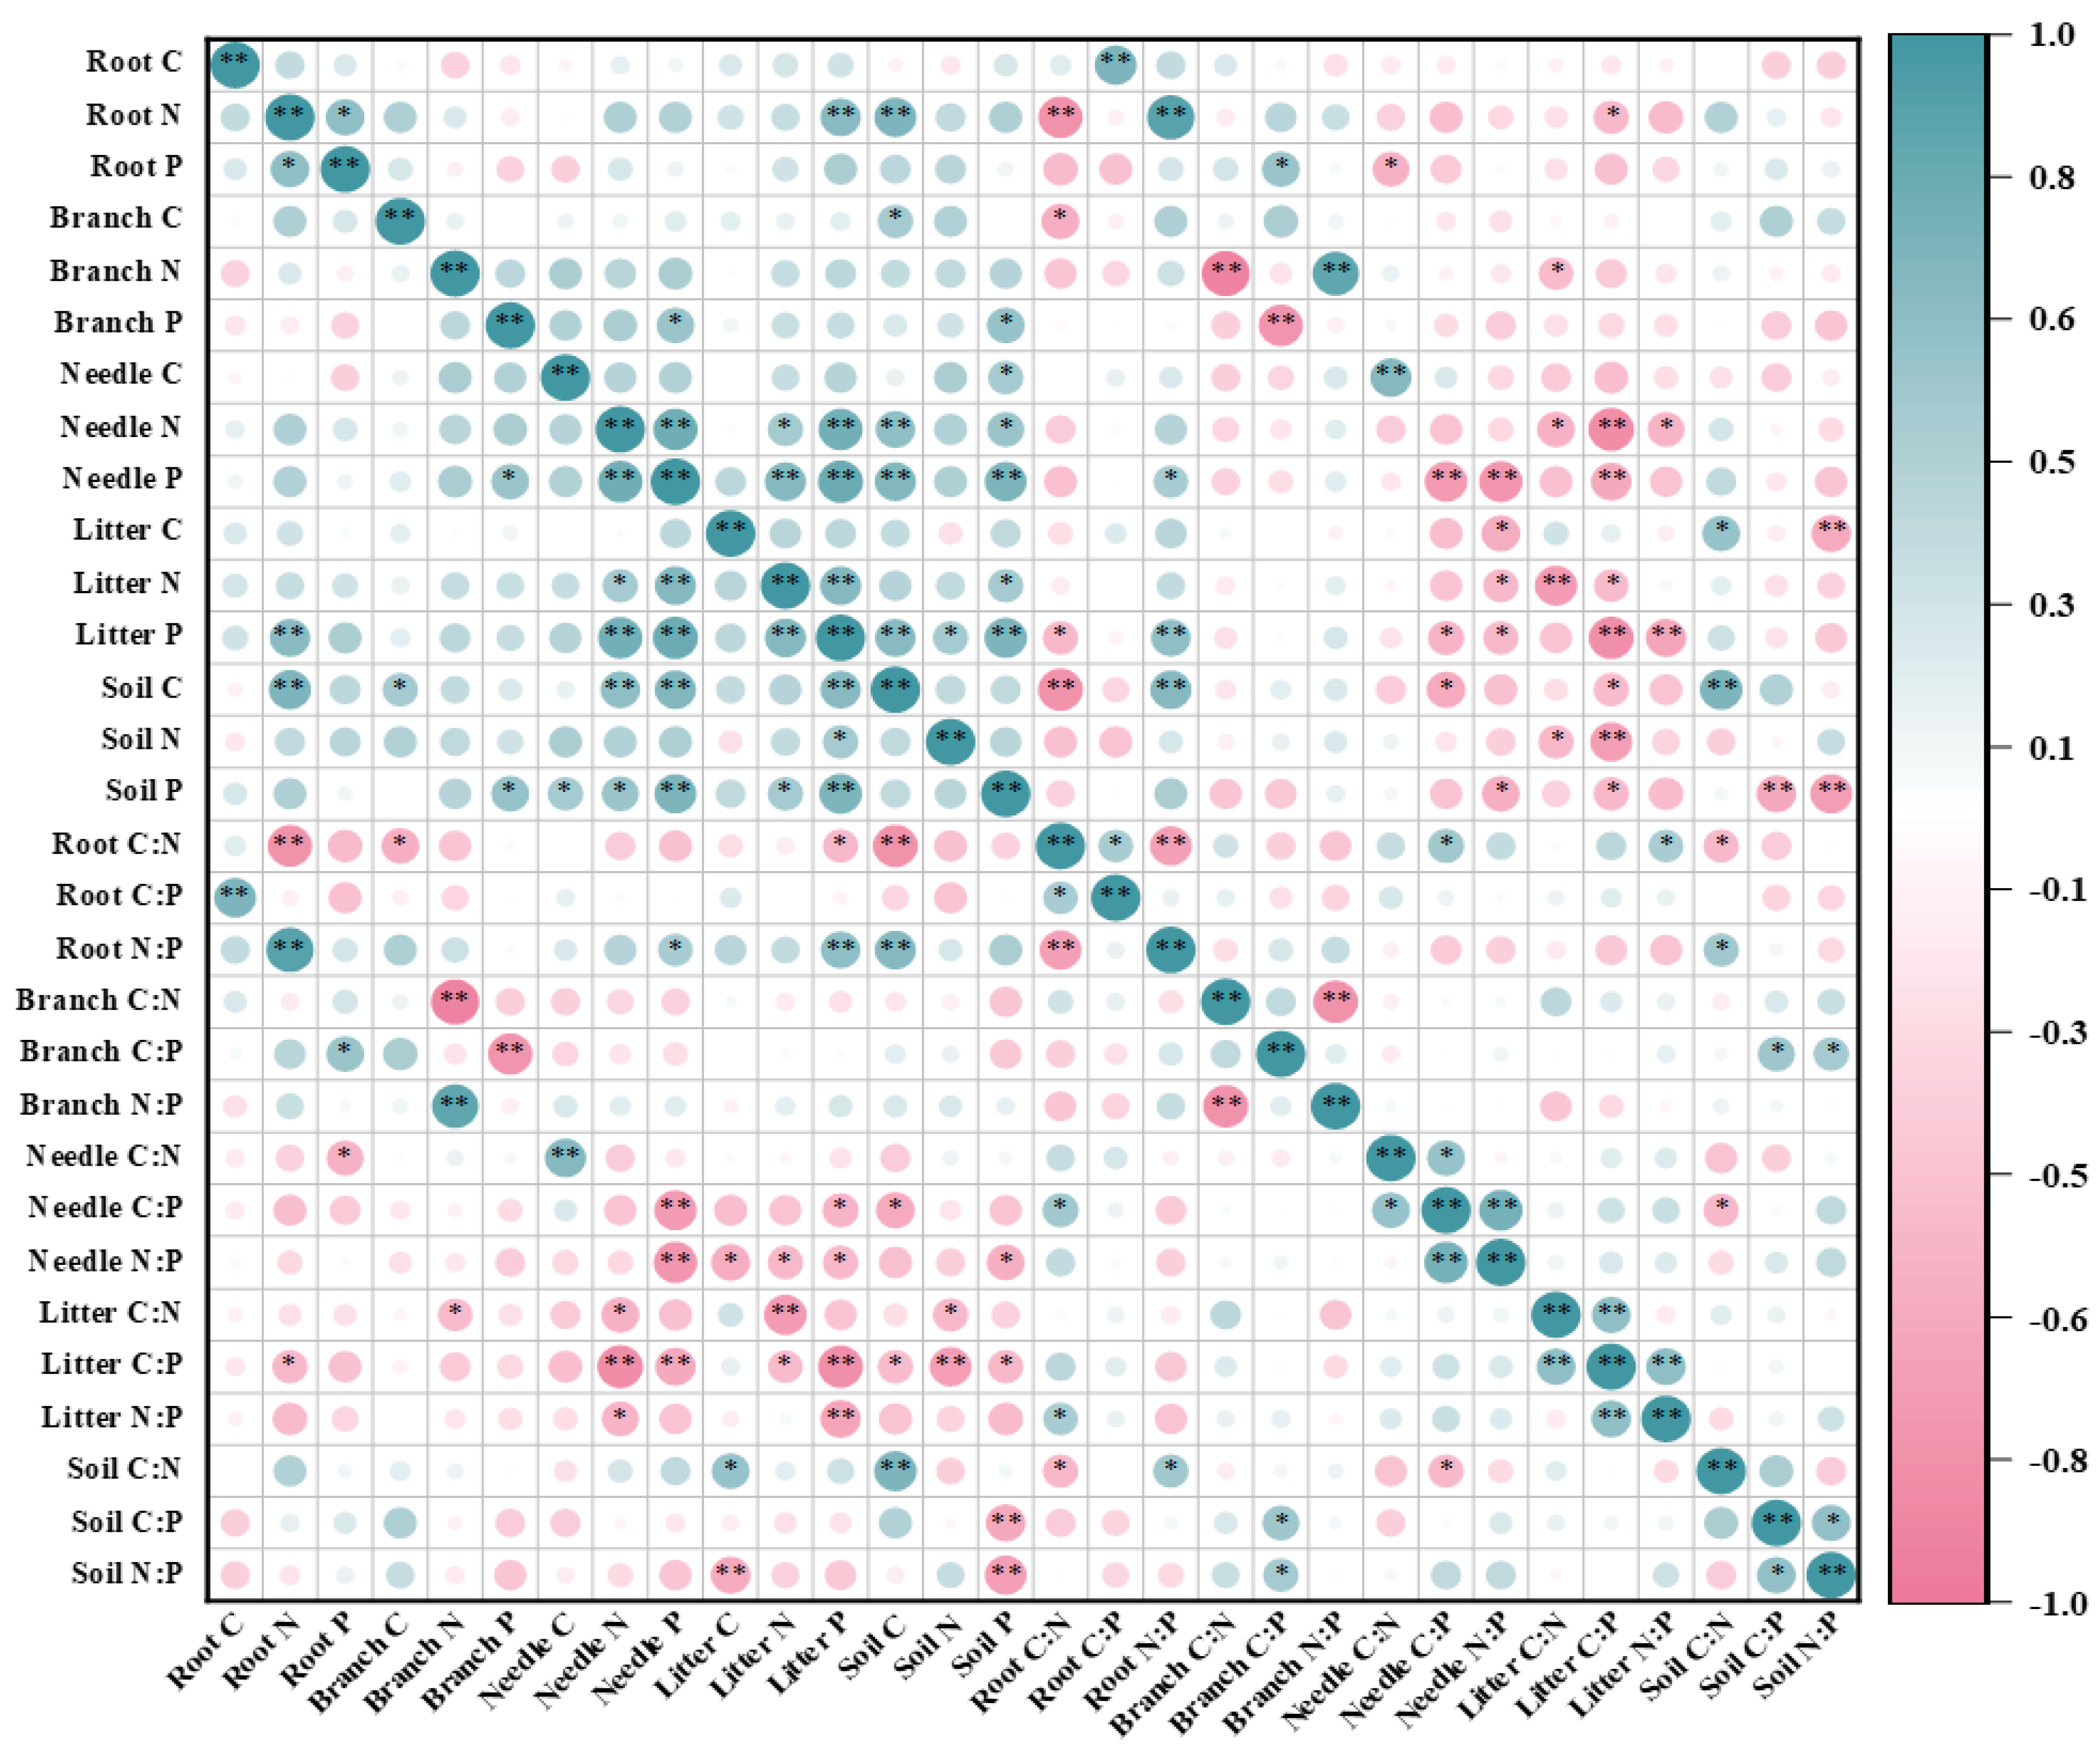
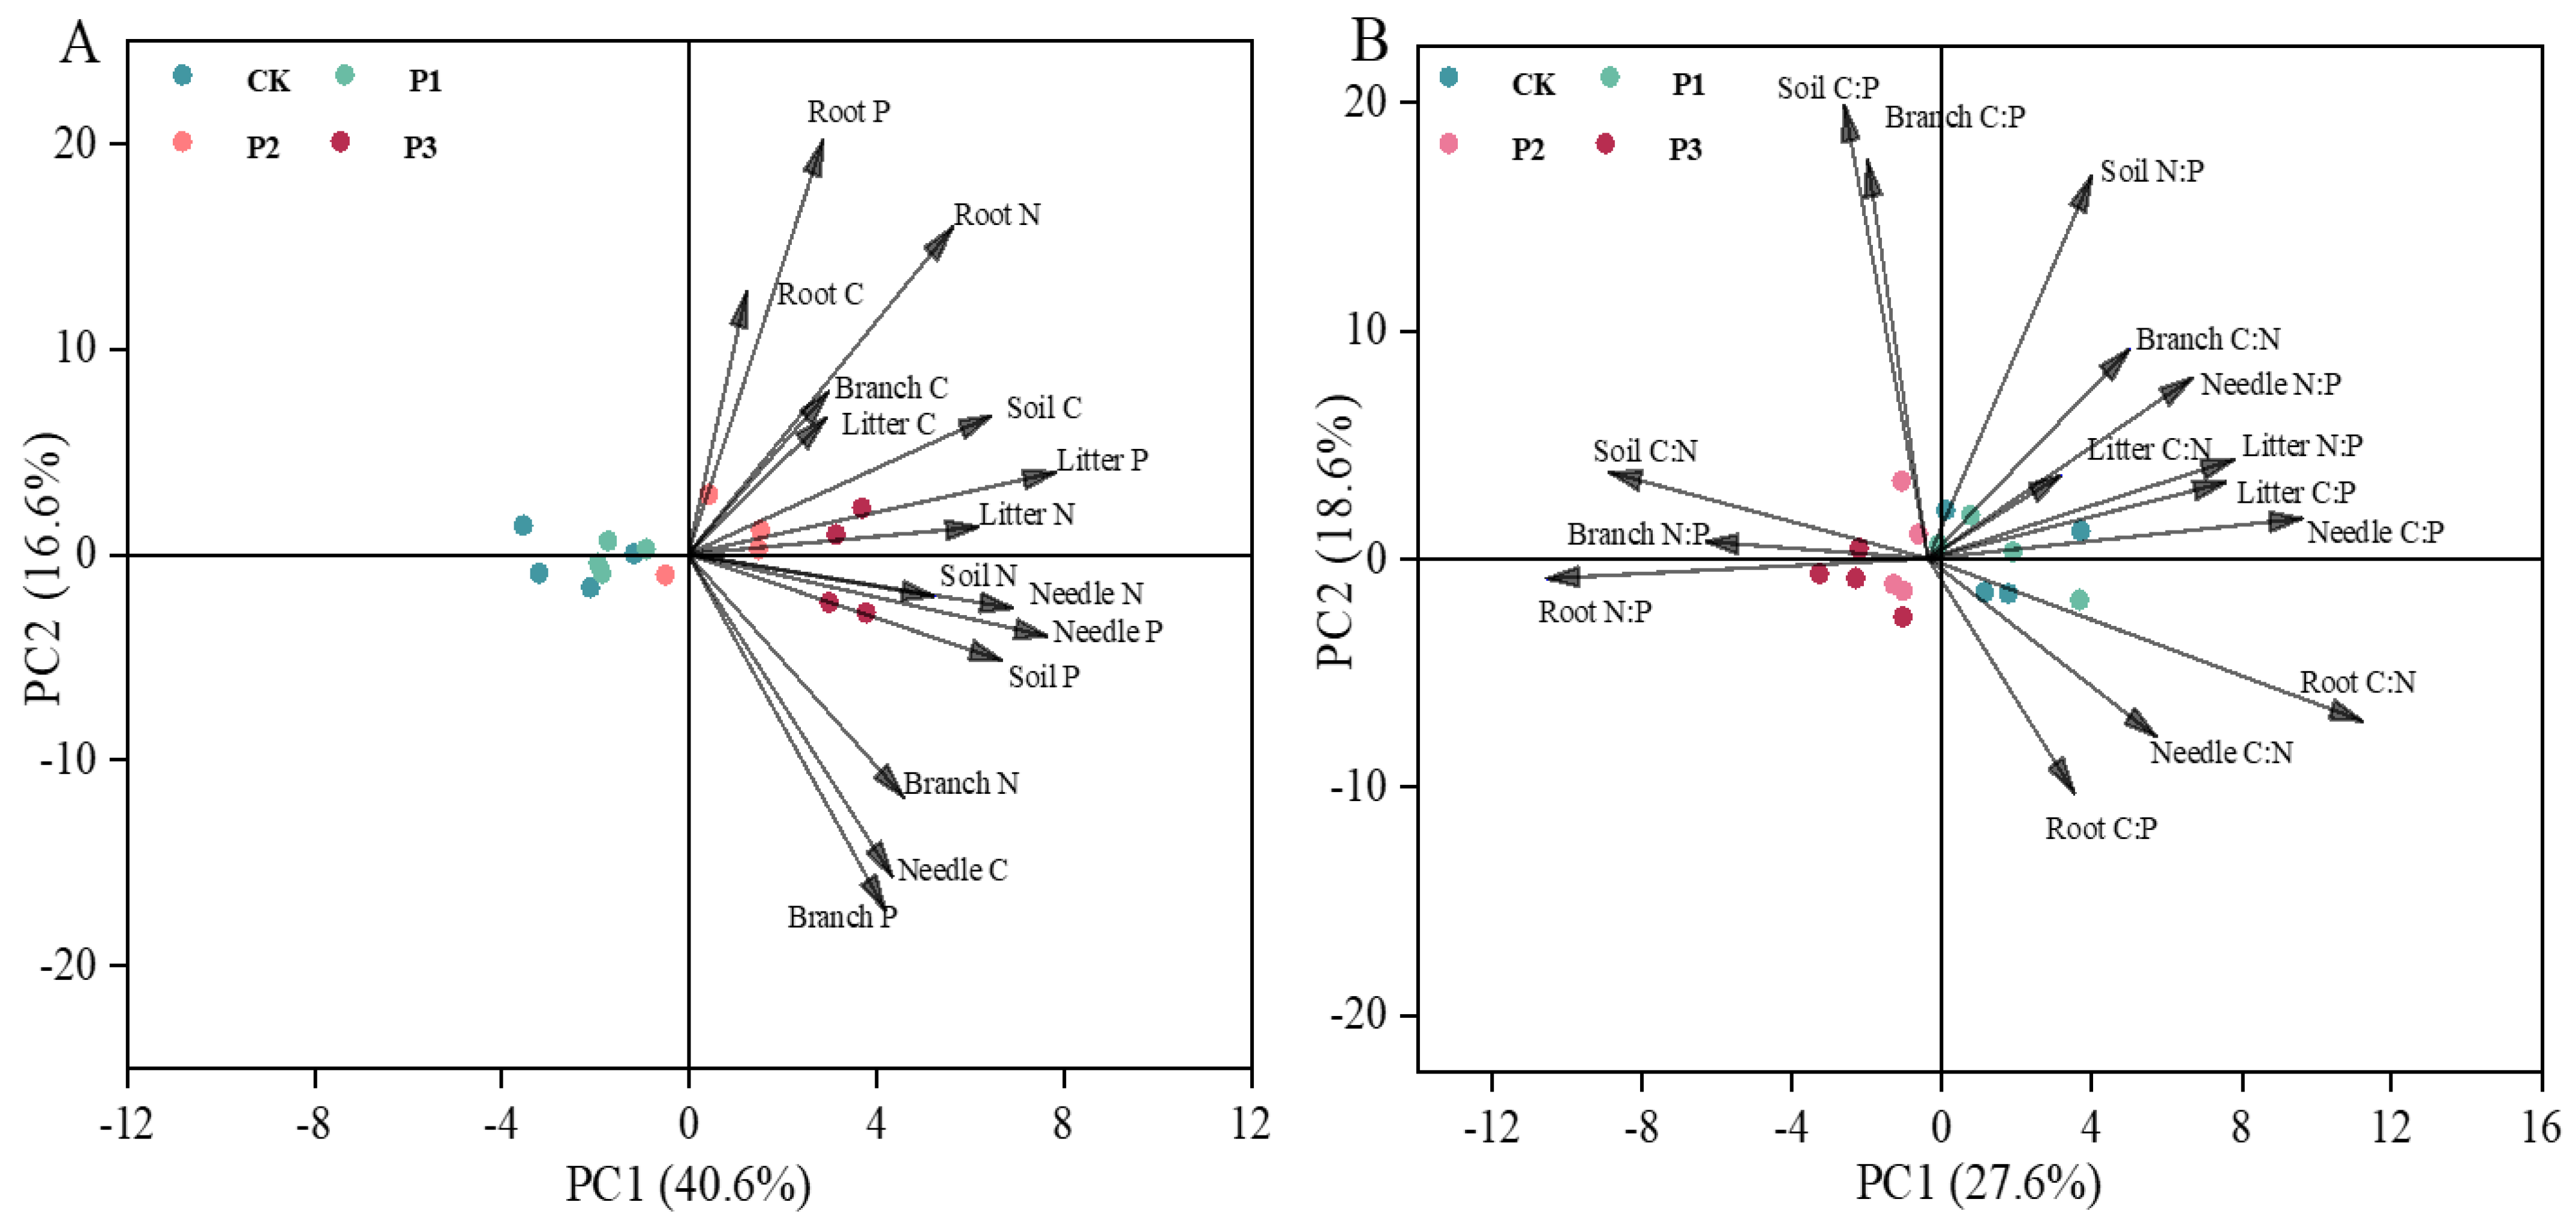
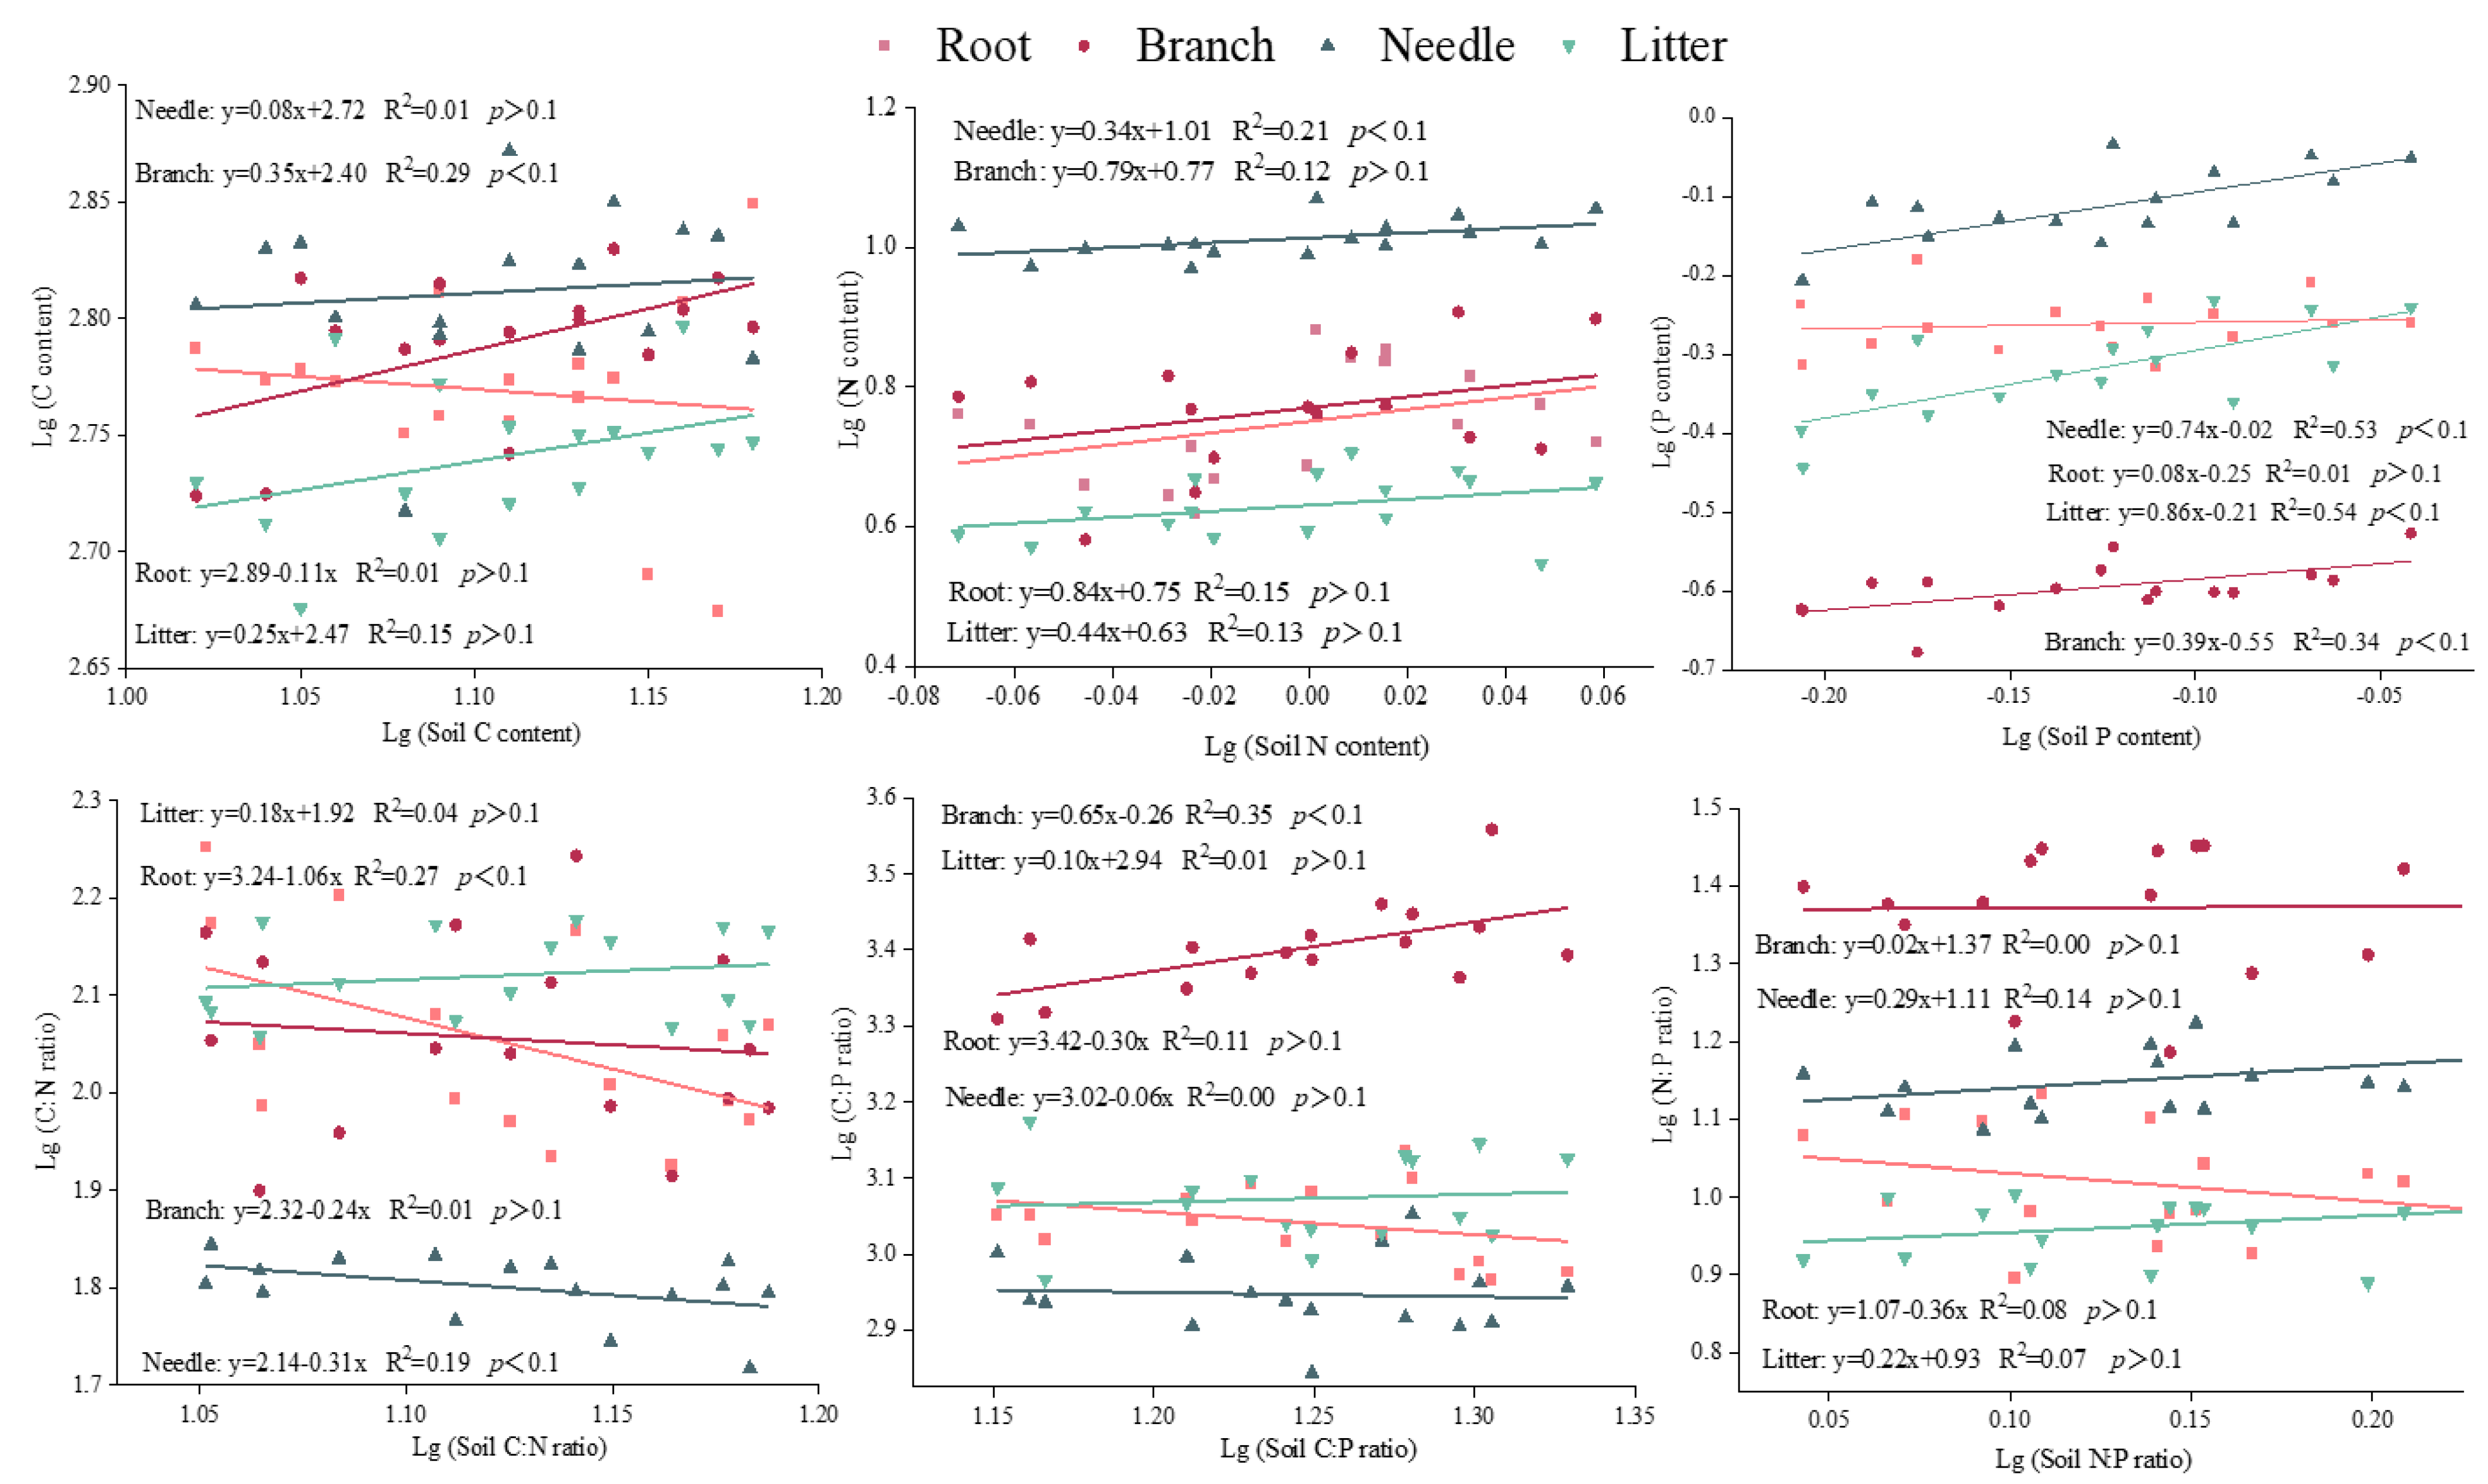
3.3. Relationships of C, N, and P Contents and Stoichiometry

Overall, the contents of C, N, and P in branch and needle were positively correlated with the C, N, and P contents of soil (Figure 3). Specifically, the N and P contents of needle were positively correlated with the C and P contents of soil. In addition, the relationship between the C:N:P ratios of litter and needle and the C, N, and P contents of soil were negatively correlated. The principal component analysis (PCA) showed that the N and P contents of needle and litter were correlated with the C and P contents of soil in the plant–litter–soil system with the P2 and P3 treatments. Moreover, the soil N had a positive influence on the needle N content (Figure 4A). The C:P and N:P ratios of litter were positively correlated with the C:P and N:P ratios of needle, while the C:N and N:P ratios of root were negatively correlated with the C:N and N:P ratios of branch (Figure 4B).

3.4. Stoichiometric Homeostasis

The C of needle, root, and litter, the N of branch, root, and litter, the P of root, the C:N ratio of branch and litter, the C:P ratio of root, needle, and litter, and the N:P ratio of all tissues were categorized as “strictly homeostasis” (p > 0.1) (Figure 5). The root C:N ratio showed no homeostasis with 1/H = 1.06. Moreover, the P of needle and the C:P ratio of branch were “weakly plastic”, with 1/H of 0.74 and 0.65, respectively. The homeostasis of litter P was 0.86 and was identified as “plastic”. The HN, HC:N of needle, and HC, HP of branch ranged from 0.31 to 0.39. Thus, they were also classified as “weakly homeostatic”.

4. Discussion

4.1. The C, N, and P Contents and Stoichiometry

The C, N, and P contents of plant tissues reflect the capacity of plants to absorb and store nutrients [27], as well as the distribution strategy of nutrients among organs when plants respond to various soil environments [28]. As the activity center of photosynthesis, the nutrient content of leaves is always of concern. In this study, the average contents of C, N, and P in the needle were 649.59 g·kg−1, 10.31 g·kg−1, and 0.77 g·kg−1, respectively, which were the highest compared to other tissues. Needles are often considered a source organ [29]. Carbohydrates and proteins containing C, N, and P elements produced by photosynthesis are temporarily stored in needles to maintain cellular metabolic activities [30]. In addition, the branch C (616.60 g·kg−1) and N (5.95 g·kg−1) contents were higher than those in the root, indicating that pines were more inclined to allocate nutrients to aboveground tissues. Roots transport nutrients to the needle along the trunk and branch after absorbing nutrients from the soil, providing sufficient nutrients for photosynthesis. This is in line with the principle of the priority distribution of nutrients [31], that is, plants prefer to allocate more nutrients to tissues in need. The litter C (551.41 g·kg−1) and N (4.28 g·kg−1) contents were much lower than those in other plant tissues. This seems to be caused by the nutrient return strategy of plants. The litter transferred its own nutrients to other tissues before aging and falling [32]. Simultaneously, the litter provided abundant carbon sources for soil microorganisms, which accelerated the decomposition of nutrients and finally returned the decomposed nutrients to the soil [33]. The complex strategy of nutrient allocation among plant tissues is beneficial for plants to adapt to the changing environment.
Plant ecological stoichiometry emphasizes the relationships among the main elements C, N, and P in plants [34] and reveals the adjustment mechanism of the nutrient proportions in the plant–litter–soil system. The C:N and C:P ratios of needle were 61.64–65.21 and 801.82–976.95, respectively, which were higher than the average level (40.40, 728.00) of coniferous forests in subtropical regions [35]. This result indicates that Pinus elliottii in the study area has a stronger ability to assimilate C than other conifer species. Compared with the CK, the P2 and P3 treatments reduced the C:N ratios of root and litter, which seems to indicate that the P2 and P3 addition levels accelerate the transport of C elements from root to other tissues and expedite the decomposition of C elements in litter. The N:P ratio of leaves was used as an indicator to measure the demand for N and P in ecosystems [36]. In this study, the C:P and N:P ratios of the needle were 801.82–976.95 and 13.13–15.25, respectively, which decreased gradually with the increase in P addition level. The plant growth rate hypothesis [37] suggests that plants adapt to their own growth rate by regulating the distribution of C:N:P during growth and development. Generally, the growth rate is negatively correlated with C:P and C:N ratios [37]. The results of this study were consistent with this hypothesis because the positive correlation between growth rate and P addition level has been confirmed in our published studies [21]. According to the N:P threshold hypothesis [38], it was judged that the P limitation of the Pinus elliottii plantation was alleviated with the increase in P addition level. However, the factors affecting plant N:P ratio are complex [39], and it is unreliable to evaluate the limiting elements in plant growth with a single index. The limiting elements of the ecosystem should be determined by a long-term experiment combined with soil environmental conditions and the ability of other associated tree species to absorb nutrients.
The mean values of soil C, N, and P contents under different treatments were 12.88 g·kg−1, 0.99 g·kg−1 and 0.75 g·kg−1, respectively. The C and P contents were higher than the national average (11.12 g·kg−1 and 0.65 g·kg−1), and the N content was lower than the national average (1.06 g·kg−1) [40]. In addition, with the increase in P addition levels, the contents of soil C and P increased gradually, indicating that P addition promoted the accumulation of C and P elements in soil. There were two potential explanations. On the one hand, P addition accelerated the growth and spread of free-living bacteria and increased the activity of microorganisms. Active microorganisms accelerated the rate of decomposition of organic carbon, which promoted the accumulation of soil carbon and increased the availability of N and P in the soil [4]. On the other hand, P addition increased phosphatase activity, which in turn promoted the decomposition of litter, resulting in the continuous release of C, N, and P elements from the primary substrate of litter into the soil [41], thereby increasing the C, N, and P content in the soil.
The stoichiometric ratio of soil is used to evaluate soil quality [42]. The results of this study indicate that the average value of C:N ratio was 13.37, which was higher than the national average level (11.09) [40], indicating that the soil N mineralization ability was strong in the study area. The soil C:P (17.74) was much lower than the national average (61.00) [40]. We speculate that the results are related to our research object. We selected the slash pine in the middle-aged forest stage, which is the stage of rapid growth. The activity of soil microorganisms at this stage is relatively complex and can release more P elements from organic matter.
In addition, the stoichiometric ratio of soil is a very complex concept and is also affected by many factors [18]. For example, the species of tree [43], the age of the forests [44], and the ratio of fungi to bacteria [45] were essential determinates of soil C:N:P stoichiometry. The results show that the response of the soil C:N:P stoichiometry to P addition did not change significantly with the P application rates, which indicated that the effects of P addition on soil C:N:P stoichiometry show stability across various treatments and the same climatic conditions. This agrees well with the strategy of soil C:N:P stoichiometry for drought [20]. Moreover, this result may be due to the short duration of the experiment, and the effect of P addition on soil environmental improvement is not obvious. In the future, long-term observation experiments should be carried out to understand the improvement effect of P addition on soil C:N:P stoichiometry.

4.2. Stoichiometric Homeostasis

In response to changes in the soil nutrient environment, plant tissues maintain the stability of chemical composition in their bodies through homeostasis regulation [17]. This process is thought to have complex regulatory mechanisms that change with tree species and tree age [43]. Our results show that the stoichiometric homeostasis of elements and stoichiometric ratios vary among plant tissues, which means that there is a trade-off between nutrient uptake and distribution [46]. This verifies our second hypothesis that the stoichiometric homeostasis characteristics of plants and litter with soil differ among plant tissues and element types. In the study, the C, N, and P contents of the root were defined as “strictly homeostasis”, and the root was more stable than the branch and needle, indicating that the root of slash pine had stronger C, N, and P homeostasis in response to P addition, while the flexible homeostasis of the needle made it easier to identify the absorption and limitation of nutrients. This seems to be the reason why scholars usually use leaf stoichiometry to determine nutrient-limiting elements. However, different from our previous results, the roots had worse homeostasis than branches and leaves in response to different age states [44]. It is verified again that the homeostasis of plant tissues is not only related to the soil nutrients in the environment but is also affected by the growth stage of trees.
As the main organ of photosynthesis in pines, needles are important for tree growth and the accumulation of biomass [18]; thus, their nutrient content is limited to a certain range to provide the best physiological traits for organisms [47]. In this study, the order of C, N, and P homeostasis in the needle was C > N > P, and the P homeostasis of the needle was “weakly plastic”. This mechanism of homeostasis seems to be determined by the distribution characteristics of elements in organisms. The C content constitutes the plant skeleton in vivo, with the most stable distribution. P is a limiting element in the subtropical region of southern China, and the P content in needles is more active when dealing with the addition of P. Meanwhile, this shows that the homeostasis of elements with more content in the organism is higher than that of elements with less content.
Compared with C, N, or P alone, the C:N:P stoichiometric homeostasis can better reflect the nutrient consumption and nutrient storage capacity during plant growth [48]. In the present study, except for the C:P of branch and the C:N of needle and root, the C:N:P stoichiometric homeostasis in other tissues was characterized as “strictly homeostatic”. In particular, the N:P homeostasis in all tissues was “strictly homeostatic”. This may be because the N:P ratio is an important indicator of nutrient limitation in plant growth [40]. Only when soil nutrient elements are scarce will the N:P ratio of plant tissues fluctuate greatly and show poor homeostasis. In addition, the high N:P homeostasis in plant tissues also reflects that the nutrient limitation was relatively stable under the condition of P addition in this study area.

5. Conclusions

P addition improved the C content of needle and the N and P contents of each tissue (except the P content of roots). Specifically, P3 addition increased the C, N, and P contents of the needle. P2 and P3 treatments increased the P content of the litter and the N:P ratio of the root while decreasing the C:N ratio of the root. Additionally, P addition encouraged the accumulation of C and P contents in the soil while having no impact on the stoichiometry of the soil. In summary, the C, N, and P contents and their stoichiometry in the plant–litter–soil system displayed various tendencies at different levels of P addition.
The nutrient contents of needle and branch were higher than those of root and litter, indicating that slash pine was more inclined to allocate nutrients to the aboveground tissues. The C, N, and P stoichiometric homeostasis among plant tissues were ranked as root > branch > needle, which indicated that needle has a more sensitive response to the soil environment compared with root and branch. Except for the “plastic” nature of P homeostasis in litter, the stoichiometric homeostasis of other indicators was defined as “strictly homeostasis”. These findings demonstrate that the C, N, and P stoichiometric homeostasis varied among plant tissues and element types under P addition. Future long-term observation investigations should set more precise P addition levels that fully take into account the trade-off between the level of P addition and its benefits to the economy and ecosystem.

Author Contributions

L.Z. (Lu Zhang) conceived the idea, designed the experiment, and authored or reviewed drafts of the paper. T.J. performed the experiment, analyzed the data, prepared figures and tables, and wrote drafts of the paper. M.Y. and F.C. optimized the details of the experiment and modified the manuscript. C.J., Z.N., L.Z. (Linjin Zhou) and J.X. took responsibility for the sample collection. M.L. modified the manuscript. All authors have read and agreed to the published version of the manuscript.

Funding

This study was financially supported by the National Key R&D Program of China during 13th Five-Year Period (2017YFD0600502-5) and the Jiangxi Forestry Science and Technology Innovation Project (201811).

Data Availability Statement

Not applicable.

Acknowledgments

We are grateful to the 2011 Collaborative Innovation Center of Jiangxi Typical Trees Cultivation and Utilization; Jiangxi Provincial Key Laboratory of Silviculture; and the College of Forestry, Jiangxi Agricultural University.

Conflicts of Interest

The authors declare that they have no known competing financial interests or personal relationships that could have appeared to influence the work reported in this paper.

References

  1. Liu, X.; Wang, T.; Song, J.C. Effects of different application amont of phosphorus fertilizer on olive growth and rhizosphere soil micro environment. Soil Fert. Sci. Chin. 2021, 11, 1–13. [Google Scholar]
  2. Hou, E.Q.; Luo, Y.Q.; Kuang, Y.W.; Chen, C.R.; Wen, D.Z. Global meta-analysis shows pervasive phosphorus limitation of above ground plant production in natural terrestrial ecosystems. Nat. Commun. 2020, 11, 637. [Google Scholar] [CrossRef] [Green Version]
  3. Turner, B.L.; Brenes-Arguedas, T.; Condit, R. Pervasive phosphorus limitation of tree species but not communities in tropical forests. Nature 2018, 555, 367–370. [Google Scholar] [CrossRef]
  4. Mirriam, A.; Mugwe, J.; Raza, M.A.; Seleiman, M.F.; Maitra, S.; Gitari, H.H. Aggrandizing soybean yield, phosphorus use efficiency and economic returns under phosphatic fertilizer application and inoculation with Bradyrhizobium. J. Soil Sci. Plant Nutr. 2022, 22, 5086–5098. [Google Scholar] [CrossRef]
  5. Zhu, J.X.; Wang, Q.F.; He, N.P.; Smith, M.D.; Elser, J.J.; Du, J.Q.; Yuan, G.F.; Yu, G.R.; Yu, Q. Imbalanced atmospheric nitrogen and phosphorus depositions in China: Implications for nutrient limitation. J. Geophys. Res. Biogeosci. 2016, 121, 1605–1616. [Google Scholar] [CrossRef]
  6. Cheng, Y.T.; Li, P.; Xu, G.C.; Li, Z.B.; Gao, H.D.; Zhao, B.H.; Wang, T.; Wang, F.C.; Cheng, S.D. Effects of soil erosion and land use on spatial distribution of soil total phosphorus in a small watershed on the Loess Plateau, China. Soil Till. Res. 2018, 184, 142–152. [Google Scholar] [CrossRef]
  7. Chapin, F.S., III. The mineral nutrition of wild plants. Annu. Rev. Ecol. Syst. 1980, 11, 233–260. [Google Scholar] [CrossRef]
  8. Wang, P.A.; Ren, X.M.; Bao, F.J. Analysis of soil stoichiometric characteristics and soil physical and chemical properties of different forests in Guandi Mountain. J. Shanxi Agric. Sci. 2020, 48, 956–963. [Google Scholar]
  9. Elser, J.J.; Hamilton, A. Stoichiometry and the new biology: The future is now. PLoS Biol. 2007, 5, e181. [Google Scholar] [CrossRef] [Green Version]
  10. Yu, Y.H.; Zheng, W.; Zhong, X.P.; Bin, Y. Stoichiometric characteristics of carbon, nitrogen and phosphorus in Zanthoxylum planispinum var. Dintanensis plantation of different ages. Agron. J. 2020, 113, 685–695. [Google Scholar]
  11. Zhou, J.; Wang, Q.G. Research progress on the effect of nitrogen addition on main functional characters of early spring herbaceous plants. Int. J. Ecol. 2021, 10, 129–137. [Google Scholar] [CrossRef]
  12. Bui, E.N.; Henderson, B.L. C:N:P stoichiometry in Australian soils with respect to vegetation and environmental factors. Plant Soil 2013, 373, 553–568. [Google Scholar] [CrossRef]
  13. Elser, J.J.; Fagan, W.F.; Denno, R.F.; Dobberfuhl, D.R.; Folarin, A.; Huberty, A.; Interlandi, S.; Kilham, S.S.; McCauley, E.; Schulz, K.L.; et al. Nutritional constraints in terrestrial and freshwater food webs. Nature 2000, 408, 578–580. [Google Scholar] [CrossRef]
  14. Zhang, W.; Liu, W.C.; Xu, M.P.; Deng, J.; Han, X.H.; Yang, G.H.; Feng, Y.Z.; Ren, G.X. Response of forest growth to C:N:P stoichiometry in plants and soils during Robinia pseudoacacia afforestation on the Loess Plateau, China. Geoderma 2019, 337, 280–289. [Google Scholar] [CrossRef]
  15. Tian, D.; Yan, Z.B.; Fang, J.Y. Review on characteristics and main hypotheses of plant ecological stoichiometry. Chin. J. Plant Ecol. 2021, 45, 682–713. [Google Scholar] [CrossRef]
  16. Sterner, R.; Elser, J. Ecological Stoichiometry: The Biology of Elements from Molecules to the Biosphere; Princeton University Press: Princeton, NJ, USA, 2003; Volume 25, p. 1183. [Google Scholar]
  17. Yu, Q.; Elser, J.J.; He, N.P.; Wu, H.H.; Chen, Q.S.; Zhang, G.M.; Han, X.G. Stoichiometric homeostasis of vascular plants in the Inner Mongolia grassland. Oecologia 2011, 166, 1–10. [Google Scholar] [CrossRef] [PubMed]
  18. Wang, J.Y.; Wang, J.N.; Guo, W.H.; Li, Y.G.; Geoff, G.; Wu, T.G. Stoichiometric homeostasis, physiology, and growth responses of three tree species to nitrogen and phosphorus addition. Trees 2018, 32, 1377–1386. [Google Scholar] [CrossRef]
  19. Peng, H.; Chen, Y.; Yan, Z.; Han, W. Stage-dependent stoichiometric homeostasis and responses of nutrient resorption in Amaranthus mangostanus to nitrogen and phosphorus addition. Sci. Rep. 2016, 6, 37219. [Google Scholar] [CrossRef] [Green Version]
  20. Su, B.; Shangguan, Z. Stoichiometric homeostasis in response to variable water and nutrient supply in a robinia pseudoacacia plant-soil system. J. Plant Ecol. 2022, 15, 991–1006. [Google Scholar] [CrossRef]
  21. Jia, T.; Fang, X.M.; Yuan, Y.; Fu, Y.X.; Yi, M.; Yuan, S.G.; Guo, S.M.; Lai, M.; Xie, J.W.; Zhang, L. Phosphorus addition alter the pine resin flow rate by regulating tree growth and non-structural carbohydrates in a subtropical slash pine plantation. Ind. Crops Prod. 2023, 199, 116782. [Google Scholar] [CrossRef]
  22. Chen, F.S.; Niklas, K.J.; Liu, Y.; Fang, X.M.; Wan, S.Z.; Wang, H.M. Nitrogen and phosphorus additions alter nutrient dynamics but not resorption efficiencies of Chinese fir leaves and twigs differing in age. Tree Physiol. 2015, 35, 1106–1117. [Google Scholar] [CrossRef] [Green Version]
  23. Bremner, J.M. Methods of Soil Analysis, Part 3: Chemical Methods. Soil Sci. Soc. Am. J. 1996, 5, 1085–1121. [Google Scholar]
  24. Okalebo, J.R.; Gathua, K.W.; Woomer, P.L. Laboratory Methods of Soil and Plant Analysis: A Working Manual; Sacred African Publishers: Nairobi, Kenya, 2002. [Google Scholar]
  25. Yeomans, J.C.; Bremner, J.M. A rapid and precise method for routine determination of organic carbon in soil. Commun. Soil Sci. Plant Anal. 1988, 19, 1467–1476. [Google Scholar] [CrossRef]
  26. Persson, J.; Fink, P.; Goto, A.; James, M.H.; Jayne, J.; Satoshi, K. To be or not to be what you eat: Regulation of stoichiometric homeostasis among autotrophs and heterotrophs. Oikos 2010, 119, 741–751. [Google Scholar] [CrossRef]
  27. Zhen, Y.M. Study on the Stoichiometric Characteristics of Plant Carbon, Nitrogen and Phosphorus of Sandy Mountain Soil in Poyang Lake. Jiangxi Norm. Univ. 2014. [Google Scholar]
  28. Li, Y.H. Stoichiometric characteristics of different aged Pinus sylvestris Var. Mongolica plantations. Liaoning Univ. Eng. Tech. 2019. [CrossRef]
  29. Chapin, F.S., III; Schulze, E.; Mooney, H.A. The ecology and economics of storage in plants. Ann. Rev. Ecol. Syst. 1990, 21, 423–447. [Google Scholar] [CrossRef]
  30. Piper, F.I. Drought induces opposite changes in the concentration of non-structural carbohydrates of two evergreen Nothofagus species of differential drought resistance. Ann. For. Sci. 2011, 68, 415–424. [Google Scholar] [CrossRef] [Green Version]
  31. Dietze, M.C.; Sala, A.; Carbone, M.S.; Czimczik, C.I.; Mantooth, J.A.; Richardson, A.D.; Vargas, R. Nonstructural carbon in woody plants. Annu. Rev. Plant Biol. 2014, 65, 667–687. [Google Scholar] [CrossRef] [Green Version]
  32. Würth, M.K.; Pelaez-Riedl, S.; Wright, S.J.; Körner, C. Non-structural carbohydrate pools in a tropical forest. Oecologia 2005, 143, 11–24. [Google Scholar] [CrossRef]
  33. Cotrufo, M.F.; Soong, J.L.; Horton, A.J.; Campbell, E.E.; Haddix, M.L.; Wall, D.H.; Parton, W.J. Formation of soil organic matter via biochemical and physical pathways of litter mass loss. Nat. Geosci. 2015, 8, 776–779. [Google Scholar] [CrossRef]
  34. Zhang, J.; Li, X.; Chen, M.; Huang, L.; Li, M.; Zhang, X.; Cao, Y. Response of plant, litter, and soil C:N:P stoichiometry to growth stages in Quercus secondary forests on the Loess Plateau, China. J. For. Res. 2023, 34, 595–607. [Google Scholar] [CrossRef]
  35. Wang, S.Q.; Li, R.L.; Yan, J.H.; Sha, L.Q.; Han, S.J. C:N:P stoichiometric characteristics of four forest types’ dominant tree species in China. Chin. J. Plant Ecol. 2011, 35, 587–595. [Google Scholar]
  36. He, J.S.; Wang, L.; Flynn, D.F.B.; Wang, X.P.; Ma, W.H.; Fang, J.Y. Leaf nitrogen: Phosphorus stoichiometry across Chinese grassland biomes. Oecologia 2008, 155, 301–310. [Google Scholar] [CrossRef]
  37. Yu, Q.; Wu, H.; He, N.; Lü, X.T.; Wang, Z.P.; Elser, J.J.; Wu, J.G.; Han, X.G. Testing the growth rate hypothesis in vascular plants with above- and below-ground biomass. PLoS ONE 2012, 7, e32162. [Google Scholar] [CrossRef] [Green Version]
  38. Koerselman, W.; Meuleman, A.M.F. The vegetation N:P ratio: A new tool to detect the nature of nutrient limitation. Chin. J. Appl. Ecol. 1996, 33, 1441–1450. [Google Scholar] [CrossRef]
  39. Sabine, G. N:P ratios in terrestrial plants: Variation and functional significance. New Phytol. 2004, 164, 243–266. [Google Scholar]
  40. Tian, H.Q.; Chen, G.S.; Zhang, C.; Melillo, J.M.; Hall, C. Pattern and variation of C:N:P ratios in China’s soil: A synthesis of observational data. Biogeochemistry 2010, 98, 139–151. [Google Scholar] [CrossRef]
  41. Du, P.C.; Pan, Y.Z.; Hou, S.L.; Wang, Z.H.; Wang, H.Y. Effects of nitrogen and phosphorus addition on litter decomposition in Hulunber steppe. Acta Pratac. Sin. 2023, 32, 44–53. [Google Scholar]
  42. Fan, H.B.; Wu, J.P.; Liu, W.F.; Yuan, Y.H.; Hu, L.; Cai, Q.K. Linkages of plant and soil C: N: P stoichiometry and their relationships to forest growth in subtropical plantations. Plant Soil 2015, 392, 127–138. [Google Scholar] [CrossRef]
  43. Bai, X.; Wang, B.; An, S.; Zeng, Q.; Zhang, H. Response of forest species to C:N:P in the plant-litter-soil system and stoichiometric homeostasis of plant tissues during afforestation on the Loess Plateau, China. Catena 2019, 183, 104–186. [Google Scholar] [CrossRef]
  44. Jia, T.; Chen, M.Y.; Zhang, L.; Yi, M.; Guo, S.M.; Cheng, Z.S.; Li, X.; Zhong, Q.W. Ecological stoichiometry and homeostasis index of needles, branches, roots and soil in Pinus elliottii plantations of different ages. Acta Agric. Nucl. Sin. 2023, 37, 397–404. [Google Scholar]
  45. Zhao, F.Z.; Ren, C.J.; Han, X.H.; Yang, G.H.; Wang, J.; Doughty, R. Changes of soil microbial and enzyme activities are linked to soil C, N and P stoichiometry in afforested ecosystems. For. Ecol. Manag. 2018, 427, 289–295. [Google Scholar] [CrossRef]
  46. Gu, Q.; Zamin, T.J.; Grogan, P. Stoichiometric homeostasis: A test to predict tundra vascular plant species and community-level response to climate change. Arct. Sci. 2017, 3, 320–333. [Google Scholar] [CrossRef] [Green Version]
  47. Aerts, R.; Chapin, F.S., III. The mineral nutrition of wild plants revisited: A reevaluation of processes and patterns. Adv. Ecol. Res. 2000, 30, 1–67. [Google Scholar]
  48. Blouin, M.; Mathieu, J.; Leadley, P.W. Plant homeostasis, growth and development in natural and artificial soils. Ecol. Complex 2012, 9, 10–15. [Google Scholar] [CrossRef]
Figure 1. Study plots and sample distribution.
Forests 14 01355 g001
Figure 2. The contents of C, N, and P and C:N:P stoichiometry in tissues under P addition. Note: The standard errors of the means are shown by the tops of the bars. Based on Tukey’s test, the major differentiation between tissues is denoted by the use of capital letters, and the major differentiation between treatments is denoted by the use of small letters (p ≤ 0.05).
Forests 14 01355 g002
Figure 3. Pearson correlation analysis of C, N, and P content and stoichiometry in slash pine plantation. * means p ≤ 0.05; ** means p ≤ 0.01.
Forests 14 01355 g003
Figure 4. In (A), the relationship of C, N, and P contents between plant tissues and soil. In (B), the relationship of C, N, and P stoichiometry between plant tissues and soil.
Forests 14 01355 g004
Figure 5. Relationships between Lg-transformed C, N, and P contents and stoichiometry.
Forests 14 01355 g005
Table 1. The C, N, and P contents and stoichiometry of soil under P addition.
TraitCKP1P2P3
C (g kg−1)11.50 ± 0.44 c12.28 ± 0.56 bc13.41 ± 0.51 ab14.31 ± 0.56 a
N (g kg−1)0.94 ± 0.040.98 ± 0.051.00 ± 0.041.06 ±0.04
P (g kg−1)0.69 ± 0.03 b0.70 ± 0.03 b0.77 ± 0.03 ab0.83 ± 0.02 a
C:N12.58 ± 0.7312.94 ±0.7413.84 ± 0.7214.13 ± 1.00
C:P17.46 ± 1.2017.98 ±1.0618.04 ± 1.1017.47 ± 0.80
N:P1.41 ± 0.091.43 ± 0.081.33 ± 0.081.29 ± 0.05
Note: The different small letters indicate the significant differences among treatments based on Tukey’s test (p ≤ 0.05).
Disclaimer/Publisher’s Note: The statements, opinions and data contained in all publications are solely those of the individual author(s) and contributor(s) and not of MDPI and/or the editor(s). MDPI and/or the editor(s) disclaim responsibility for any injury to people or property resulting from any ideas, methods, instructions or products referred to in the content.

