Article

Study on the Comprehensive Health Effects of Coastal Green Areas in Qingdao City, China

1
College of Landscape Architecture and Forestry, Qingdao Agricultural University, Qingdao 266109, China
2
School of Ecological and Environmental Sciences, East China Normal University, Shanghai 200241, China
3
Research Center for Eco-Environmental Sciences, Chinese Academy of Sciences, Beijing 100085, China
*
Author to whom correspondence should be addressed.
Forests 2023, 14(12), 2463; https://doi.org/10.3390/f14122463
Submission received: 28 November 2023 / Revised: 15 December 2023 / Accepted: 15 December 2023 / Published: 18 December 2023
(This article belongs to the Special Issue Forest, Trees, Human Health and Wellbeing)

Abstract

:
The recuperation factors (negative air ion concentration, airborne particulate matter, human comfort index, and acoustic environment index) of coastal green spaces have significant health effects. Most current studies focus on the distribution pattern of single recuperation factors in the forest environment; however, the comprehensive health effects of coastal green spaces are still unknown. To address this, we analyzed the distribution patterns of single and comprehensive health factors in different landscape configurations, landscape compositions, and coastal distances by principal component analysis and systematic clustering. The results show that: (1) coniferous and broadleaf mixed forests exhibit higher integrated health benefits than other landscape compositions; (2) closed and partially closed landscape configurations exhibit enhanced potential for promoting health benefits as opposed to partially open and open spaces; (3) a coastal distance of 150–300 m offers the strongest comprehensive health benefits. These findings collectively suggest that the increased cultivation of closed and partially closed mixed coniferous and broadleaf forest species at a distance of 150–300 m could effectively provide higher comprehensive health effects. Our study complements the ecosystem service of coastal green areas, especially in coastal health ecological services, providing support for coastal rehabilitation landscape planning; and can help to guide tourists in scheduling coastal health activities scientifically.

1. Introduction

With the advent of the post-pandemic era and the ever-increasing pressures of rapid urbanization, depression and anxiety have become prevalent, prompting people to seek healthier lifestyles [1,2]. As early as the 18th century, coastlines were proposed as therapeutic landscapes [3]. Coastal green spaces have become popular tourist destinations due to their significant health benefits, and coastal therapy has gradually gained attention from researchers in recent years [4,5].
Coastal recuperation factors include all biotic and abiotic factors in the coastal environment that have an impact on health [6]. These include negative air ion concentration (NAIC), airborne particulate matter (PM2.5/PM10), forest microclimate, and coastal health factors such as the human comfort index (S) and complex acoustic environments (NF). Altering the landscape composition, landscape configuration, and distance from the sea of coastal green spaces has the potential to modulate the distribution patterns of coastal therapeutic factors [7]. High-quality coastal green space landscape planning can attract tourists and ecotourists and promote local economic development. Conversely, coastal therapeutic factors are also important factors influencing the healthcare effects of coastal green spaces [8]. There is a lack of understanding on how to accurately plan landscapes in coastal areas to maximize the benefits of these factors and how to create healthier waterfront environments at the micro-scale. While previous research primarily focused on the influence of individual health factors within urban green spaces, there has been limited quantitative analysis of the collective health benefits of coastal healing elements in these areas [9]. By examining both the individual and combined health benefits of each coastal healing factor within different landscape compositions, configurations, and coastal distance conditions, we can establish a more comprehensive theoretical foundation. This foundation will play a vital role in shaping strategies for coastal ecosystem services, the planning and design of coastal green spaces, and the promotion of coastal tourism. Furthermore, it will help to enhance healthcare options for residents.
Numerous studies have demonstrated a strong link between living in proximity to the coast and experiencing enhanced health outcomes [10]. Previous research efforts have predominantly focused on the macro level [11]. In terms of research questions, previous studies have primarily centered on examining how coastal proximity impacts physical activity, disease treatment, and the fostering of a positive social environment [12]. In terms of research methodology, most research has relied on questionnaire surveys and other subjective approaches, with limited empirical studies based on measured ecological data. Regarding the scope of research, studies have predominantly focused on examining the impacts of individual healing factors within the coastal environment, for example, the closer the distance to the sea, the more comfortable the index of human thermal comfort (human comfort has different ranges of values for different research criteria, in this study human comfort was assessed using Lu Dinghuang method, i.e., the smaller the value of the human comfort index the more comfortable it is) [13]. Furthermore, coastal areas are characterized by significantly lower levels of airborne particles compared to inland regions. Simultaneously, they have notably higher concentrations of negative ions in the air, which contribute to substantial health benefits [14]. Finally, when it comes to reducing anxiety, coastal soundscapes are more effective than other natural soundscapes [15].
At the micro level, one study found that people living within 1 km of the coast were healthier than those living beyond 1 km [16]. Research suggests that the cause of these results may be related to coastal health factors, such as airborne particulate matter, but the evidence is mixed [17]. It has also been shown that, in addition to the health factors mentioned above, the pollen produced by plants has a significant impact on the health effects of green spaces; for example, a beech forest was characterized by greater recreational potential and a weaker pollen allergen effect than a pine forest [18]. This shows that it is one-sided to assess the health effects of an entire coastal green area based on the health effects of a single healing factor. The combined health effects of seaside healing factors in coastal environments remain unknown.
In summary, our study employed a combination of principal component analysis and systematic clustering to quantitatively investigate and assess the individual and integrated health effects of coastal recuperation factors, including NAIC, S, PM2.5/PM10, and NF in Qingdao’s coastal green spaces. We explored the following questions: (1) What is the distribution pattern of coastal recuperation factors in terms of landscape configurations, landscape compositions, and coastal distance? (2) How can we comprehensively assess the integrated health benefits of different landscape configurations, landscape compositions, and coastal distance? (3) How can we build healthcare coastal green spaces, improve their healthcare benefits, and optimize the coastal green spaces at a later stage?

2. Materials and Methods

2.1. Study Area

The study area is Qingdao City, China (119°30′–120°58′ E, 35°35′–37°09′ N, average altitude 77.2 m) [19]. Qingdao, a coastal tourist destination, is in the southeast of the Shandong Peninsula, surrounded by the sea on three sides and flanked by mountains on the other, offering abundant natural and human-formed landscapes, as well as therapeutic resources (Figure 1). The study area demonstrates typical marine climate features, characterized by an average summer temperature of 24 °C and winter temperatures consistently above 0 °C. These conditions create an environment highly suitable for the implementation of coastal rehabilitation and convalescence activities [20]. Thus, Qingdao boasts numerous sanatoriums and is well-known as a prominent coastal sanatorium in China.
Samples were collected from three coastal green areas in the southern district of Qingdao: Luxun Park, Badaguan Scenic Area, and Huizhuan Square (Figure 1). They represent the three forms of coastal green space in Qingdao.

2.2. Plot Settings

2.2.1. Coastal Line Location Division and Coastal Distance Determination

In this study, we delineated the coastline of the experimental plot using the normalized difference water index (NDWI) approach [21], leveraging spectral differences to detect abrupt pixel value transitions, which indicated the coastline [22]. Three cloudless images captured near local high tide levels in 2022 were chosen as data sources [23]. Considering the site’s conditions, we segmented the successfully extracted shoreline into four experimental distances: 0–150 m, 150–300 m, 300–450 m, and 450–600 m from the coastline.

2.2.2. Classification and Selection of Coastal Green Spaces

Using satellite imagery and field investigations in Qingdao City, urban green spaces were categorized based on landscape configuration and composition. The plant community was categorized into five landscape compositions based on species composition, namely, lawn, coniferous forest, broadleaf forest, coniferous and broadleaf mixed forest, and control groups without vegetation. Landscape configuration was evaluated based on the sample plots’ vegetation size and spatial arrangement [24].
We captured top-cover images of typical plant communities from a height of 1.5 m using a fisheye lens and pixelated these images using Photoshop 2019 software [25]. The SVF (sky view factor) quantifies the ratio of visible sky area to the sky dome area at a specific ground point [26], enabling the definition of spatial patterns [27]. Employing the fisheye camera, we categorized tree and shrub canopy cover into distinct types: open green spaces: SVF = (0.91–1] partially open green spaces: SVF = (0.51–0.9]; partially closed green spaces: SVF = (0.21–0.5]; and closed green spaces: SVF = (0–0.2].
In this study, the coastal green spaces were divided into four coastal distances from the inland coastline. For each type, four sample sites were selected as replicates, and each coastal distance included a control sample site featuring pure hard plazas categorized as open spaces. In total, 36 sample plots were chosen based on landscape configuration, composition, and coastal distance. To minimize external interference, all monitoring sites were centrally located within parks and positioned at least 20 m away from rivers or ponds [28]. Additional information about the experimental sites can be found in Appendix A.

2.3. Methods

2.3.1. Data Collection

Data were collected between June and November 2022, with monthly observations on three selected days featuring clear or cloudy weather conditions. Synchronous measurements were performed in the morning (8:00–10:00), noon (12:00–14:00), and afternoon (16:00–18:00) of each test day. A total of 36 sample plots were measured for four indices: NAIC (ITC-201A negative ion monitor, made in Japan), S (Kestrel 5500 hand-held meteorological instrument, made in the USA), PM2.5/PM10, and NF (OSEN-SYZ dust noise tester, made in China). Environmental factors including temperature, relative humidity, and wind speed were recorded in triplicate at a height of 1.5 m from the ground. Data were obtained at each observation point in four directions (east, south, west, and north), and the procedure was replicated three times following zeroing, yielding a cumulative number of twelve data points. The final data were calculated as the average value. The concentration of negative air ions was assessed utilizing the air ion evaluation index introduced by the Japanese scholar Abe (CI) [29]. Airborne particulate matter was assessed by the Air Quality Standard [30]. The human comfort index was determined using the Lu Dinghuang method [31]. Noise levels were evaluated following the Chinese “Sound Environment Evaluation Standard” (GB 3096-2008) [32]. Based on these criteria, we established an evaluation system for individual recuperation factors, and the specific values and formulas can be found in Appendix B.

2.3.2. Data Analysis

Initially, we divided the four abovementioned indices into positive (i.e., NAIC) and negative indices (i.e., S, PM10/PM2.5, and NF) according to the effects of each index on environmental quality. After that, for comparison of the unified evaluation system, the range normalization method was adopted for standardization (Equations (1) and (2)).
positive indicator: indicator score = (current value − minimum)/(maximum − minimum)
negative indicator: indicator score = (maximum − current value)/(maximum − minimum)
The initial dataset underwent standardization and subsequent analysis through principal component analysis using SPSS 25.0. As depicted in Table 1, the five original environmental indicators were condensed into two principal components, yielding a cumulative contribution rate of 80.256%. These two principal components were linearly combined as follows:
F1 = 0.29 × NAIC + 0.341 × PM10 + 0.329 × PM2.5 + 0.221 × S + 0.074 × NF
F2 = 0.212 × NAIC − 0.004 × PM10 − 0.102 × PM2.5 − 0.529 × S + 0.688 × NF
The comprehensive assessment index for healthcare benefits derived from coastal green environments is denoted as the coastal green comprehensive healthcare index (CGHI). The specific computational formula for the CGHI is articulated as follows:
CGHI = 0.01 × Si + 0.27 × NAICi + 0.25 × NFi + 0.21 × PM2.5i + 0.25 × PM10i (i = 1, 2, 3…)
where NAICi represents the normalized value of negative air ion concentration at the i-th observation site. Similarly, PM2.5i and PM10i denote the normalized values of PM2.5 and PM10 content at the i-th observation site, respectively. Si signifies the normalized value of the human comfort index at the i-th observation site, while NFi corresponds to the normalized value of the noise index at the i-th observation site.
Drawing on the literature and practical imperatives, the CGHI values underwent systematic clustering that employed Ward’s method and squared Euclidean distance. CGHI is classified into four different classes using the red line as a reference line, as shown in Figure 2 [31]. The analysis elucidated the strength of comprehensive healthcare benefits within various numerical intervals. This resulted in the establishment of a grading standard for the comprehensive evaluation index of coastal green environmental healthcare benefits, as presented in Table 2.

3. Results

3.1. Negative Air Ion Concentration

The CI for various landscape compositions, landscape configurations, and coastal distances in the coastal green space was determined using Equations (A1) and (A2) in Appendix B. This was used as the basis for evaluating negative air ion concentrations, and the evaluation criteria are shown in Table A1 in Appendix B. Analyzing landscape composition (Figure 3A), the summer CI peaks at coniferous and broadleaf mixed forest (0.601 ± 0.048), with a trough in the control groups (0.135 ± 0.018). In autumn, the coniferous forest boasts the highest values (0.645 ± 0.056), while the control groups maintain the lowest values (0.139 ± 0.021). Forests and grasslands in both seasons consistently meet or surpass Level III standards, highlighting positive health effects. Conversely, the control groups are relegated to Level V, lacking health benefits and falling short of human health needs.
Shifting the focus to landscape configuration (Figure 3B), the summer witnesses peak values for the partially open space (0.601 ± 0.038), whereas the closed space takes the lead in the autumn (0.65 ± 0.026). Open space consistently records the lowest values in both seasons. In terms of health effects, all spaces except open space achieve Level III, while open space is designated as Level IV, indicating comparatively weaker health effects.
In terms of coastal distance (Figure 3C), the highest summer CI values are recorded at 0–150 m (0.654 ± 0.041), while 150–300 m claims the fall peak (0.598 ± 0.034), with 450–600 m consistently registering the lowest values. Distances ranging from 0 to 150 m and from 150 to 300 m are classified as Level III, demonstrating positive health effects, and meeting daily health needs. On the other hand, distances spanning 300 to 450 m and 450 to 600 m fall under Level IV, signifying a discernible diminution in health effects when compared to other categories.

3.2. Airborne Particulate Matter

The three coastal forests consistently displayed praiseworthy secondary classifications during both summer and autumn, as per the criteria for assessing airborne particulate matter (refer to Table A1 in Appendix B). Notably, these forest environments exhibited significantly lower concentrations of particulate matter compared to the control and neighboring lawn environments, resulting in favorable health benefits (Figure 4A).
PM10 concentrations reached Level I for the closed space and partially closed space, and Level II for the open space and partially open space. During the summer, all landscape configurations were assigned a Level I rating for PM2.5 concentrations, with only the open space receiving a Level II rating. In the autumn, all landscape configurations were classified as Level II for PM2.5 concentrations, resulting in moderate health effects on individuals (Figure 4B).
Within the coastal distance (Figure 4C), during the summer months, PM2.5 and PM10 concentrations in 0–150 m achieved Level I ratings, while the remaining distances received Level II ratings. As autumn approached, PM10 concentrations were rated as Level II for all distances, with PM2.5 in 0–150 m receiving a Level I rating, while the other distances retained a Level II rating. It is worth noting that 0–150 m exhibited remarkable health benefits.

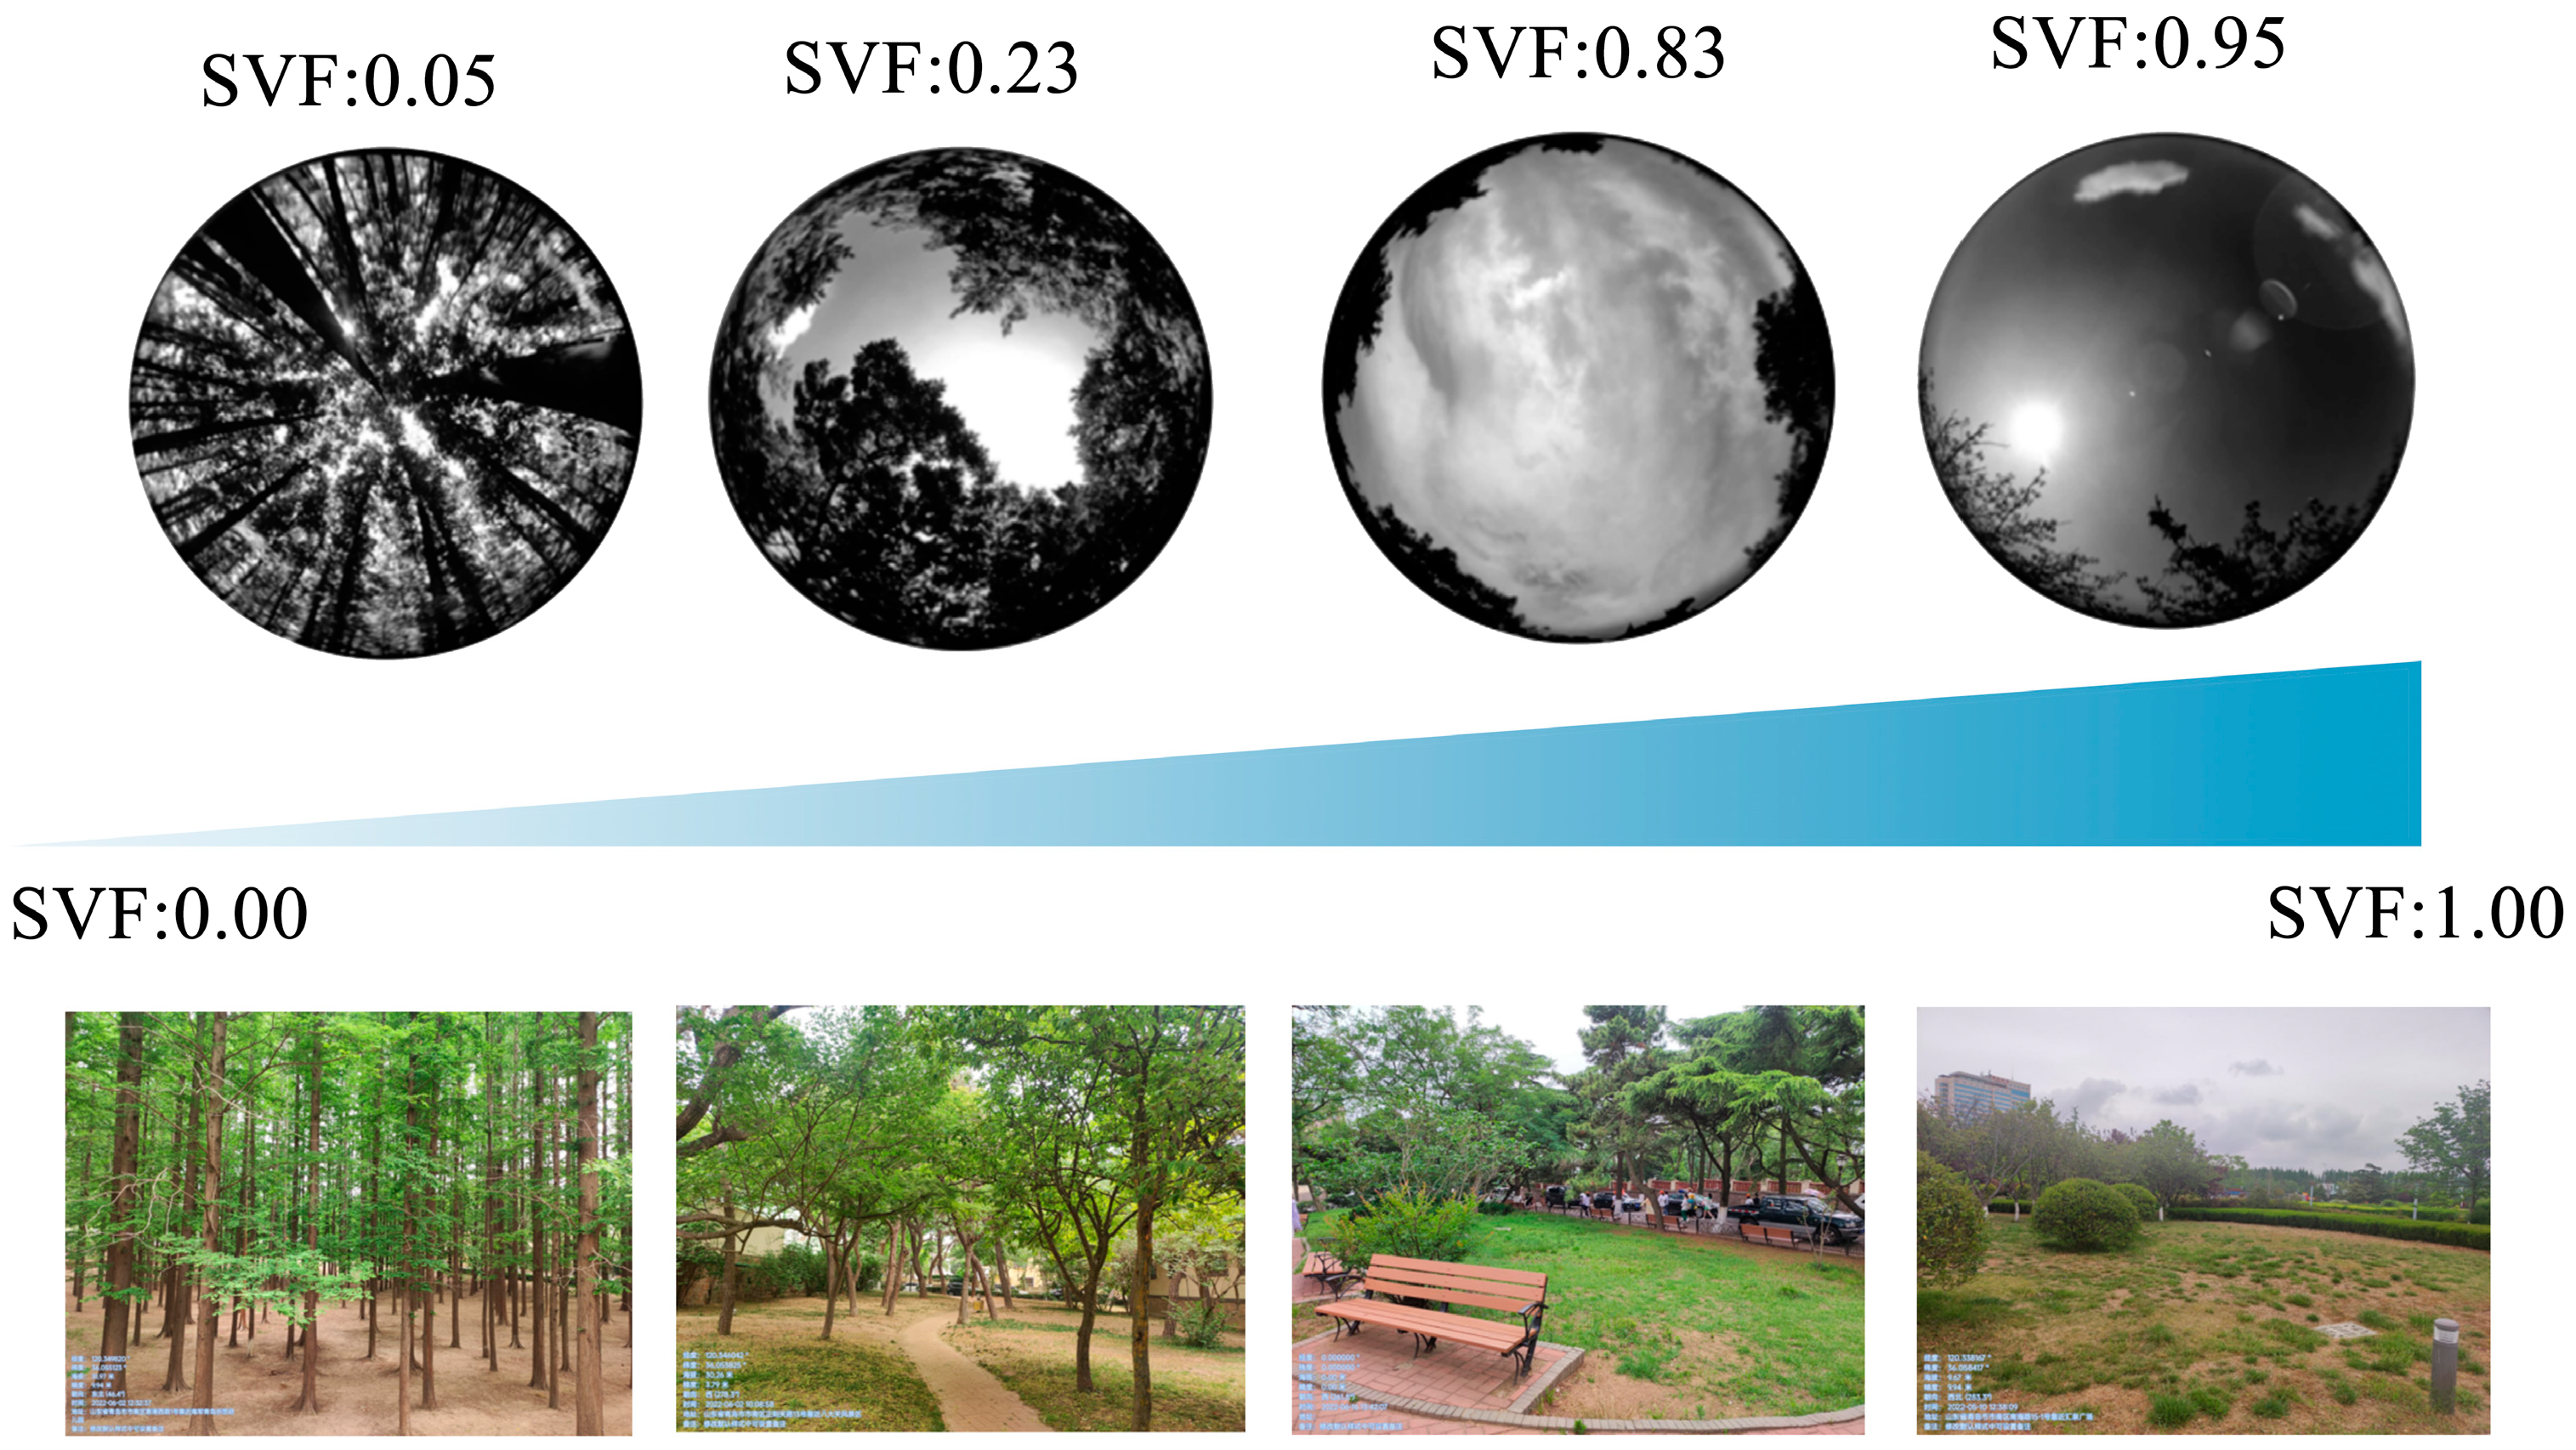
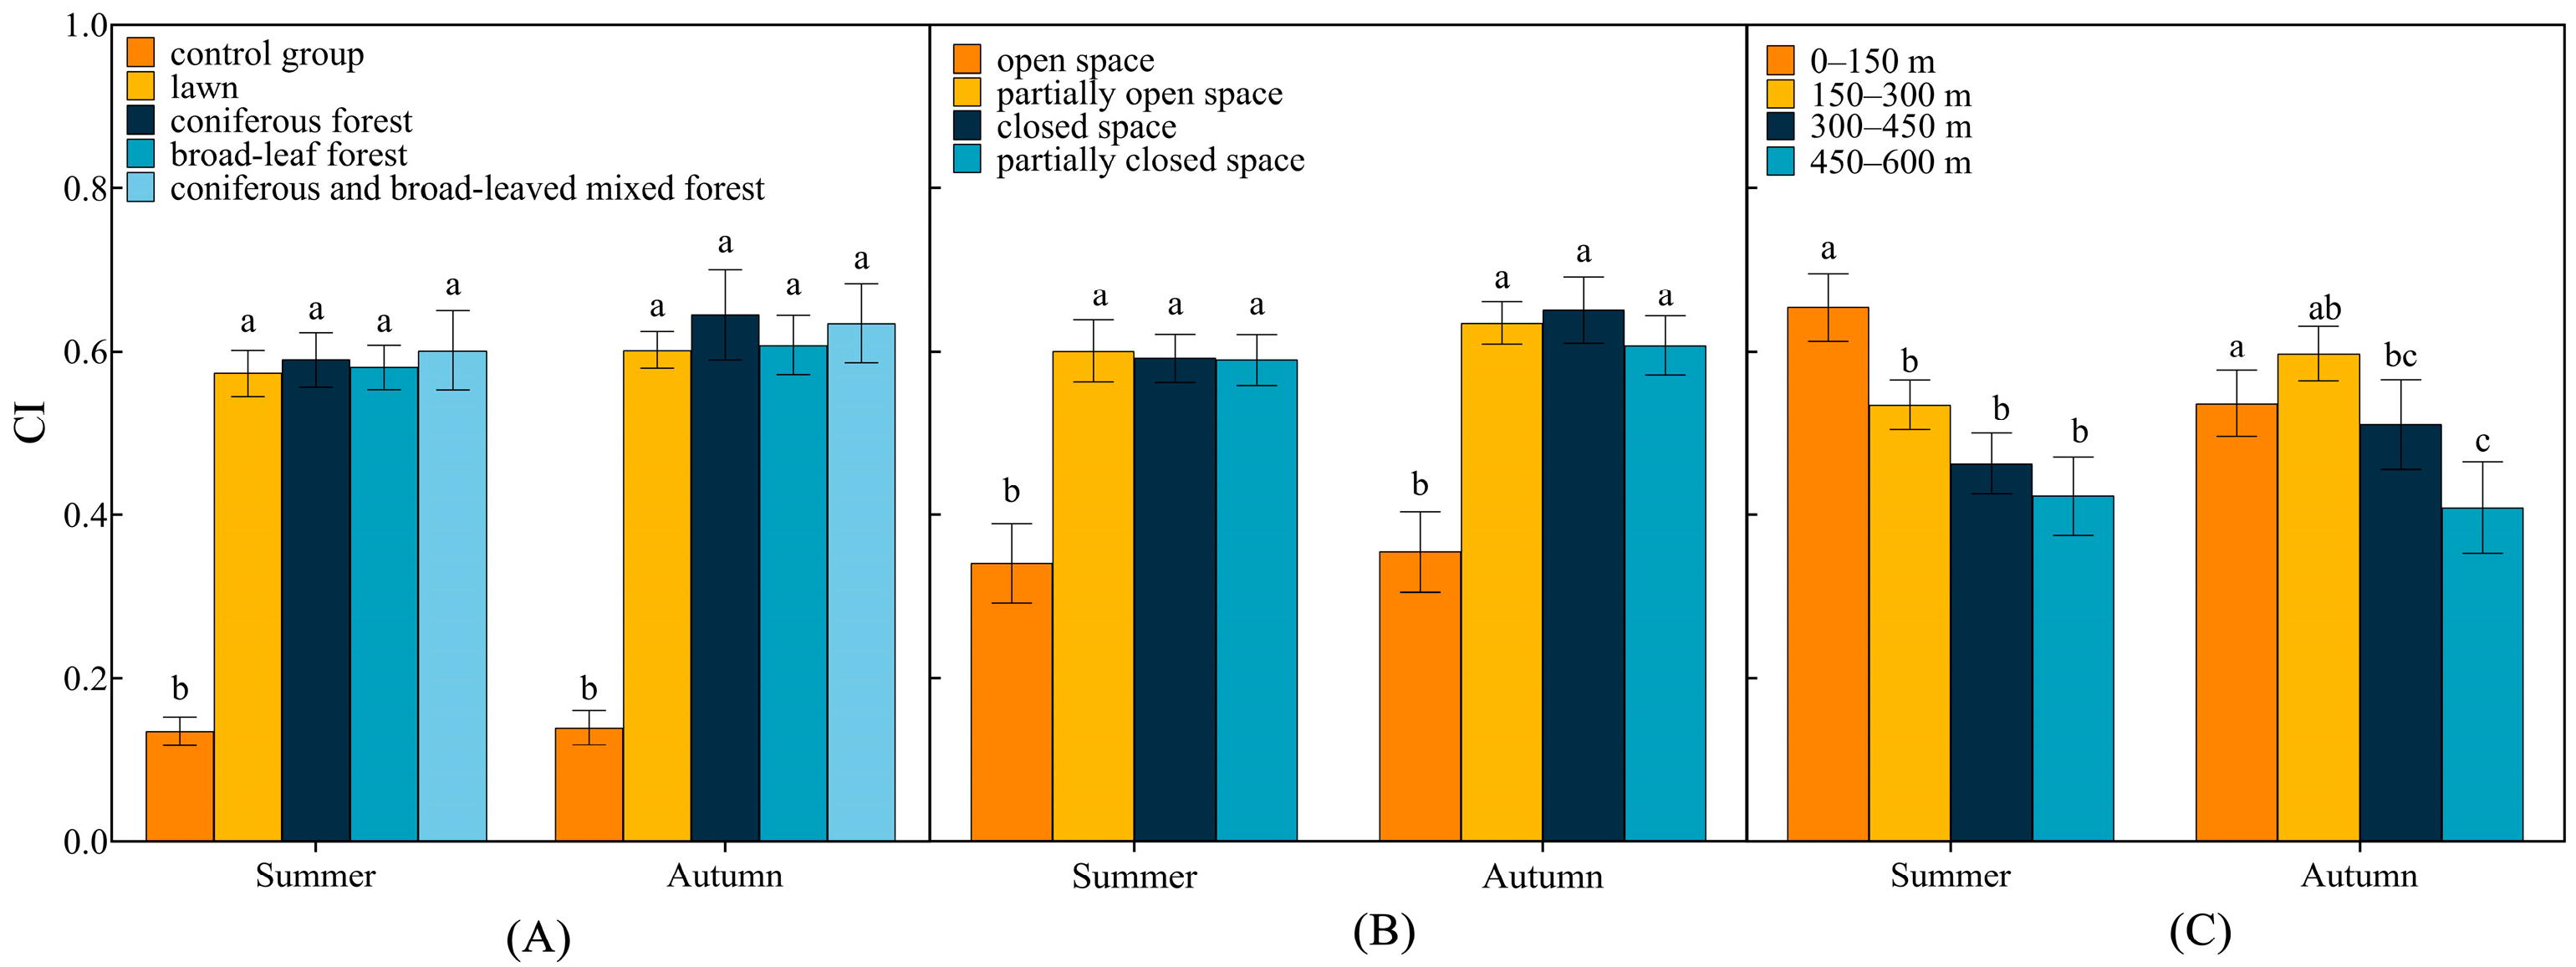
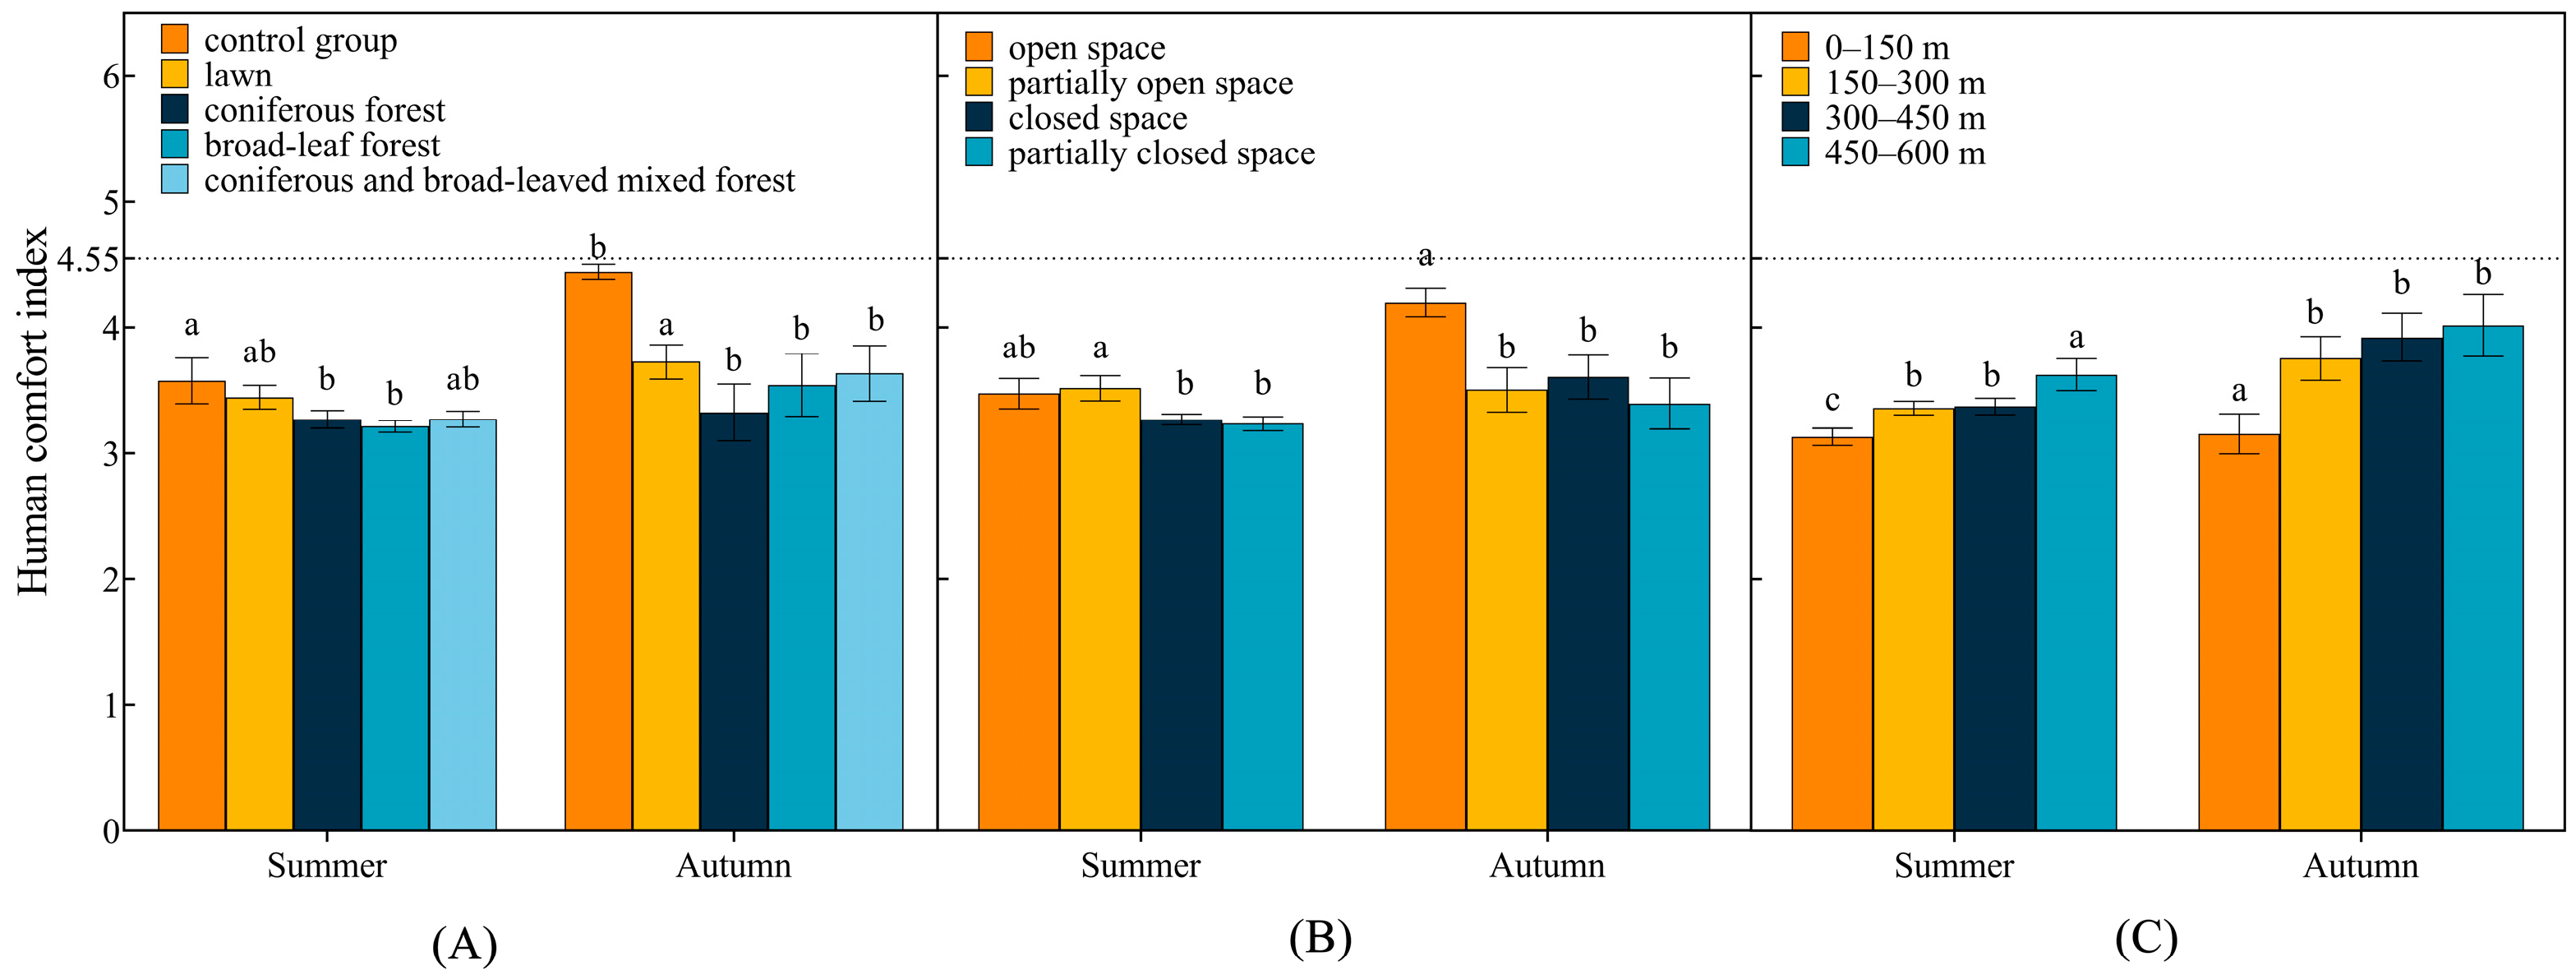
3.3. Forest Microclimate and Human Comfort Index

The human comfort index for diverse landscape compositions, landscape configurations, and coastal distances within coastal green spaces was computed utilizing Equation (A3), as presented in Appendix B. Subsequently, the obtained values were evaluated against the predefined assessment criteria outlined in Table A1 of Appendix B. The most elevated comfort levels were recorded in broadleaf forests during the summer and coniferous forests during autumn (Figure 5A). Among the different landscape configurations, the partially closed space provided the highest human comfort level during the summer and fall (Figure 5B). In terms of coastal distance, 0–150 m exhibited the highest level of human comfort during both the summer and autumn seasons (Figure 5C). All landscape configurations and coastal distances consistently met or exceeded comfort thresholds in summer and fall, yielding excellent health effects.

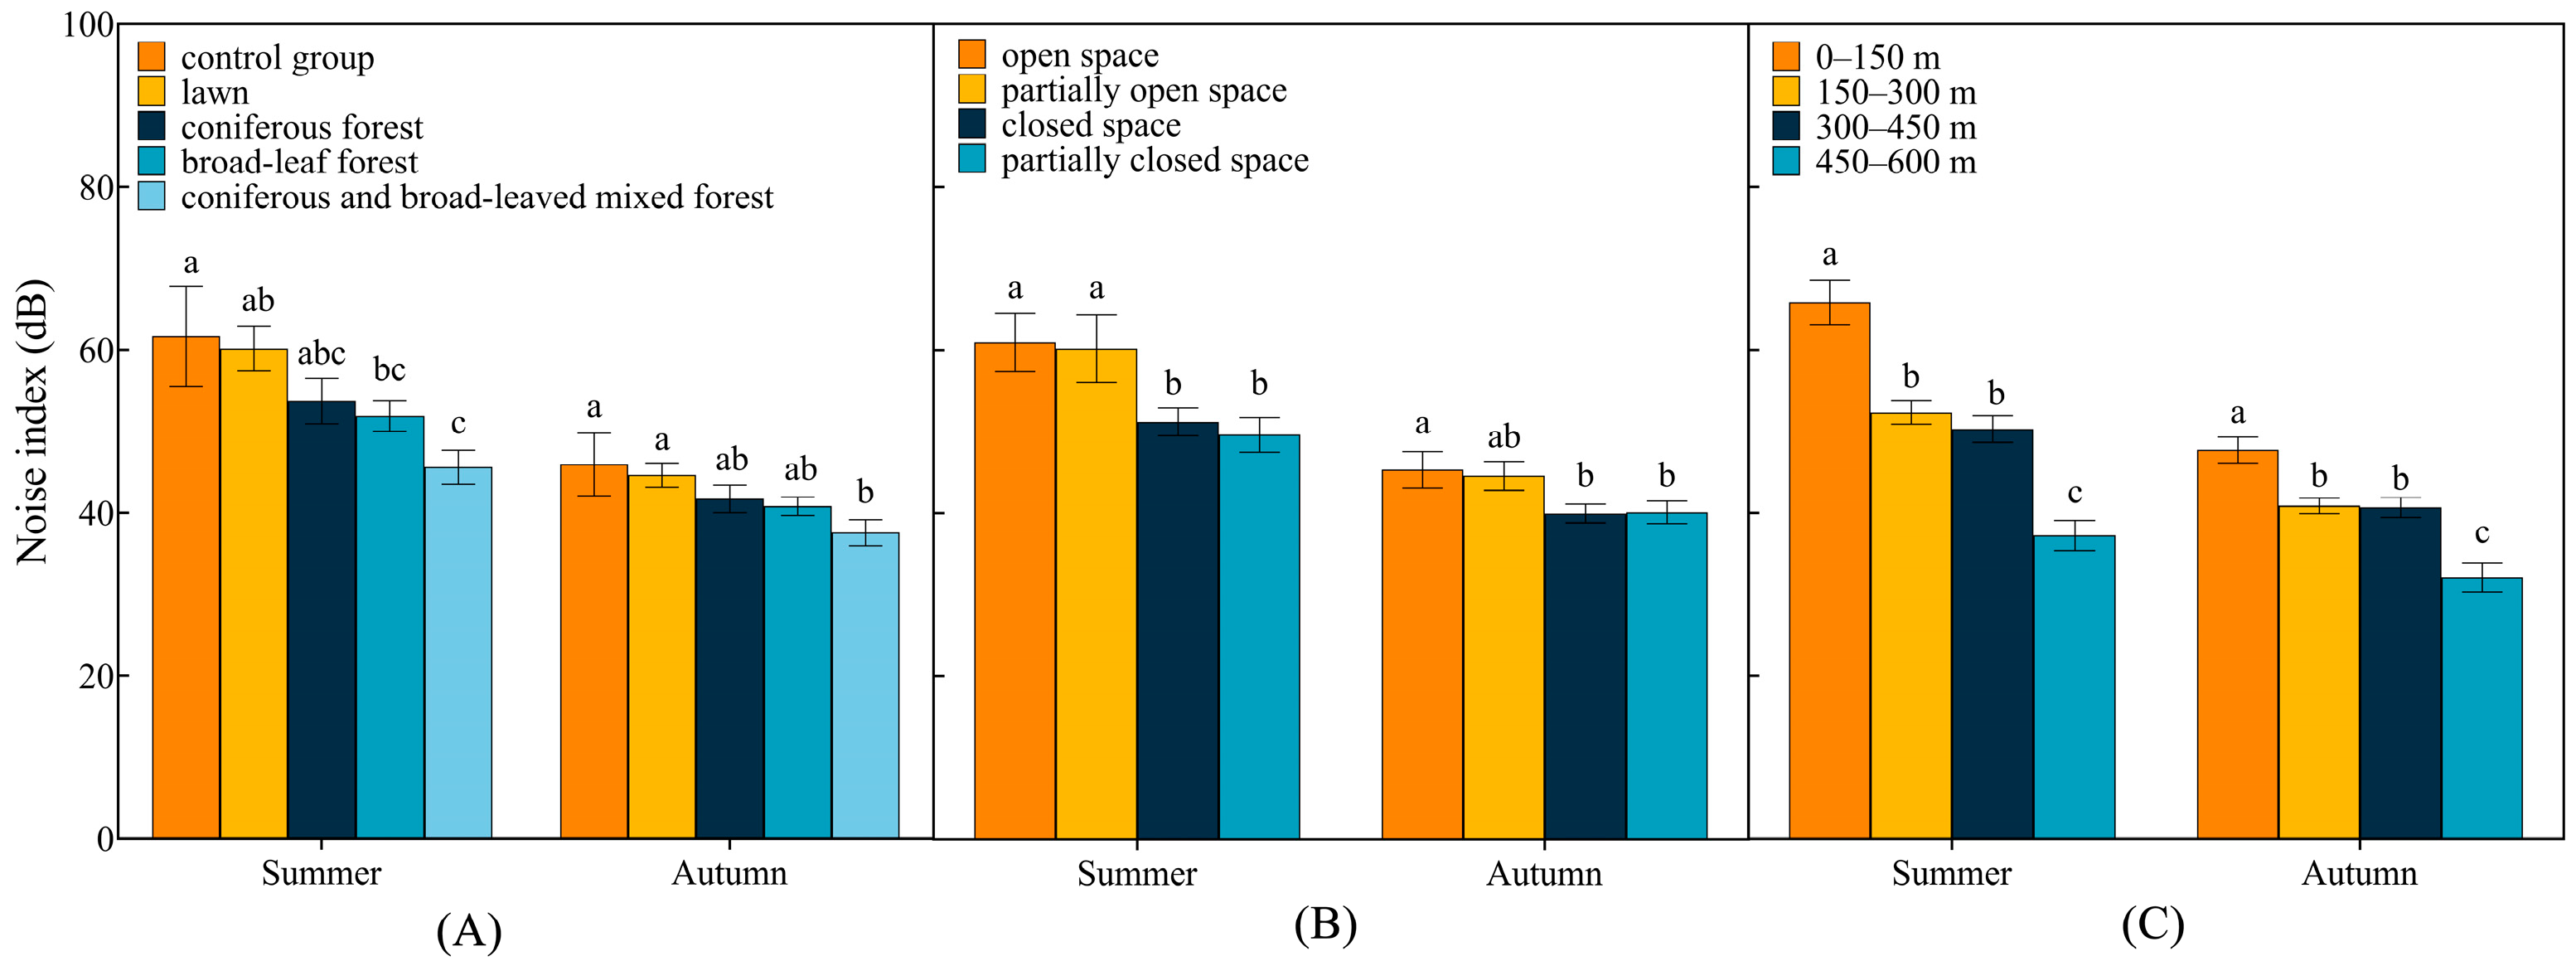
3.4. Acoustic Environments Index

Following the acoustic environments index rating criteria in Table A1 of Appendix B, it is evident that, in summer, all landscape compositions, excluding coniferous and broadleaf mixed forests, are at Level III. Control groups and lawns exhibit noise levels exceeding 60 dB, significantly higher than coniferous forests and broadleaf forests. Coniferous and broadleaf mixed forests are classified at Level II, and are associated with positive health effects. Moving to autumn, most forests achieve a very quiet Level I, while lawn and control groups rise to a Level II rating, contributing to a favorable acoustic environment (Figure 6A).
Concerning landscape configuration (Figure 6B), during the summer season, all landscape configurations adhere to the standards specified for Level III. Within these configurations, the noise level within enclosed and partially enclosed spaces is notably lower than that observed in open and partially open spaces. As the fall season progresses, open and partially open space descend to Level II, while the other spatial configurations reach Level I, indicating an exceedingly tranquil setting.
Examining the coastal distance (Figure 6C), during the summer, 0–300 m is positioned at Level III, indicative of a noisy environment not conducive to recuperative activities. Moreover, 300–450 m received a Level II rating, whereas 450–600 m was distinguished at Level I, signifying a quieter soundscape. In autumn, 450–600 m maintains its Level I classification, with the remaining coastal distance securing a Level II rating, denoting a notably quiet atmosphere.

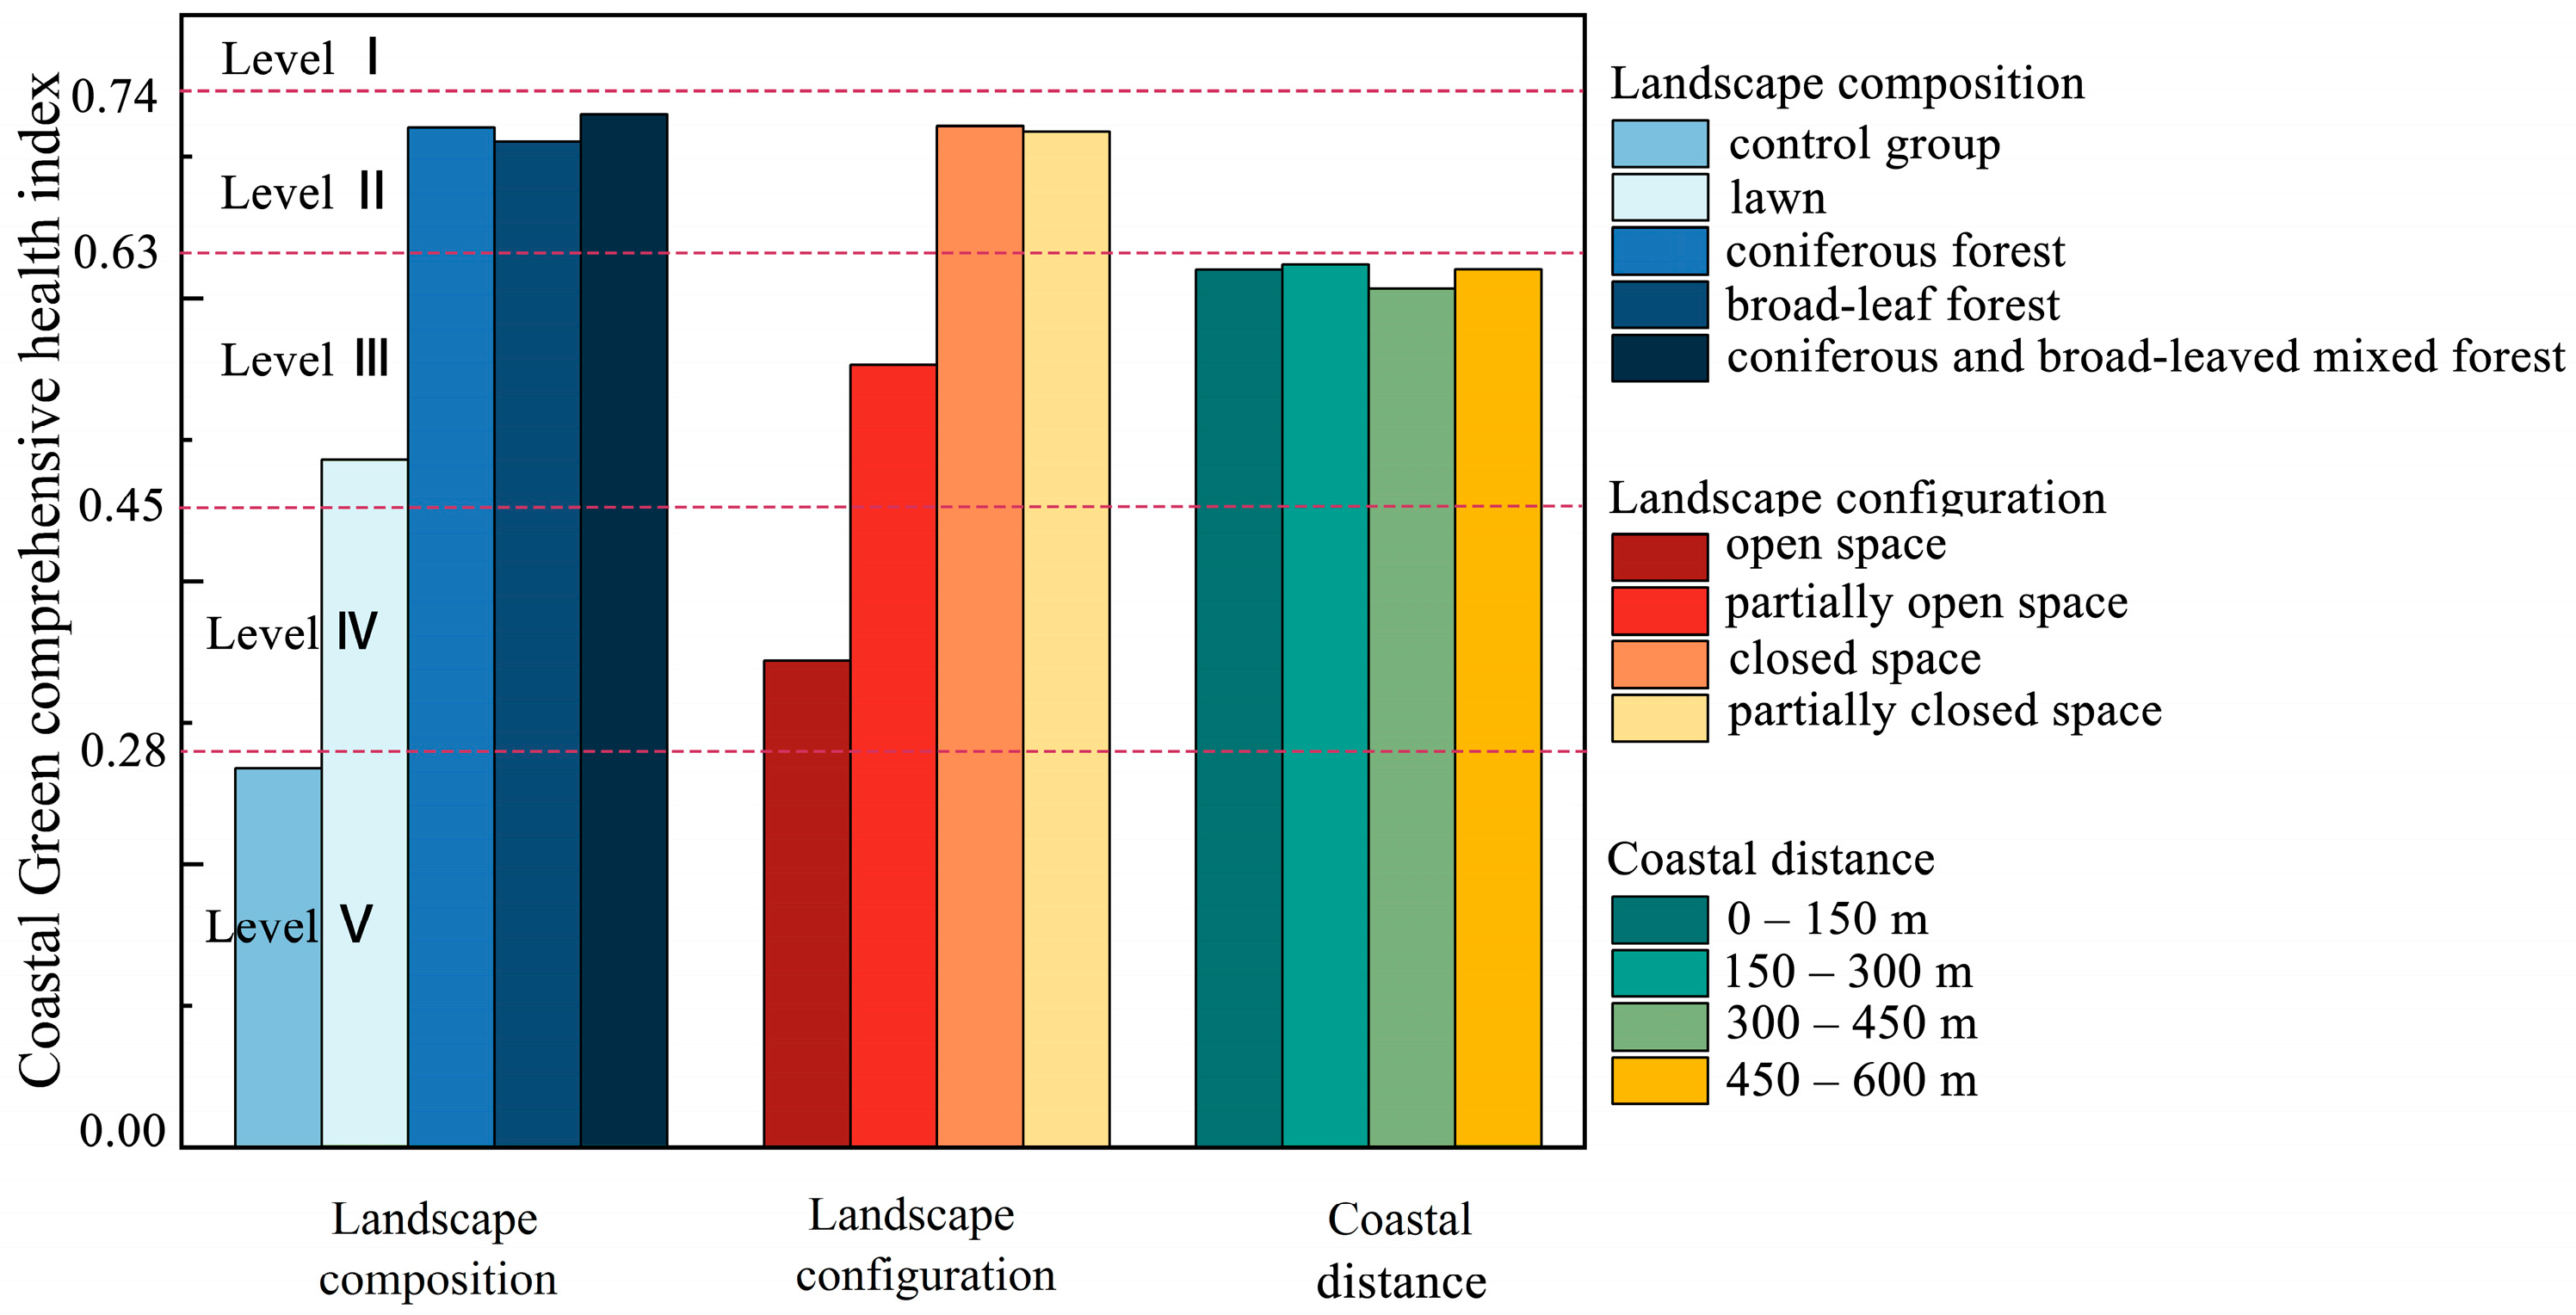
3.5. Coastal Green Comprehensive Health Index Evaluation

The normalized values of the five health indicators were obtained according to Equations (1) and (2) above. Meanwhile, the integrated health indices of coastal greenery were calculated and evaluated separately for each point and different landscape compositions, landscape configurations, and coastal distances according to Equation (5) and Table 2 and are shown in Figure 7. The CGHI values of each test site were ranked in descending order of magnitude, and the test site with the best overall health benefits was found to be Site 5, whose plant and altitude plots are shown in Figure 7. Please refer to Appendix C for detailed data.
In Figure 8 below, according to the CGHI values, in terms of landscape composition, the forests all reached Level II with strong rehabilitative health benefits; the grasslands reached Level III with general health benefits; and the control groups were at Level V with no comprehensive health benefits. The order of integrated health effects of landscape compositions was as follows: coniferous and broadleaf mixed forest > coniferous forest > broadleaf forest > lawn > control groups.
In terms of landscape configuration, the closed and partially closed spaces reached Level II with strong health effects, the partially open spaces reached Level III with general health benefits, and the open spaces reached Level IV with weak health benefits. The order of integrated health effects of the landscape configurations was as follows: closed space > partially closed space > partially open space > open space.
In terms of coastal distance, all coastal distances reached Level III with general health benefits. The order of integrated health effects of coastal distance was as follows: 150–300 m > 450–600 m > 0–150 m > 300–450 m.

4. Discussion

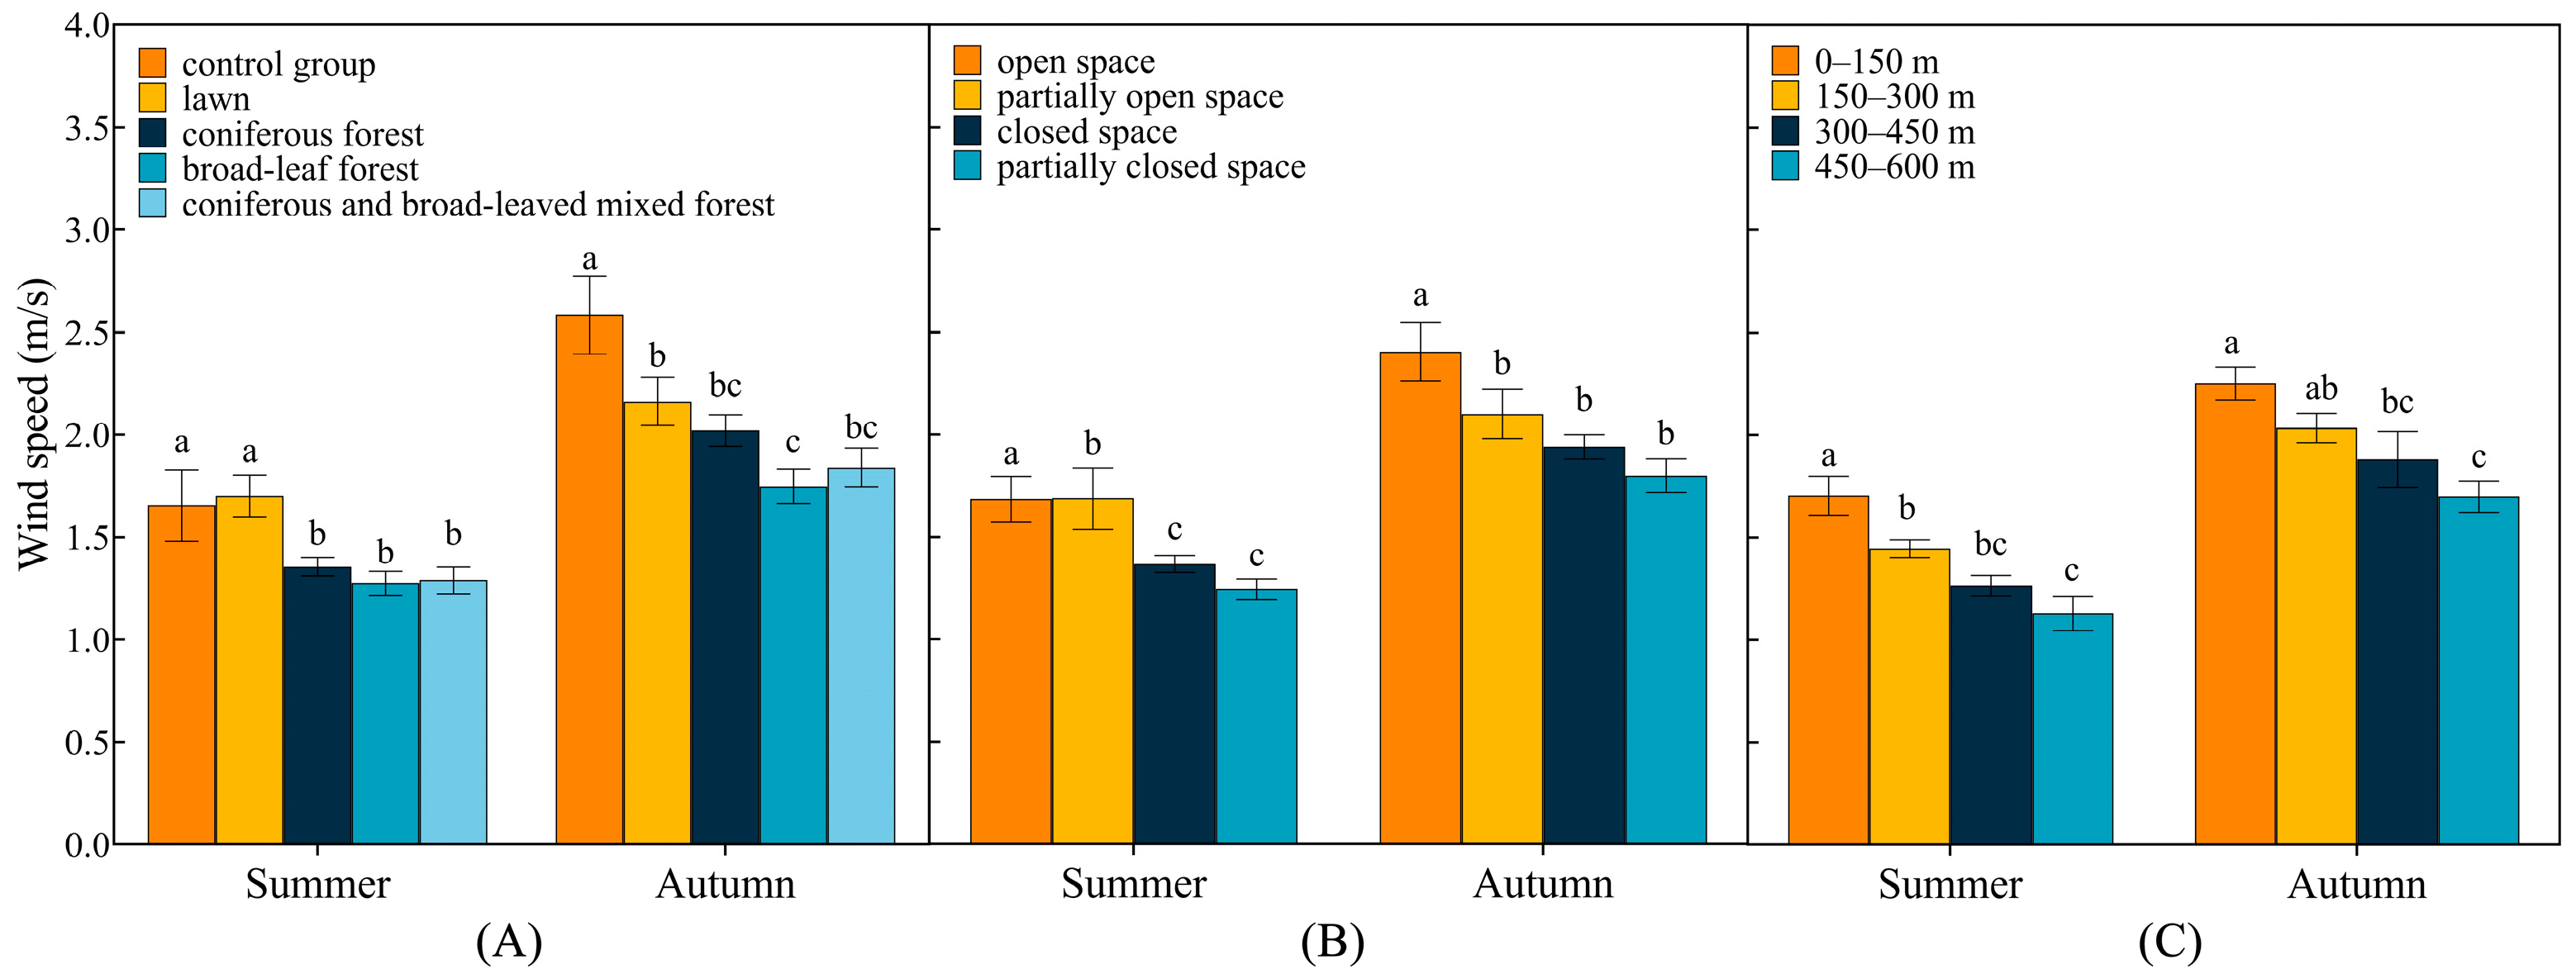
4.1. Differences in the Health Effects of a Single Recuperative Factor between Different Landscape Compositions

Most of the health factors, in terms of landscape composition, showed a trend of forest > lawn > control groups; this trend aligns with the findings of numerous previous studies [33,34]. For instance, Wang et al. (2022), showed that plant community species, leaf area index, plant height, and biomass index are important factors contributing to high NAIC within forests [35]. This is also an important factor in regulating the comfort of the acoustic environment in the forest [36]. As for PM2.5 and PM10, research in Florence, Italy found that plant diversity in forests has a direct inhibitory effect on PM2.5 and PM10 [37]. Our results are also consistent with Zhu et al.’s (2021) research, indicating that a forested environment exhibits superior microclimate regulation across all seasons in comparison to forestless areas [38]. However, human comfort is not exclusively determined by forest canopy cover, it is also affected by factors such as temperature, wind speed, and solar radiation [39]. Furthermore, as the seasons transition from spring to winter, the relative impact of temperature decreases, while the relative influence of wind speed and radiation increases [40]. Coastal environments are notably affected by tidal winds and higher overall wind speeds (Appendix D) [41]. The space beneath the canopies of forests, especially coniferous ones, tends to be more confined than other sample points, limiting airflow and ventilation [42]. Additionally, forests possess a complex internal vertical structure, which causes solar radiation energy to accumulate at higher levels [43]. Forests also feature a greater density of ground cover and herbaceous plants, which dissipate heat more slowly than control areas and grasslands [44]. Due to the ability of forests to provide a more comfortable experience compared to other land uses, we suggest appropriately increasing the forested area not only to improve the ecological benefit services in the region but also to potentially attract more tourists, thereby contributing to the local economy.

4.2. Differences in Health Effects of a Single Recuperative Factor between Different Landscape Configurations

Our investigation indicates that, within different landscape configurations, the health effects of most individual recuperation factors are more pronounced in closed and partially enclosed spaces. This trend contrasts with the impact observed in open and partially open spaces. Research indicates that the top and bottom of green spaces have a significant impact on microclimate regulation [45]. Trees are capable of releasing terpenes and terpenoids that have significant health benefits for the human body [46]. Moreover, the more complex the spatial structure of vegetation, the more pronounced the regulatory functions of green spaces become [47]. Closed and partially enclosed spaces exhibit a lower SVF and greater spatial complexity compared to open spaces. Vegetation coverage is higher in closed and partially enclosed spaces than in open and partially open spaces. The envelopment of vegetation reduces the influence of coastal tidal winds, facilitating the rapid settling of airborne particles. The physical and chemical properties of vegetation, including leaves and stems, accelerate the adhesion of airborne particles, resulting in lower concentrations of airborne particles in closed and partially enclosed spaces [48]. Moreover, existing research suggests a correlation between vegetation density and noise attenuation [49]. Canopy cover and diversity in tree height also have significant positive effects on acoustic indices [50].
However, an intriguing exception was observed in the concentration of CI, which demonstrated a higher concentration in the partially open space during the summer, in contrast to the closed space and partially closed space. This discrepancy arises due to the higher SVF values in partially open spaces, unlike closed spaces, leading to a larger area of visible sky and moderate exposure to solar radiation [51]. These conditions promote photosynthesis and photovoltaic effects in plants, resulting in the production of substantial amounts of negative air ions. Furthermore, elevated summer temperatures, coupled with restricted air circulation in enclosed spaces, often lead to the closure of plant stomata, causing a decrease in the concentration of negative air ions within closed spaces and partially closed spaces [52].

4.3. Differences in Health Effects of Single Recuperation Factors between Different Coastal Distances

Researchers have established a close relationship between concentrations of coastal distance and health and well-being. Our study indicates a trend of 0–300 m > 300–600 m concerning the health effects of most individual factors, except for the noise index.
This may be linked to the Lenard effect, tidal winds, vegetation composition, and coastal topography. First, coniferous forests are the dominant form of landscape composition in the 0–300 m interval from the coastline, especially at 0–150 m. They release a significant amount of negative air ions through tip discharge. Previous studies have reported that coniferous species possess thicker leaf epidermal wax, facilitating the rapid adsorption of airborne particulate matter and thereby reducing its concentrations [53]. The Lenard effect generated by the impact of seawater on rocky outcrops can increase atmospheric humidity, thereby extending the lifespan of NAIC [54]. When relative humidity reaches a certain threshold, the wet deposition effect of airborne particulate matter is enhanced, leading to a decrease in the concentrations of particulate matter in coastal air [55]. On the other hand, a previous study found that tidal winds are the main factor affecting coastal microclimates and human comfort [56]. During the night, the dominant wind direction is landward, resulting in dry and clear air. The high heat capacity and low thermal conductivity of seawater create a “thermostatic effect”, efficiently regulating heat variations in the city and fostering more comfortable microclimatic conditions [57].
Finally, Bian et al., (2022) elucidated that the spatial variability of the acoustic landscape is significantly influenced by factors such as proximity to roadways, distance to neighboring water bodies, and the vertical structural complexity of vegetation [58]. Furthermore, the distribution of noise is modulated by human activities, wherein regions in closer proximity to the sea exhibit heightened human traffic, causing elevated levels of ambient noise [59]. It is worth noting that our results found that noise levels in the coastal green space were generally lower in autumn than in summer. As a typical tourist city, summer is the peak season for Qingdao, with a surge in the number of visitors to the coastal green space, generating significantly higher noise decibel values than in autumn.

4.4. Rehabilitative Landscape Design and Integrated Health Effects of Coastal Green Space

The overall ecological healthcare function of coastal green spaces is intricately tied to landscape configuration, composition, and coastal distance. According to the findings presented in this paper, the most effective health benefits are observed in the closed coniferous and broadleaf mixed forest at 150–300 m. In contrast, 300–450 m exhibits a denser road network and building clusters when compared to 150–300 m, leading to a fragmented distribution of landscape elements and configurations. This, in turn, significantly impacts the coastal green healthcare index (CGHI) due to environmental influences. Moreover, 450–600 m, being closer to the city center, is susceptible to the urban heat island effect and other external factors [60]. Concurrently, 0–150 m experiences increased human activity due to the attraction of aquatic environments and outdoor pursuits, resulting in a higher CGHI at 150–300 m.
Despite considerable research on the therapeutic potential of coastal spaces, limited attention has been given to the influence of landscape elements in specific environments such as coastal green spaces. Grounded in scene theory and contextualized within the current site conditions, this study elucidates the health impact and distribution patterns of singular and comprehensive therapeutic elements. The research site is systematically delineated into four principal experiential domains, namely, the coastal ecological healing experience scene zone, negative ion healing experience scene zone, microclimate interactive experience scene zone, and coastal culture comprehensive experience scene zone (see Figure 9). The investigation concentrates on augmenting the functionality of coastal green spaces and strategically situating focal points in alignment with the concentrated dispersion of therapeutic factors. Within the microclimate interactive experience scenario, emphasis is placed on the discernment of natural textures and tactile sensations, judicious selection of plant varieties and hues, effective management of olfactory stimuli, and the integration of natural soundscapes along the coastal locale. Simultaneously, meticulous consideration is given to the dynamic qualities of light within the plant community to orchestrate a diverse sensory encounter within the coastal microclimate. In the negative ion healing experience scenario, deliberate attention is directed towards leveraging plant configurations to configure varied activity spaces, including O-shaped, U-shaped, L-shaped, and parallel spaces, thereby affording individuals a multitude of interaction possibilities (see Figure 10) [61]. Concurrently, the coastal ecological healing experience scene and the coastal culture comprehensive experience scene amalgamate nature education with water-based activities. The orchestration of an aesthetically pleasing visual space is achieved through the controlled elevation of billboards and structures within the coastal green space, harnessing the natural cooling attributes of the ocean to introduce sea breezes into the urban fabric. This strategic intervention establishes ventilation corridors, mitigating the intensity of summer heat within the cityscape [62]. Future landscape design should reinforce the restorative effects of the area through a judicious selection and configuration of landscape types, elements, and components.

5. Conclusions and Recommendations for Urban Greening and Planning

In this study of the coastal green spaces in Qingdao, we conducted a quantitative analysis to compare the individual and overall health benefits associated with various landscape compositions, landscape configurations, and coastal distances. Our findings revealed the following: (1) when considering the individual impact of healing factors, forested areas outperformed grassland and control sites; enclosed and partially enclosed spaces were more attractive compared to open and partially open spaces. Within coastal distance, the zone within 0–300 m from the shoreline demonstrated better health benefits, except for noise-related factors; and (2) regarding comprehensive health effects, the most favorable outcomes were found in closed mixed coniferous and broadleaf forests located 150–300 m from the coast. Therefore, visitors can opt to visit either the location with the most potent individual healing factor or the zone offering the most comprehensive healthcare benefits, aligning with their specific healthcare preferences. The two distinct outcomes presented above underscore the limitations of single-factor analysis in practical scenarios, emphasizing the necessity of a comprehensive evaluation that considers a multitude of factors.
Our results suggest prioritizing closed and partially closed landscape designs in the planning and development phases to promote the comprehensive health impact of coastal green spaces. Additionally, we recommend the increased cultivation of mixed coniferous and broadleaf forest species to enhance air quality by capturing airborne particles, generating higher levels of negative air ions, and creating a more comfortable microclimate along the coast. The associations between the coastal therapeutic factors and human health observed in this study should encourage policymakers to manage coastal green spaces sustainably to maintain continued public use of its salutogenic resources in the future. The results of this study provide valuable insights into the health effects of coastal green spaces, considering diverse landscape compositions, landscape configurations, and coastal distance, which can serve as a valuable resource for future urban green space planning and design focused on coastal recreational activities.

Author Contributions

X.L.: conception, design of the study, data collection, analysis, and drafting of the manuscript; Z.G. and K.W.: revising the manuscript; D.K., Y.Z., and C.L.: filed survey and ecological factors measured; H.L.: design of the study, conception, revising the manuscript and final approval of the manuscript. All authors have read and agreed to the published version of the manuscript.

Funding

This research was funded by the National Natural Science Foundation of China (31800448), the Shanghai Key Lab for Urban Ecological Processes and Eco-Restoration (SHUES2018A03), and the Research Fund for High-level Talents of Qingdao Agricultural University (6631118009 and 6631119001).

Data Availability Statement

The data presented in this study are available on request from the corresponding author.

Conflicts of Interest

The authors declare that they have no known competing financial interests or personal relationships that could have appeared to influence the work reported in this paper.

Appendix A. Schematic Diagram of the Test Site

Figure A1. Schematic diagram of the test site. Since the number of fisheye lens images and site status images of the 36 test sites is too many to list one by one, four representative test site images are selected to show the test site environment schematically. In the figure, the fisheye lens image is represented by the first row of circular images, the middle is the range of SVF values, and the last row is the site status image corresponding to the fisheye lens image.
Forests 14 02463 g0a1

Appendix B. Criteria Sheet for Evaluation of Conditioning Factors

Equation (A1) calculates the q and Equation (A2), the air ion evaluation index (CI):
q = n+/n−
CI = n−/(1000 × q)
where n+ and n− are positive and negative air ion concentrations, respectively, and q is the single-level coefficient. The smaller the value of the CI, the poorer the air quality.
Equation (A3) determines the human comfort index (S):
S = 0.6(|T − 24|) + 0.07(|RH − 70|) + 0.5(|V − 2|)
where S is the human comfort index, T is temperature (°C), RH is relative humidity (%), and V is wind speed (m/s). The lower the S value, the higher the comfort level.
Table A1. Evaluation criteria for the single recuperative factor.
GradeAir Cleanliness Evaluation TableAir Particle Concentration Evaluation TableComfort Index Evaluation of Lu Ding HuangAcoustic Environments Index Evaluation Criteria
CICleanliness of AirPM10 (μg/m3)Health EffectsPM2.5 (μg/m3)Health EffectsSHealth EffectsNF (dB)Health Effects
I>1.0Cleanest, excellent health effects≤50Clean≤35CleanS ≤ 4.55Very comfortable<40Very quiet
II1.0–0.7Cleaner, stronger health effects50–150Medium35–75Medium4.55 < S ≤ 5.75Comfortable40–50Quiet
III0.69–0.50Moderately clean, average health effect>150Contaminated>75Contaminated5.75 < S ≤ 6.95Medium50–70Quieter
IV0.49–0.30Permissible range, weaker health effects6.95 < S ≤ 9Uncomfortable70–90Noisier
V<0.29Below the threshold, no health effectsS > 9Extremely uncomfortable90–120Noisy
VII>120Not conducive to physical and mental health

Appendix C. Coastal Green Comprehensive Health Index Evaluation

Table A2. Indicators’ normalized value of different points and their CGHI.
Test SiteNAICPM10PM2.5SNFCGHIGrade
50.9040.7600.9340.4330.6910.803I
190.8390.8830.9320.4880.6210.799I
200.6040.9300.8350.5810.8850.793I
270.7020.7870.7870.6710.8810.773I
20.5470.9350.9550.3950.7520.770I
180.7300.8070.6540.4400.8980.761I
280.7430.8150.8040.4520.7490.761I
240.6560.9040.8980.7870.6690.760I
340.6760.8050.7840.4500.7830.745I
160.7260.8840.8080.5860.6310.745I
360.6700.7620.9440.5100.6700.738II
150.6870.7440.6970.6140.8750.737II
230.7210.8090.8360.4450.6010.723II
250.8220.7260.6880.4140.6440.709II
320.5240.8710.8150.5390.7080.708II
140.6610.6840.9340.5860.6420.707II
290.6550.7740.8540.4670.5890.698II
310.5290.7090.9300.4490.6940.689II
120.8030.6100.7630.4580.5900.677II
300.7120.7070.7020.6620.6390.677II
260.5480.6780.6410.3480.8810.673II
170.5480.7640.7700.6060.5590.641II
10.6170.6130.5970.8230.779 0.641II
220.6830.5450.5870.6580.7690.637II
330.6130.5640.7880.7070.6150.627III
350.7460.3930.2460.5370.8500.564III
110.3160.5390.6870.4290.5650.506III
210.2480.5670.6530.4320.4700.463III
90.2600.4510.4850.3210.6760.454III
70.2170.3320.4960.5540.4720.364IV
80.1970.4010.2970.3710.5390.351IV
100.0310.2280.3990.1970.7870.346IV
30.3390.2290.2730.3410.5200.336IV
60.0520.2110.3290.2150.7630.327IV
130.2320.2400.4020.2300.3030.283IV
40.0930.0360.0470.3650.2510.107V
Table A3. Indicators’ normalized value of different type and their CGHI.
TypeCategoryNAICPM10PM2.5SNFCGHIGrade
Landscape compositionsLawn0.3510.5050.5750.446 0.558 0.486III
Control groups0.1010.1780.2950.253 0.526 0.268V
Coniferous forest0.6690.7860.8140.578 0.668 0.721II
Broadleaf forest0.6770.7270.7930.541 0.699 0.711II
coniferous Broadleaf mixed forest0.7120.7280.7010.506 0.812 0.730II
Landscape configurationsOpen space0.1930.2830.3900.333 0.542 0.344IV
Partially open space0.4180.6230.6650.480 0.558 0.553III
Closed space0.7050.7440.7690.514 0.718 0.722II
Partially closed space0.6670.7500.7700.569 0.734 0.718II
Coastal distance0–150 m0.5780.6420.6370.512 0.661 0.6207III
150–300 m0.5390.6560.6950.508 0.654 0.6241III
300–450 m0.5390.6130.6860.447 0.637 0.6066III
450–600 m0.5300.6090.6770.486 0.714 0.6209III
NAIC—negative air ion concentration; S—human comfort index; NF—noise index; CGHI—coastal green comprehensive healthcare index.

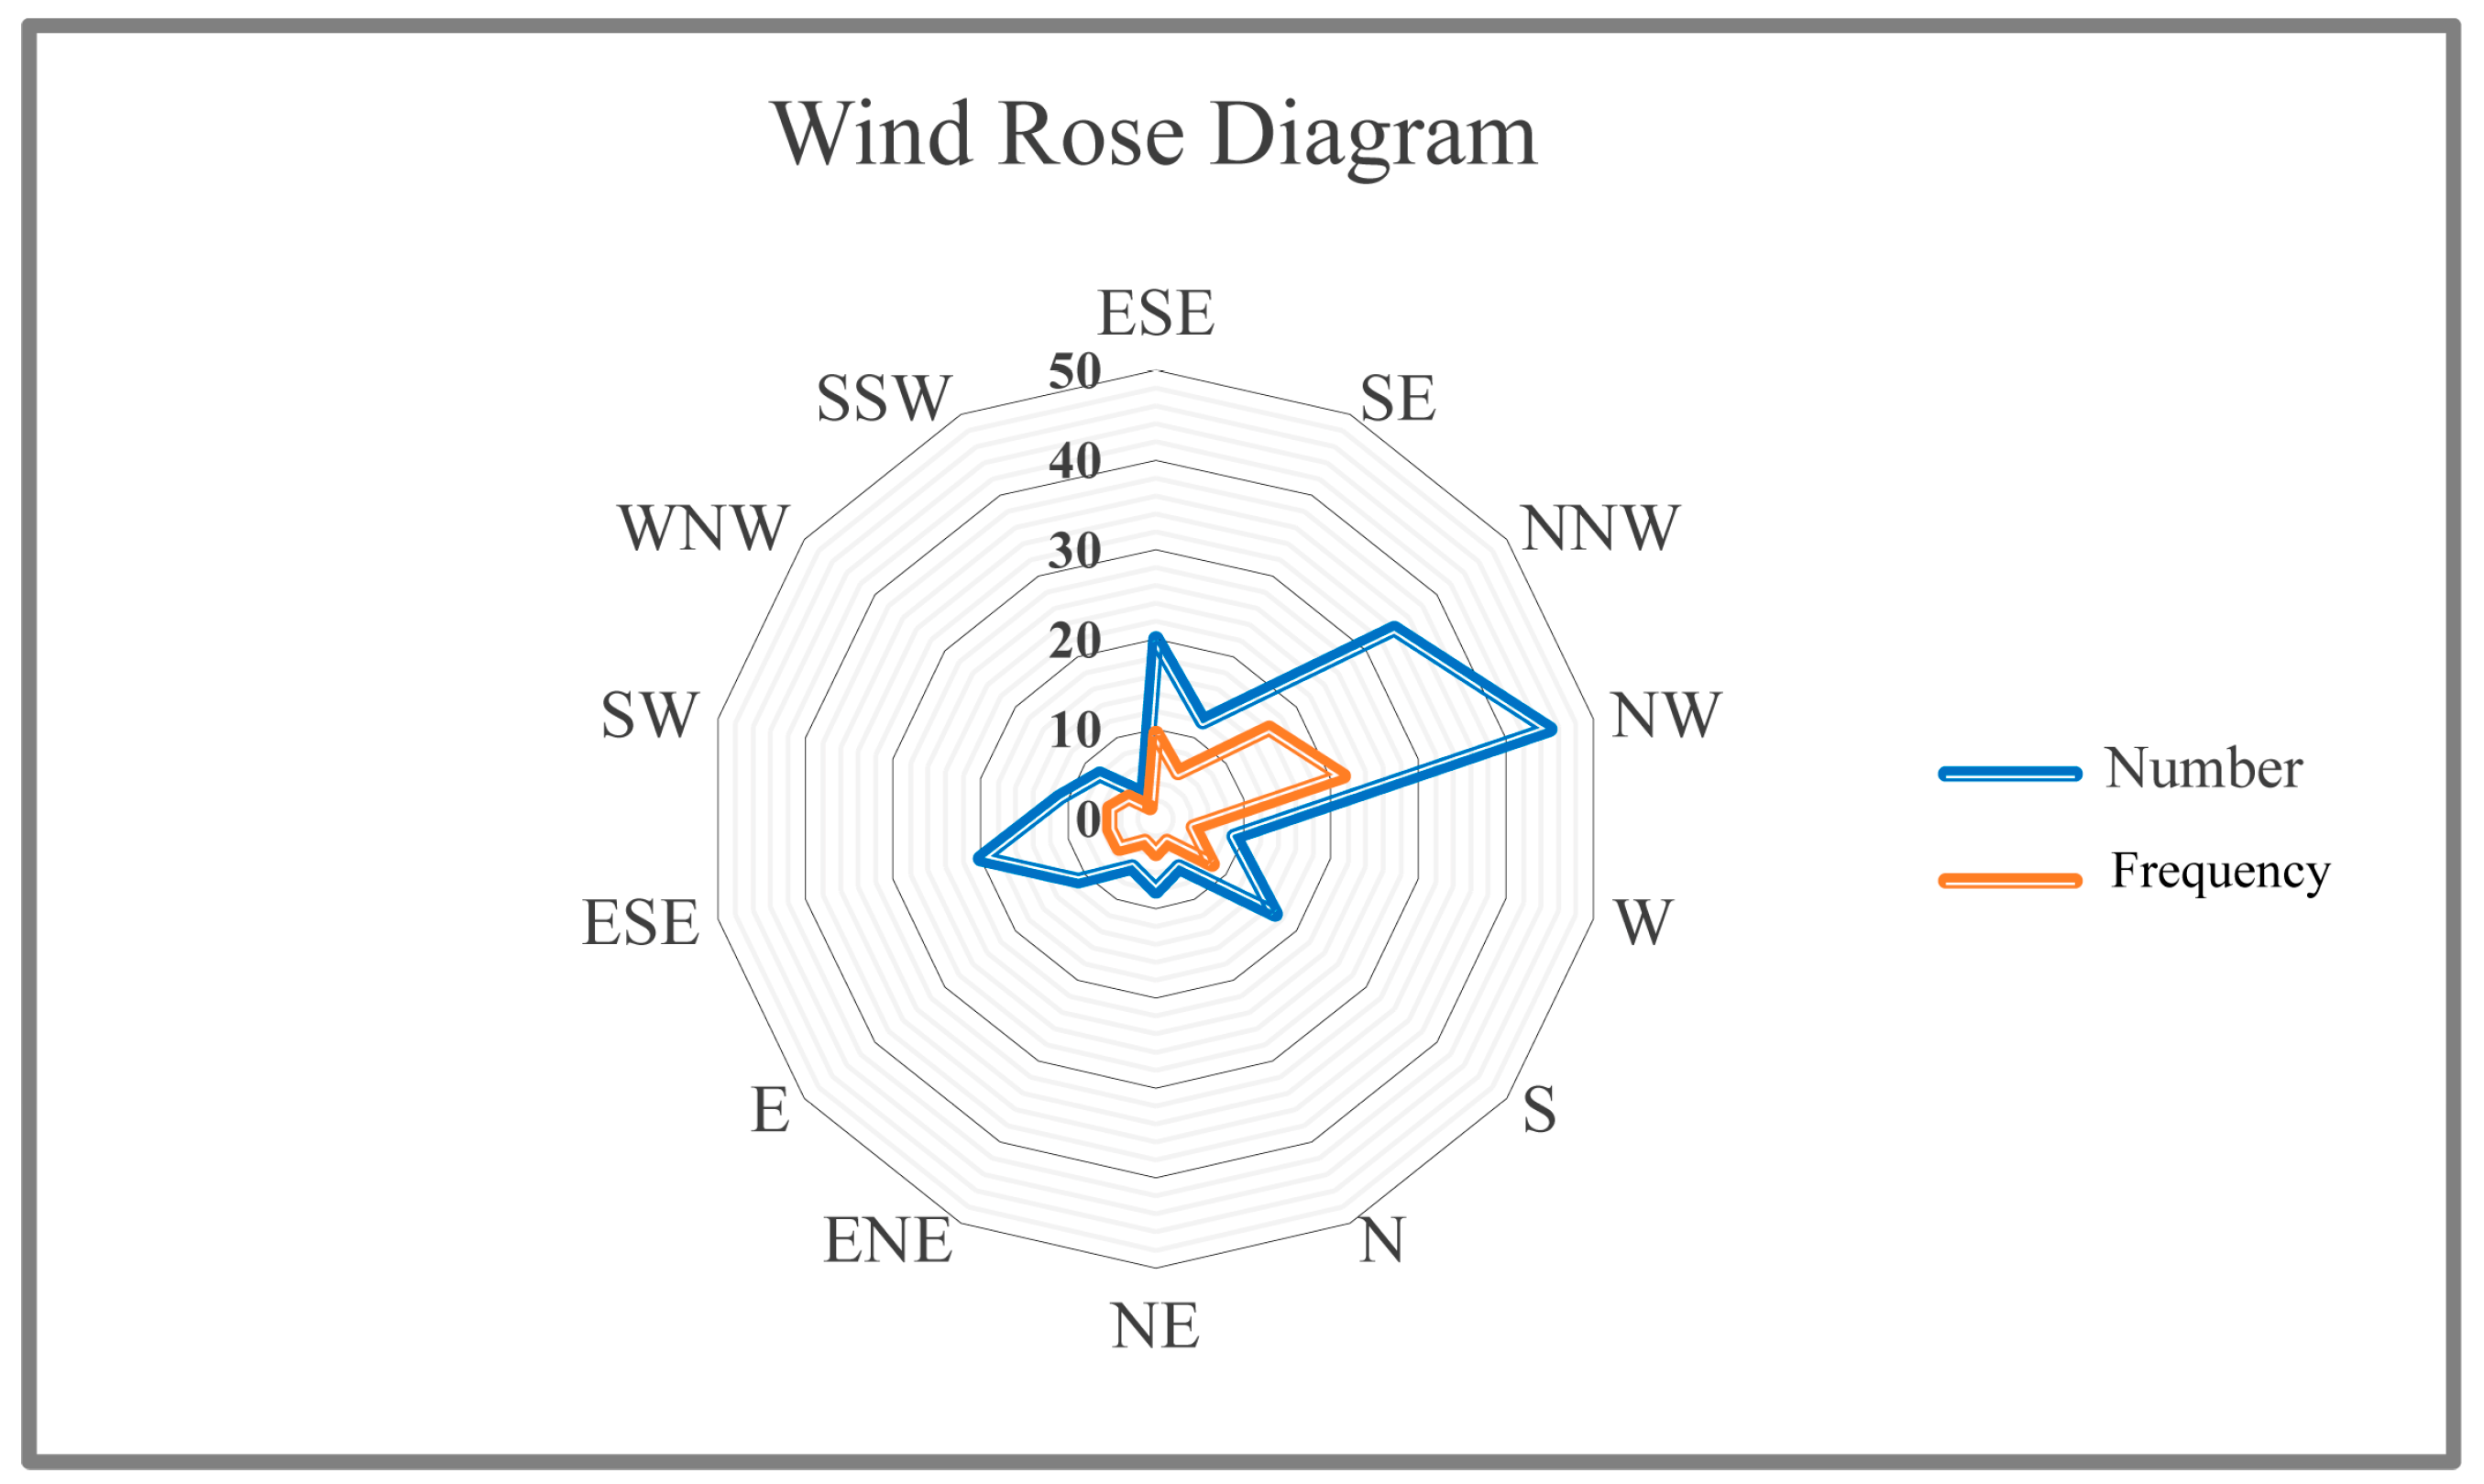
Appendix D. Wind Speed and Rose Wind Direction Chart

Figure A2. Comparison of wind speeds in different landscape compositions (A); landscape configurations (B); and coastal distances (C). The different lowercase letters indicate significant differences in landscape composition (p < 0.05).
Forests 14 02463 g0a2
Figure A3. Wind rose wind direction map of Qingdao coastal green space.
Forests 14 02463 g0a3

References

  1. Gruebner, O.; Rapp, M.A.; Adli, M.; Kluge, U.; Galea, S.; Heinz, A. Cities and Mental Health. Dtsch. Aerzteblatt Int. 2017, 114, 121–127. [Google Scholar] [CrossRef] [PubMed]
  2. He, X.; Zang, T.; Sun, B.; Ikebe, K. Tourists’ Motives for Visiting Historic Conservation Areas in the Post-Pandemic Era: A Case Study of Kuanzhai Alley in Chengdu, China. Sustainability 2023, 15, 3130. [Google Scholar] [CrossRef]
  3. Huang, B.; Feng, Z.; Pan, Z.; Liu, Y. Amount of and proximity to blue spaces and general health among older Chinese adults in private and public housing: A national population study. Health Place 2022, 74, 102774. [Google Scholar] [CrossRef] [PubMed]
  4. Sandifer, P.A.; Braud, A.S.; Knapp, L.C.; Taylor, J. Is Living in a U.S. Coastal City Good for One’s Health? Int. J. Environ. Res. Public. Health 2021, 18, 8399. [Google Scholar] [CrossRef]
  5. Britton, E.; Kindermann, G.; Domegan, C.; Carlin, C. Blue care: A systematic review of blue space interventions for health and wellbeing. Health Promot. Int. 2020, 35, 50–69. [Google Scholar] [CrossRef] [PubMed]
  6. White, M.P.; Elliott, L.R.; Gascon, M.; Roberts, B.; Fleming, L.E. Blue space, health and well-being: A narrative overview and synthesis of potential benefits. Environ. Res. 2020, 191, 110169. [Google Scholar] [CrossRef] [PubMed]
  7. Gao, H.; Ning, Y.; Liu, S. The effects of landscape composition and configuration on forest Gross Primary Production (GPP) are affected by climate conditions: Patterns and management implications. Landsc. Ecol. 2023, 38, 2277–2291. [Google Scholar] [CrossRef]
  8. Chen, Y.; Yuan, Y. The neighborhood effect of exposure to blue space on elderly individuals’ mental health: A case study in Guangzhou, China. Health Place 2020, 63, 102348. [Google Scholar] [CrossRef]
  9. Huang, R.; Li, A.; Li, Z.; Chen, Z.; Zhou, B.; Wang, G. Adjunctive Therapeutic Effects of Forest Bathing Trips on Geriatric Hypertension: Results from an On-Site Experiment in the Cinnamomum camphora Forest Environment in Four Seasons. Forests 2023, 14, 75. [Google Scholar] [CrossRef]
  10. Sandifer, P.A. Linking coastal environmental and health observations for human wellbeing. Front. Public Health 2023, 11, 1202118. [Google Scholar] [CrossRef]
  11. Elliott, L.R.; White, M.P.; Grellier, J.; Garrett, J.K.; Cirach, M.; Wheeler, B.W.; Bratman, G.N.; van den Bosch, M.A.; Ojala, A.; Roiko, A.; et al. Research Note: Residential distance and recreational visits to coastal and inland blue spaces in eighteen countries. Landsc. Urban Plan. 2020, 198, 103800. [Google Scholar] [CrossRef]
  12. Buonincontri, M.P.; Bosso, L.; Smeraldo, S.; Chiusano, M.L.; Pasta, S.; Di Pasquale, G. Shedding light on the effects of climate and anthropogenic pressures on the disappearance of Fagus sylvatica in the Italian lowlands: Evidence from archaeo-anthracology and spatial analyses. Sci. Total Environ. 2023, 877, 17. [Google Scholar] [CrossRef] [PubMed]
  13. Zhang, Y.; Hu, X.; Liu, Z.; Zhou, C.; Liang, H. A Greening Strategy of Mitigation of the Thermal Environment for Coastal Sloping Urban Space. Sustainability 2023, 15, 295. [Google Scholar] [CrossRef]
  14. Yang, X.; Gao, Y.; Li, Q.; He, J.; Liu, Y.; Duan, K.; Xu, X.; Ji, D. Maritime and coastal observations of ambient PM2.5 and its elemental compositions in the Bohai Bay of China during spring and summer: Levels, spatial distribution and source apportionment. Atmos. Res. 2023, 293, 106897. [Google Scholar] [CrossRef]
  15. Yuan, S.; Browning, M.H.E.M.; McAnirlin, O.; Sindelar, K.; Shin, S.; Drong, G.; Hoptman, D.; Heller, W. A virtual reality investigation of factors influencing landscape preferences: Natural elements, emotions, and media creation. Landsc. Urban Plan. 2023, 230, 104616. [Google Scholar] [CrossRef]
  16. Garrett, J.K.; Clitherow, T.J.; White, M.P.; Wheeler, B.W.; Fleming, L.E. Coastal proximity and mental health among urban adults in England: The moderating effect of household income. Health Place 2019, 59, 102200. [Google Scholar] [CrossRef]
  17. Hooyberg, A.; Roose, H.; Grellier, J.; Elliott, L.R.; Lonneville, B.; White, M.P.; Michels, N.; De Henauw, S.; Vandegehuchte, M.; Everaert, G. General health and residential proximity to the coast in Belgium: Results from a cross-sectional health survey. Environ. Res. 2020, 184, 109225. [Google Scholar] [CrossRef]
  18. Dudek, T.; Kasprzyk, I.; Dulska-Jeż, A. Forest as a place for recreation but also the source of allergenic plant pollen: To come or avoid? Eur. J. For. Res. 2018, 137, 849–862. [Google Scholar] [CrossRef]
  19. Qian, W.; Zhao, Y.; Li, X. Construction of ecological security pattern in coastal urban areas: A case study in Qingdao, China. Ecol. Indic. 2023, 154, 110754. [Google Scholar] [CrossRef]
  20. Ou, Y.; Li, Y.; Lv, L.; Mu, H.; Li, H. Effects of leaf microstructures on the water storage capacity of common urban landscape trees. Ecohydrology 2023, 16, 2538. [Google Scholar] [CrossRef]
  21. Aroma, R.J.; Raimond, K.; Estrela, V.V.; de Jesus, M.A. A coastal band spectral combination for water body extraction using Landsat 8 images. Int. J. Environ. Sci. Technol. 2023, 2023, 05027. [Google Scholar] [CrossRef]
  22. Scardino, G.; Mancino, S.; Romano, G.; Patella, D.; Scicchitano, G. An Integrated Approach between Multispectral Satellite Images and Geophysical and Morpho-Topographic Surveys for the Detection of Water Stress Associated with Coastal Dune Erosion. Remote Sens. 2023, 15, 4415. [Google Scholar] [CrossRef]
  23. Sunder, S.; Ramsankaran, R.; Ramakrishnan, B. Inter-comparison of remote sensing-based shoreline mapping techniques at different coastal stretches of India. Environ. Monit. Assess. 2017, 189, 290. [Google Scholar] [CrossRef] [PubMed]
  24. Li, W.; Kang, J.; Wang, Y. Distinguishing the relative contributions of landscape composition and configuration change on ecosystem health from a geospatial perspective. Sci. Total Environ. 2023, 894, 165002. [Google Scholar] [CrossRef] [PubMed]
  25. Xiong, Y.; Yan, Y. Effects of spatial design and microclimate on human thermal comfort in the region south of the Yangtze River: A case study of old street in Gaochun, Nanjing. J. Nanjing For. Univ. 2021, 45, 219. [Google Scholar] [CrossRef]
  26. Ge, J.; Wang, Y.; Akbari, H.; Zhou, D. The effects of sky view factor on ground surface temperature in cold regions—A case from Xi’an, China. Build. Environ. 2022, 210, 108707. [Google Scholar] [CrossRef]
  27. Oke, T.R. Canyon geometry and the nocturnal urban heat island: Comparison of scale model and field observations. J. Climatol. 1981, 1, 237–254. [Google Scholar] [CrossRef]
  28. Liang, H.; Chen, X.; Yin, J.; Da, L. The spatial-temporal pattern and influencing factors of negative air ions in urban forests, Shanghai, China. J. For. Res. 2014, 25, 847–856. [Google Scholar] [CrossRef]
  29. Wu, C.-F.; Lai, C.-H.; Chu, H.-J.; Lin, W.-H. Evaluating and Mapping of Spatial Air Ion Quality Patterns in a Residential Garden Using a Geostatistic Method. Int. J. Environ. Res. Public Health 2011, 8, 2304–2319. [Google Scholar] [CrossRef]
  30. Liu, J.; Gao, X.; Ruan, Z.; Yuan, Y.; Dong, S. Analysis of spatial and temporal distribution and influencing factors of fine particles in Heilongjiang Province. Urban. Clim. 2022, 41, 101070. [Google Scholar] [CrossRef]
  31. Zhu, S.; He, S.; Hu, F.; Guo, Y.; Su, Y.; Cui, G.; Li, J.; Qiu, Q.; He, Q. Exurban and suburban forests have superior healthcare benefits beyond downtown forests. Front. Ecol. Evol. 2023, 11, 1105213. [Google Scholar] [CrossRef]
  32. Jin, Y.; Jin, H.; Kang, J. Combined effects of the thermal-acoustic environment on subjective evaluations in urban squares. Build. Environ. 2020, 168, 106517. [Google Scholar] [CrossRef]
  33. Wang, R.; Chen, Q.; Wang, D. Effects of Altitude, Plant Communities, and Canopies on the Thermal Comfort, Negative Air Ions, and Airborne Particles of Mountain Forests in Summer. Sustainability 2022, 14, 3882. [Google Scholar] [CrossRef]
  34. Wang, H.; Wang, B.; Niu, X.; Song, Q.; Li, M.; Luo, Y.; Liang, L.; Du, P.; Peng, W. Study on the change of negative air ion concentration and its influencing factors at different spatio-temporal scales. Glob. Ecol. Conserv. 2020, 23, e01008. [Google Scholar] [CrossRef]
  35. Wang, Y.; Xu, S.; Li, B.; Chen, W.; Li, Y.; He, X.; Wang, N. Responses of spring leaf phenological and functional traits of two urban tree species to air warming and/or elevated ozone. Plant Physiol. Biochem. 2022, 179, 158–167. [Google Scholar] [CrossRef]
  36. Rey-Gozalo, G.; Barrigón Morillas, J.M.; Montes González, D.; Vílchez-Gómez, R. Influence of Green Areas on the Urban Sound Environment. Curr. Pollut. Rep. 2023; in press. [Google Scholar] [CrossRef]
  37. Speak, A.F.; Salbitano, F. Thermal Comfort and Perceptions of the Ecosystem Services and Disservices of Urban Trees in Florence. Forests 2021, 12, 1387. [Google Scholar] [CrossRef]
  38. Zhu, S.-X.; Hu, F.-F.; He, S.-Y.; Qiu, Q.; Su, Y.; He, Q.; Li, J.-Y. Comprehensive Evaluation of Healthcare Benefits of Different Forest Types: A Case Study in Shimen National Forest Park, China. Forests 2021, 12, 207. [Google Scholar] [CrossRef]
  39. Xue, S.; Chao, X.; Wang, K.; Wang, J.; Xu, J.; Liu, M.; Ma, Y. Impact of Canopy Coverage and Morphological Characteristics of Trees in Urban Park on Summer Thermal Comfort Based on Orthogonal Experiment Design: A Case Study of Lvyin Park in Zhengzhou, China. Forests 2023, 14, 2098. [Google Scholar] [CrossRef]
  40. Liu, W.; Zhang, Y.; Deng, Q. The effects of urban microclimate on outdoor thermal sensation and neutral temperature in hot-summer and cold-winter climate. Energy Build. 2016, 128, 190–197. [Google Scholar] [CrossRef]
  41. Lai, Y.; Ning, Q.; Ge, X.; Fan, S. Thermal Regulation of Coastal Urban Forest Based on ENVI-Met Model—A Case Study in Qinhuangdao, China. Sustainability 2022, 14, 7337. [Google Scholar] [CrossRef]
  42. Lin, W.; Zeng, C.; Lam, N.S.N.; Liu, Z.; Tao, J.; Zhang, X.; Lyu, B.; Li, N.; Li, D.; Chen, Q. Study of the relationship between the spatial structure and thermal comfort of a pure forest with four distinct seasons at the microscale level. Urban. For. Urban. Green. 2021, 62, 127168. [Google Scholar] [CrossRef]
  43. Tang, H.; Yang, Q.; Jiang, M.; Wang, T.; Li, X.; Chen, Q.; Luo, Z.; Lv, B. Seasonal Variation in the Thermal Environment and Health-Related Factors in Two Clustered Recreational Bamboo Forests. Forests 2023, 14, 1894. [Google Scholar] [CrossRef]
  44. Song, C.; Duan, G.; Wang, D.; Liu, Y.; Du, H.; Chen, G. Study on the influence of air velocity on human thermal comfort under non-uniform thermal environment. Build. Environ. 2021, 196, 107808. [Google Scholar] [CrossRef]
  45. Senlin, Z.; Jean-Michel, G.; Zhixin, L.; Lihua, Z. Influence of Trees on the Outdoor Thermal Environment in Subropical Areas: An Experimental Study in Guang Zhou, China. Sustain. Cities Soc. 2018, 42, S2210670718305468. [Google Scholar] [CrossRef]
  46. Dudek, T.; Marć, M.; Zabiegała, B. Chemical Composition of Atmospheric Air in Nemoral Scots Pine Forests and Submountainous Beech Forests: The Potential Region for the Introduction of Forest Therapy. Int. J. Environ. Res. Public Health 2022, 19, 15838. [Google Scholar] [CrossRef] [PubMed]
  47. Wang, C.; Wang, Z.H.; Ryu, Y.H. A single-layer urban canopy model with transmissive radiation exchange between trees and street canyons. Build. Environ. 2021, 191, 107593. [Google Scholar] [CrossRef]
  48. Nwankwo, M.; Meng, Q.; Yang, D.; Liu, F. Effects of Forest on Birdsong and Human Acoustic Perception in Urban Parks: A Case Study in Nigeria. Forests 2022, 13, 994. [Google Scholar] [CrossRef]
  49. Sachs, A.L.; Boag, A.E.; Troy, A. Valuing urban trees: A hedonic investigation into tree canopy influence on property values across environmental and social contexts in Baltimore, Maryland. Urban For. Urban Green. 2023, 80, 127829. [Google Scholar] [CrossRef]
  50. Hao, Z.; Wang, C.; Sun, Z.; Zhao, D.; Sun, B.; Wang, H.; Bosch, C.K. Vegetation structure and temporality influence the dominance, diversity, and composition of forest acoustic communities. For. Ecol. Manag. 2021, 482, 118871. [Google Scholar] [CrossRef]
  51. Morakinyo, T.E.; Kong, L.; Lau, K.K.-L.; Yuan, C.; Ng, E. A study on the impact of shadow-cast and tree species on in-canyon and neighborhood’s thermal comfort. Build. Environ. 2017, 115, 1–17. [Google Scholar] [CrossRef]
  52. Gillerot, L.; Landuyt, D.; Oh, R.R.Y.; Chow, W.T.L.; Haluza, D.; Ponette, Q.; Jactel, H.; Bruelheide, H.; Jaroszewicz, B.; Scherer-Lorenzen, M.; et al. Forest structure and composition alleviate human thermal stress. Glob. Change Biol. 2022, 28, 7340–7352. [Google Scholar] [CrossRef] [PubMed]
  53. Gao, G.J.; Sun, F.B.; Thao, N.T.T.; Lun, X.X.; Yu, X.X. Different Concentrations of TSP, PM10, PM2.5, and PM1 of Several Urban Forest Types in Different Seasons. Pol. J. Environ. Stud. 2015, 24, 2387–2395. [Google Scholar] [CrossRef]
  54. Zhang, C.; Wu, Z.; Wang, C.; Li, H.; Li, Z.; Lin, J.M. Hydrated negative air ions generated by air-water collision with TiO2 photocatalytic materials. RSC Adv. 2020, 10, 43420–43424. [Google Scholar] [CrossRef]
  55. Zhang, Y.; Yang, L.; Bie, S.; Zhao, T.; Huang, Q.; Li, J.; Wang, P.; Wang, Y.; Wang, W. Chemical compositions and the impact of sea salt in atmospheric PM1 and PM2.5 in the coastal area. Atmos. Res. 2021, 250, 105323. [Google Scholar] [CrossRef]
  56. Liu, L.; Cai, Y.; Jin, L.; Zhu, Y.; Gao, Y.; Ding, Y.; Xia, J.; Zhang, K. Landscape pattern optimization strategy of coastal mountainside greenway from a microclimatic comfort view in hot and humid areas. Urban Clim. 2022, 46, 101297. [Google Scholar] [CrossRef]
  57. Cureau, R.J.; Pigliautile, I.; Pisello, A.L. Seasonal and diurnal variability of a water body’s effects on the urban microclimate in a coastal city in Italy. Urban Clim. 2023, 49, 101437. [Google Scholar] [CrossRef]
  58. Bian, Q.; Wang, C.; Sun, Z.; Yin, L.; Jiang, S.; Cheng, H.; Zhao, Y. Research on spatiotemporal variation characteristics of soundscapes in a newly established suburban forest park. Urban For. Urban Green. 2022, 78, 127766. [Google Scholar] [CrossRef]
  59. Mu, B.; Liu, C.; Mu, T.; Xu, X.; Tian, G.; Zhang, Y.; Kim, G. Spatiotemporal fluctuations in urban park spatial vitality determined by on-site observation and behavior mapping: A case study of three parks in Zhengzhou City, China. Urban For. Urban Green. 2021, 64, 127246. [Google Scholar] [CrossRef]
  60. Xiao-Jing, W.U.; Zhang, Z.W.; Meng, X.F.; Zhen, L.I.; Wang, Y.J. Dynamics of diversity, distribution patterns and interspecific associations of understory herbs in the city-suburb-exurb context of Wuhan city, China. Arch. Biol. Sci. 2013, 65, 1619–1628. [Google Scholar] [CrossRef]
  61. Guo, W.; Wen, H.; Liu, X. Research on the psychologically restorative effects of campus common spaces from the perspective of health. Front. Public Health 2023, 11, 1131180. [Google Scholar] [CrossRef]
  62. Zhang, X.; Zhang, Y.; Zhai, J.; Wu, Y.; Mao, A. Waterscapes for Promoting Mental Health in the General Population. Int. J. Environ. Res. Public Health 2021, 18, 11792. [Google Scholar] [CrossRef] [PubMed]
Figure 1. Coastal distance and location of sampling points. 0.00–150 m: indicates distance from the coastline. Other intervals have the same meaning as above.
Forests 14 02463 g001
Figure 2. Tree diagram of Ward connections.
Forests 14 02463 g002
Figure 3. Comparison of negative air ion concentration in different landscape compositions (A); landscape configurations (B); and coastal distances (C). The different lowercase letters indicate significant differences in landscape composition (p < 0.05).
Forests 14 02463 g003
Figure 4. Comparison of airborne particulate matter concentration in different landscape compositions (A); landscape configurations (B); and coastal distances (C). The different lowercase letters indicate significant differences in landscape composition (p < 0.05).
Forests 14 02463 g004
Figure 5. Comparison of forest microclimate and human comfort index in different landscape compositions (A); landscape configurations (B); and coastal distances (C). The different lowercase letters indicate significant differences in landscape composition (p < 0.05).
Forests 14 02463 g005
Figure 6. Comparison of acoustic environment index in different landscape compositions (A); landscape configurations (B); and coastal distances (C). The different lowercase letters indicate significant differences in landscape composition (p < 0.05).
Forests 14 02463 g006
Figure 7. Normalized values of indicators at different points and their associated CGHI: (a) shows the plan and section of experimental site 5, with AA′ as the section line; and (b) shows the CGHI values for the 36 experimental sites, with the specific healthcare values for each site in blue, and the red dashed line showing the grading criteria.
Forests 14 02463 g007
Figure 8. Normalized values of indicators for various types and their corresponding CGHI.
Forests 14 02463 g008
Figure 9. Segmentation and primary scene node distribution of landscape scenes in Qingdao coastal green space.
Forests 14 02463 g009
Figure 10. Conceptual diagram of coastal green space main scenes: (a) improve the structure of the vegetation community according to the distribution and concentration laws of healing factors, increase the application of recreational plants, and improve hydrophilicity and accessibility by combining the advantages of coastal geographic location and distance with the design of the trestle. At the same time, design ecological berms and rainwater infiltration planting ponds to improve groundwater quality and protect biodiversity; (b) use plants to enclose diversified activity spaces and categorize the design according to the needs of different people, such as a more private O-shaped space, a semi-closed U-shaped space, a semi-open L-shaped space, and an open parallel space; and (c) utilize the natural characteristics of the coastal microclimate, such as wind, light, and sound, combined with the plant enclosure space, to change the landscape light and shadow effect, and enhance the node interactivity and interest.
Forests 14 02463 g010
Table 1. Principal component score coefficient matrix and index weight of all indicators.
IndicatorsPrincipal ComponentComponent MatrixWeight Value
1212
PM100.566−0.0380.944−0.0420.25
PM2.50.5324−0.1450.888−0.1610.21
Negative air ion concentration/NAIC0.5130.2060.8550.2290.27
Acoustic environments index/NF0.2240.7530.3730.8360.25
Human comfort index/S0.289−0.6070.483−0.6730.01
Eigenvalues2.7821.231
Variance contribution rate (%)55.63424.621
Cumulated contribution rate (%)55.63480.256
Table 2. Criteria for the coastal green space comprehensive healthcare index (GCHI) grades.
GradesIndex RangeDegree of Comprehensive Healthcare Benefits
ICGHI > 0.74Very strong
II0.74 > CGHI ≥ 0.63Strong
III0.63 > CGHI ≥ 0.45Medium
IV0.45 > CGHI ≥ 0.28Weak
VCGHI < 0.28Very weak
Disclaimer/Publisher’s Note: The statements, opinions and data contained in all publications are solely those of the individual author(s) and contributor(s) and not of MDPI and/or the editor(s). MDPI and/or the editor(s) disclaim responsibility for any injury to people or property resulting from any ideas, methods, instructions or products referred to in the content.

