Article

Landscape Characteristics in Mountain Parks across Different Urban Gradients and Their Relationship with Public Response

1
College of Architecture and Planning, Fujian University of Technology, Fuzhou 350108, China
2
College of Landscape Architecture and Art, Fujian Agriculture and Forestry University, Fuzhou 350002, China
3
Collaborative for Advanced Landscape Planning, Faculty of Forestry, The University of British Columbia, Vancouver, BC V6T 1Z4, Canada
4
School of Architecture, Clemson University, Clemson, SC 29634, USA
*
Authors to whom correspondence should be addressed.
Forests 2023, 14(12), 2406; https://doi.org/10.3390/f14122406
Submission received: 7 November 2023 / Revised: 29 November 2023 / Accepted: 7 December 2023 / Published: 10 December 2023
(This article belongs to the Special Issue Urban Forestry and Sustainable Cities)

Abstract

:
Numerous researchers have demonstrated the positive impacts of urban green spaces on human physiology and psychology. In mountainous urban regions, mountains have often been preserved as green spaces during urban sprawl, owing to the limited costs associated with development. While the landscape elements of these mountain parks exhibit differences depending on their locations, the nature and effects of such differences on the public’s physiological and psychological perceptions remain unclear. Therefore, we employed panoramic cameras and semantic segmentation (PSPNet-based training algorithm) to analyze the composition of landscape elements in mountain parks along an urban gradient (i.e., urban areas [UA], suburban areas [SA], and exurban areas [EA]). Concurrently, open-ended questionnaires and portable physiological monitors (ErgoLAB 3.0 Portable physiological monitoring equipment) were utilized to examine relationships between specific landscape elements and the public’s physiological and psychological responses. Our findings revealed that: (1) Urban park landscapes possessed high proportions of paved areas, humanistic vibe, vegetation hierarchy, and vegetation color richness, alongside lower scene clutter; suburban mountain park landscapes were characterized by heightened contemporary ambiance and wide viewshed area; and exurban mountain park landscapes exhibited high green view indices, expansive water surfaces, broad view area, and low scene clutter. (2) HRV and EMG differed significantly between mountain parks situated across the urban gradient. EMG also significantly varied across landscape types. All four psychological perception metrics showed significant distinctions across the three urban gradients and three green space categories. It further highlighted the importance of naturalness perception in urban mountain parks. (3) Viewshed area, average sight distance, architecture, enclosure, humanistic vibe, contemporary elements, vegetation color richness, trees and shrubs, distant hills, and scene clutter showed significant effects on both physiological and psychological outcomes. However, the application of these findings needs additional refinement tailored to the typology of the landscape. (4) To provide practical insights for constructing diverse green space typologies, we employed partial correlation modeling to eliminate covarying factors and developed a perception feedback model for public physiological and psychological indicators. Our findings elucidate relationships between landscape elements and the benefits of urban forests for public physiology and psychology. By shedding light on these connections, we further understand how landscape elements shape human perceptions of mountainous urban forests. These results offer valuable insights for shaping policies that promote favorable urban forest landscapes while also advancing landscape perception research through the use of semantic segmentation and portable physiological monitoring.

1. Introduction

The southeastern coastal region of China, characterized by its rugged topography, is epitomized by the adage “eight mountains, one water, and one field” [1,2]. Urban development in this area has evolved amidst these mountains, fostering the emergence of an urban forest landscape that reflects the unique geographical identity. With urbanization progressing, an increasing number of mountainous areas have been assimilated into urban perimeters [1,2,3]. This assimilation, primarily motivated by ecological considerations and the substantial costs associated with urban construction in mountainous terrain, has transformed these mountainous landscapes into accessible sanctuaries for the public to reconnect with nature. As urban development transitions from incremental growth to the enrichment of existing assets, the strategic reconstruction of urban mountains to serve as recreational spaces for urban residents has emerged as a paramount concern for city planners and landscape architects [4,5,6]. Essential to this endeavor is the provision of urban green spaces that not only enhance relaxation and recreation for residents but are also beneficial to their physical and psychological well-being [7,8,9]. The planning and design of green spaces necessitate a profound comprehension of their distinctive landscape features and subsequent influence on the public, particularly in terms of physiological and psychological health dimensions [8,10,11]. However, the existing research falls short of providing a comprehensive framework that can guide practical interventions in this domain.
In the realm of landscape element interpretation, a prevalent analytical approach in related research is taxonomy [12,13,14]. Zhou categorized forest green spaces into waterfront and non-waterfront categories, contingent on the presence of water elements [15]. Likewise, Lee classified urban park open spaces into open, semi-open, and closed spaces [16]. Nordh, in a similar vein, partitioned the landscape components of urban parks into five distinct groups: trees, shrubs, grasslands, flora, and recreational facilities [17]. Beyond these taxonomic methods, abstraction approaches are also widely employed [18,19,20,21]. However, regardless of the chosen method taxonomy or abstraction, the majority of investigations tend to focus on specific or singular green space types, which may limit the precision of landscape elements quantification. In recent years, the advent of Artificial Intelligence (AI) technology has ushered in a transformative era in landscape element interpretation, marked by the adoption of semantic segmentation for single-view and panoramic scenes [22,23]. This technological advancement has enabled quantitative interpretations of tangible landscape elements, such as studies on the distribution of elements in hutong streetscapes [24], the distribution of green view index (GVI) in various geographical regions [25], the analysis of urban green space elements and their impact on public visual attention [26], as well as the examination of landscape elements both individually and as categorized entities, such as GVI [27], sky [28], and naturalness [29]. Furthermore, to explore the relationship between urban development and streetscape GVI changes, research also includes temporal analysis of urban streetscapes [1]. Despite these research advancements, there remains a noticeable research gap in understanding the composition of landscape elements within urban mountain green spaces and how these elements evolve across varying urban gradients. Simultaneously, it is imperative to recognize that the visual perception of the environment triggers a cascade of physiological and psychological responses [30,31,32]. Landscape elements, beyond their role as visual stimuli, act as catalysts for judgment and the construction of multi-dimensional consciousness [33,34,35]. A holistic scene analysis should encompass spatial, physical, color, and synthesis landscape elements; a viewpoint echoed in numerous scholarly works [36,37]. Moreover, the landscape’s influence on public perception extends beyond its physical attributes, as landscape management also plays a pivotal role [38]. Extensive evidence indicates that various types of green spaces exert distinct influences on human perception, with urban green spaces providing more significant benefits to human well-being compared to urban street environments, and these restorative effects differ based on the landscape composition [39,40,41,42]. For example, waterfront green spaces provide superior restorative advantages than other types [43]. Open green environments are more conducive to psychological recovery than enclosed settings [44]. Similarly, elements like hard surface paving can impede stress relief benefits [45], while an abundance of trees and shrubs can enhance restorative effects [46]. Moreover, beyond the type of green space, research has illuminated that the proximity to urban centers influences their restorative potential on the human body [47,48]. Green spaces farther from urban centers are less disrupted by human interference, thereby displaying a more natural character and offering heightened restorative advantages [49]. However, despite a wealth of research substantiating the varying restorative effects of different green space types and proximities, the interpretation of the landscape elements within this research remains predominantly qualitative. A quantitative analysis of landscape elements and further exploration of how to maximize their public restorative benefits have not been reported.
Existing research has established a detailed understanding of the positive impacts of green spaces on public health, including both physiological and psychological benefits [50,51]. Physiologically, green spaces contribute to a range of health improvements: increased concentration, reduced blood pressure, improved memory and cognitive function, heightened immunity, and reduced disease risk [52,53,54]. Notably, the earliest recognition of the favorable influence of natural surroundings on human physiology was attributed to Japanese scholar Miyazaki, who found that forest bathing significantly boosted various physiological functions, particularly immune function [16]. Advances in portable physiological monitoring technologies have furthered this research, allowing the measurement of physiological responses to landscapes through biometric parameters such as Finger Blood Volume Pulse (BVP), Skin Conductance Level (SCL), Electromyography (EMG), Blood Pressure (BP), Heart Rate Variability (HRV), Electroencephalogram (EEG), and Skin Temperature (SKT). These measurements serve as indicators of a subject’s physical relaxation level [55,56,57,58]. Psychologically, green spaces can regulate emotional states by reducing anxiety, promoting positive moods, and alleviating stress. Alcock’s research corroborates that individuals exposed to environments featuring green elements tend to exhibit a lower level of mental stress and increased well-being [59]. Furthermore, individuals residing in areas with greater green space coverage generally manifest superior mental health compared to their counterparts in less green areas [60]. Even brief exposures to green spaces following fatigue have demonstrated the capacity to restore concentration. Notably, green spaces that are designed in accordance with public aesthetic preferences stimulate emotional responses and invigorate mental vitality [60]. These psychological facets are typically assessed utilizing established scale-based questionnaires, including tools like the Profile of Mood States (POMS), the Positive and Negative Affect Scale (PANAS), and the Subjective Restorative Evaluation [21].
The southeastern coastal region of China serves as the maritime gateway of China, with its urban development being a regional representative of China’s foreign affairs. At the same time, its topography is predominantly mountainous and hilly, which is quite unique. In this research, we chose Fuzhou, a city on the southeast coast of China, as the study area. This research focuses on the relationship between landscape scene types, landscape elements, and human physiological and psychological perceptions, a topic that has yet to be examined in existing literature. The research aimed to address the following questions:
  • Compositional characteristics of landscape elements within urban mountain park settings across various urban areas and typologies;
  • The variances in human physiological and psychological perception across diverse scene locations and types;
  • The impact of landscape elements on human physiological and psychological perception;
By quantitatively analyzing scene elements and human physiological and psychological perception, this research aims to provide precise design guidance for urban green space designers and managers.

2. Materials and Methods
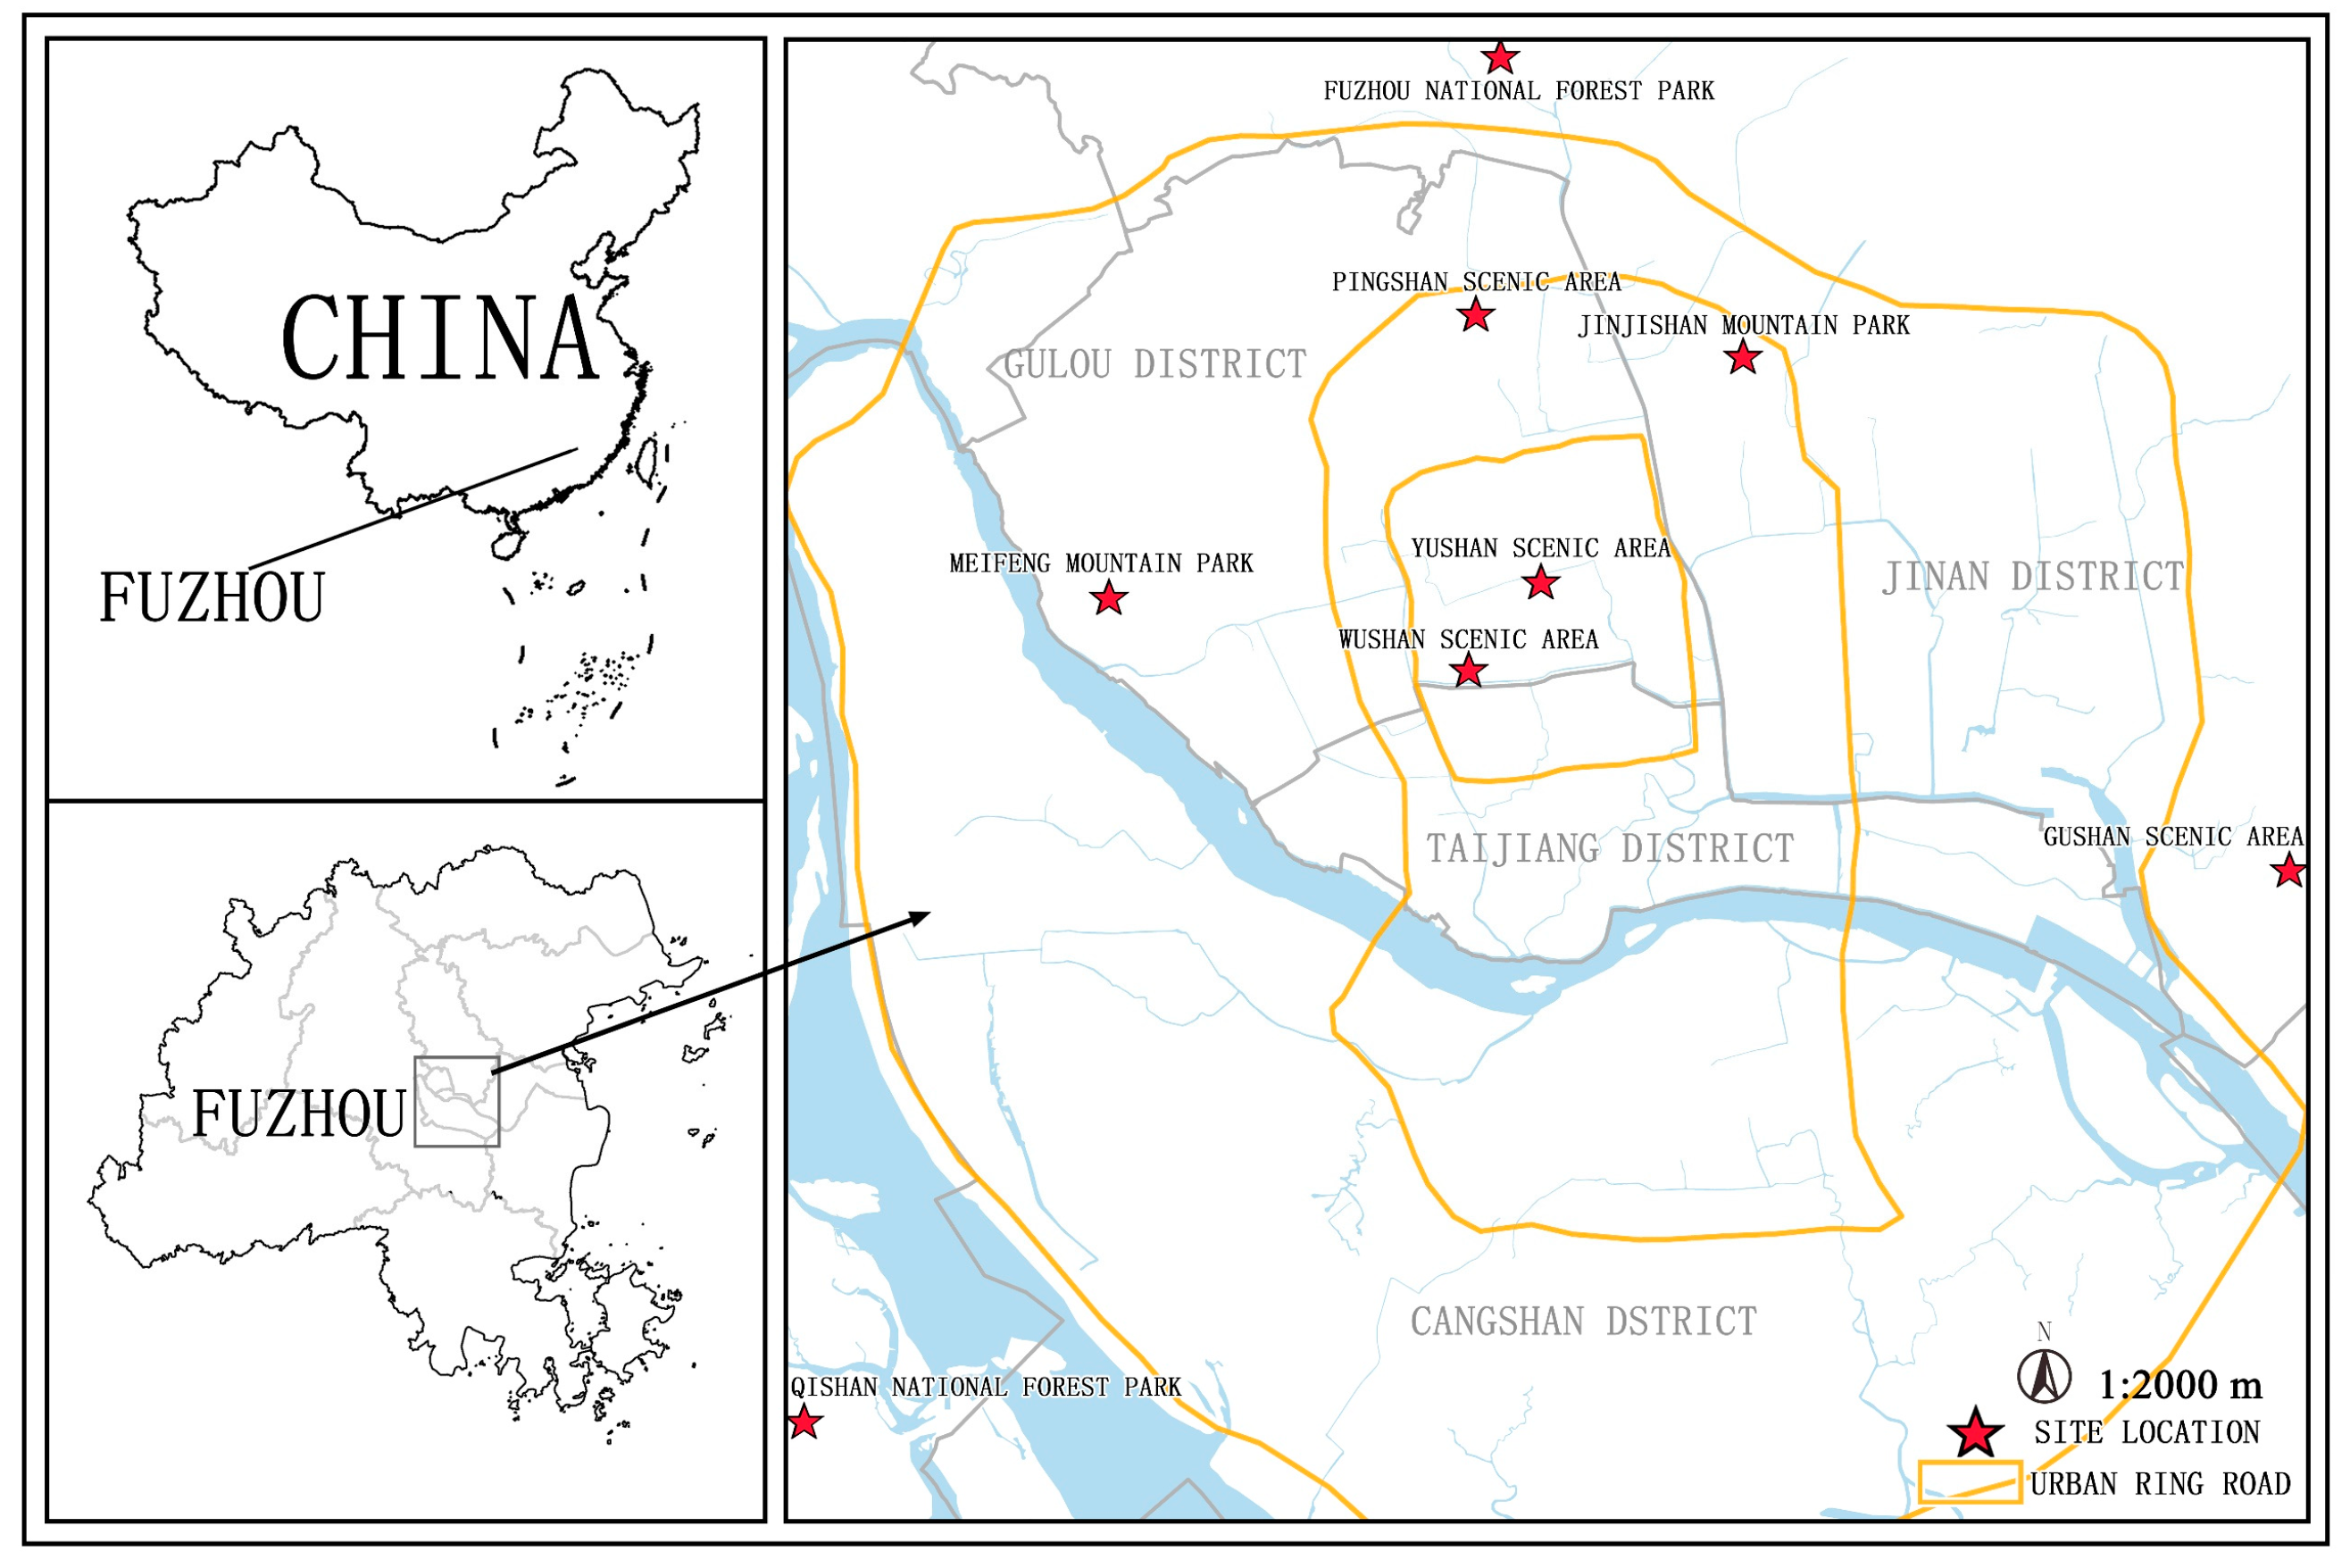
2.1. Research Area

Fuzhou, situated in the southeastern coastal region of China, boasts a total of 22 mountain parks within its urban confines, with 8 located in urban settings, 7 in suburban locales, and an additional 7 nestled within exurban expanses. In this study, a random screening method was employed to select eight representative mountain parks in Fuzhou. These parks span various geographical domains: in urban areas (UA), Yushan Scenic Area, Wushan Scenic Area, and Pingshan Scenic Area. In suburban areas (SA), Meifeng Mountain Park and Jinjishan Park. In exurban areas (EA): Fuzhou National Forest Park, Qishan National Forest Park, and Gushan Scenic Area (Figure 1).
In parallel, relevant professional experts were invited to categorize the types of scenes. This categorization process comprised two primary areas: (a) Geographical Classification, where scenes were classified based on their specific location relative to the city ring road. The resultant subcategories included urban, suburban, and exurban areas. (b) Classification by Spatial Characteristics, which further divided urban green spaces into three distinct subcategories.
Forty scenes in eight parks were pre-collected randomly during the pre-research period. A quantitative cluster analysis of elements was carried out and 3 clusters were obtained: (1) Canopy Landscape (CL), the cluster with larger values of spatial elements. (2) Forest Landscape (FL), scenes with high green visual index and large ground area. (3) Forest Road Landscape (FRL), scenes with high green visual index, a constricted horizon, and linear or striped pattern. Subsequently, a total of 87 scenarios with typological characteristics and highest popularity were selected as the sample points for research scene collection (Figure 2).

2.2. Data Collection

2.2.1. Panoramic Acquisition and Stimuli

The panoramic photos were systematically captured in 8 selected mountain parks under similar weather conditions. The Insta360° Pro2 camera (Insta360, Shenzhen, China), set to full-automatic mode with the flash function disabled, was employed. The camera was placed at the center of each scene, supported by a fixed bracket at a height of 1.5 m to mimic the human eye level. The photography sessions were conducted between 10:00 and 15:00 to maintain consistency. Out of all captured photos, 20 were deemed invalid due to issues such as overexposure and inadvertent inclusion of people or animals, resulting in a total of 1596 valid scene photographs. Subsequently, these images were meticulously curated to obtain a final assortment of 27 canopy landscapes (7 from UA, 10 from SA, and 10 from EA), 30 forest landscapes (10 from UA, 10 from SA, and 10 from EA), and 30 forest road landscapes (10 from UA, 10 from SA, and 10 from EA). These panoramic photographs were then presented using the HTC Vive HMD (HTC Corporation, Taiwan, China).

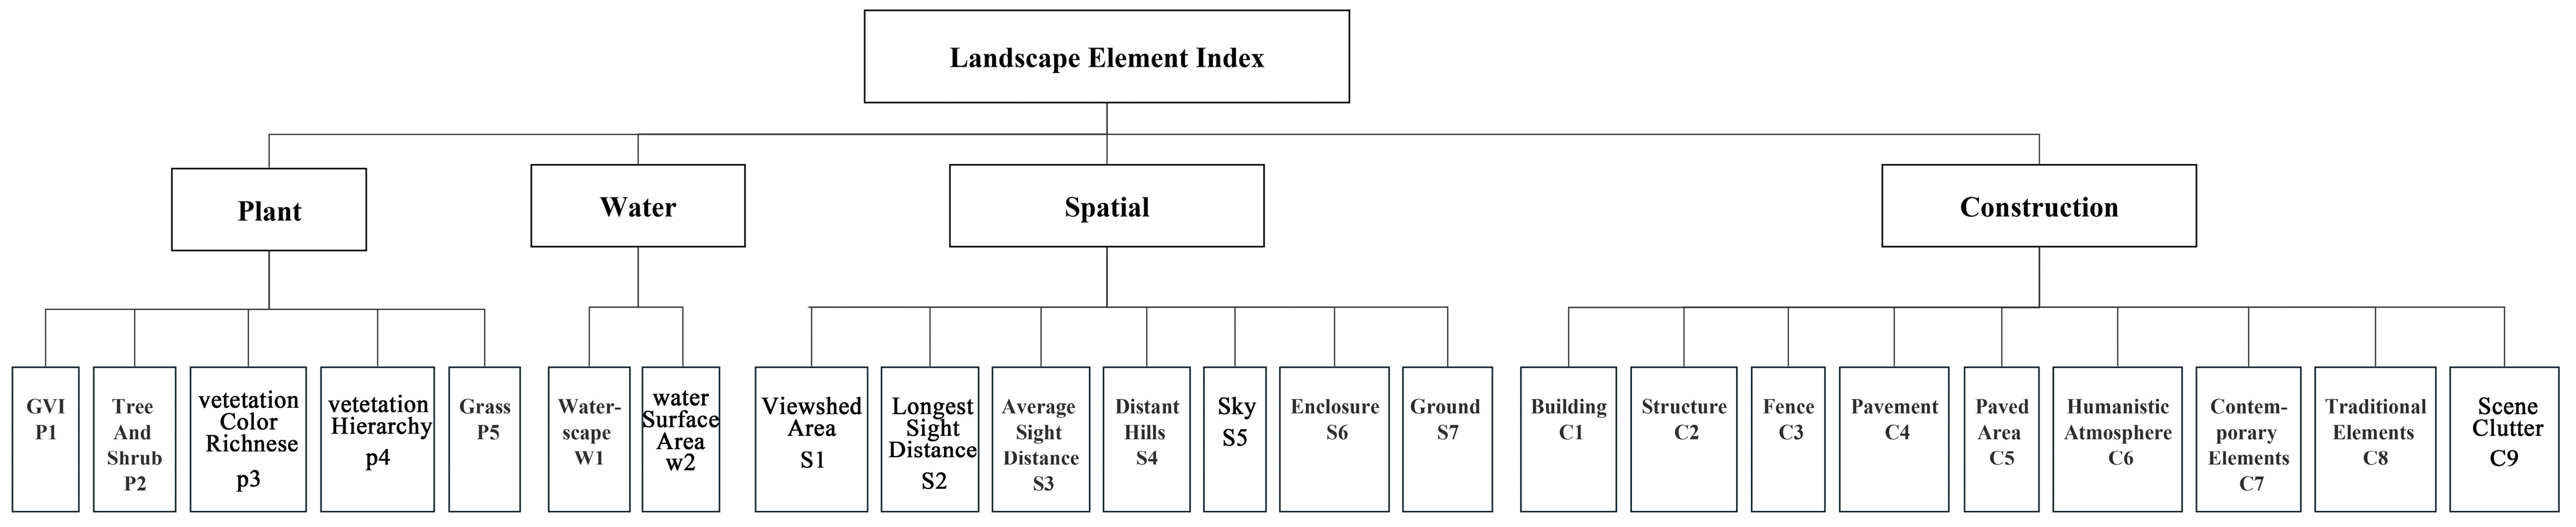
2.2.2. Classification and Calculation of Physical Features

The pixel ratio of visual elements within a given scene, defined as an objective visual index, is a pivotal metric for representing the salience of visual elements from an eye-level perspective, particularly in research concerning physical activity [61]. Several studies indicated that, beyond the physical landscape attributes like vegetation and water, a holistic amalgamation of spatial factors, colors, and various elements equally exerts a profound impact on public perception [62,63]. Therefore, this research identified and grouped 23 landscape elements into 4 categories (vegetation, water, spatial, and construction elements). These categories were established to facilitate the extraction of physical elements in this research (Figure 3). Specifically, three types of planar elements, namely vegetation, water and construction, were extracted by using a semantic segmentation model. Additionally, spatial analysis was carried out using the ArcGIS 10.8.1 platform (Figure 4).
PSPNet, a robust computer vision (CV) model known for its adeptness in element decomposition, is recognized for its abilities in extraction and measurement. This study aims to enhance the segmentation precision of mountainous green spaces by assessing the performance of current model algorithms and developing a training dataset primarily composed of urban green space elements. Moreover, to improve the model’s ability to accurately recognize urban mountainous green spaces, the training dataset is strategically expanded with unlabeled urban green space samples. The specific steps are as follows. (1) Image Acquisition: a diverse array of images was procured utilizing various devices, including panoramic cameras and DSLR cameras. These images represent a wide range of environmental conditions, capturing distinct weather and lighting scenarios. (2) Sample Annotation: Utilizing the image annotation software, LabelMe, from the Massachusetts Institute of Technology (MIT) Computer Science and Artificial Intelligence Laboratory (CSAIL), the annotation process involved meticulously labeling the elements in the collected images. The labeling categories were derived from the ADE20K dataset. (3) Dataset Establishment: The labeled sample data, along with the associated annotation information, were systematically organized and stored in a JSON file format before being exported as the final output. This process yielded a remarkable semantic interpretation accuracy rate of 93.52%. It is noteworthy that all computational processes were executed using the Python 3.7.2 programming language.
In addition, a variety of resources, including publicity materials, landscape layout maps, traffic route planning, functional zoning maps, and 0.6 m Digital Elevation Models (DEM) of eight parks, were collected. The satellite imagery of each park was acquired through Google Satellite Data Open Source. These images were processed and corrected to construct the DEM models. The 3D analysis function in ArcGIS 10.2 software was used to calculate the viewshed area and the longest view distance from the study sample points. Furthermore, a color impact analysis was used to interpret colors in the images (Table 1).

2.2.3. Measures

(1)
Physiological measurement
Skin Electrical Activity (EDA), Heart Rate (HRV), Electromyography (EMG), and Skin Temperature (SKT), as the four most widely used metrics for physiological investigation in urban greenery, were selected as the primary measurements for physiological assessment in this research. Phase-wise physiological data were obtained by calculating the mean values using the following formula:
Phasic-i = (stimuli mean Phasic-i − mean Phasic-i baseline)
The value provides the difference in a subject’s physiological response post-stimulus application in comparison to the pre-stimulus baseline.
(2)
psychological measurement
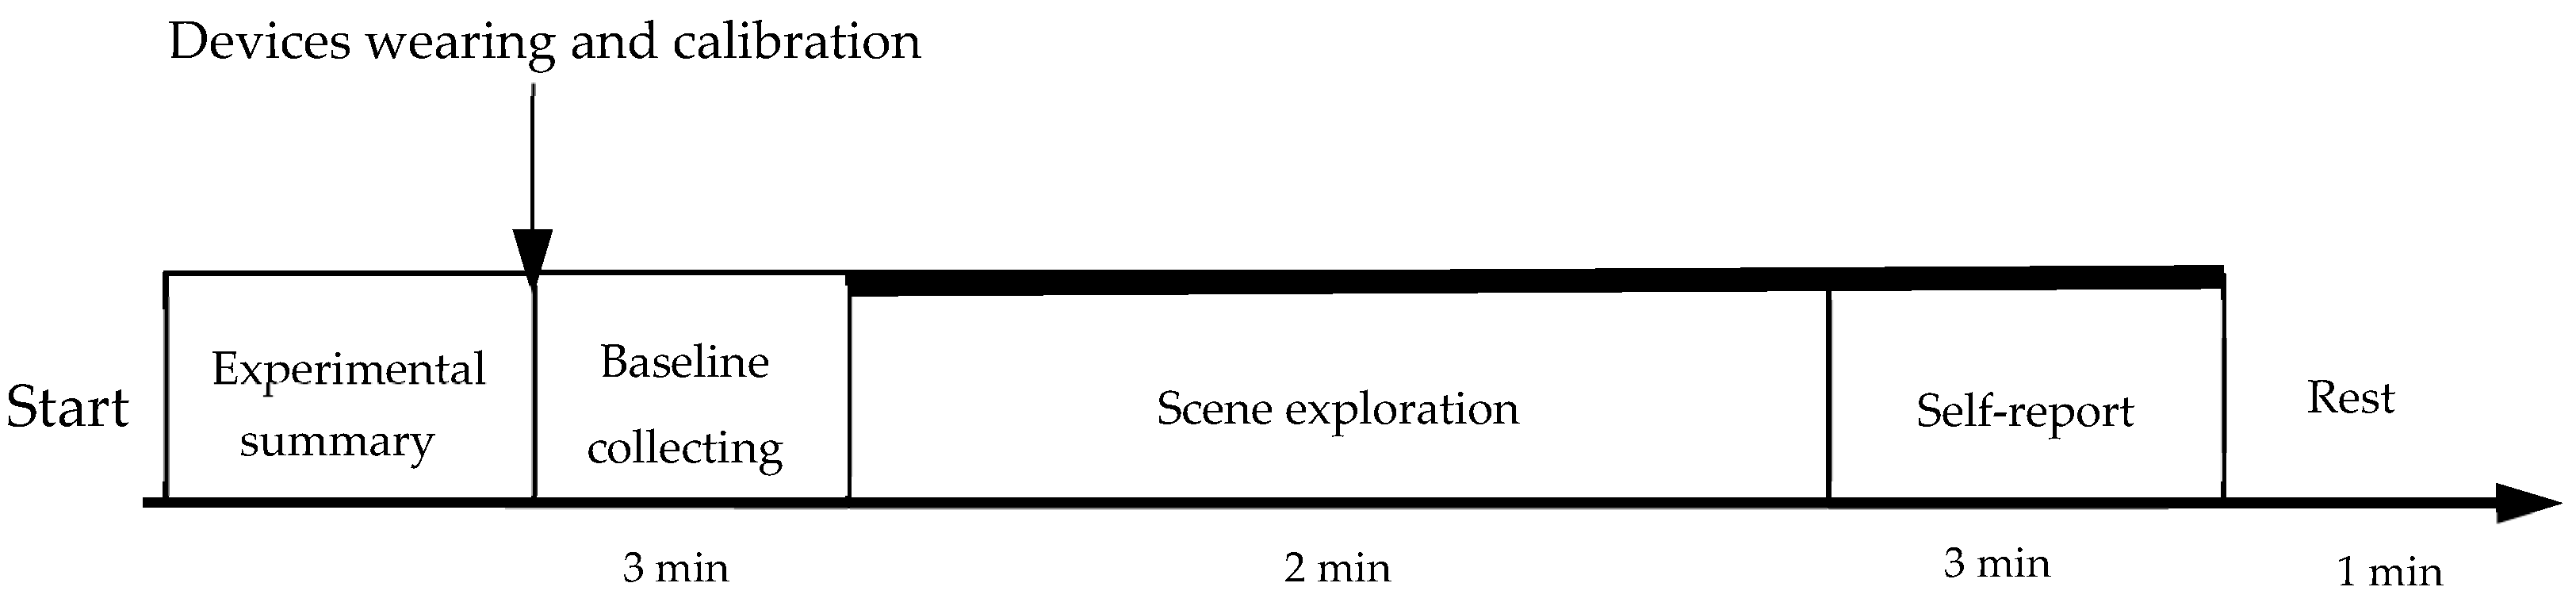
Self-report scales, aligned with the World Health Organization (WHO)‘s definition of human health [64], were used to measure psychological recovery. In this research, four indicators, emotional arousal, spiritual vitality, stress relief, and attention restoration, were incorporated to facilitate the psychological self-assessment of landscape perception. All the questions were focused on the landscape feeling. Additionally, all items were rated on a 7-point Likert scale, ranging from 1 (completely disagree) to 7 (completely agree).

2.2.4. Procedure

The experiment randomized 87 scenes into 6 groups, with 15 images in each of 5 groups and 12 images in 1 group. The experiments were conducted in the physiological laboratory at the College of Landscape Architecture and Art, Fujian Agriculture and Forestry University. Prior to the start of the experiment, participants were informed about the experiment’s purpose, procedure, outline, and the use of experimental equipment. To avoid external interference, soundproof headphones and a 360° rotating seat were used in the experiment. The trial consisted of 3 phases. (a) Preparation: subjects familiarized themselves with the study‘s outline and the use of the equipment. (b) Baseline acquisition: participants, while seated in a rotating chair with soundproof headphones, faced a white wall to maintain a calm state. This phase included a 3 min session to acquire baseline physiological measurements of subjects. (c) Experimental Data Acquisition. After acclimatization, subjects engaged in a 2 min perceptual exploration of the scenes while their physiological responses were continuously monitored. After exploring each scene, participants completed a questionnaire. A 1 min break preceded the transition to the next scene. To avoid excessive duration and fatigue, the experiment was structured to allow intermittent measurements, enabling participants to self-regulate the pace of the experiment (Figure 5).

2.2.5. Participants

Participants were recruited using social networking platforms (Tencent QQ and Wechat). The inclusion criteria included normal vision and being free from any cognitive or mental disorders. The volunteers included 184 students from the Fujian University of Forestry and Agriculture: 94 women (51.1%), and 90 men (48.9%) with an average age of 23.4 (±1.20). All participants voluntarily joined the study and provided verbal consent (Table 2).

2.2.6. Analysis

Physiological data were exported using ErgoLAB 3.0, and statistical analysis was conducted using SPSS 23.0 (IBM, Armonk, NY, USA). To ensure the reliability of psychological recovery ratings, interclass reliability was initially tested. One-way ANOVA was then employed to examine differences in participants’ physiological and psychological perceptions across different scenes. This was followed by Pearson’s correlation analysis to identify the significant effects of each landscape element on physiological and psychological perceptions. Subsequently, partial correlation analysis was conducted to investigate the relationships between landscape elements and public physiological and psychological perceptions. After conducting nine superposition operations to eliminate landscape elements with low bias correlation coefficients (p > 0.05), a bias correlation model was used to identify key elements likely to influence human physiological and psychological perceptions.

3. Results

3.1. Reliability

To assess the interclass reliability of the psychological recovery ratings, Cronbach’s alpha, a statistical measure of a scale or questionnaire’s reliability, was computed for the 87 scenes. The Cronbach’s alpha value was 0.893, indicating a high level of reliability in the questionnaire results.

3.2. Physical Features Description

As shown in Table 3, compared to parks in suburban and exurban areas, the recreational space in urban mountain parks is mostly located in the forest. These parks feature a limited overhead exposure to the sky (13.10%), and a high GVI (41.62%), substantial paved areas (34.22%), a rich diversity in vegetation hierarchy (3.52) and vegetation colors (2.52), a pronounced humanistic vibe (9.13), and the highest degree of management and maintenance (scene clutter 0.02). Additionally, the waterscape is mostly found in urban mountain parks. Suburban parks possess the strongest contemporary sense (6.36%). The scene features a high percentage of steel-framed fences, a lower GVI (33.76), expansive vistas (average sight distance of 8.39 km, sky exposure of 20.02%), substantial investment in maintenance (scene clutter 0.05), and a robust humanistic vibe (11.18%). In contrast, parks in exurban areas predominantly showcase a naturalistic character, underscored by a notable GVI (38.17%), a high proportion of distant hills (0.24%), extensive water surface area (1.04%), expansive sight area (1204.09), and a more pronounced degree of scene clutter (0.13%).
Concerning typology, FRLs are typically characterized by a narrow and elongated configuration, featuring the highest GVI (49.11%) and an exceptional sense of enclosure (47.20%). This landscape cluster is densely populated with trees and shrubs (40.40%), grasses (8.71%), buildings (1.86%), and water bodies (1.82%) within the scene. FLs, in contrast, exhibit a richer variety of vegetation hierarchies (4.06) and vegetation colors (2.52). This typology is distinguished by extensive paved surfaces (37.34%), a minimal proportion of water bodies (0.05%), a low ratio of buildings (1.11%) and structures (0.90%), and the most pronounced sense of clutter (0.11). CLs spatially offer a wide viewshed area (2411.44 Ha) and long sight distance (38.05 km), the largest concentration of buildings (1.39%) and structures (1.31%), the most humanistic vibe (10.23), and a sense of modernity (6.36%) (Table 4).

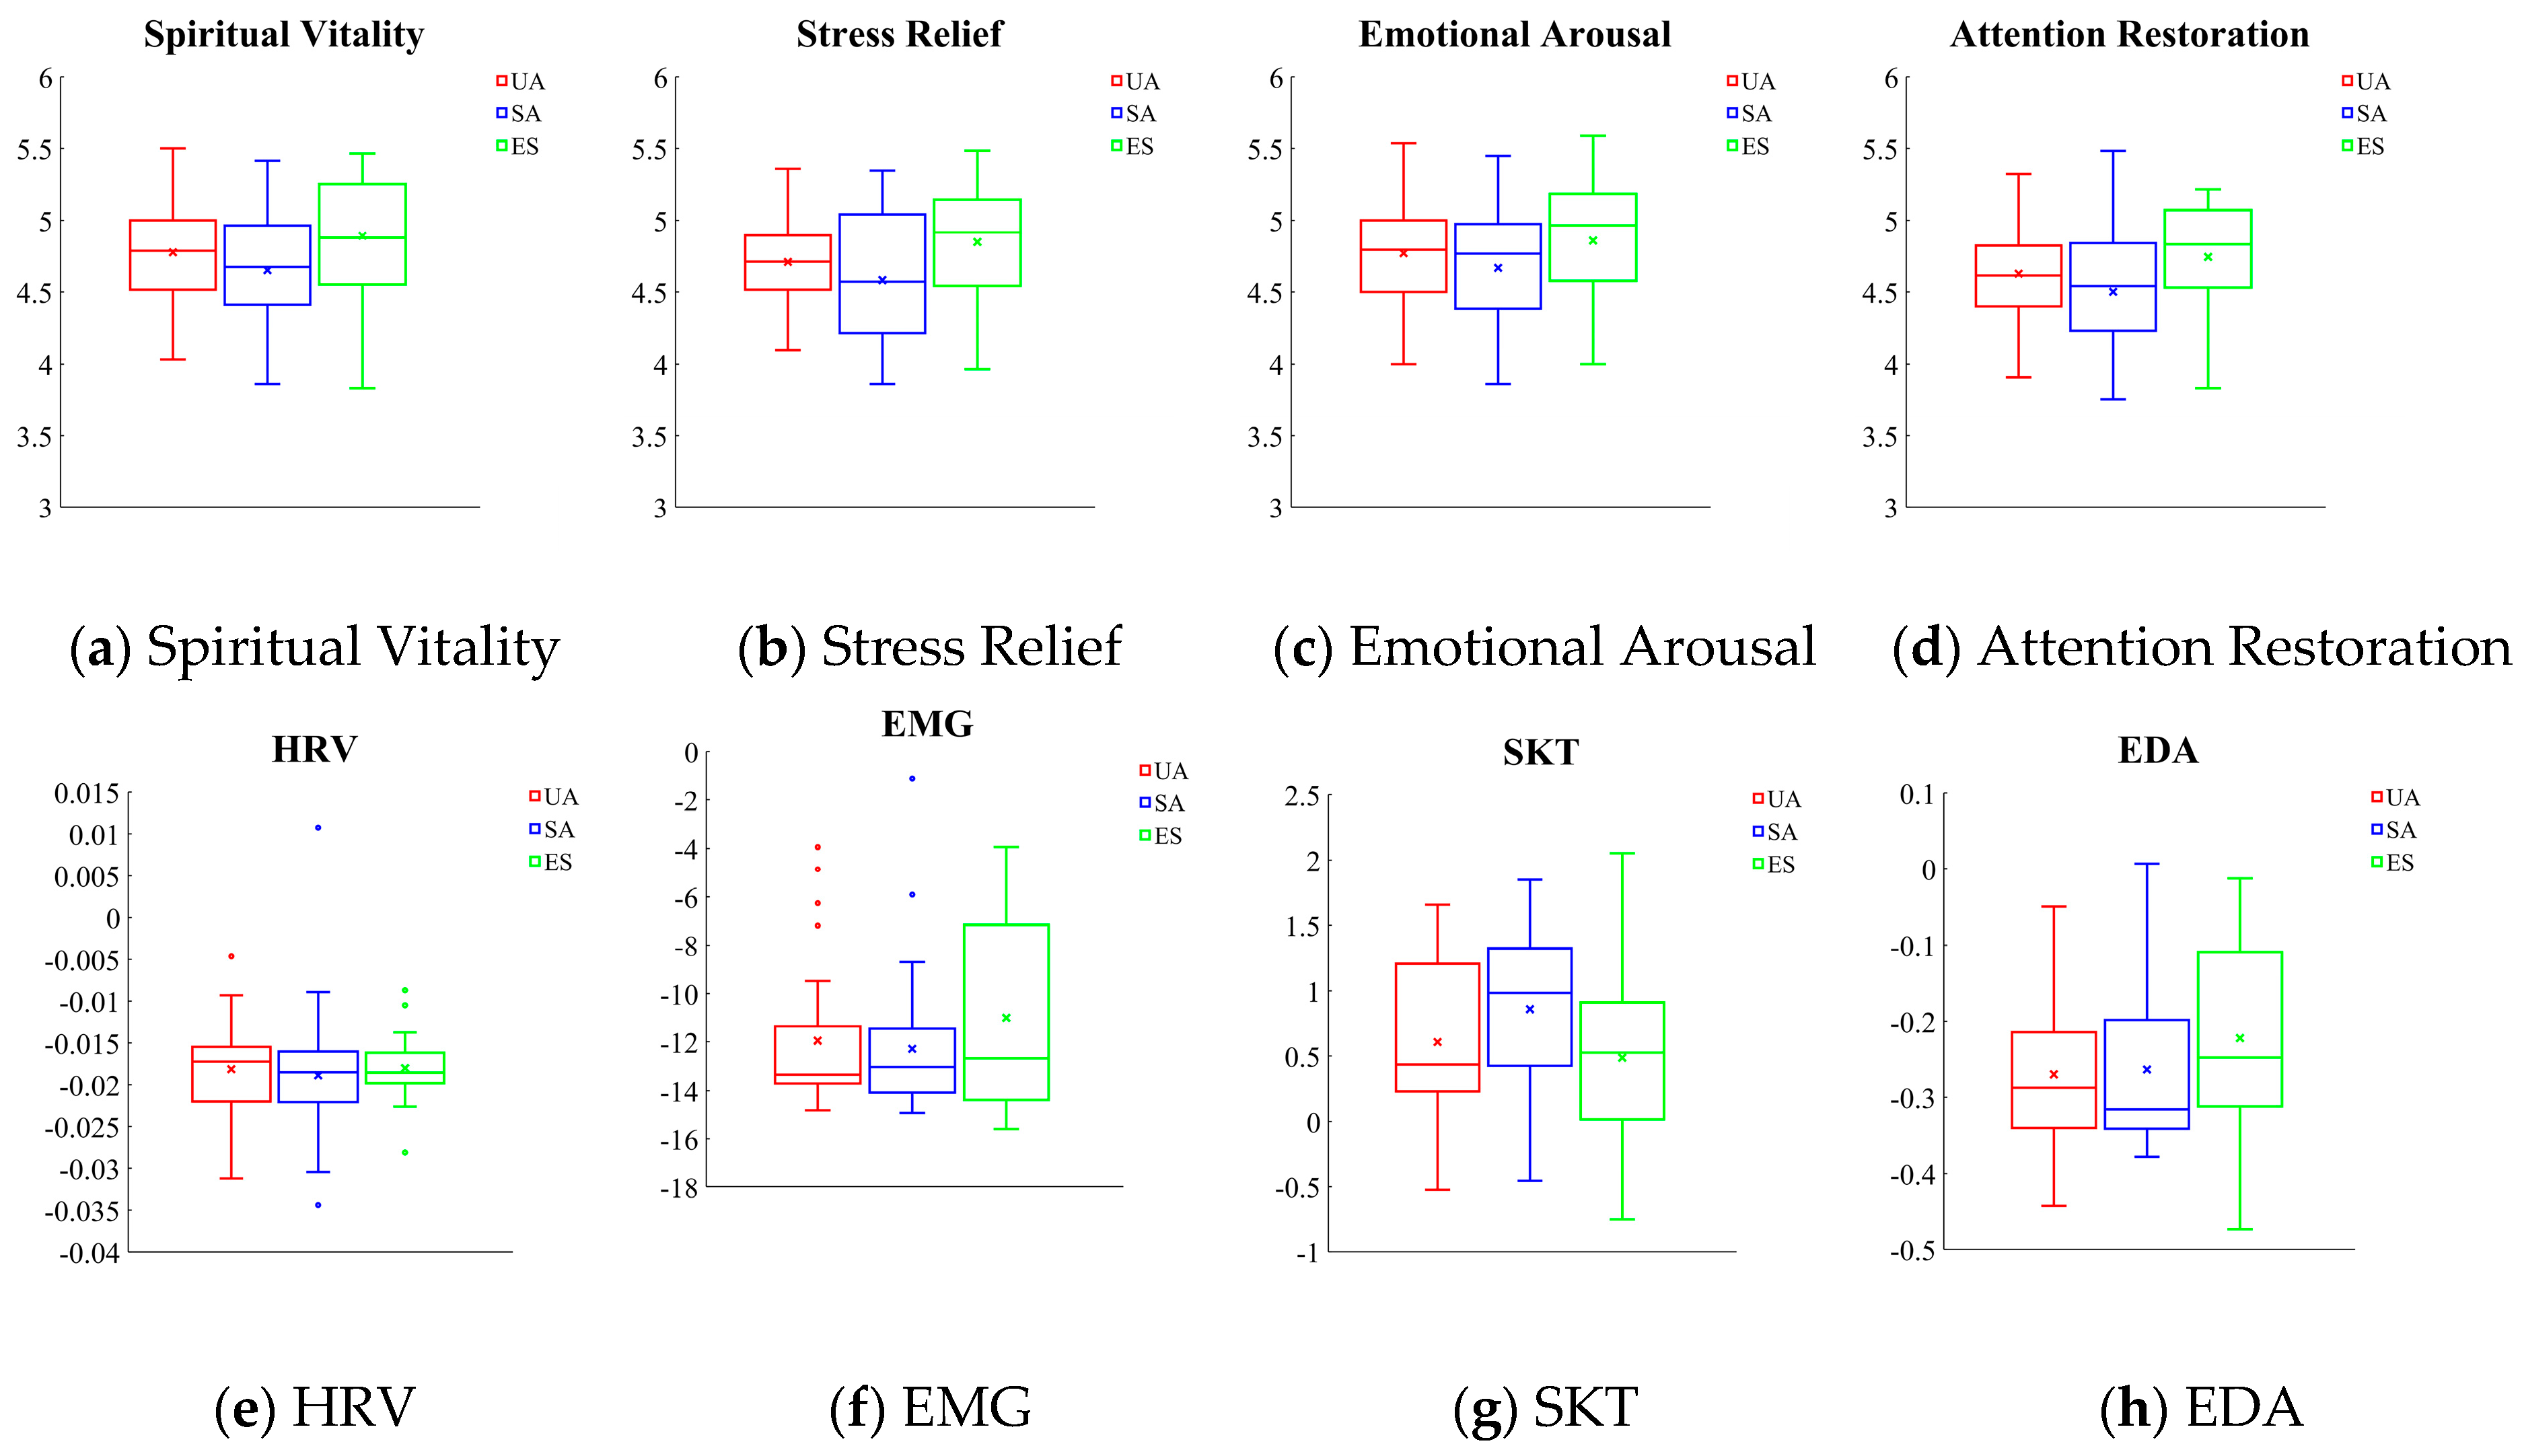
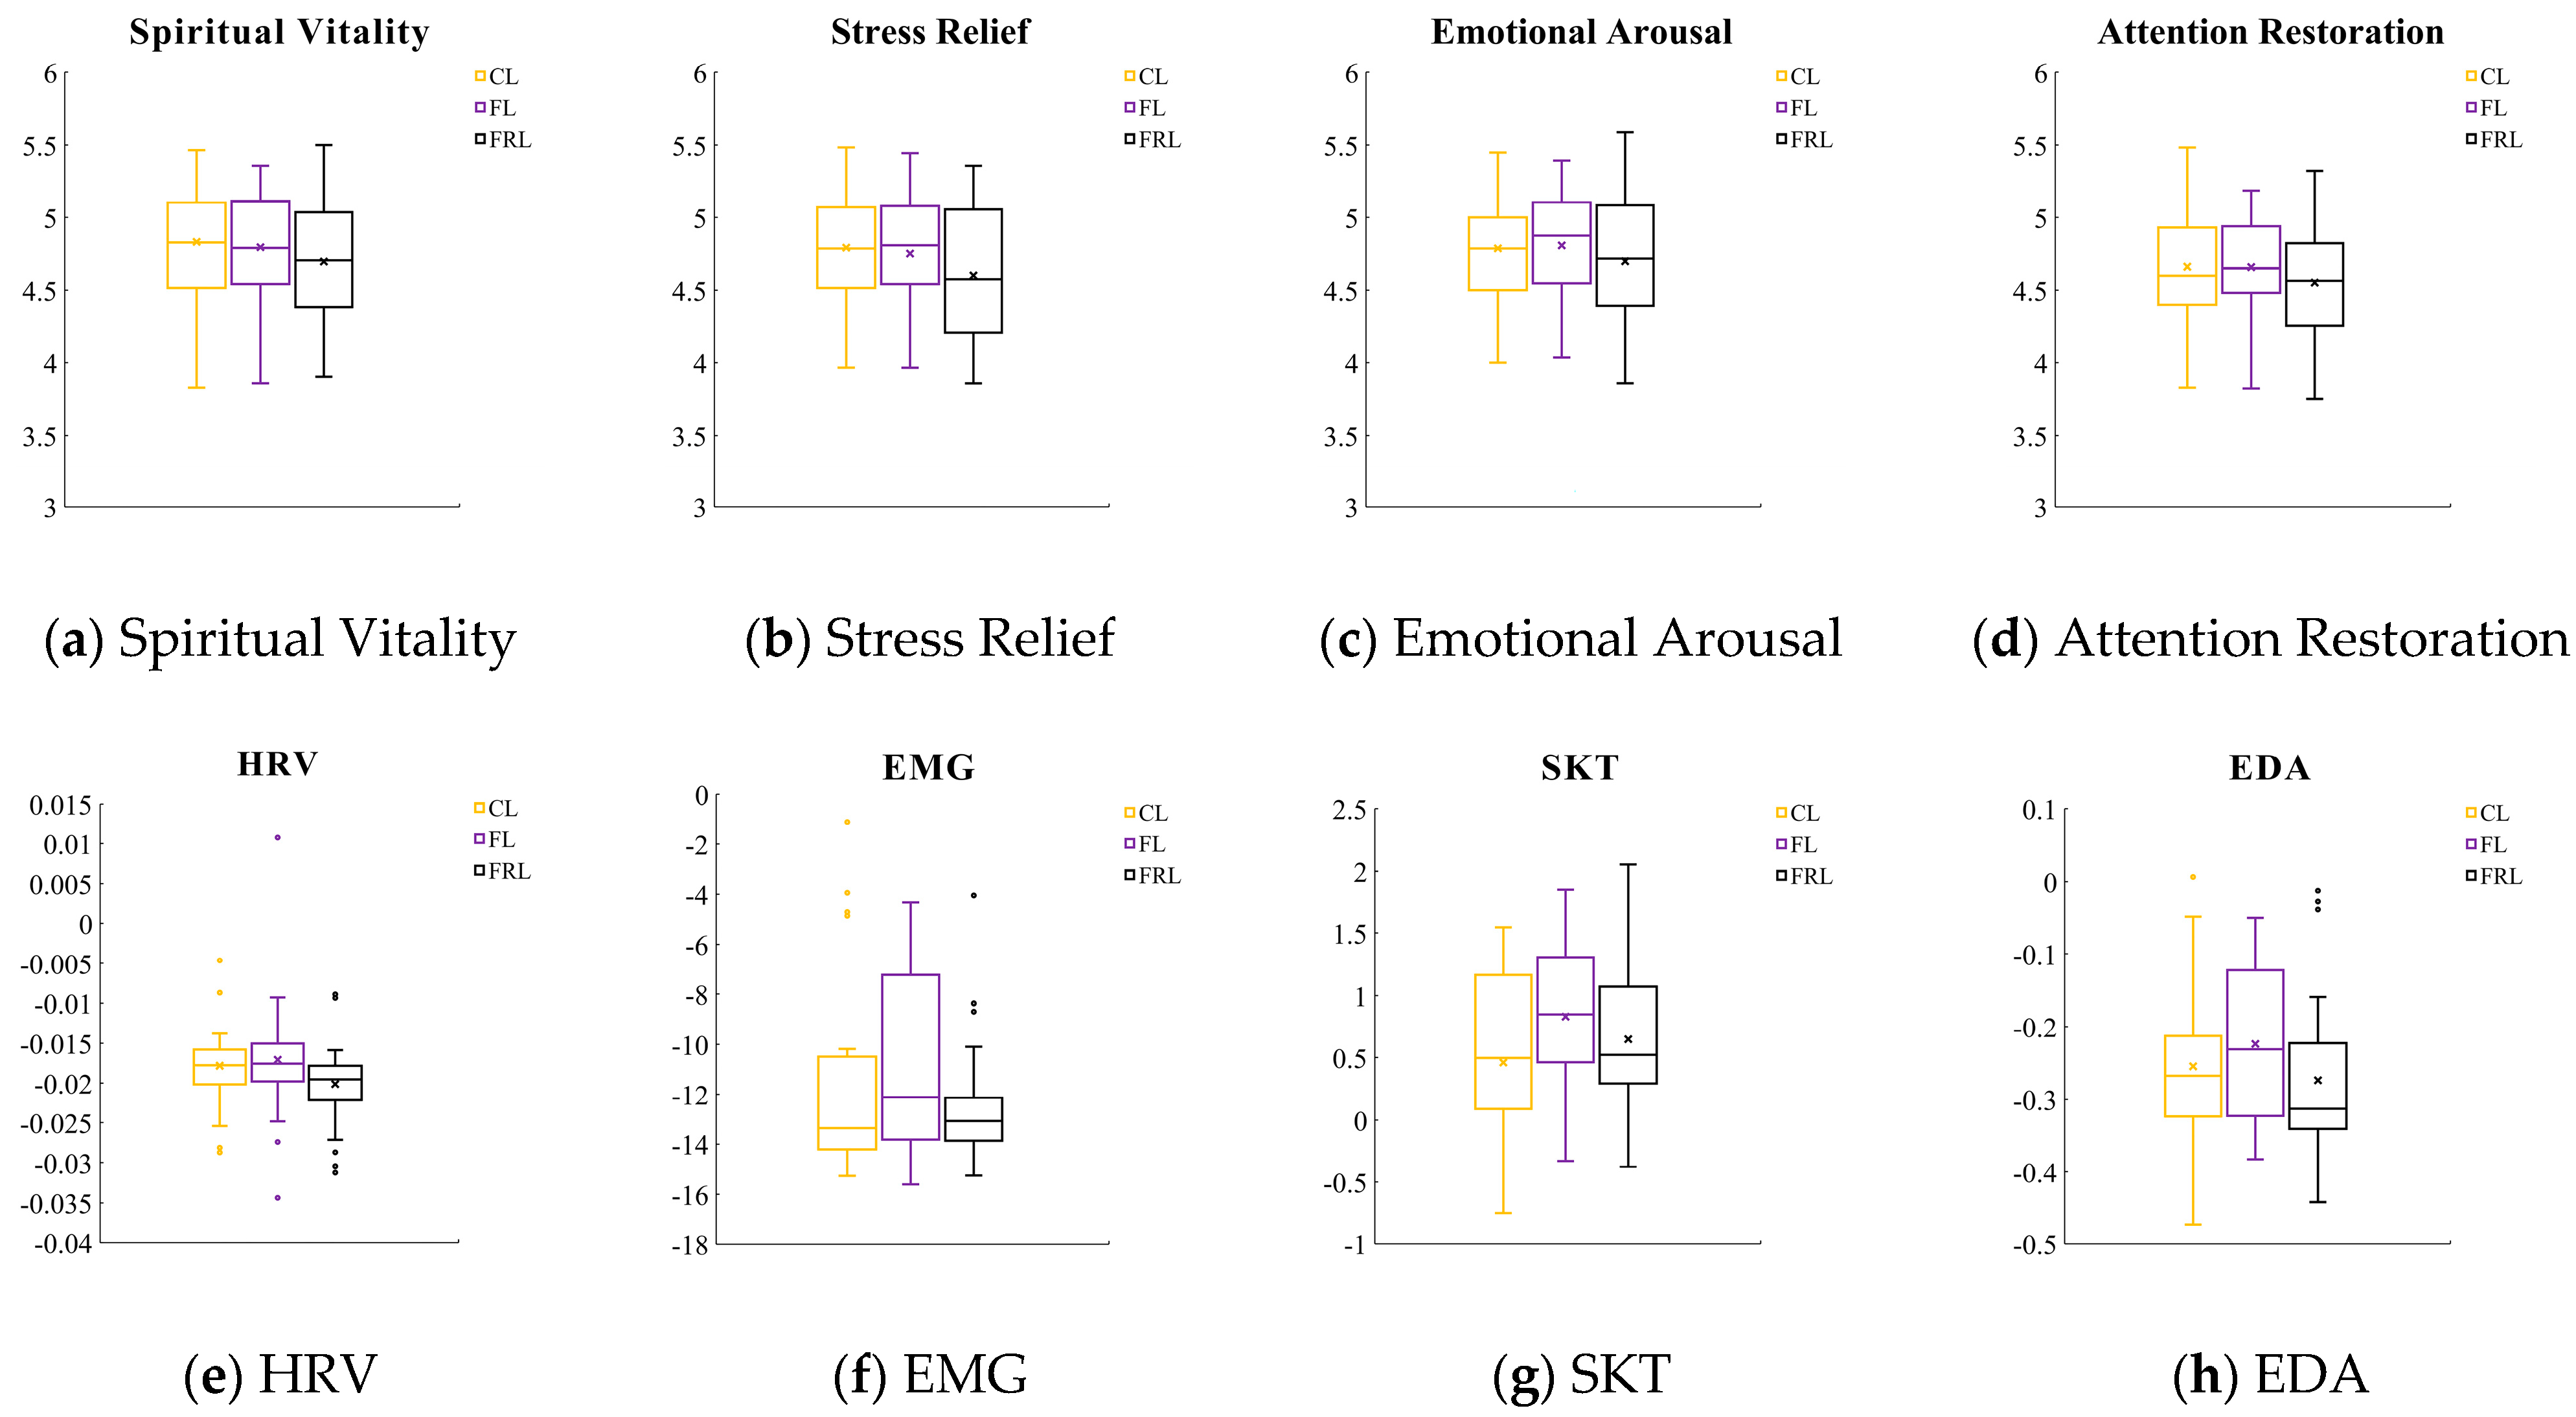
3.3. Changes in Physiological Parameters

The variations in HRV, EMG, SKT and EDA exhibited a consistent downward trend across the three gradient scenarios, namely exurban, urban, and suburban areas. The one-way ANOVA results revealed a statistically significant difference in HRV and EMG among the three gradients (p < 0.05). In contrast, no significant distinction was observed in EDA and SKT within any of the three gradients. Regarding EMG, all pairwise comparisons indicated significant differences except for the SA vs. EA (p > 0.05). In the case of HRV, all pairwise comparisons showed no significant difference, except for the UA vs. EA (p < 0.05) (Figure 6).
Regarding landscape typology, HRV and EDA exhibited the greatest variability in FRL, followed by CL and FL. EMG displayed the highest variability in CL, followed by FRL and FL. SKT demonstrated the most significant variability in FL and the least in CL. The one-way ANOVA results identified a significant difference across the three landscape types in EMG (p < 0.05). However, HRV, EDA and SKT did not exhibit any statistically significant disparities across these landscape categories. It is important to note that, for EMG, all pairwise comparisons indicated no significant difference except for the FL vs. FRL (p < 0.05) (Figure 7).

3.4. Changes in Psychological Parameters

The four psychological perception indices of the subjects showed a trend where the scores were highest in the exurban area, followed by urban area and then suburban area. Furthermore, the standard deviation of psychological perception in urban mountain parks was notably smaller in comparison to their suburban and exurban counterparts, suggesting a more consistent psychological response to the urban mountain park scenes. The one-way ANOVA results confirmed a significant difference among the four psychological indicators across parks in three urban gradients. (p < 0.05). All pairwise comparisons indicated no significant difference across urban gradients except for the UA vs. EA (p < 0.05).
Concerning landscape typology, CLs exhibited a pronounced capacity for enhancing spiritual vitality and stress relief. FLs were more effective in elevating emotional arousal and attention restoration. Conversely, FRLs provided fewer improvements in mental perceptions. The one-way ANOVA analysis revealed significant differences in the four psychological metrics across the three typologies (p < 0.05). All pairwise comparisons indicated significant differences except for FL vs. FRL (p > 0.05).

3.5. The Correlation

As shown in Table 5, landscape elements such as viewshed area, average sight distance, building, enclosure, humanistic vibe, and contemporary elements significantly influenced public physiological and psychological perceptions. Specifically, psychological perception was particularly affected by vegetation color richness, the presence of distant hills, and scene clutter. The proportion of trees and shrubs affected the physiological perception. In terms of typology, for CL, elements like GVI, longest sight distance, sky, and distant hills were influential in terms of physiological and psychological perceptions. Water had an effect on human perception only in the forest scenarios (FL and FRL). In FL, vegetation color, sky, traditional elements, distant hills, and scene clutter all contributed to physiological and psychological perceptions. In FRL, the influential factors include vegetation color, sky, traditional elements, paved area, and degree of management and maintenance. These results underscore that different types of landscapes need to be integrated with both type and urban gradient when designing mountain parks in different urbanized regions.

3.6. Landscape Elements Predictors of Physiological and Psychological Paramaters

The partial correlation analysis and prediction model construction were carried out with four indicators of psychological perception. Two related indicators of physiological perception were dependent variables, and landscape elements were independent variables. For each model group, nine iterations were performed, excluding landscape elements that had low partial correlation coefficients and p-values greater than 0.05.
The predictive models for public physiological and psychological perceptions of urban mountain parks in Fuzhou, as well as the three types of landscapes, CL, FL and FRL, are detailed in Appendix B, Appendix C, Appendix D, Appendix E, Appendix F and Appendix G. The compound correlation coefficients R2 of all 24 models indicate a robust linear relationship between the landscape elements and the physiological and psychological indicators. This suggests that the regression prediction models yield satisfactory results. Furthermore, a t-test conducted on the compound correlation coefficient R resulted in a regression model probability less than the significance level of 0.05 or 0.01. This attests to the validity of the linear model, confirming a highly significant correlation between landscape elements and the physiological and psychological perception indices in the model. Therefore, the established models stand as reliable tools for predicting the physiological and psychological perceptual benefits of the scene.
Across the whole mountainous landscape, vegetation color richness, GVI, and humanistic vibe comprehensively influenced the public’s physiological and psychological perceptions. In CL, viewshed area and GVI were significant contributors to the spiritual vitality. The longest sight distance played a crucial role in stress relief, while spatial enclosure and viewshed area were closely related to emotional arousal and attention restoration. Sky and humanistic vibe were significantly effective in impacting EMG and HRV. In FL, vegetation color richness, sky, and viewshed area were closely related to physiological and psychological perceptions. In FRL, the main factors influencing these perceptions include vegetation color richness, water surface area, sky, and traditional elements.
SVUMP = −5.609 + 1.750P3 + 2.328S3 + 1.793C9 + 2.359C6 − 4.409C1
SVCL = −5.20 + 1.850P1 + 2.421S1 + 1.662S6 + 2.321C6 − 4.029C7
SVFL = −6.611 + 1.485P3 + 2.210S3 − 2.112S6 + 2.021S5 + 2.010C6
SVFRL = −6.002 + 1.623P3 + 2.221S5 + 1.995C8
SRUMP = 5.493 + 2.462P3 + 2.338S1 + 1.985S3 + 2.577C6
SRCL = 4.385 + 3.102S1 + 3.568S2 + 2.784S6 + 2.922C1 + 2.857C7
SRFL = 5.152 + 2.444P3 + 2.998S1 + 2.001S6 + 3.142C6
SRFRL = 4.785 + 3.102P3 + 1.998W2 + 2.104C8
EAUMP = −6.250 + 3.844P3 + 3.985S3 + 4.019C6 − 4.075C1
EACL = −5.270 + 2.741S1 + 3.502S6 + 3.812C7 + 3.958C1
EAFL = −5.860 + 4.252P3 + 4.002S1 + 3.632S6 + 3.770S5 + 4.114C6
EAFRL = −6.002 + 3.785P3 + 3.568S5 + 4.002C6 + 4.003C4 + 3.985C1
ARUMP = −5.283 + 2.232S3 + 3.011P1 + 4.540C6 − 4.990C1
ARcL = −4.253 + 1.892S1 − 2.751S6 + 5.002C6 + 2.951C7 + 5.001C1
ARFL = −4.332 + 4.252P3 + 4.011S5 − 3.590S6 + 2.590C1
ARFRL = −4.200 − 1.532S6 + 4.051C6 + 3.550C8 + 2.205C4
EMGUMP = −5.828 − 3.276S3 − 1.677S6 + 1.773C6
EMGcL = −5.828 − 4.286S2 − 2.157S5−0.905C6 + 1.293C7
EMGFL = −4.328 − 2.760W2 − 2.227S6 − 0.775S5
EMGFRL = −3.581 − 2.236P3 − 3.627W2 − 4.228C8
HRVUMP = −12.034 + 1.283S1 + 1.483C1 + 1.401C6
HRVcL = −11.034 + 1.130S1 + 1.283C7 + 1.487C6
HRVFL = −13.024 + 1.352W2 + 1.002C8 + 1.807S5
HRVFRL = −11.030 + 1.283W2 + 1.487C8

4. Discussion

In this study, we found various landscape element compositions in urban mountain parks across urban gradients and among different scenarios. Moreover, the public responses to urban mountain park scenes varied under different urban gradients. These findings suggest diverse influential mechanisms exerted by landscape elements on the public’s physiological and psychological perceptions.

4.1. Landscape Elements and Public Physiological and Psychological Perception in Different Scenes

In terms of urban gradients, urban and suburban landscape scenes demonstrate a notable sense of enclosure, characterized by strong artificial traces and a high degree of management and maintenance. In contrast, exurban areas offer a more natural scene with a lower level of maintenance. The distribution patterns of landscape elements under urban gradients in this research coincide well with the spatial characteristics of urban parks in certain Chinese cities, including typical mountainous cities such as Chongqing [65]. This pattern is attributed to the historical development of urban parks. Parks in urban areas were often built earlier, retaining more classical architecture, whereas those in suburban and exurban areas, developed more recently, have a stronger sense of modernity. Moreover, urban mountains are subject to urban sprawl, resulting in more compact landscape space. Additionally, the allocation of urban management funds has led to a decreasing degree of mountain park green space management from urban to suburban and exurban areas. Regarding typology, CL possesses a strong sense of modernity. FL contains more artificial elements, such as structures and paving, accompanied by a strong traditional vibe and sense of clutter. The FRL shows the strongest sense of enclosure, along with rich vegetation color and a clear vegetation hierarchy. The composition characteristics of landscape elements within different scene types are similar to those found in most Chinese urban landscape types [5].
The Biophilia Theory posits a natural affinity between humans and nature, suggesting that landscapes with a high degree of naturalness have greater benefits for stress and emotional relief. Consistent with this theory, the present research found significant differences in psychological perceptions across different urban gradients and green space typologies, notably in UA vs. EA and CL vs. FL. The exurban scenes, characterized by open visual space and abundant natural elements such as waterscape and distant mountains, bring the highest psychological benefits compared to their suburban and urban counterparts. Similarly, scenes with fewer layers of vegetation, vegetation colors, structures, buildings, fences, and open spaces are perceived as more natural, resulting in higher emotional and stress relief. In addition, this research further confirms that high openness and wide sight space positively impact vision, thus enhancing the mental vitality of public exposed to the scenery [66]. Contrary to prior research suggesting that SKT and EDA can be used as indicators of relaxation and tension levels in humans [67], our study revealed no significant differences in SKT and EDA across different scenes. This aligns with some studies reporting that SKT and EDA may not be reliable predictors of physiological recovery [68], as body temperature can quickly adjust due to its inherent regulatory mechanisms, and EDA is often affected by physical activity [69]. Despite these findings, further studies are required to decipher this phenomenon, potentially by exploring a wider variety of scene types. The results of this research also conclude that the benefits of urban green space on public physiological perceptions were similar across three urban gradients. Specifically, CL, with its open overhead view, significantly stimulates visual and psychological perceptions, yielding substantial physiological benefits. This finding supports the theory of the positive physiological impact of open space.

4.2. Landscape Element Predictors Driving Psychological and Physiological Perception

The present research suggests that elements such as architecture, sky, contemporary elements, GVI, vegetation color richness, viewshed area, humanistic vibe, and the degree of management can significantly affect the public’s physiological and psychological perceptions. Although numerous studies have highlighted the importance of paving size and grassed areas in stress relief, this research suggests that these elements had little effect on human physiological and psychological responses. Additionally, the influence of waterscape on psychological perceptions varied across different scene typologies, possibly due to perceptual feedback in the brain being influenced by the body’s perspective. Specifically, waterscape was found to affect physiological and psychological perceptions only in landscapes with parallel viewpoints of the human eye. In CL, there was no significant correlation between waterscape and physiological and psychological perceptions. Vegetation color richness and the degree of landscape maintenance had a significant effect on human psychological perception. The presence of buildings significantly enhanced human psychological perception in both CL and FL, supporting Evensen‘s finding that a certain number of buildings in the natural environment can foster a sense of security, thus enhancing the environment’s positive psychological benefits [70]. However, elements such as structures and fences do not contribute similarly. Beyond individual elements, the vibe of the space and the scene created by the combination of elements also has a significant effect on human perceptions. In this research, we found that the viewshed area and the average sight distance in the landscape considerably contributed to psychological and physiological perceptions while negatively impacting a sense of enclosure. This implies a preference for open spaces with a wide field of view, supporting the lookout–shelter theory. In an open space, a contemporary vibe plays a positive role in the public‘s physiological and psychological perceptions, while in the forest space, the traditional Chinese style proves to be more impactful. These results highlight the importance of identifying scene types and functions in landscape design. Understanding popular perception and landscape type allows designers to identify influential factors, ultimately providing valuable insights for their design projects.

4.3. Practical Application

The present research found that exurban mountain park landscapes, characterized by their ecological richness and naturalness, provided the greatest physiological and psychological perceptual benefits. This study highlights the need to enhance positive perceptions in urban and suburban mountain parks by increasing the naturalness of landscape elements. Relevant design strategies include planning more open spaces, avoiding unnecessary vegetation enrichment, reducing pavement areas while maintaining functionality, augmenting water landscape, designing waterscapes in natural forms, and moderating the presence of buildings, structures and fences in the landscape, etc. Furthermore, this study found that the canopy recreation area has the highest spiritual vitality and invigoration. Thus, in urban park design, creating a canopy landscape to enhance recreational opportunities is advisable. This can be achieved through the use of structures such as steel-framed walkways or outreach platforms. Successful examples include Singapore’s Marina Park Super Tree Trail, Fudao in Fuzhou, and Shanhai Trail Xiamen, all of which have achieved great results in terms of public welfare. However, the construction of such spaces requires careful consideration of financial investments and returns and whether they are in line with the local socio-economic situation.
In landscape element design, the present research proposes that elements like GVI, vegetation color richness, architecture, contemporary elements, viewshed area, and average sight distance can significantly enhance the public’s physiological and psychological perceptions. However, the application of these findings needs to be specifically adapted to the typology of landscape. In CL, architecture, humanity vibe, contemporary elements, viewshed area, sight distance, and sense of enclosure had significant effects on the public’s physiological and psychological perceptual responses. In FRL, vegetation color, spatial enclosure, paved area, traditional elements, and the management degree positively influenced physiological and psychological perceptions. In FL, vegetation color richness, sky, viewshed area, sight distance, sense of enclosure, architecture, humanity vibe, contemporary elements, traditional elements, and management degree were found to significantly impact psychological perception, while architecture, elemental style, distant hills, sky, and spatial enclosure significantly influenced physiological perception. Thus, in practical design, more open and semi-open spaces with extended sight distances are recommended for both FL and CL. Building on existing research, we can tailor strategies for physiological and psychological improvements to specific demographic groups through a recreational interpretation system. This approach can effectively guide the public in choosing recreational sites that best suit their needs.

4.4. Limitation and Future Research

Following existing research, this research set a time limit for participants to perceive scenes to meet the specific testing requirements. However, these metrics were found to have a feedback delay, which should be further examined in future studies. Although the sample size of about 30 university students has been deemed representative, it is recommended to examine diverse age cohorts in future research. Additionally, the present research focused only on the visual components of scenes; future research could consider incorporating more sensory features, such as soundscape, aroma, etc. A more comprehensive examination of features will strengthen our understanding of the link between landscape elements and human perceptions.

5. Conclusions

The present study analyzes how the characteristics of landscape elements in mountain parks change across different urban gradients and how these changes impact the public’s physiological and psychological perceptions. To this end, we constructed a model to analyze feedback from different indices. We found that in addition to GVI, architecture and contemporary elements often emphasized in previous research, landscape elements such as vegetation color richness, viewshed area, average sight distance, and scene clutter are also important and warrant careful consideration. Additionally, we found that neither changes in scene location nor type had a marked effect on EDA and SKT. This result strengthens our understanding of green space planning and design in urban mountain parks. Additionally, this insight is instrumental for urban green space design aimed at enhancing public physiological and psychological perceptions. In practice, these findings can guide urban planners and designers in creating landscapes that better facilitate health restoration for urban residents. For researchers, future inquiries into the composition of landscape elements and their impact on physiological and psychological perceptions should encompass a broader range of landscape types and more diverse monitoring methods, i.e., EEG and fMRI. Similarly, further dimensional analyses are needed as well.

Author Contributions

Conceptualization, Z.C. and W.F.; methodology, Y.L. and Z.Z.; software, Y.H.; validation, Z.C., Y.S. and J.D.; formal analysis, Y.S., J.H. and D.L.; investigation, Y.L.; data curation, J.D. and D.L.; writing—original draft preparation, Z.C., W.F. and Y.S.; writing—review and editing, Z.C., W.F., X.Y. and J.D.; supervision, W.F., X.Y.; funding acquisition, Z.C. and W.F. All authors have read and agreed to the published version of the manuscript.

Funding

This research was funded by the Education Department of Fujian Province, grant number JAT210294; Fujian University of Technology, grant number GY-Z20087; Green Urbanization across China and Europe: Collaborative Research on Key Technological Advances in Urban Forests, grant number 2021YFE0193200; Horizon 2020 strategic plan: CLEARING HOUSE-Collaborative Learning in Research, Information sharing, and Governance on How Urban tree-based solutions support Sino. European urban futures, grant number 821242; National Natural Science Foundation of China, grand number 32301648; Natural Science Foundation of Fujian Province, grand number 2020J05193.

Data Availability Statement

The data presented in this study are available on request from the corresponding author.

Conflicts of Interest

The authors declare no conflict of interest.

Appendix A

Table A1. The correlation between landscape elements and physiological and psychological perception.
Landscape TypePerception IndexP1P2P3P4P5W1W2S1S2S3S4S5S6S7
Urban mountain parkSVNSNS0.311 **NSNSNSNS0.253 *NS0.324 **NSNSNSNS
SRNSNS−0.320 **NSNSNSNS0.285 **NS0.336 **0.217 *NS−0.211 *NS
EANSNS0.301 **NSNSNSNS0.248 *NS0.293 **NSNSNSNS
ARNSNS0.283 **NSNSNSNS0.229 *NS0.293 **0.214 *NSNSNS
EMGNS−0.208 *NSNSNSNSNSNSNS0.287 **NS0.345 **−0.358 **NS
HRVNSNSNSNSNSNSNS0.259 **NSNSNSNSNSNS
CLSV0.195 *NSNSNSNSNSNS0.352 **NS0.316 **NSNS0.225 **NS
SRNSNSNSNSNSNSNS0.328 **0.162 *0.313 **NS0.185 *0.251 **NS
EANSNSNSNSNSNSNS0.382 **NS0.266 **NS0.151 *0.178 **NS
ARNSNSNSNSNSNSNS0.314 **0.224 **0.301 **NSNS0.211 **NS
EMGNSNSNSNSNSNSNSNS0.188 **NSNS0.421 **NSNS
HRVNSNSNSNSNSNSNS0.268 **0.176 *NSNS0.219 **NSNS
FLSVNSNS0.477 **NSNSNSNS0.120 *NS0.352 **NS0.344 **−0.454 **NS
SRNSNS0.469 **NSNSNSNS0.233 **NS0.220 *NS0.157 **−0.228 **NS
EANSNS0.436 **NSNSNSNS0.231 **NS0.336 *NS0.265 **−0.426 **NS
ARNSNS0.405 **NSNSNSNS0.161 **NSNSNS0.324 **−0.218 **NS
EMGNSNSNSNSNS−0.312 **−0.122 *NSNSNS0.437 **0.256 **−0.378 **NS
HRVNSNSNSNSNS−0.183 *−0.261 **NSNSNSNS0.252 **NSNS
FRLSVNSNS0.330 **NSNSNSNSNSNSNSNS0.352 **−0.164 *NS
SRNSNS0.325 **NSNS0.203 *0.211 **NSNSNSNS0.220 *−0.232 *NS
EANSNS0.307 **NSNSNSNSNSNSNSNS0.336 *−0.162 *NS
ARNSNS0.275 *NSNSNSNSNSNSNSNSNS−0.122 *NS
EMGNSNS0.266 *NSNS−0.158 *−0.187 *NSNSNSNSNSNSNS
HRVNSNSNS NS−0.139 *−0.221 **NSNSNSNSNSNSNS
Landscape TypePerception IndexC1C2C3C4C5C6C7C8C9
Urban mountain parkSV0.266 **NSNSNSNS0.335 **0.242 *NS0.211 *
SR0.257 *NSNSNSNS0.285 **NSNSNS
EA0.277 **NSNSNSNS0.341 **0.212 *0.208 *0.224 *
AR0.327 **NSNSNSNS0.303 **0.234 *NSNS
EMGNSNS0.252 *NSNS0.219 *0.271 **NSNS
HRV−0.327 **NSNSNSNS0.278 **NSNSNS
CLSV0.647 **NSNSNSNS0.549 **0.580 **NSNS
SR0.624 **NSNSNSNS0.615 **0.532 **NSNS
EA0.618 **NSNSNSNS0.680 **0.537 **NSNS
AR0.633 **NSNSNSNS0.606 **0.615 **NSNS
EMGNSNSNSNSNS0.669 **0.543 **NSNS
HRVNSNSNSNSNS0.625 **0.593 **NSNS
FCSV0.256 **NSNSNSNS0.257 **0.256 *0.256 **0.225 *
SR0.407 *NSNSNSNS0.262 **0.127 *0.407 *0.156 *
EA0.337 **NSNSNSNS0.578 **0.225 *0.337 **NS
AR0.247 **NSNSNSNS0.543 **0.158 *0.247 **0.188 *
EMGNSNSNSNSNSNS−0.122 *NSNS
HRV−0.422 **NSNSNSNSNS−0.151 *−0.422 **NS
FRLSVNSNSNSNSNS0.570 **NS0.558 **NS
SRNSNSNSNSNS0.543 **NS0.603 **NS
EANSNSNS0.366 **0.283 *0.594 **NS0.645 **0.272 *
ARNSNSNS0.300 *NS0.596 **NS0.602 **NS
EMGNSNSNSNS0.313 *0.411 **0.361 **0.412 **NS
HRVNSNSNSNSNS0.353 *NS0.392 **NS
Note: NS: Non-correlation; *: p ≤ 0.05, and **: p ≤ 0.01.

Appendix B

Table A2. Stepwise linear regression analysis of spiritual vitality and landscape element.
Landscape Type Unstandardized CoefficientsStandardized CoefficientstpR2
BStd. ErrorBeta
Urban mountain parkConstant−0.7510.134 −5.6090.0000.334
P30.1020.0580.1551.7500.024
S30.0730.0320.2062.3280.022
C90.0670.0370.1921.7930.076
C60.0690.0290.2512.3590.020
C1−0.0130.003−0.384−4.4090.000
CLConstant−0.8110.124 −5.200.0000.421
P10.0920.0720.1221.8500.011
S10.0820.0360.1852.4210.032
S6−0.0880.042−0.2051.6620.046
C60.0720.0310.1782.3210.020
C70.0140.0080.220−4.0290.000
FCConstant−0.6980.112 −6.6110.0000.442
P30.1330.0420.2011.4850.024
S30.0820.0290.1522.2100.015
S6−0.0880.042−0.132−2.1120.044
S50.0730.0330.2452.0210.002
C60.0140.0020.3002.0100.009
FRLConstant−0.9020.201 −6.0020.0000.398
P30.1020.0470.2111.6230.003
S50.1030.0190.3022.2210.022
C80.0890.0210.1561.9950.041

Appendix C

Table A3. Stepwise linear regression analysis of stress relief and landscape elements.
Landscape Type Unstandardized CoefficientsStandardized CoefficientstpR2
BStd. ErrorBeta
Urban mountain parkConstant1.1670.212 5.4930.0000.278
P30.1090.0440.2252.4620.016
S10.1370.0580.2172.3380.022
S30.0640.0320.1881.9850.050
C60.0950.0370.2342.5770.012
CLConstant1.0020.208 4.3850.0000.352
S10.1120.0520.2123.1020.016
S20.1420.0420.1953.5680.017
S6−0.1040.033−0.1722.7840.025
C10.0720.0190.1992.9220.009
C70.0860.0340.2122.8570.011
FCConstant1.1420.198 5.1520.0000.377
P30.1210.0570.2112.4440.014
S10.0950.0470.2562.9980.006
S6−0.0590.024−0.1752.0010.047
C60.1020.0360.2413.1420.033
FRCConstant1.3210.199 4.7850.0000.402
P30.1320.0410.1193.1020.014
W20.1450.1020.2411.9980.009
C80.1020.1540.2252.1040.044

Appendix D

Table A4. Stepwise linear regression analysis of emotional arousal and landscape elements.
Landscape Type Unstandardized CoefficientsStandardized CoefficientstpR2
BStd. ErrorBeta
Urban mountain parkConstant−0.8820.141 −6.2500.0280.386
P30.0970.0250.3303.8440.000
S30.1160.0290.3453.9850.000
C60.0900.0220.3454.0190.000
C1−0.0110.0030.344−4.0750.000
CLConstant−1.0130.141 −5.2700.0110.388
S10.0890.0250.3292.7410.002
S60.1320.0290.3553.5020.000
C70.0890.0220.3213.8120.000
C10.0140.0030.3033.9580.000
FCConstant−0.9750.141 −5.8600.0140.406
P30.1010.0250.3184.2520.001
S10.0960.0290.3694.0020.002
S60.0890.0220.3523.6320.001
S50.1020.0220.3223.7700.000
C60.0110.0030.2994.1140.000
FRCConstant−0.9020.141 −6.0020.0050.361
P30.0880.0250.3113.7850.000
S50.1520.0290.3823.5680.002
CC60.0780.0220.2974.0020.001
C40.0820.0220.3094.0030.000
C10.0130.0030.3663.9850.001

Appendix E

Table A5. Stepwise linear regression analysis of attention recovery and landscape elements.
Landscape Type Unstandardized CoefficientsStandardized CoefficientstpR2
BStd. ErrorBeta
Urban mountain parkConstant−0.8490.161 −5.2830.0000.352
S30.0620.0280.1912.2320.028
P10.0990.0330.2523.0110.003
C60.0990.0220.3934.5400.000
C1−0.0130.003−0.423−4.9900.000
CLConstant−0.7920.161 −4.2530.0000.428
S10.1000.0260.2151.8920.028
S6−0.0520.087−0.192−2.7510.003
C60.2820.0540.4425.0020.000
C70.1090.0610.1442.9510.001
C10.0210.0040.3025.0010.000
FLConstant−0.7980.103 −4.3320.0000.500
P30.0720.0220.2004.2520.008
S50.1020.0530.3324.0110.003
S6−0.0890.034−0.302−3.5900.001
C10.0310.004−0.0832.5900.000
FRLConstant−0.9220.099 −4.2000.0000.483
S6−0.0620.032−0.170−1.5320.015
C60.1030.0310.2514.0510.002
C80.0870.0250.3933.5500.003
C40.0130.0020.5232.2050.001

Appendix F

Table A6. Stepwise linear regression analysis of emg and landscape elements.
Landscape Type Unstandardized CoefficientsStandardized CoefficientstpR2
BStd. ErrorBeta
Urban mountain parkConstant−7.9101.357 −5.8280.0000.432
S3−0.9450.289−0.323−3.2760.001
S6−0.5860.349−0.173−1.6770.009
C6−0.4810.2710.1691.7730.008
CLConstant−8.0801.725 −5.8280.0000.502
S2−0.4450.300−0.521−4.2860.003
S5−0.7860.289−0.253−2.1570.002
C6−0.5680.248−0.423−0.9050.003
C1−0.4710.1990.1691.2930.001
FCConstant−8.1251.258 −4.3280.0000.399
W2−0.8750.302−0.502−2.7600.001
S60.6260.311−0.413−2.2270.010
S5−0.7920.2850.159−0.7750.006
FRCConstant−7.9981.485 −3.5810.0000.582
P3−0.7850.205−0.293−2.2360.001
W2−0.6890.156−0.203−3.6270.011
C7−0.4520.0710.185−4.2280.007

Appendix G

Table A7. Stepwise linear regression analysis of hrv and landscape elements.
Landscape Type Unstandardized CoefficientsStandardized CoefficientstpR2
BStd. ErrorBeta
Urban mountain parkConstant−0.0240.002 −12.0340.0000.482
S10.0010.0010.1581.2830.020
C10.0010.0010.1281.4830.031
C60.0020.0010.1831.4010.014
CLConstant−0.0260.002 −11.0340.0000.398
S10.0010.0010.1481.1300.049
C70.0010.0010.1181.2830.002
C60.0010.0010.1031.4870.014
FCConstant−0.0350.001 −13.0240.0000.541
W20.0010.0010.0581.3520.034
C80.0020.0010.0941.0020.019
S50.0010.0010.1521.8070.004
FRCConstant−0.0270.002 −11.0300.0000.388
W20.0010.0010.2081.2830.017
C80.0010.0010.1361.4870.010

References

  1. Yang, C. Fujian city planning and constructi. Fujian Environ. Prot. 1996, 13, 36. (In Chinese) [Google Scholar]
  2. Shen, L. Study on sustainable competitiveness of Fujian city from multi-dimensional perspective. Dev. Res. 2022, 39, 63–71. (In Chinese) [Google Scholar]
  3. Li, Z. Practice thinking of creative transformation and innovative development of Fujian historical and cultural famous towns. J. Fujian Prov. Inst. Social. 2020, 5, 56–62. (In Chinese) [Google Scholar]
  4. Chen, W. Urban double repair—The 11th Jiangsu Horticultural Exposition Exposition Park. J. Archit. 2022, 8, 1. (In Chinese) [Google Scholar]
  5. Wang, Y.; Mao, Y.; Yang, X.Y.; Lu, G.X. Study on the relationship between urban development scale and natural environmental factors in China. Nat. Resour. Informatiz. 2022, 4, 61–65. (In Chinese) [Google Scholar]
  6. Sun, J.W.; Jiang, Z.; Hu, J.Y. Spatial and temporal evolution pattern and driving factors of high-quality urban development in China in the new era. Geogr. Res. 2022, 41, 1864–1882. (In Chinese) [Google Scholar]
  7. Qin, B.; Zhu, W.; Wang, J.; Peng, Y. Understanding the relationship between neighbourhood green space and mental wellbeing: A case study of Beijing, China. Cities 2021, 109, 103039. [Google Scholar] [CrossRef]
  8. Aicher, J. Designing Healthy Cities: Prescriptions, Principles, and Practice. Landsc. Urban Plan. 2000, 49, 191–197. [Google Scholar]
  9. Brągoszewska, E. Health Effects and Exposure Assessment to Bioaerosols in Indoor and Outdoor Environments. Atmosphere 2021, 12, 359. [Google Scholar] [CrossRef]
  10. World Health Organization. Twenty Steps for Developing a Healthy Cities Project; WHO: Geneva, Switzerland, 1997. [Google Scholar]
  11. Tabrizi, J.S.; Bazargani, H.S.; Ardakani, M.A.; Saadati, M. Developing safe community and healthy city joint model. J. Inj. Violence Res. 2020, 12, 3–14. [Google Scholar] [CrossRef]
  12. Goddard, M.A.; Dougill, A.J.; Benton, T.G. Scaling up from gardens: Biodiversity conservation in urban environments. Trends Ecol. Evol. 2010, 25, 90–98. [Google Scholar] [CrossRef] [PubMed]
  13. Fuller, R.A.; Irvine, K.N.; Devine-Wright, P.; Warren, P.H.; Gaston, K.J. Psychological benefits of greenspace increase with biodiversity. Biol. Lett. 2007, 3, 390–394. [Google Scholar] [CrossRef] [PubMed]
  14. James, P.; Tzoulas, K.; Adams, M.D.; Barber, A.; Box, J.; Breuste, J.; Elmqvist, T.; Frith, M.; Gordon, C.; Greening, K.L.; et al. Towards an integrated understanding of green space in the European built environment. Urban For. Urban Green. 2009, 8, 65–75. [Google Scholar] [CrossRef]
  15. Zhou, X.; Cen, Q.; Qiu, H. Effects of urban waterfront park landscape elements on visual behavior and public preference: Evidence from eye-tracking experiments. Urban For. Urban Green. 2023, 82, 127889. [Google Scholar] [CrossRef]
  16. Lee, J.; Park, B.J.; Tsunetsugu, Y.; Ohira, T.; Kagawa, T.; Miyazaki, Y. Effect of forest bathing on physiological and psychological responses in young Japanese male subjects. Public Health 2011, 125, 93–100. [Google Scholar] [CrossRef] [PubMed]
  17. Nordh, H.; Hagerhall, C.M.; Holmqvist, K. Tracking Restorative Components: Patterns in Eye Movements as a Consequence of a Restorative Rating Task. Landsc. Res. 2013, 38, 101–116. [Google Scholar] [CrossRef]
  18. Morgan, P. Towards a developmental theory of place attachment. J. Environ. Psychol. 2010, 30, 11–22. [Google Scholar] [CrossRef]
  19. Kyle, G.; Graefe, A.; Manning, R.; Bacon, J. Effects of place attachment on users’ perceptions of social and environmental conditions in a natural setting. J. Environ. Psychol. 2004, 24, 213–225. [Google Scholar] [CrossRef]
  20. Raymond, C.M.; Brown, G.; Weber, D. The measurement of place attachment: Personal, community, and environmental connections. J. Environ. Psychol. 2010, 30, 422–434. [Google Scholar] [CrossRef]
  21. Tzoulas, K.; Korpela, K.; Venn, S.; Yli-Pelkonen, V.; Kaźmierczak, A.; Niemela, J.; James, P. Promoting ecosystem and human health in urban areas using Green Infrastructure: A literature review. Landsc. Urban Plan. 2007, 81, 167–178. [Google Scholar] [CrossRef]
  22. Zhang, R.; Zhang, L. Panoramic visual perception and identification of architectural cityscape elements in a virtual-reality environment. Future Gener. Comput. Syst. 2021, 118, 107–117. [Google Scholar] [CrossRef]
  23. Yuan, S.; Browning, M.H.E.M.; McAnirlin, O.; Sindelar, K.; Shin, S.; Drong, G.; Hoptman, D.; Heller, W. A virtual reality investigation of factors influencing landscape preferences: Natural elements, emotions, and media creation. Landsc. Urban Plan. 2023, 230, 104616. [Google Scholar] [CrossRef]
  24. Tang, J.; Long, Y. Measuring visual quality of street space and its temporal variation: Methodology and its application in the Hutong area in Beijing. Landsc. Urban Plan. 2019, 191, 103436. [Google Scholar] [CrossRef]
  25. Lu, Y.; Ferranti, E.J.S.; Chapman, L.; Pfrang, C. Assessing urban greenery by harvesting street view data: A review. Urban For. Urban Green. 2023, 83, 127917. [Google Scholar] [CrossRef]
  26. Jiang, B.; Chang, C.; Sullivan, W.C. A dose of nature: Tree cover, stress reduction, and gender differences. Landsc. Urban Plan. 2014, 132, 26–36. [Google Scholar] [CrossRef]
  27. Li, X.; Zhang, C.; Li, W.; Ricard, R.; Meng, Q.; Zhang, W. Assessing street-level urban greenery using Google Street View and a modified green view index. Urban For. Urban Green. 2015, 14, 675–685. [Google Scholar] [CrossRef]
  28. Honjo, T.; Lin, T.-P.; Seo, Y. Sky view factor measurement by using a spherical camera. J. Agric. Meteorol. 2019, 75, 59–66. [Google Scholar] [CrossRef]
  29. Tabrizian, P.; Baran, P.K.; Van Berkel, D.; Mitasova, H.; Meentemeyer, R. Modeling restorative potential of urban environments by coupling viewscape analysis of lidar data with experiments in immersive virtual environments. Landsc. Urban Plan. 2020, 195, 103704. [Google Scholar] [CrossRef]
  30. Wolch, J.R.; Byrne, J.; Newell, J.P. Urban green space, public health, and environmental justice: The challenge of making cities ‘just green enough’. Landsc. Urban Plan. 2014, 125, 234–244. [Google Scholar] [CrossRef]
  31. Adli, M.; Berger, M.; Brakemeier, E.L.; Engel, L.; Fingerhut, J.; Gomez-Carrillo, A.; Hehl, R.; Heinz, A.; Mayer, J.; Mehran, N.; et al. Neurourbanism: Towards a new discipline. Lancet Psychiatry 2017, 4, 183–185. [Google Scholar] [CrossRef]
  32. Choe, E.Y.; Jorgensen, A.; Sheffield, D. Does a natural environment enhance the effectiveness of Mindfulness-Based Stress Reduction (MBSR)? Examining the mental health and wellbeing, and nature connectedness benefits. Landsc. Urban Plan. 2020, 202, 103886. [Google Scholar] [CrossRef]
  33. Zhou, S.; Gao, Y.; Zhang, Z.; Zhang, W.; Meng, H.; Zhang, T. Visual Behaviour and Cognitive Preferences of Users for Constituent Elements in Forest Landscape Spaces. Forests 2022, 13, 47. [Google Scholar] [CrossRef]
  34. Welke, D.; Vessel, E.A. Naturalistic viewing conditions can increase task engagement and aesthetic preference but have only minimal impact on EEG quality. Neuroimage 2022, 256, 119218. [Google Scholar] [CrossRef]
  35. Mitchell, R.; Popham, F. Effect of exposure to natural environment on health inequalities: An observational population study. Lancet 2008, 372, 1655–1660. [Google Scholar] [CrossRef] [PubMed]
  36. Verma, D.; Jana, A.; Ramamritham, K. Machine-based understanding of manually collected visual and auditory datasets for urban perception studies. Landsc. Urban Plan. 2019, 190, 103604. [Google Scholar] [CrossRef]
  37. Spielhofer, R.; Hunziker, M.; Kienast, F.; Wissen Hayek, U.; Grêt-Regamey, A. Does rated visual landscape quality match visual features? An analysis for renewable energy landscapes. Landsc. Urban Plan. 2021, 209, 104000. [Google Scholar] [CrossRef]
  38. Zhang, F.; Fan, Z.; Kang, Y.; Hu, Y.; Ratti, C. “Perception bias”: Deciphering a mismatch between urban crime and perception of safety. Landsc. Urban Plan. 2021, 207, 104003. [Google Scholar] [CrossRef]
  39. Stigsdotter, U.K.; Corazon, S.S.; Sidenius, U.; Refshauge, A.D.; Grahn, P. Forest design for mental health promotion—Using perceived sensory dimensions to elicit restorative responses. Landsc. Urban Plan. 2017, 160, 1–15. [Google Scholar] [CrossRef]
  40. Hassan, A.; Chen, Q.B.; Jiang, T.; Lyu, B.Y.; Li, N.; Li, S.; Shangguan, Z.Y.; Li, Y.T.; Jun, Z.L.; Luo, Q.; et al. Psychophysiological Effects of Bamboo Plants on Adults. Biomed. Environ. Sci. 2017, 30, 846–850. [Google Scholar] [CrossRef]
  41. Song, C.; Ikei, H.; Igarashi, M.; Takagaki, M.; Miyazaki, Y. Physiological and Psychological Effects of a Walk in Urban Parks in Fall. Int. J. Environ. Res. Public Health 2015, 12, 14216–14228. [Google Scholar] [CrossRef]
  42. Lee, J. Nature Therapy and Preventive Medicine; IntechOpen: London, UK, 2012. [Google Scholar]
  43. Tyrväinen, L.; Ojala, A.; Korpela, K.; Lanki, T.; Tsunetsugu, Y.; Kagawa, T. The influence of urban green environments on stress relief measures: A field experiment. J. Environ. Psychol. 2014, 38, 1–9. [Google Scholar] [CrossRef]
  44. Luo, S.; Shi, J.; Lu, T.; Furuya, K. Sit down and rest: Use of virtual reality to evaluate preferences and mental restoration in urban park pavilions. Landsc. Urban Plan. 2022, 220, 104336. [Google Scholar] [CrossRef]
  45. Song, C.; Ikei, H.; Kobayashi, M.; Miura, T.; Li, Q.; Kagawa, T.; Kumeda, S.; Imai, M.; Miyazaki, Y. Effects of viewing forest landscape on middle-aged hypertensive men. Urban For. Urban Green. 2017, 21, 247–252. [Google Scholar] [CrossRef]
  46. Sung, J.; Woo, J.M.; Kim, W.; Lim, S.K.; Chung, E.J. The Effect of Cognitive Behavior Therapy-Based “Forest Therapy” Program on Blood Pressure, Salivary Cortisol Level, and Quality of Life in Elderly Hypertensive Patients. Clin. Exp. Hypertens. 2012, 34, 1–7. [Google Scholar] [CrossRef] [PubMed]
  47. Zhang, P.; Kohli, D.; Sun, Q.; Zhang, Y.; Liu, S.; Sun, D. Remote sensing modeling of urban density dynamics across 36 major cities in China: Fresh insights from hierarchical urbanized space. Landsc. Urban Plan. 2020, 203, 103896. [Google Scholar] [CrossRef]
  48. Wu, J.; Yang, M.; Xiong, L.; Wang, C.; Ta, N. Health-oriented vegetation community design: Innovation in urban green space to support respiratory health. Landsc. Urban Plan. 2021, 205, 103973. [Google Scholar] [CrossRef]
  49. John, E.E.; Astell-Burt, T.; Yu, P.; Brennan-Horley, C.; Feng, X. Green space type and healthy ageing in place: An Australian longitudinal study. Urban For. Urban Green. 2023, 84, 127903. [Google Scholar] [CrossRef]
  50. Yu, C.; Lee, H.; Lu, W.; Huang, Y.; Browning, M.H.E.M. Restorative effects of virtual natural settings on middle-aged and elderly adults. Urban For. Urban Green. 2020, 56, 126863. [Google Scholar] [CrossRef]
  51. Kabisch, N.; Püffel, C.; Masztalerz, O.; Hemmerling, J.; Kraemer, R. Physiological and psychological effects of visits to different urban green and street environments in older people: A field experiment in a dense inner-city area. Landsc. Urban Plan. 2021, 207, 103998. [Google Scholar] [CrossRef]
  52. Yu, C.; Lee, H.; Luo, X. The effect of virtual reality forest and urban environments on physiological and psychological responses. Urban For. Urban Green. 2018, 35, 106–114. [Google Scholar] [CrossRef]
  53. Rahnema, S.; Sedaghathoor, S.; Allahyari, M.S.; Damalas, C.A.; Bilali, H.E. Preferences and emotion perceptions of ornamental plant species for green space designing among urban park users in Iran. Urban For. Urban Green. 2019, 39, 98–108. [Google Scholar] [CrossRef]
  54. Buttazzoni, A.; Doherty, S.; Minaker, L. How do urban environments affect young people’s mental health? a novel conceptual framework to bridge public health, planning, and neuro-urbanism. Public Health Rep. 2022, 137, 48–61. [Google Scholar] [CrossRef] [PubMed]
  55. Takano, T.; Nakamura, K.; Watanabe, M. Urban residential environments and senior citizens’ longevity in megacity areas: The importance of walkable green spaces. J. Epidemiol. Community Health. 2002, 56, 913–918. [Google Scholar] [CrossRef]
  56. Tamosiunas, A.; Grazuleviciene, R.; Luksiene, D.; Dedele, A.; Reklaitiene, R.; Baceviciene, M.; Vencloviene, J.; Bernotiene, G.; Radisauskas, R.; Malinauskiene, V.; et al. Accessibility and use of urban green spaces, and cardiovascular health: Findings from a Kaunas cohort study. Environ Health. 2014, 13, 20. [Google Scholar] [CrossRef] [PubMed]
  57. Mao, G.; Cao, Y.; Lan, X.; He, Z.; Chen, Z.; Wang, Y.; Hu, X.; Lv, Y.; Wang, G.; Yan, J. Therapeutic effect of forest bathing on human hypertension in the elderly. J. Cardiol. 2012, 60, 495–502. [Google Scholar] [CrossRef] [PubMed]
  58. Zhao, X.; Wei, Z.; Li, Z.; Zhang, Y.; Feng, X.; Gori, L. Threshold Research on Highway Length under Typical Landscape Patterns Based on Drivers’ Physiological Performance. Discret. Dyn. Nat. Soc. 2015, 2015, 753732. [Google Scholar] [CrossRef]
  59. Alcock, I.; White, M.P.; Wheeler, B.W.; Fleming, L.E.; Depledge, M.H. Longitudinal Effects on Mental Health of Moving to Greener and Less Green Urban Areas. Environ. Sci. Technol. 2014, 48, 1247–1255. [Google Scholar] [CrossRef]
  60. Yang, B.; Markevych, I.; Bloom, M.S.; Heinrich, J.; Guo, Y.; Morawska, L.; Dharmage, S.C.; Knibbs, L.D.; Jalaludin, B.; Jalava, P.; et al. Community greenness, blood pressure, and hypertension in urban dwellers: The 33 Communities Chinese Health Study. Environ. Int. 2019, 126, 727–734. [Google Scholar] [CrossRef]
  61. Badrinarayanan, V.; Kendall, A.; Cipolla, R. SegNet: A Deep Convolutional Encoder-Decoder Architecture for Image Segmentation. IEEE Trans. Pattern Anal. Mach. Intell. 2017, 39, 2481–2495. [Google Scholar] [CrossRef]
  62. Lu, Y. Using Google Street View to investigate the association between street greenery and physical activity. Landsc. Urban Plan. 2019, 191, 103435. [Google Scholar] [CrossRef]
  63. Liu, W.; Hu, X.; Song, Z.; Yuan, X. Identifying the integrated visual characteristics of greenway landscape: A focus on human perception. Sustain. Cities Soc. 2023, 99, 104937. [Google Scholar] [CrossRef]
  64. World Health Organization. Reducing Global Health Risks through Mitigation of Short-Lived Climate Pollutants. Scopong Report for Policymakers; WHO: Geneva, Switzerland, 2015. [Google Scholar]
  65. Peng, Y. Spatial and temporal change of outsize mountainous city landscape pattern of urban green space. J. West China For. Sci. 2014, 43, 48–56. (In Chinese) [Google Scholar]
  66. Schirpke, U.; Tasser, E.; Lavdas, A.A. Potential of eye-tracking simulation software for analyzing landscape preferences. PLoS ONE 2022, 17, e273519. [Google Scholar] [CrossRef] [PubMed]
  67. Liu, L.; Qu, H.; Ma, Y.; Wang, K.; Qu, H. Restorative benefits of urban green space: Physiological, psychological restoration and eye movement analysis. J. Environ. Manag. 2022, 301, 113930. [Google Scholar] [CrossRef] [PubMed]
  68. Wen, Y.; Yan, Q.; Pan, Y.; Gu, X.; Liu, Y. Medical empirical research on forest bathing (Shinrin-yoku): A systematic review. Environ. Health Prev. 2019, 24, 70. [Google Scholar] [CrossRef]
  69. Yau, K.K.; Loke, A.Y. Effects of forest bathing on pre-hypertensive and hypertensive adults: A review of the literature. Environ. Health Prev. 2020, 25, 23. [Google Scholar] [CrossRef]
  70. Evensen, K.H.; Hemsett, G.; Nordh, H. Developing a place-sensitive tool for park-safety management experiences from green-space managers and female park users in Oslo. Urban For. Urban Green. 2021, 60, 127057. [Google Scholar] [CrossRef]
Figure 1. The location of the research sites in Fuzhou and the distribution of eight urban mountain parks.
Forests 14 02406 g001
Figure 2. Location distribution of sample points.
Forests 14 02406 g002
Figure 3. Landscape element index.
Forests 14 02406 g003
Figure 4. Landscape elements sematic segmentation analysis.
Forests 14 02406 g004
Figure 5. Experimental procedure.
Forests 14 02406 g005
Figure 6. Participants’ psychological and physiological perception in urban mountain park with different urban gradients.
Forests 14 02406 g006
Figure 7. Participants’ psychological and physiological perception in urban mountain park with different typologies.
Forests 14 02406 g007
Table 1. Landscape element index decomposition quantification method.
No.Landscape Element IndexExplanationQuantification Method
1Viewshed area/ArcGIS
2Longest sight distance/
3Average sight distanceSelect the average sight distance of 16 directions: east, southeast, South, southwest, west, northwest, North, northeast, north-northeast, east-northeast, east-southeast, south-southeast, south-southwest, west-southwest, west-northwest, north-northwest
4Distant hills/semantic segmentation with manual distinguish
5SkyThe proportion of the sky in the panoramic scene
6EnclosureThe sum of the proportion of tree, shub, building, structure and fence in the panoramic scene.
7GroundThe proportion of ground.
8GVIThe proportion of vegetation.
9Tree and shrubThe proportion of trees and shrubs.
10GrassThe proportion of grass.
11Vegetation hierarchy1 for single layer, 2 for double layer, 3 for triple layer, and so on.
12Waterscape1 for none, 2 for presence.
13Water surface areaThe proportion of water.
14FenceThe proportion of fence.
15StructuresThe proportion of structures (street lights, trash cans, etc.).
16Building The proportion of buildings.
17Pavement0 for none,1 for presence.
18Paved areaThe proportion of paving.
19Humanistic vibeThe proportion of building and structure.
20Scene clutterThe proportion of garbage, graffiti, and damaged objects.
21Contemporary elementThe proportion of contemporary-style buildings and structures.
22Traditional elementThe proportion of traditional-style buildings and structures.
23Vegetation color richness1 point for no obvious color difference, 2 points for different shades of green, 3 points for flowers or colored leavesColor Impact
Table 2. Participants.
Group123456Total
Total313032313030184
Male14
(45.2%)
15
(50%)
16
(50%)
15
(48.4%)
15
(50%)
15
(50%)
90
(48.9%)
Female17
(54.8%)
15
(50%)
16
(50%)
16
(51.6%)
15
(50%)
15
(50%)
94
(51.1%)
Table 3. Analysis of landscape elements of urban mountain park with different urban gradients.
P1 (%)P2 (%)P3P4P5 (%)W2 (%)W1
UA41.6234.982.523.526.640.9511.11
SA33.7628.531.663.025.220.053.33
EA38.1732.881.812.785.291.043.33
S1 (ha)S2 (km)S3 (km)S4 (%)S5 (%)S6 (%)
UA138.191.391.260.0013.1047.55
SA1093.8430.688.390.1520.0241.73
EA1204.0912.724.210.2418.5042.86
C1 (%)C2 (%)C3 (%)C5 (%)C6C7 (%)C9 (%)
UA6.64 0.81 1.68 34.22 9.13 3.36 0.02
SA6.74 1.32 3.12 31.19 11.18 6.32 0.05
EA3.12 0.60 1.57 30.44 5.30 2.12 0.13
Table 4. Analysis of landscape elements of urban mountain park with different typology.
P1 (%)P2 (%)P3P4P5 (%)W2 (%)W1
CL25.6724.07 1.26 1.50 1.60 0.36 7.41
FL38.1232.43 2.52 4.06 5.69 0.05 3.33
FLS49.1140.40 2.56 3.28 8.71 1.82 6.67
S1 (ha)S2 (km)S3 (km)S4 (%)S5 (%)S6 (%)
CL2411.44 38.05 14.39 0.76 31.10 36.16
FL12.17 1.28 0.370.05 19.81 40.00
FLS0.68 0.34 0.06 0.00 12.96 47.20
C1 (%)C2 (%)C3 (%)C5 (%)C6C7 (%)C9 (%)
CL1.391.317.5327.7710.236.360.00
FL1.110.900.9437.342.950.750.11
FLS1.860.690.6725.323.221.680.09
Table 5. The correlation between landscape elements and physiological and psychological perception.
Perception IndexP1P2P3P4P5W1W2S1S2S3S4S5S6S7C1C2C3C4C5C6C7C8C9
SVNSNS0.311 **NSNSNSNS0.253 *NS0.324 **NSNSNSNS0.266 **NSNSNSNS0.335 **0.242 *NS0.211 *
SRNSNS−0.320 **NSNSNSNS0.285 **NS0.336 **0.217 *NS−0.211 *NS0.257 *NSNSNSNS0.285 **NSNSNS
EANSNS0.301 **NSNSNSNS0.248 *NS0.293 **NSNSNSNS0.277 **NSNSNSNS0.341 **0.212 *0.208 *0.224 *
ARNSNS0.283 **NSNSNSNS0.229 *NS0.293 **0.214 *NSNSNS0.327 **NSNSNSNS0.303 **0.234 *NSNS
EMGNS−0.208 *NSNSNSNSNSNSNS0.287 **NS0.345 **−0.358 **NSNSNS0.252 *NSNS0.219 *0.271 **NSNS
HRVNSNSNSNSNSNSNS0.259 **NSNSNSNSNSNS−0.327 **NSNSNSNS0.278 **NSNSNS
Note: SV: Spiritual vitality; SR: Stress relief; EA: Emotional Arousal; AR: Attention Restoration; NS: Non-correlation; *: p ≤ 0.05, and **: p ≤ 0.01.
Disclaimer/Publisher’s Note: The statements, opinions and data contained in all publications are solely those of the individual author(s) and contributor(s) and not of MDPI and/or the editor(s). MDPI and/or the editor(s) disclaim responsibility for any injury to people or property resulting from any ideas, methods, instructions or products referred to in the content.

