


Remote Sensing Applications in Monitoring Poplars: A Review

1
School of Agricultural, Earth and Environmental Sciences, University of KwaZulu-Natal, Westville Campus, Durban 4000, South Africa
2
Scientific Services, South African National Parks, Kimberley 8301, South Africa
*
Author to whom correspondence should be addressed.
Forests 2023, 14(12), 2301; https://doi.org/10.3390/f14122301
Submission received: 31 October 2023
/
Revised: 20 November 2023
/
Accepted: 21 November 2023
/
Published: 23 November 2023
(This article belongs to the Special Issue Remote Sensing Application for Mapping and Monitoring Forest Ecosystems)
Abstract
:Given the ability of remote sensing to detect distinctive plant traits, it has emerged in recent decades as a useful and attractive research tool for forest trees such as poplars. Although poplars have been extensively studied using remote sensing over the past thirty years, no reviews have been conducted to understand the results of multiple applications. Here, we present a review and synthesis of poplar studies in this regard. We searched the Scopus, Google Scholar, and Science Direct databases and found 266 published articles, of which 148 were eligible and analyzed. Our results show a rapid increase in remote sensing-based poplar publications over the period of 1991–2022, with airborne platforms, particularly LiDAR, being predominantly used, followed by satellite and ground-based sensors. Studies are widespread in the Global North, accounting for more than two-thirds of studies. The studies took place mainly in agricultural landscapes, followed by forest areas and riparian areas, with a few in mountain and urban areas. Commonly studied biophysical parameters were mostly obtained from LiDAR data. On the other hand, spectral indicators have been widely used to monitor the health and vitality of poplar trees, integrating various machine learning algorithms. Overall, remote sensing has been widely used in poplar studies, and the increasing use of free satellite data and processing platforms is expected to pave the way for data-poor countries to monitor poplar in the Global South, where resources are mainly limited.
1. Introduction
Ongoing developments in the field of Earth Observation have enabled the study of unique characteristics of various tree species, including the commercially important poplar (Populus spp.). Although this subject has attracted the attention of many scholars, reviews of the literature characterizing this research remain a gap that this study attempts to fill. Poplar is one of the most valuable trees for industrial production due to its desirable characteristics such as rapid growth, hybridization tendency, and adaptability to different environmental conditions [1]. Its high ecological value contributes toward the restoration of degraded landscapes through seed trapping (increasing surface roughness), soil stabilization, erosion control, and nutrient cycle improvements [2]. While poplar occurs in many countries as a native species, it has been established in many other places as an invasive alien species (IAS) [3,4]. IAS are plants introduced mainly by human activities outside their natural environment that can colonize natural ecosystems, with varying ecological and socioeconomic consequences [5]. Their presence and spread seriously threaten local biodiversity and are exacerbated by climate change and limited mechanisms to address it [6]. Typically, invasive alien species have competitive traits that allow them to colonize and displace native ecosystems [7]. Poplar is native to regions such as Asia, Europe, and North America [8], and invasive in many African countries.
In countries like South Africa, poplar species are common in many landscapes and are only legally permitted in certain areas under controlled conditions [9]. Dense stands of cottonwood formed through rooting can narrow and block water channels, leading to flooding and increased siltation [10]. Their extensive stocks could lead to a significant reduction in the flow of the stream. Therefore, understanding the location and extent of poplar species is crucial for biodiversity conservation and land management. While poplar species are measurable in labor-intensive and costly field studies, their detection through remote sensing technology seems a practical option.
Remote sensing has emerged as a crucial data source for the retrieval and analysis of forest information because it offers a spatially continuous, highly consistent representation of the Earth’s surface [11]. With improvements in sensor technology and Open Data policies, as well as near real-time image acquisition, remote sensing can provide useful information about the Earth’s surface at a lower cost than traditional field survey methods [12]. These advances, particularly the increasing availability of free satellite products, have expanded the options for affordable, efficient, and effective means of addressing many biodiversity monitoring challenges [13]. Since its inception, the remote detection of poplar species from surrounding vegetation communities has been successful and has since become an active area of research [14]. For example, Eslami and Zahedi [15] identified poplar-cultivated landscapes in Iran using Indian remote sensing satellite data with an overall classification accuracy of 91.48%. Hamrouni et al. [16] used Sentinel-2 time series to identify poplar plantations at the local scale with an accuracy of 89.5% to 99.3%. D’Amico et al. [17] used multilayer perceptron and traditional logistic regression (deep learning approach) to map poplar plantations in Italy with Sentinel-2 and achieved an overall accuracy of 91%. Laslier et al. [18] used LiDAR data to map poplars in riparian zones with an accuracy of 80%. These studies demonstrate high remote sensing capacity with growing interest in poplar research; however, their spatiotemporal patterns, commonly used remote sensing products, and methods remain poorly understood, and there is a need to collect evidence on the characteristics of all studies in this regard.
In this study, we analyzed peer-reviewed articles related to remote sensing approaches aiming to detect the presence and distribution of poplar species in different regions in the world. Our study provides the first literature review of poplar remote sensing and sheds light on the spatiotemporal patterns, application goals, methods, and indicators used. Based on these results, we provide recommendations for future studies.
2. Materials and Methods
2.1. Database Search Process
We searched for peer-reviewed publications that have applied remote sensing approaches to monitoring poplar species using the keywords: Remote Sensing OR Earth Observation OR NDVI OR Landsat OR LiDAR OR Sentinel OR SAR OR MODIS AND poplar OR Populus alba OR Populus nigra OR White poplar OR Black poplar from the Scopus, Google Scholar, and Science Direct databases. In this review, we followed the Preferred Reporting Items for Systematic Reviews and Meta-Analyses (PRISMA) guidelines and refer the reader to Moher et al. [19] for more information. We selected PRISMA because of its popularity as an evidence-based and the most methodologically justified approach for generating systematic reports and meta-analyses [20].
2.2. Inclusion/Exclusion Criteria
Our search returned 266 articles, 148 of which met our criteria listed in Table 1. For emphasis, we excluded all articles that used (did not use) remote sensing on non-poplar species (on poplar species), fugitive types of literature such as unpublished theses and reports from governments and institutions, and studies not published in English (Table 1). We also provide a procedure for the article search, selection, and analysis process based on the PRISMA model in Figure 1.
2.3. Data Analysis Methods
We compiled and classified publications into categorical variables, including publication year, study area, location, sensor platform and type, application purpose, biophysical parameters, classification algorithms, software, first author, and the journal in which each study was published. For each publication, we differentiated whether the poplar was studied as a native or non-native species. We also used the VOS viewer platform [21] to create title/abstract network visualization maps, as well as ESRI ArcMap v 10.8.1 (ESRI, Redlands, CA, USA) and R studio v 4.1.3 (R Foundation for Statistical Computing, Vienna, Austria) [22] for visualization and analysis.
3. Results and Discussion
We begin the analysis by describing the historical trend and patterns of eligible studies for this review, followed by a presentation of all sensor products used in the poplar studies. We then present the geographical distribution of the articles and their characteristics in terms of methods, materials, and journal selection.
3.1. Historical Research Trends
This section presents the temporal research pattern of 148 articles on poplar remote sensing published between 1991 and 2022 (Figure 2). Based on the literature search, the number of publications showed a wavy increase over this period, with most studies (67) using airborne sensors, followed by satellite (60) and terrestrial platforms (21). The first publication in 1991 was based on an airborne sensor, and since then, its use has steadily increased with satellites and, to a lesser extent, ground-based sensors. Ongoing advances in sensor technology continue to refine satellite-to-ground remote sensing products, and the increasing trend in research publications shown in Figure 2 is not surprising.
Airborne remote sensing platforms, particularly LiDAR data, have been successfully used in many poplar studies (42 publications). Since the first publication in 1999, poplar studies using LiDAR data have shown an increasing trend, particularly since 2006 (Figure 3). The choice of LiDAR is mainly based on its ability to capture three-dimensional (3D) information on forest features, which is useful for characterizing species such as poplars [23]. In addition, this product has been used in studies to overcome saturation problems in dense forests because it transmits and receives laser pulses in a relatively short time and still provides extensive data from which biophysical information can be obtained [24]. Studies such as Xu et al. [25] and Man et al. [23] found LiDAR to be useful for discerning tree species in heterogeneous dense forests and inaccessible landscapes where poplars occur. These unique LiDAR properties make it more attractive than other high-resolution sensors for challenging forest stands [26,27,28]. For modeling forest properties, variables are typically extracted from airborne LiDAR data using two common methods [29]: (a) extracting height metrics, density metrics, and forest profile features directly from point clouds [30,31,32,33] and (b) extracting statistics from canopy height model (CHM) data, which is the distinction between a digital surface model (DSM) and a digital terrain model (DTM) derived from LIDAR data [34,35]. Despite these contributions, LiDAR data are cost-prohibitive, thus limiting its use in nations with limited resources. This could justify greater application in developed countries where resources are readily available. Unmanned aerial vehicles (UAVs) or drones have also increasingly been used to monitor poplar species since 2017 [36]. While UAVs provide accurate information, the timing of data acquisition is crucial for analysis since the acquisition is usually made upon request; the data may only be useful if collected when the targeted plant species is distinct from its background and neighboring areas [37]. Therefore, to ensure accuracy in the identification and detection of poplar, the phenology of the species needs to be taken into consideration in the surveys conducted when there is a clear distinction between the target species and other species features.
Satellite products are arguably the most valuable remote sensing systems due to their consistent data collection, wider coverage, and lower cost than any other means, and are increasingly being used in poplar studies. In particular, Landsat data is the most widely used satellite product in poplar studies, with 23 publications, most of which were published after the 2008 Open Data directive. The Landsat dataset was primarily applied in agricultural and natural forested spaces, where there was a need for a sensor that has a high spatial, temporal, and spectral resolution [26]. Sentinel 1 (5) and 2 (9) sensor applications also made essential contributions to mapping and quantifying poplar plantations through supervised (object-based classifier) and unsupervised (vegetation indices) remote sensing approaches [14,17]. Typically, Sentinel sensors possess better data-capturing characteristics compared to Landsat, i.e., a spatial resolution of 10 m (visible and near-infrared bands), 20 m (red-edge and shortwave infrared bands), and 60 m (atmospheric correction bands) with a five-day temporal resolution [14]. However, two things could have slowed their application over time; firstly, Sentinel sensor data became freely available to the public between 2014 and 2017, which is the period after USGS established the Landsat open policy; secondly, Sentinel does not capture data in the thermal infrared band, which is the electromagnetic section that assists in analyzing vegetation stress and health. Be that as it may, Landsat and Sentinel sensors seem the most preferred due to their spatial coverage, making them efficient in scanning large areas without saturation. This is important for updating forest inventory and quantifying poplar production rates in agricultural sectors. Commercial satellite products such as QuickBird, WorldView-3, GeoEye, SPOT, and IKONOS have also been successfully used in poplar research. The introduction of the Google Earth Engine has also enabled easy access to various sensor datasets, thereby increasing the possibility of conducting more vegetation studies through remotely sensed data. In particular, Landsat data are the most widely used satellite product in poplar studies, with 23 publications, most of which were published after the 2008 Open Data directive. The entire Landsat archive has since become largely open, allowing users to perform location-specific image analysis and high-density time-series analysis at different time scales since the early 1970s. Sentinel had 14 publications (Sentinel-1 (5) and Sentinel-2 (9)), and the latter provides better spatial (10 m), spectral (13 bands), and temporal (3–5 days) resolution data compared to Landsat. The Sentinel-1 satellites provide a combination of high spatial and temporal resolution of dual-polarization SAR data. Its dense time series enables the derivation and analysis of temporally filtered annual backscatter signals. The proliferation of free optical satellite imagery (FOSI) has opened possibilities for all users to monitor poplar at different scales. The introduction of the Google Earth Engine also enabled easy access to various sensor datasets, thereby increasing the possibility of conducting more vegetation studies through remotely sensed data.
Ground-based sensors (including in situ and hand-held), which are similar to airborne systems, are mostly operated under human supervision. Relatively few studies (21) have used these products for poplar research. These products are well known for having better spectral and spatial resolution than most space- and airborne sensors; however, most are costly, which limits the scope of their application in vegetation studies. Most of these imaging spectrometers (also known as hyperspectral imagers) acquire a continuous spectrum over a wide range of visible and/or short wavelengths, often using hundreds of spectral bands with narrow spectral intervals. This makes them better options for poplar studies as they can correctly delineate floral features with greater fidelity, but their applications are still inadequate because of high costs associated with their access for use. Some of the hyperspectral sensors used in poplar studies include, but are not limited to, tree analyzer, Goniometer, and MAESTRO-1. The main benefit of using ground-based hyperspectral sensors is that detailed spectral profiles can be developed for native and non-native plants and spectral regions most sensitive to an abundance of the species of interest [37].
3.2. Geographical Distribution of Poplar Remote Sensing Studies
As previously stated, our search results yielded 148 peer-reviewed articles, confirming that scientists are finding remote sensing data for monitoring poplars. These studies were geographically distributed in over 20 countries, where poplar is either native or invasive, and their wide distribution is shown in Figure 4. Most studies were conducted in China (34), followed by the United States of America (22), Italy (21), France (13), and Canada (12), accounting for over two-thirds of the studies. The remaining publications came from Sweden (6), Australia (5), Belgium (5), Turkey (5), Germany (4), the Netherlands (4), Argentina (3), Hungary (3), Spain (3), India (2), and one each from the United Kingdom, Greece, Iran, Japan, and Chile (Figure 2). In the United States, Australia, India, the United Kingdom, and Iran, poplar is classified as invasive.
For emphasis, note that despite reported cases in countries like South Africa, where it is classified as a Category 2 (occurring throughout/in part of South Africa and allowed only in specified areas under controlled conditions) weed under the National Environmental Management and Biodiversity Act (NEMBA) (No. 10 of 2004) and the Conservation of Agricultural Resources Act (CARA) (No. 43 of 1983) of South Africa’s Invasive Species Legislation [9], no studies have been conducted on the African continent. This underscores the need for rigorous research, particularly when the studied species is invading (e.g., South Africa and Africa). It is believed that perhaps the reason for this is that African countries are somewhat behind in terms of the use of advanced technologies (remote sensing), and insufficient funds to purchase the necessary equipment to conduct such research could delay progress. Be that as it may, the content of this section is intended to help researchers from different walks of life (including Africa) to know in which countries the literature should be consulted to conduct higher-quality studies on the use of remote sensing on poplar species.
Our results seem to suggest that the applications of remote sensing for poplar species were more frequent in countries where they are native species than alien invaders. A similar trend was also observed in release rates, with most releases considering the species surveyed as native rather than invasive species. While poplar has a total of 35 species, we do not consider their classifications.
Our results indicate that poplar remote sensing studies primarily occurred in agricultural landscapes (58), followed by forested areas (47), riparian zones (39), and to a lesser extent, in mountain and urban landscapes (2 each) (Figure 5). In agricultural spaces, poplar was mainly studied to understand its phenological changes, carbon sequestration capacity, gross primary productivity rate, spatial growth, and canopy and leaf water content, through various remote sensing algorithms and indices [29,38,39,40,41]. For instance, Maleki et al. [42] investigated the ideal vegetation index (VIs) for describing the phenology and interannual variability of the gross primary productivity (GPP) of poplar plantations. The results of the study alluded to the medium-resolution imaging spectrometer (MERIS) terrestrial chlorophyll index (MTCI) being the best fit with GPP phenology. To quantify the holistic growth of poplar trees in agricultural space, indicators such as tree volume, height, stem, and crown cover were estimated [43]. The determination of poplar cultivated fields and mapping of their spatial sites play a vital role in enabling decision-makers and planners to enhance poplar trees’ economic and ecological value. This review discovered that poplar plantations were mapped and classified using classification techniques such as object-based classifier [14]. Colombo et al. [38] investigated the applicability of empirical and radiative transfer models to estimate water content at leaf and landscape levels. The results arising from this study indicated that hyperspectral regression indices are good for estimating water content at both leaf and landscape levels. Remote sensing mapping is a vital activity in forest plantations as it helps to quantify timber stock procurement potential, estimate volume and profit, as well as update forest inventories. This is important as it helps in meeting supply demands.
In natural forests, poplar species were mapped and characterised as part of a forest with other tree species (87%) and individual trees (13%). For instance, studies by [44,45,46,47] used remote sensing and machine learning techniques to enhance the description and identification of poplar with other trees, while studies by Moffiet et al. [48], Warner et al. [49], and Brandtberg [50] studied poplar individualized as a tree. Like how poplar plantations were studied in agricultural landscapes, poplars in natural forest together with other trees were also investigated for their capacity with regard to carbon intake, water use, seasonal pollen dynamics, and seasonal fire severity using various remote sensing techniques [44,51,52].
In mountainous regions, poplar was quantified using leaf area index (LAI) as an important agent for canopy structure, as well as biomass, carbon, and energy exchange estimation indices [53], while in urban landscapes, it was mostly studied to quantitatively relate leaf chlorophyll content (LCC) with other vegetation indices [54,55]. The reason for the low number of studies in the mountainous landscape could be due to the nature of mountains coupled with inconsistent seasonal species changes, which affect the efficacy of some remote sensing sensors to accurately detect and discriminate floral species [56]. Steep mountainous terrain can influence the accuracy of the information derived from remote sensing data [57]. These data are influenced by differences in relief and radiance energy, resulting in shadows, which decrease mapping accuracy. While this suggests an important niche to be filled in science, it is important to utilize proper remote sensing techniques and sensors to accurately delineate the heterogeneity associated with mountainous biota.
3.3. Characteristics of Methods and Materials
One of the most important tasks in remote sensing data analysis is the use of classification algorithms and specific indicators to improve the accuracy of feature detection and characterization, and numerous software programs have been developed for this purpose. Our results are shown for the top 10 dominant biophysical indicators (a), spectral indices (b), classifiers (c), and common software packages (d) used in remote sensing studies on poplars (see Table 2). Based on our results, the most studied biophysical parameters are related to forest aboveground biomass (AGB) and growing stock volume (GSV) and include poplar growth (17), biomass (14), crown cover (7), and height (4) (Table 2), all of which are retrieved through the use of LiDAR data. These proved to be essential features used in various studies to discern species distribution, cover, diversity, and composition with higher accuracy. Traditionally, all these parameters were estimated through allometric equations using tree attributes collected from the field. The development and application of this equation based on destructive sampling are highly time consuming and expensive. Plantations with fast-growing species such as poplar require frequent monitoring over time without having to resort to destructive approaches, and this is possible with LiDAR applications. LiDAR is an active remote sensing product that accurately measures the energy returned from an object of interest within a short span of time at both the stand and tree scale. On the other hand, indicators such as leaf area index (LAI; 22), normalized difference vegetation index (NDVI; 30), diversity index (DI; 15), green-red normalized difference vegetation index (GRNDVI; 5), and poplar tree index (PTI; 1) were mostly retrieved from spectral bands and their combinations in the electromagnetic spectrum (Table 2). These unsupervised remote sensing techniques were applied primarily through a method testing approach in poplar studies, i.e., testing different vegetation indices in discriminating poplars at different levels or against other vegetation features [29,41,58]. For instance, Simovic et al. [59] compared NDVI, NDRE, and EVI for detecting poplar phenology, and NDVI and NDRE were more successful than EVI in distinguishing the latter. However, we also found that NDVI is the most widely used unsupervised classification technique in many vegetation studies; however, we have found that it cannot be used in isolation to classify poplar occurrences. Therefore, the inclusion of am in situ dataset proved that there is a need for a supervised methodology to improve discrimination standards [37,60]. On the other hand, in poplar plantations where LAI is extremely high, the blue wavelength can be used to improve the accuracy of NDVI, as this corrects for soil background signals and atmospheric correction. Equivocally, the newly invented PTI also proved to be more effective than NDVI in characterizing poplar from other trees; however, it has only been used in poplar plantations and not in other landscapes where poplar occurs. We therefore recommend that it is tested in natural forests, especially occurring in mountainous landscapes where poplar is under-studied using remote sensing.
We discovered an increase in studies that used classifiers, such as Maximum likelihood (ML; 10), random forest (RF; 24), support vector machine (SVM; 15), decision tree (DT; 7), and object-based image analysis (OBIA; 6) (Table 2), to discriminate poplar plants from other traits [61,62,63]. Random forest has many exciting properties, such as high accuracy, robustness against overfitting of training data, and integrated measures of variable importance [64]. Hamrouni et al. [16] and Zhu et al. [65] mapped poplar plantations and achieved an overall accuracy of 89.5% and 85%, respectively, using random forests. Similarly, Laslier et al. [18] worked on identifying riparian tree genera based on leaf-on/leaf-out using a random forest and support vector machine and achieved an overall accuracy of 83.15%. Decision tree and maximum likelihood in poplar studies were mainly used to classify the population dynamics of poplar species in different ecosystems. For example, [63] applied the decision tree algorithm to study poplar clones and achieved more than 93% overall accuracy. Petráš et al. [66] estimated the diameter of poplar clones using the maximum likelihood technique. The rate and quality of the outputs of object-based classification [14], neural network [67] and k-nearest neighbor [68] signify great impact application in studying poplar. Although not yet used in poplar studies, spectral angle mapper classifiers are also associated with better discrimination of floral invasive species [69]; hence, they are also recommended for future use. Many of these computations were performed using Matlab (17), Python (13), ArcMap (9), RStudio (14), ENVI (version 5.0) (9), and other software (Table 2).
3.4. Co-Occurrence Words/Keywords
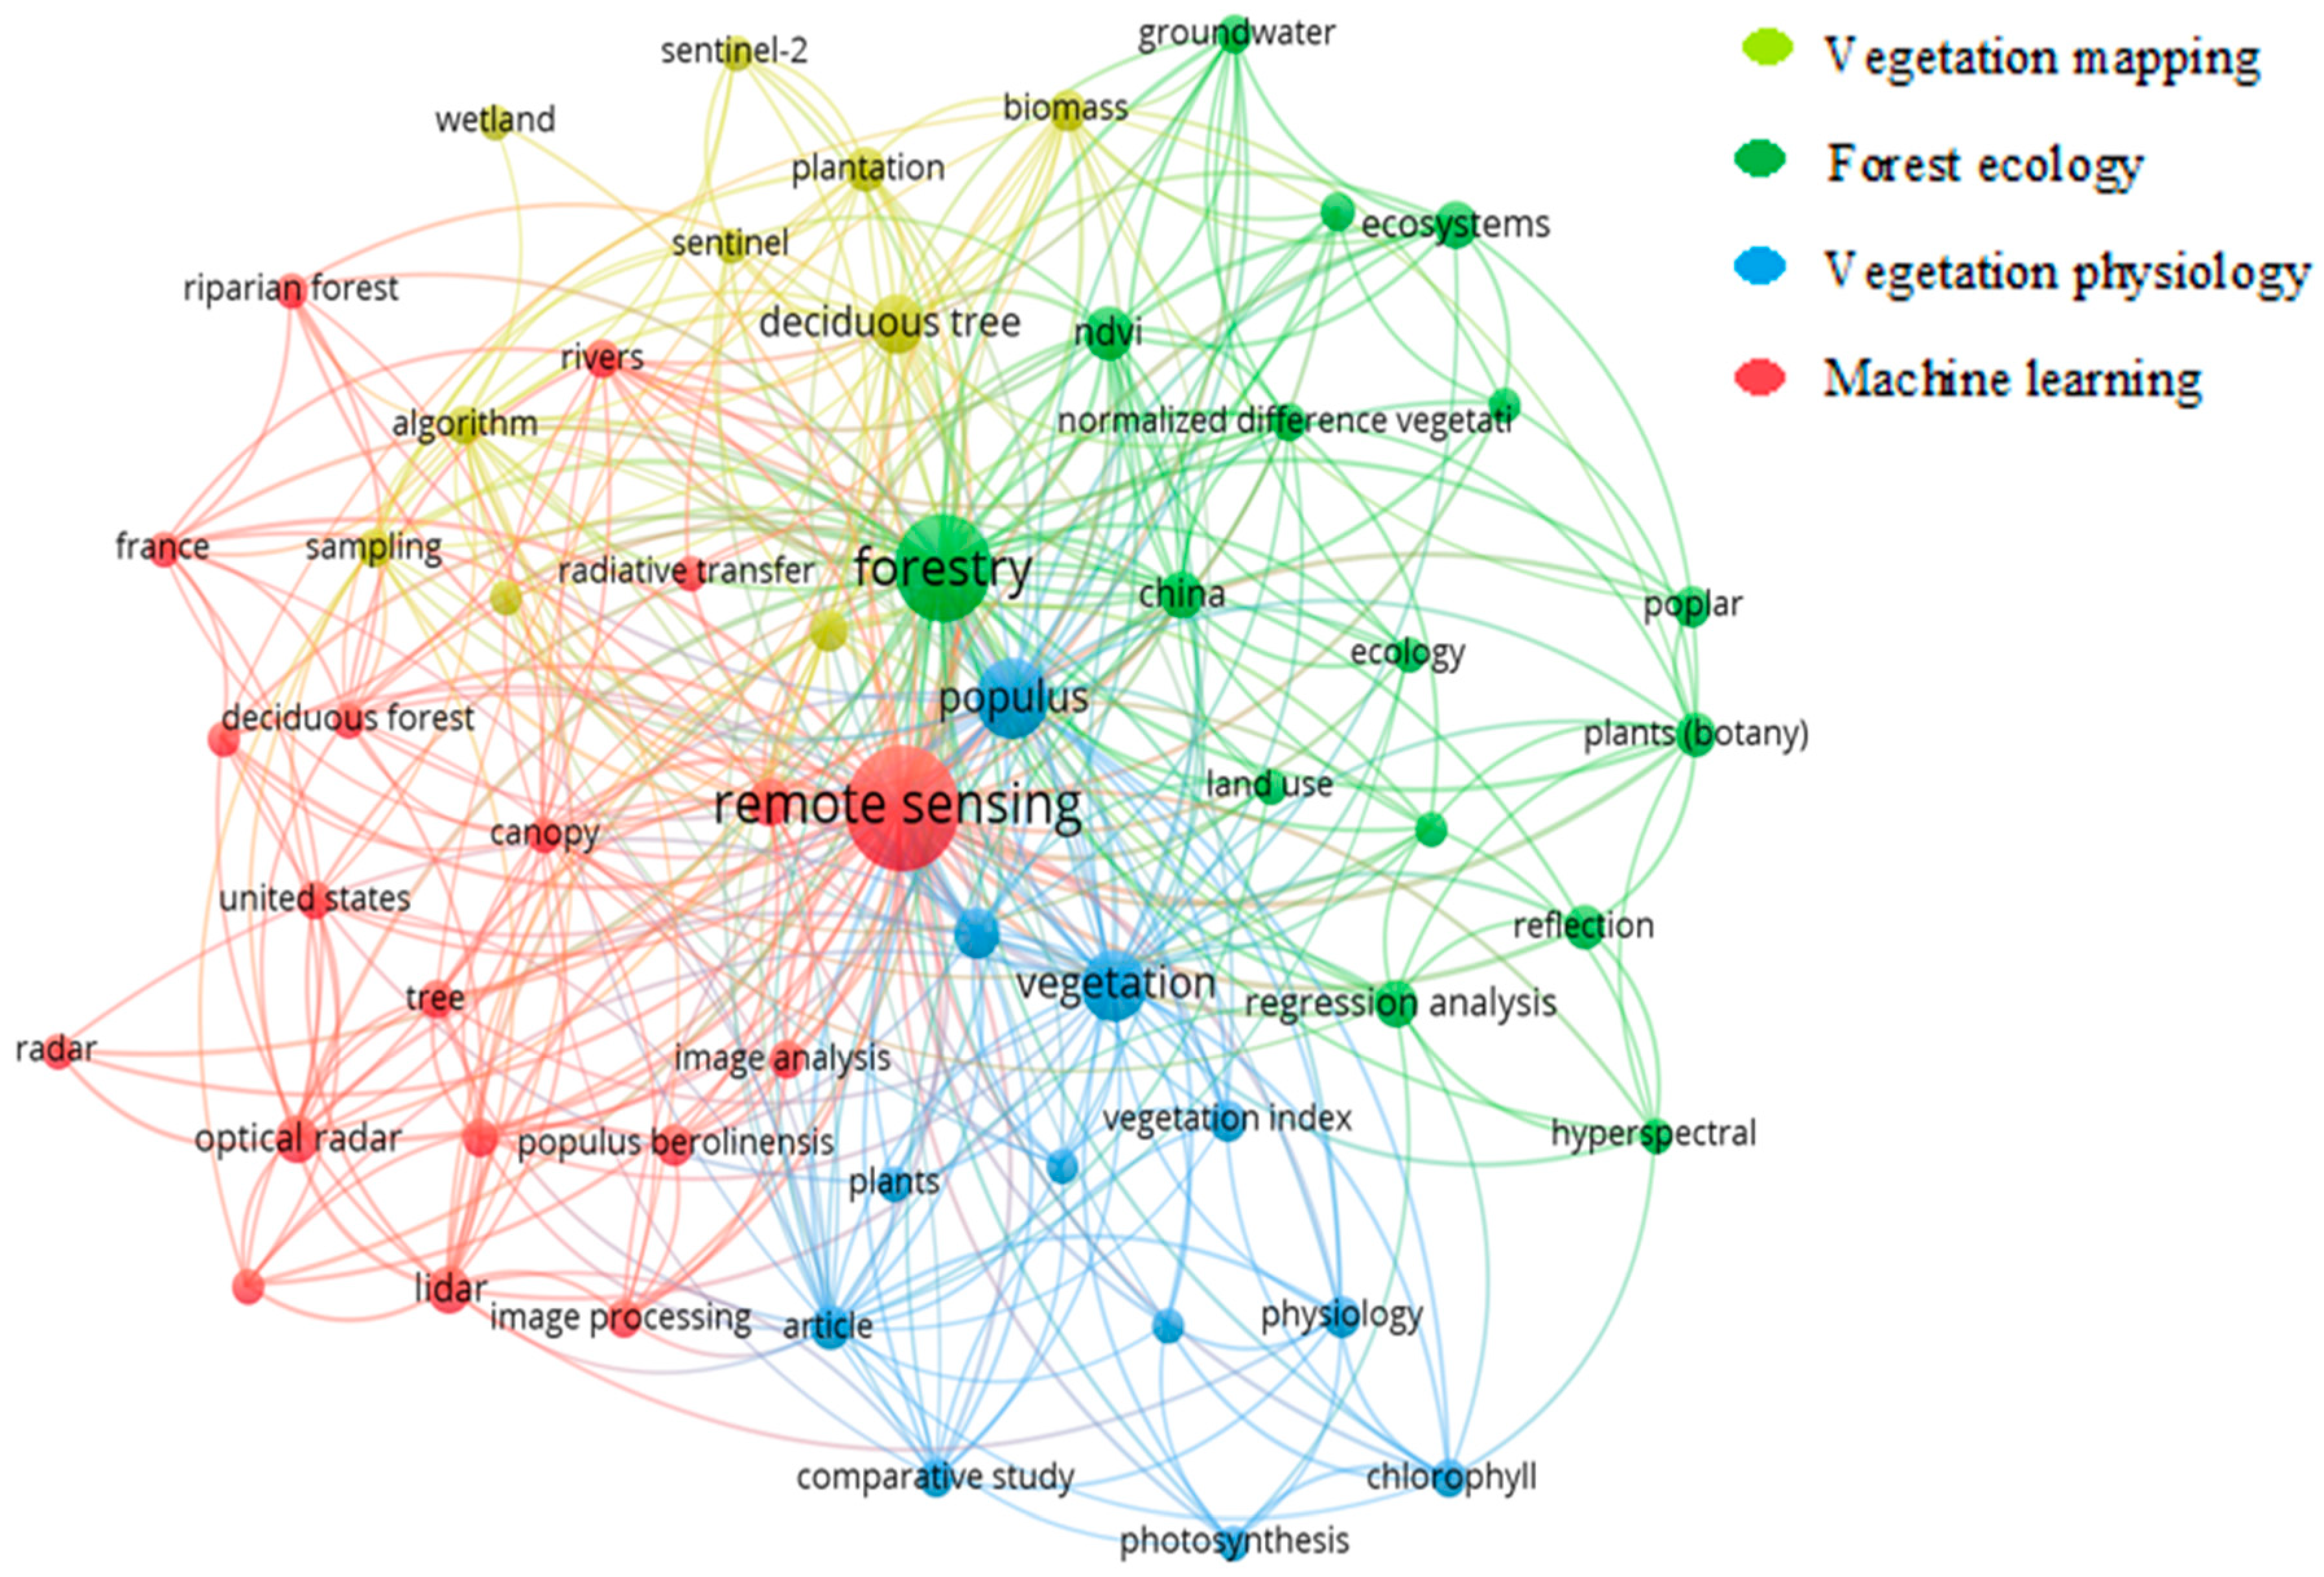
From the 148 published journal articles reviewed/synthesized in this study, four main research areas were discovered that produced poplar studies, and these included forest ecology (green), vegetation mapping (yellow-green), machine learning (ML) (red), and vegetation physiology (blue). All of these research areas are interlinked. Mapping the frequency of common occurrences in the title/abstract fields of remote sensing application documents in the poplar literature with a minimum occurrence of five yielded 57 items distributed in four clusters representing four main research themes (Figure 6). The first cluster (green) focused on forest ecology and included the following elements: forestry, hyperspectral, regression, reflection, mean square error, land use, ecology, plants (botany), poplar, China, normalized difference vegetation, NDVI, ecosystem, groundwater, and crops. The second cluster (yellowish-green) focused on vegetation mapping and included the following items: Sentinel-2, biomass, plantation, sentinel, wetland, deciduous tree, algorithm, sampling, image classification, and satellite data. The third cluster (red) focused on remote sensing techniques and included the following elements: riparian forest, rivers, France, radiative transmission, canopy, remote sensing, deciduous tree, United States, tree, leaf area index, optical radar, image analysis, phenology, Liriodendra Tulipiferal, LiDAR, and image processing. The fourth cluster (blue) focused on the overall vegetation physiology studies and included the following items: populus, satellite imagery, vegetation, plants, articles, Populus deltoides, comparative study, photosynthesis, chlorophyll, and physiology.
Based on our results, all 148 poplar remote sensing studies were published in 70 different journals, with fifteen journals publishing three or more studies (International Geoscience and Remote Sensing Symposium (14), Remote Sensing of Environment (8), International Journal of Remote Sensing (7), Remote Sensing (7), Canadian Journal of Forest Research (5), IEEE Transactions on Geoscience and Remote Sensing (5), Proceedings of SPIE—The International Society for Optical Engineering (5), ISPRS Archives (4), the ISPRS Journal of Photogrammetry and Remote Sensing (4), the Journal of Geophysical Research: Atmospheres (4)), and the International Conference on Remote Sensing, Environment and Transportation Engineering; Annals of Silvicultural Research, Forest Ecology and Management; Forests; IForest; and IOP Conference Series: Earth and Environmental Science having published 3 articles each (Table 3). Table 3 presents only journals that published > 3 papers each.
4. Limitations and Future Research
Our review revealed the trends in the application of different remote sensing products in mapping, monitoring, and detecting poplar trees in different locations. Poplars occupy a more significant area in agriculture and natural forest areas. While remote sensing techniques have proven effective in delineating and extracting poplar tree features in both landscapes using LiDAR sensors, there are limitations related to spatial coverage. The combination of high-spatial-resolution sensors such as LiDAR and multispectral satellite sensors covering larger regions proved to be an excellent alternative to offset the mentioned limitations. The integration of these images will continue the improvements in the time-series mapping and monitoring needed to regularly update forest inventories. Good performance was also achieved by combining multitemporal and high-spectral sensors such as Sentinel 2 and machine (random forests) and deep learning techniques (connected neural network). Because of the robustness that results from combining these remote sensing techniques, researchers strongly advise using the latter in subsequent research.
In addition, the creation and application of poplar-specific indices such as the poplar tree index (PTI) proved to be more effective than the general vegetation index (NDVI) in mapping poplar plantations. Therefore, creating landscape-specific poplar indices and combining them with multitemporal and high-resolution imagery would improve the phenological analysis of poplars. While many multitemporal, multispectral, and high-resolution remote sensing images are now freely available on many platforms (e.g., GEE, USGS, Copernicus, etc.), other important remote sensing datasets that are suitable for mapping poplar trees have high costs, making their use limited in resource-constrained countries. Collaboration between researchers from developed countries—where resources are abundant—and researchers from developing countries is therefore thought to be advantageous. This is because it would allow for the sharing of resources and insights, raising the bar for remote sensing applications in poplars around the world.
A notable constraint of this research is that it just examined and synthesized peer-reviewed publications; it did not include papers like technical reports, theses, dissertations, conservation management plans, etc. While a thorough study of the materials that were excluded based on our process is advised, we also implore the scientific community to make sure that the documents in question are from reliable sources and have undergone a thorough review process before being published.
5. Conclusions and Recommendations
We have provided an overview of peer-reviewed poplar studies using remote sensing approaches. Our results show an increase in the number of poplar remote sensing studies from 1991 to 2022, with a total of 148 during that period. Most studies used airborne sensors, particularly LiDAR, satellites (mostly using Landsat and Sentine-2), and ground-based sensors. Over two thirds of the publications were widespread in the Global North, including China, where poplars were predominantly considered native rather than an invasive species. Poplar species have been studied primarily in agriculture, forestry, mountains, and urban environments. Commonly studied biophysical indicators used in the reviewed studies were crown diameter, poplar growth/height and volume, canopy cover, and poplar biomass. Spectral-based analysis included machine learning classifiers such as RF, SVM, and others. We therefore conclude that remote sensing products are becoming an essential data source for understanding poplar species dynamics, as they provide more consistent and low-cost information than traditional approaches. As high-resolution satellite data become accessible through various partnerships (e.g., PlanetScope with Google Earth Engine) and deep learning algorithms continue to evolve, the remote sensing of poplars is expected to incorporate these resources in the future. This may benefit countries that have been less studied, including those in Africa, where poplars occur.
This information should encourage cooperative research interests between developed and developing countries and provide land managers and conservationists with an opportunity to learn which remote sensing techniques work best when researching poplar in various regions. We hope that more countries will be inspired to consider funding such projects, particularly in cases where poplar is considered an alien invasive species that invades delicate landscapes like riparian zones, as countries that published a higher number of peer-reviewed articles were the ones that received funding.
Author Contributions
Conceptualization, M.J.M., S.X. and M.G.; methodology, M.J.M. and S.X.; software, M.J.M. and S.X.; validation, M.J.M., S.X. and M.G.; formal analysis, M.J.M. and S.X.; investigation, M.J.M., S.X. and M.G.; resources, M.J.M. and S.X.; data curation, M.J.M.; writing—original draft preparation, M.J.M., S.X. and M.G.; writing—review and editing, M.J.M., S.X. and M.G.; visualization, M.J.M., S.X. and M.G.; supervision, S.X. and M.G.; project administration, M.J.M., S.X. and M.G. All authors have read and agreed to the published version of the manuscript.
Funding
This research received no external funding.
Data Availability Statement
The data used to support the findings of this study are available from the corresponding author upon request.
Conflicts of Interest
The authors declare no conflict of interest.
References
- Khayatinejad Aqgonbad, S.; Hossein Zadeh, O.; Hajjarian, M.; Abdi, M.R. Impact of Key Stakeholders’ Participation in Strategic Decision-Making Regarding Poplar Tree Farming Development. Small-Scale For. 2022, 21, 229–247. [Google Scholar] [CrossRef]
- Zhang, Y.; Thenkabail, P.S.; Wang, P. A Bibliometric Profile of the Remote Sensing Open Access Journal Published by MDPI between 2009 and 2018. Remote Sens. 2019, 11, 91. [Google Scholar] [CrossRef]
- Kota, N.L.; Landenberger, R.E.; McGraw, J.B. Germination and early growth of Ailanthus and tulip poplar in three levels of forest disturbance. Biol. Invasions 2007, 9, 197–211. [Google Scholar] [CrossRef]
- Sikorska, D.; Sikorski, P.; Archiciński, P.; Chormański, J.; Hopkins, R.J. You Can’t See the Woods for the Trees: Invasive Acer negundo L. in Urban Riparian Forests Harms Biodiversity and Limits Recreation Activity. Sustainability 2019, 11, 5838. [Google Scholar] [CrossRef]
- Richardson, D.M.; Rejmánek, M. Trees and shrubs as invasive alien species—A global review. Divers. Distrib. 2011, 17, 788–809. [Google Scholar] [CrossRef]
- González-Moreno, P.; Pino, J.; Carreras, D.; Basnou, C.; Fernández-Rebollar, I.; Vilà, M. Quantifying the landscape influence on plant invasions in Mediterranean coastal habitats. Landsc. Ecol. 2013, 28, 891–903. [Google Scholar] [CrossRef]
- Caudullo, G.; De Rigo, D. Ulmus-Elms in Europe: Distribution, Habitat, Usage and Threats. European Atlas of Forest Tree Species. 2016. Available online: https://www.researchgate.net/profile/Giovanni-Caudullo/publication/299472225_Ulmus_-_elms_in_Europe_distribution_habitat_usage_and_threats/links/61ee6a58c5e3103375b83367/Ulmus-elms-in-Europe-distribution-habitat-usage-and-threats.pdf (accessed on 27 November 2022).
- Danise, T.; Innangi, M.; Curcio, E.; Piccolella, S.; Fioretto, A.; Pacifico, S. White poplar (Populus alba L.) leaf waste recovery and intercropping outcome on its polyphenols. Ind. Crops Prod. 2021, 171, 113866. [Google Scholar] [CrossRef]
- Henderson, L. Invasive, naturalized and casual alien plants in southern Africa: A summary based on the Southern African Plant Invaders Atlas (SAPIA). Bothalia 2007, 37, 215–248. [Google Scholar] [CrossRef]
- Stettler, R.F. Cottonwood and the River of Time: On Trees, Evolution, and Society; University of Washington Press: Washington, DC, USA, 2011. [Google Scholar]
- Lechner, A.M.; Foody, G.M.; Boyd, D.S. Applications in remote sensing to forest ecology and management. One Earth 2020, 2, 405–412. [Google Scholar] [CrossRef]
- Szuster, B.W.; Chen, Q.; Borger, M. A comparison of classification techniques to support land cover and land use analysis in tropical coastal zones. Appl. Geogr. 2011, 31, 525–532. [Google Scholar] [CrossRef]
- Turner, W.; Spector, S.; Gardiner, N.; Fladeland, M.; Sterling, E.; Steininger, M. Remote sensing for biodiversity science and conservation. Trends Ecol. Evol. 2003, 18, 306–314. [Google Scholar] [CrossRef]
- Tonbul, H.; Colkesen, I.; Kavzoglu, T. Classification of poplar trees with object-based ensemble learning algorithms using Sentinel-2A imagery. J. Geod. Sci. 2020, 10, 14–22. [Google Scholar] [CrossRef]
- Eslami, A.; Zahedi, S.S. Providing poplar plantation map by Indian remote sensing (IRS) satellite imagery in Northern Iran. Afr. J. Agric. Res. 2011, 6, 4769–4774. [Google Scholar] [CrossRef]
- Hamrouni, Y.; Paillassa, E.; Chéret, V.; Monteil, C.; Sheeren, D. From local to global: A transfer learning-based approach for mapping poplar plantations at national scale using Sentinel-2. ISPRS J. Photogramm. Remote Sens. 2021, 171, 76–100. [Google Scholar] [CrossRef]
- D’Amico, G.; Francini, S.; Giannetti, F.; Vangi, E.; Travaglini, D.; Chianucci, F.; Mattioli, W.; Grotti, M.; Puletti, N.; Corona, P.; et al. A deep learning approach for automatic mapping of poplar plantations using Sentinel-2 imagery. GISci. Remote Sens. 2021, 58, 1352–1368. [Google Scholar] [CrossRef]
- Laslier, M.; Hubert-Moy, L.; Dufour, S. Mapping Riparian Vegetation Functions Using 3D Bispectral LiDAR Data. Water 2019, 11, 483. [Google Scholar] [CrossRef]
- Moher, D.; Shamseer, L.; Clarke, M.; Ghersi, D.; Liberati, A.; Petticrew, M.; Shekelle, P.; Stewart, L.A.; PRISMA—P Group. Preferred reporting items for systematic review and meta-analysis protocols (PRISMA-P) 2015 statement. Syst. Rev. 2015, 4, 1. [Google Scholar] [CrossRef]
- Javanmardi, E.; Liu, S.; Xie, N. Exploring Grey Systems Theory-Based Methods and Applications in Sustainability Studies: A Systematic Review Approach. Sustainability 2020, 12, 4437. [Google Scholar] [CrossRef]
- Van Eck, N.J.; Waltman, L. Software survey: VOSviewer, a computer program for bibliometric mapping. Scientometrics 2010, 84, 523–538. [Google Scholar] [CrossRef] [PubMed]
- R Core Team. R: A Language and Environment for Statistical Computing. 2010. Available online: https://cir.nii.ac.jp/crid/1370294721063650048 (accessed on 19 April 2022).
- Man, Q.; Dong, P.; Yang, X.; Wu, Q.; Han, R. Automatic Extraction of Grasses and Individual Trees in Urban Areas Based on Airborne Hyperspectral and LiDAR Data. Remote Sens. 2020, 12, 2725. [Google Scholar] [CrossRef]
- Chen, L.; Ren, C.; Zhang, B.; Wang, Z.; Liu, M.; Man, W.; Liu, J. Improved estimation of forest stand volume by the integration of GEDI LiDAR data and multi-sensor imagery in the Changbai Mountains Mixed forests Ecoregion (CMMFE), northeast China. Int. J. Appl. Earth Obs. Geoinf. 2021, 100, 102326. [Google Scholar] [CrossRef]
- Xu, D.; Wang, H.; Xu, W.; Luan, Z.; Xu, X. LiDAR Applications to Estimate Forest Biomass at Individual Tree Scale: Opportunities, Challenges and Future Perspectives. Forests 2021, 12, 550. [Google Scholar] [CrossRef]
- Wang, K.; Wang, T.; Liu, X. A Review: Individual Tree Species Classification Using Integrated Airborne LiDAR and Optical Imagery with a Focus on the Urban Environment. Forests 2018, 10, 1. [Google Scholar] [CrossRef]
- Marrs, J.; Ni-Meister, W. Machine Learning Techniques for Tree Species Classification Using Co-Registered LiDAR and Hyperspectral Data. Remote Sens. 2019, 11, 819. [Google Scholar] [CrossRef]
- Khorrami, R.A.; Naeimi, Z.; Wing, M.; Ahani, H.; Bateni, S.M. A new multistep approach to identify leaf-off poplar plantations using airborne imagery. J. Geogr. Inf. Syst. 2022, 14, 634–651. [Google Scholar] [CrossRef]
- Lu, S.; Lu, X.; Zhao, W.; Liu, Y.; Wang, Z.; Omasa, K. Comparing vegetation indices for remote chlorophyll measurement of white poplar and Chinese elm leaves with different adaxial and abaxial surfaces. J. Exp. Bot. 2015, 66, 5625–5637. [Google Scholar] [CrossRef] [PubMed]
- Pirotti, F. Assessing a Template Matching Approach for Tree Height and Position Extraction from Lidar-Derived Canopy Height Models of Pinus Pinaster Stands. Forests 2010, 1, 194–208. [Google Scholar] [CrossRef]
- Duncanson, L.I.; Dubayah, R.O.; Cook, B.D.; Rosette, J.; Parker, G. The importance of spatial detail: Assessing the utility of individual crown information and scaling approaches for lidar-based biomass density estimation. Remote Sens. Environ. 2015, 168, 102–112. [Google Scholar] [CrossRef]
- Cao, L.; Liu, H.; Fu, X.; Zhang, Z.; Shen, X.; Ruan, H. Comparison of UAV LiDAR and Digital Aerial Photogrammetry Point Clouds for Estimating Forest Structural Attributes in Subtropical Planted Forests. Forests 2019, 10, 145. [Google Scholar] [CrossRef]
- Gao, L.; Zhang, X. Above-Ground Biomass Estimation of Plantation with Complex Forest Stand Structure Using Multiple Features from Airborne Laser Scanning Point Cloud Data. Forests 2021, 12, 1713. [Google Scholar] [CrossRef]
- Lin, W.; Lu, Y.; Li, G.; Jiang, X.; Lu, D. A comparative analysis of modeling approaches and canopy height-based data sources for mapping forest growing stock volume in a northern subtropical ecosystem of China. GISci. Remote Sens. 2022, 59, 568–589. [Google Scholar] [CrossRef]
- Leite, R.V.; Silva, C.A.; Mohan, M.; Cardil, A.; Almeida, D.R.A.; Carvalho, S.P.C.; Jaafar, W.S.W.M.; Guerra-Hernández, J.; Weiskittel, A.; Klauberg, C.; et al. Individual Tree Attribute Estimation and Uniformity Assessment in Fast-Growing Eucalyptus spp. Forest Plantations Using Lidar and Linear Mixed-Effects Models. Remote Sens. 2020, 12, 3599. [Google Scholar] [CrossRef]
- Capolupo, A.; Nasta, P.; Palladino, M.; Cervelli, E.; Boccia, L.; Romano, N. Assessing the ability of hybrid poplar for in-situ phytoextraction of cadmium by using UAV-photogrammetry and 3D flow simulator. Int. J. Remote Sens. 2018, 39, 5175–5194. [Google Scholar] [CrossRef]
- Huang, C.Y.; Asner, G.P. Applications of remote sensing to alien invasive plant studies. Sensors 2009, 9, 4869–4889. [Google Scholar] [CrossRef] [PubMed]
- Colombo, R.; Meroni, M.; Marchesi, A.; Busetto, L.; Rossini, M.; Giardino, C.; Panigada, C. Estimation of leaf and canopy water content in poplar plantations by means of hyperspectral indices and inverse modeling. Remote Sens. Environ. 2008, 112, 1820–1834. [Google Scholar] [CrossRef]
- Barnes, M.L.; Breshears, D.D.; Law, D.J.; van Leeuwen, W.J.D.; Monson, R.K.; Fojtik, A.C.; Barron-Gafford, G.A.; Moore, D.J.P. Beyond greenness: Detecting temporal changes in photosynthetic capacity with hyperspectral reflectance data. PLoS ONE 2017, 12, e0189539. [Google Scholar] [CrossRef]
- Huang, T.; Ding, X.; Zhu, X.; Chen, S.; Chen, M.; Jia, X.; Lai, F.; Zhang, X. Assessment of Poplar Looper (Apocheima cinerarius Erschoff) Infestation on Euphrates (Populus euphratica) Using Time-Series MODIS NDVI Data Based on the Wavelet Transform and Discriminant Analysis. Remote Sens. 2021, 13, 2345. [Google Scholar] [CrossRef]
- Colkesen, I.; Kavzoglu, T.; Tonbul, H.; Ozturk, M.Y.; Yilmaz, E.O. Poplar Tree Index (PTI): A New Vegetation Index for Monitoring Poplar Cultivated Areas. In Proceedings of the IGARSS 2022—2022 IEEE International Geoscience and Remote Sensing Symposium, Kuala Lumpur, Malaysia, 17–22 July 2022; pp. 5567–5570. [Google Scholar]
- Maleki, M.; Arriga, N.; Barrios, J.M.; Wieneke, S.; Liu, Q.; Peñuelas, J.; Janssens, I.A.; Balzarolo, M. Estimation of Gross Primary Productivity (GPP) Phenology of a Short-Rotation Plantation Using Remotely Sensed Indices Derived from Sentinel-2 Images. Remote Sens. 2020, 12, 2104. [Google Scholar] [CrossRef]
- Chianucci, F.; Puletti, N.; Grotti, M.; Ferrara, C.; Giorcelli, A.; Coaloa, D.; Tattoni, C. Nondestructive Tree Stem and Crown Volume Allometry in Hybrid Poplar Plantations Derived from Terrestrial Laser Scanning. For. Sci. 2020, 66, 737–746. [Google Scholar] [CrossRef]
- Bonan, G. Importance of leaf area index and forest type when estimating photosynthesis in boreal forests. Remote Sens. Environ. 1993, 43, 303–314. [Google Scholar] [CrossRef]
- Zande, D.V.; Jonckheere, I.; Stuckens, J.; Verstraeten, W.W.; Coppin, P. Sampling design of ground-based lidar measurements of forest canopy structure and its effect on shadowing. Can. J. Remote Sens. 2008, 34, 526–538. [Google Scholar] [CrossRef]
- Santi, E.; Paloscia, S.; Pampaloni, P.; Pettinato, S. Ground-Based Microwave Investigations of Forest Plots in Italy. IEEE Trans. Geosci. Remote Sens. 2009, 47, 3016–3025. [Google Scholar] [CrossRef]
- Ko, C.; Sohn, G.; Remmel, T.K.; Miller, J.R. Maximizing the Diversity of Ensemble Random Forests for Tree Genera Classification Using High Density LiDAR Data. Remote Sens. 2016, 8, 646. [Google Scholar] [CrossRef]
- Moffiet, T.; Mengersen, K.; Witte, C.; King, R.; Denham, R. Airborne laser scanning: Exploratory data analysis indicates potential variables for classification of individual trees or forest stands according to species. ISPRS J. Photogramm. Remote Sens. 2005, 59, 289–309. [Google Scholar] [CrossRef]
- Warner, T.A.; McGraw, J.B.; Landenberger, R. Segmentation and classification of high resolution imagery for mapping individual species in a closed canopy, deciduous forest. Sci. China Technol. Sci. 2006, 49, 128–139. [Google Scholar] [CrossRef]
- Brandtberg, T. Classifying individual tree species under leaf-off and leaf-on conditions using airborne lidar. ISPRS J. Photogramm. Remote Sens. 2007, 61, 325–340. [Google Scholar] [CrossRef]
- Rupasinghe, P.A.; Chow-Fraser, P. Relating pre-fire canopy species, fire season, and proximity to surface waters to burn severity of boreal wildfires in Alberta, Canada. For. Ecol. Manag. 2021, 496, 119386. [Google Scholar] [CrossRef]
- Li, L.; Hao, D.; Li, X.; Chen, M.; Zhou, Y.; Jurgens, D.; Asrar, G.; Sapkota, A. Satellite-based phenology products and in-situ pollen dynamics: A comparative assessment. Environ. Res. 2022, 204, 111937. [Google Scholar] [CrossRef]
- Hall, R.J.; Davidson, D.P.; Peddle, D.R. Ground and remote estimation of leaf area index in Rocky Mountain forest stands, Kananaskis, Alberta. Can. J. Remote Sens. 2003, 29, 411–427. [Google Scholar] [CrossRef]
- Schweier, J.; Schnitzler, J.P.; Becker, G. Selected environmental impacts of the technical production of wood chips from poplar short rotation coppice on marginal land. Biomass Bioenergy 2016, 85, 235–242. [Google Scholar] [CrossRef]
- Hamrouni, Y.; Paillassa, E.; Chéret, V.; Monteil, C.; Sheeren, D. Sentinel-2 Poplar Index for Operational Mapping of Poplar Plantations over Large Areas. Remote Sens. 2022, 14, 3975. [Google Scholar] [CrossRef]
- Adagbasa, E.G.; Adelabu, S.A.; Okello, T.W. Application of deep learning with stratified K-fold for vegetation species discrimation in a protected mountainous region using Sentinel-2 image. Geocarto Int. 2022, 37, 142–162. [Google Scholar] [CrossRef]
- Adepoju, K.A.; Adelabu, S.A. Improving accuracy of Landsat-8 OLI classification using image composite and multisource data with Google Earth Engine. Remote Sens. Lett. 2020, 11, 107–116. [Google Scholar] [CrossRef]
- Cañete-Salinas, P.; Zamudio, F.; Yáñez, M.; Gajardo, J.; Valdés, H.; Espinosa, C.; Venegas, J.; Retamal, L.; Ortega-Farias, S.; Acevedo-Opazo, C. Evaluation of models to determine LAI on poplar stands using spectral indices from Sentinel-2 satellite images. Ecol. Modell. 2020, 428, 109058. [Google Scholar] [CrossRef]
- Simović, I.; Šikoparija, B.; Panić, M.; Radulović, M.; Lugonja, P. Remote Sensing of Poplar Phenophase and Leaf Miner Attack in Urban Forests. Remote Sens. 2022, 14, 6331. [Google Scholar] [CrossRef]
- Baird, R.A.; Verbyla, D.; Hollingsworth, T.N. Browning of the landscape of interior Alaska based on 1986–2009 Landsat sensor NDVI. Can. J. For. Res. 2012, 42, 1371–1382. [Google Scholar] [CrossRef]
- Mansfield, S.D.; Kang, K.Y.; Iliadis, L.; Tachos, S.; Avramidis, S. Predicting the strength of Populus spp. clones using artificial neural networks and ε-regression support vector machines (ε-rSVM). Holzforschung 2011, 65, 855–863. [Google Scholar] [CrossRef]
- Linhui, L.; Weipeng, J.; Huihui, W. Extracting the Forest Type From Remote Sensing Images by Random Forest. IEEE Sens. J. 2021, 21, 17447–17454. [Google Scholar] [CrossRef]
- Gao, W.; Zhou, L.; Liu, S.; Guan, Y.; Gao, H.; Hu, J. Machine learning algorithms for rapid estimation of holocellulose content of poplar clones based on Raman spectroscopy. Carbohydr. Polym. 2022, 292, 119635. [Google Scholar] [CrossRef]
- Adam, E.; Mutanga, O.; Odindi, J.; Abdel-Rahman, E.M. Land-use/cover classification in a heterogeneous coastal landscape using RapidEye imagery: Evaluating the performance of random forest and support vector machines classifiers. Int. J. Remote Sens. 2014, 35, 3440–3458. [Google Scholar] [CrossRef]
- Zhu, L.; Liu, X.; Wu, L.; Tang, Y.; Meng, Y. Long-Term Monitoring of Cropland Change near Dongting Lake, China, Using the LandTrendr Algorithm with Landsat Imagery. Remote Sens. 2019, 11, 1234. [Google Scholar] [CrossRef]
- Petráš, R.; Mecko, J.; Nociar, V. Diameter structure of the stands of poplar clones. J. Forensic Sci. 2010, 56, 165–170. [Google Scholar] [CrossRef]
- Ceylan, İ. Determination of Drying Characteristics of Timber by Using Artificial Neural Networks and Mathematical Models. Dry. Technol. 2008, 26, 1469–1476. [Google Scholar] [CrossRef]
- Franco-Lopez, H.; Ek, A.R.; Bauer, M.E. Estimation and mapping of forest stand density, volume, and cover type using the k-nearest neighbors method. Remote Sens. Environ. 2001, 77, 251–274. [Google Scholar] [CrossRef]
- Shafri, H.Z.M.; Suhaili, A.; Mansor, S. The performance of maximum likelihood, spectral angle mapper, neural network and decision tree classifiers in hyperspectral image analysis. J. Comput. Sci. 2007, 3, 419–423. [Google Scholar] [CrossRef]
Figure 1.
A flowchart of the literature search process based on PRISMA.

Figure 2.
Publication statistics in remote sensing of poplar species (1991–2022).
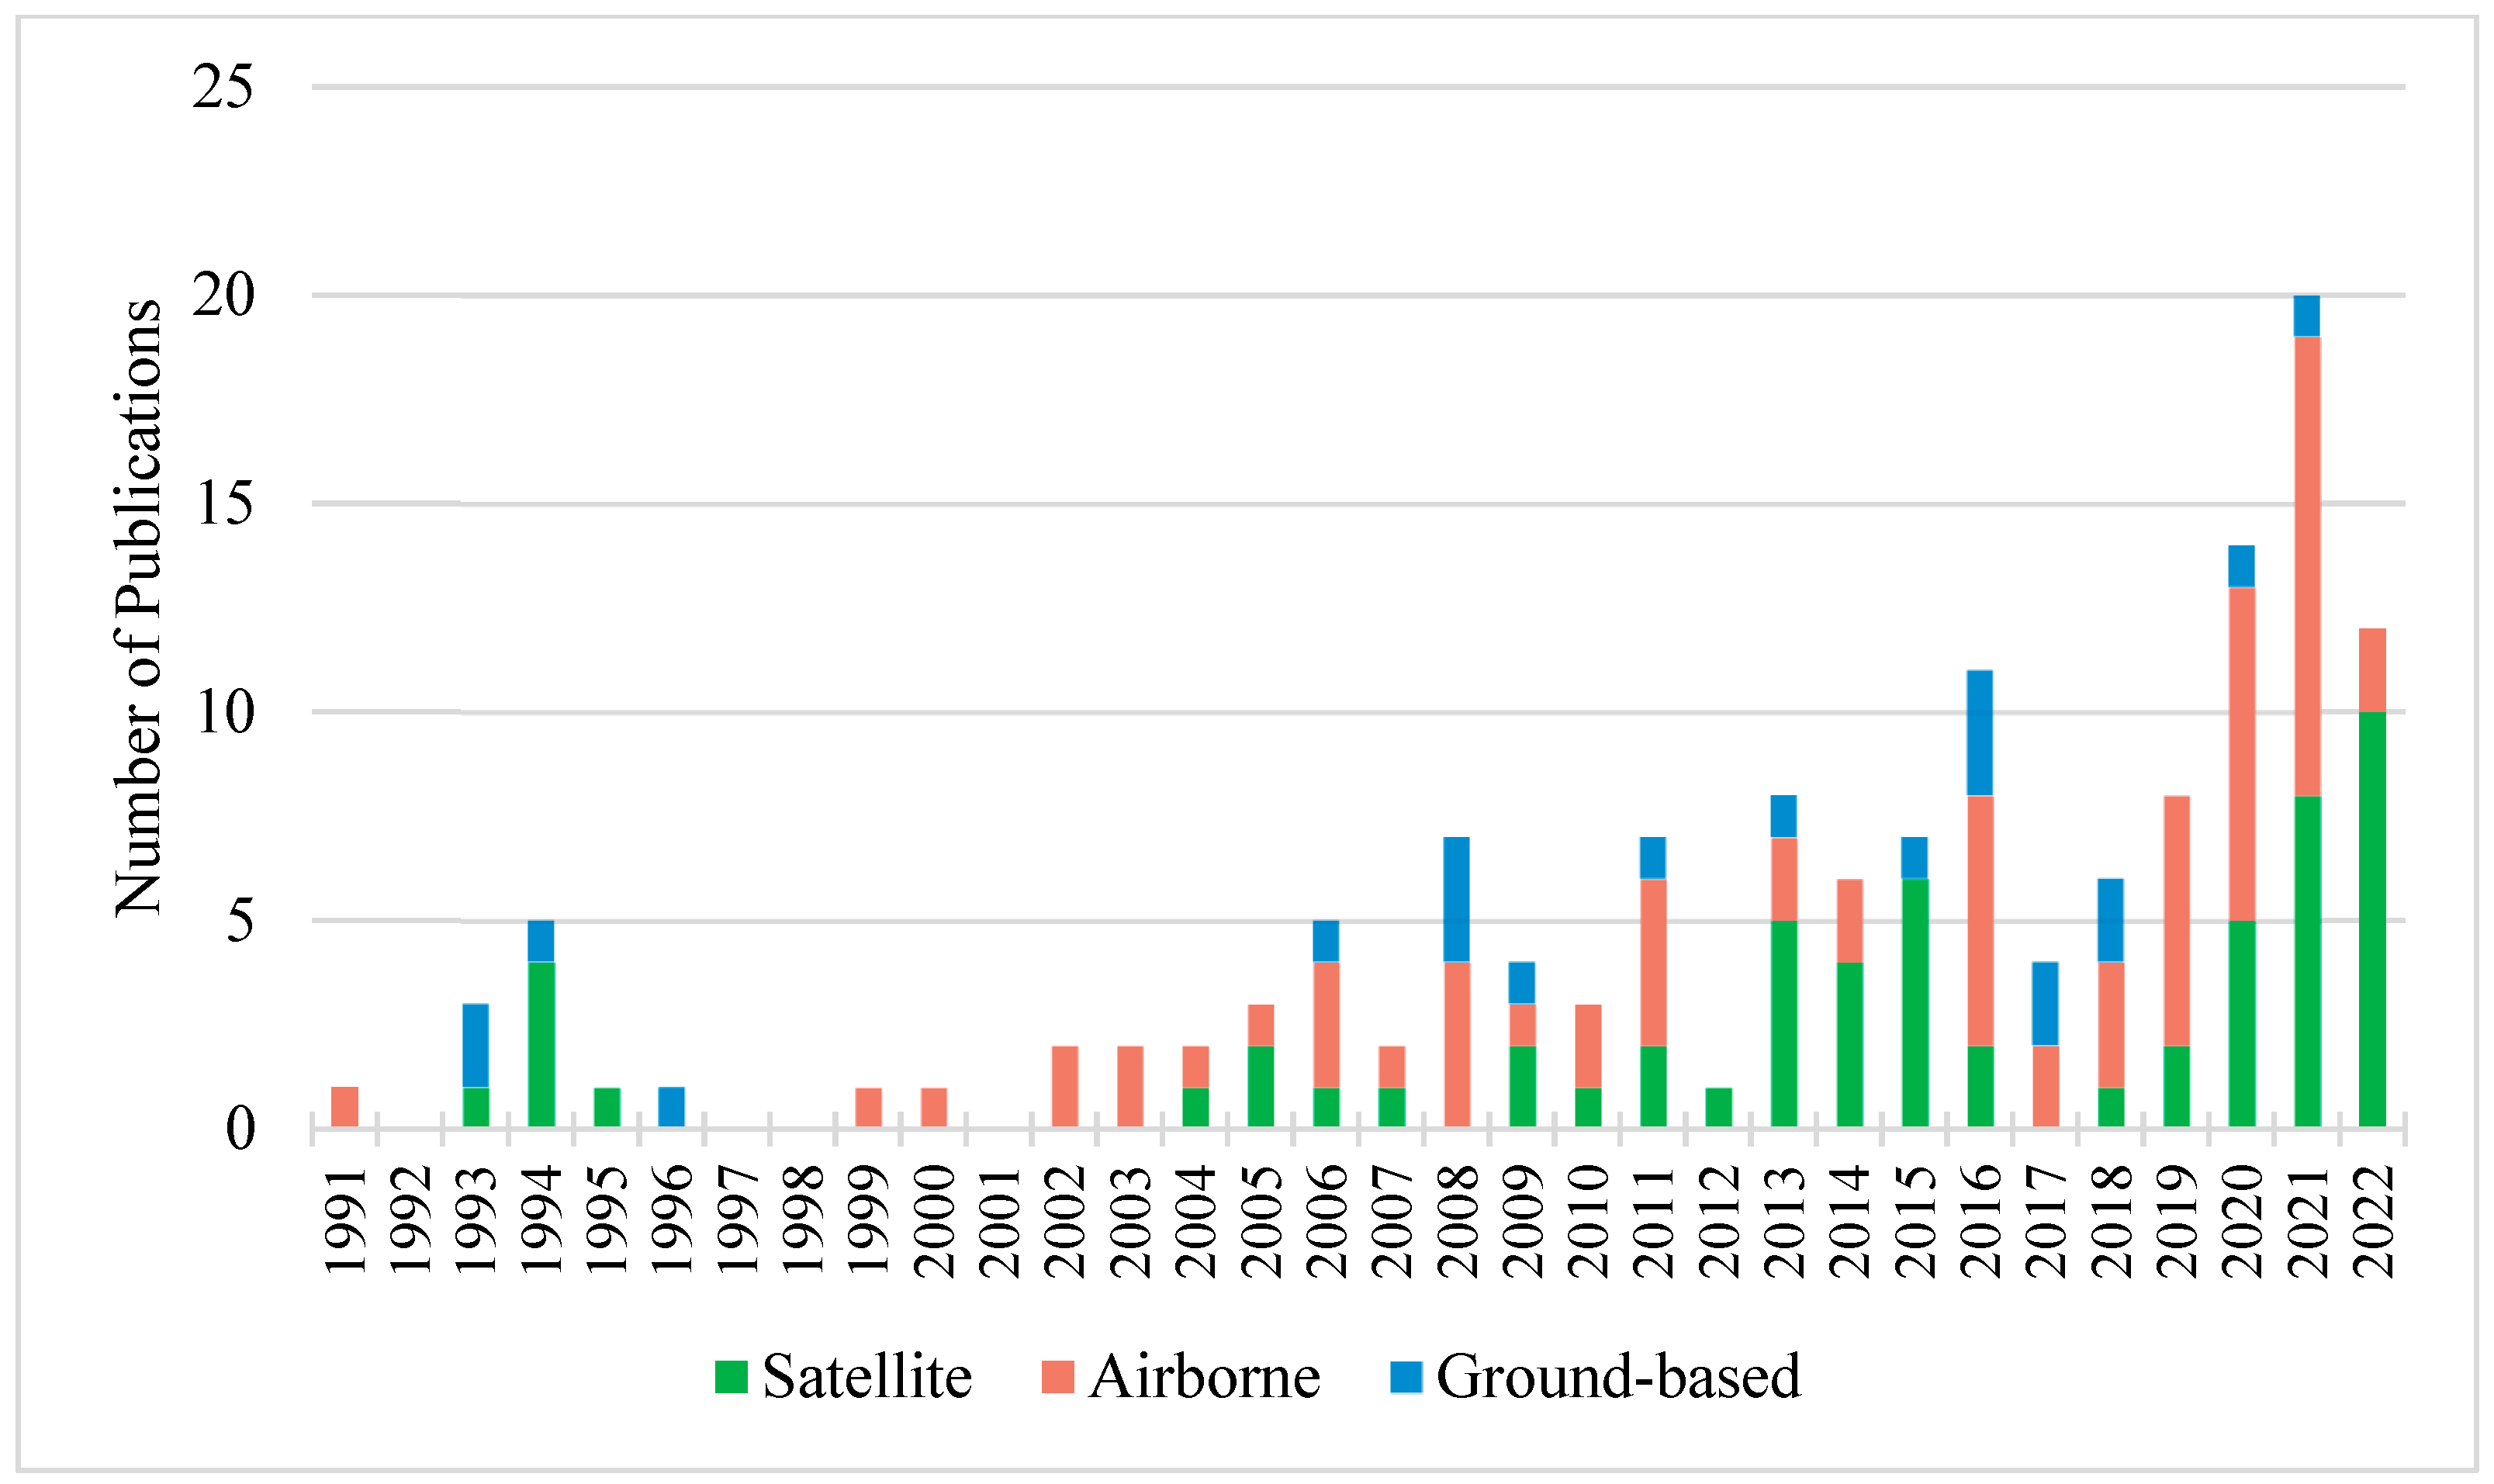
Figure 3.
Remote sensing sensors used in the study of poplar species per year between 1991 and 2022.
Figure 3.
Remote sensing sensors used in the study of poplar species per year between 1991 and 2022.

Figure 4.
Countries that participated in poplar studies and their number of publication output.
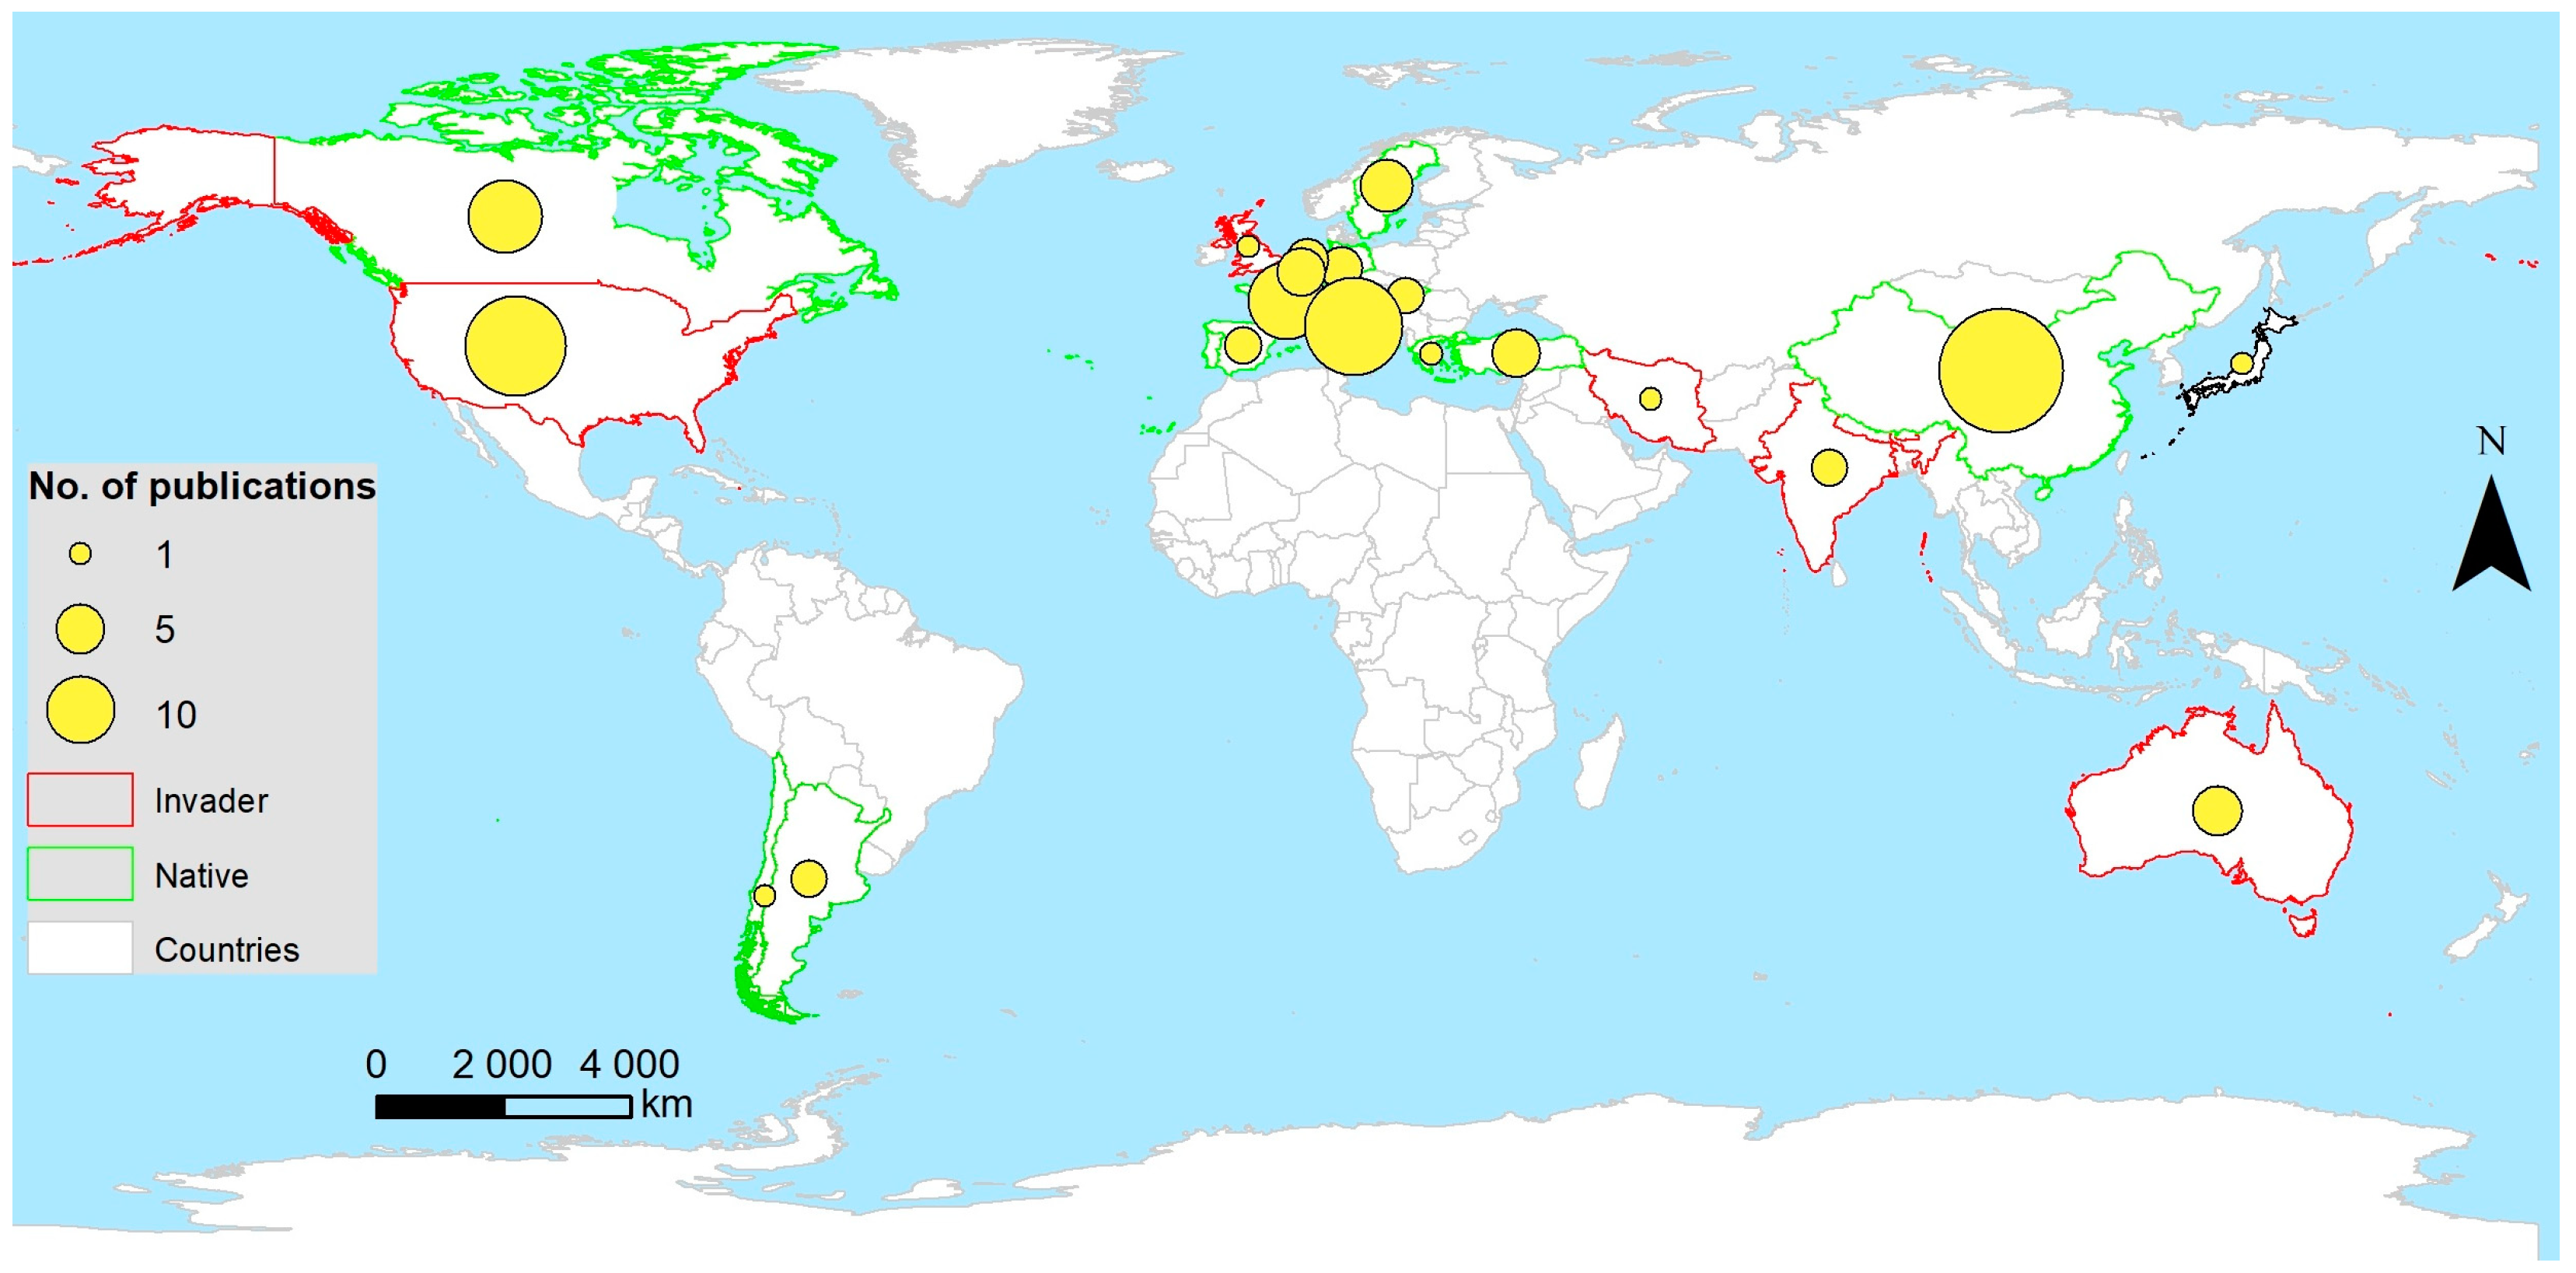
Figure 5.
Landscape categories where poplar studies were conducted.
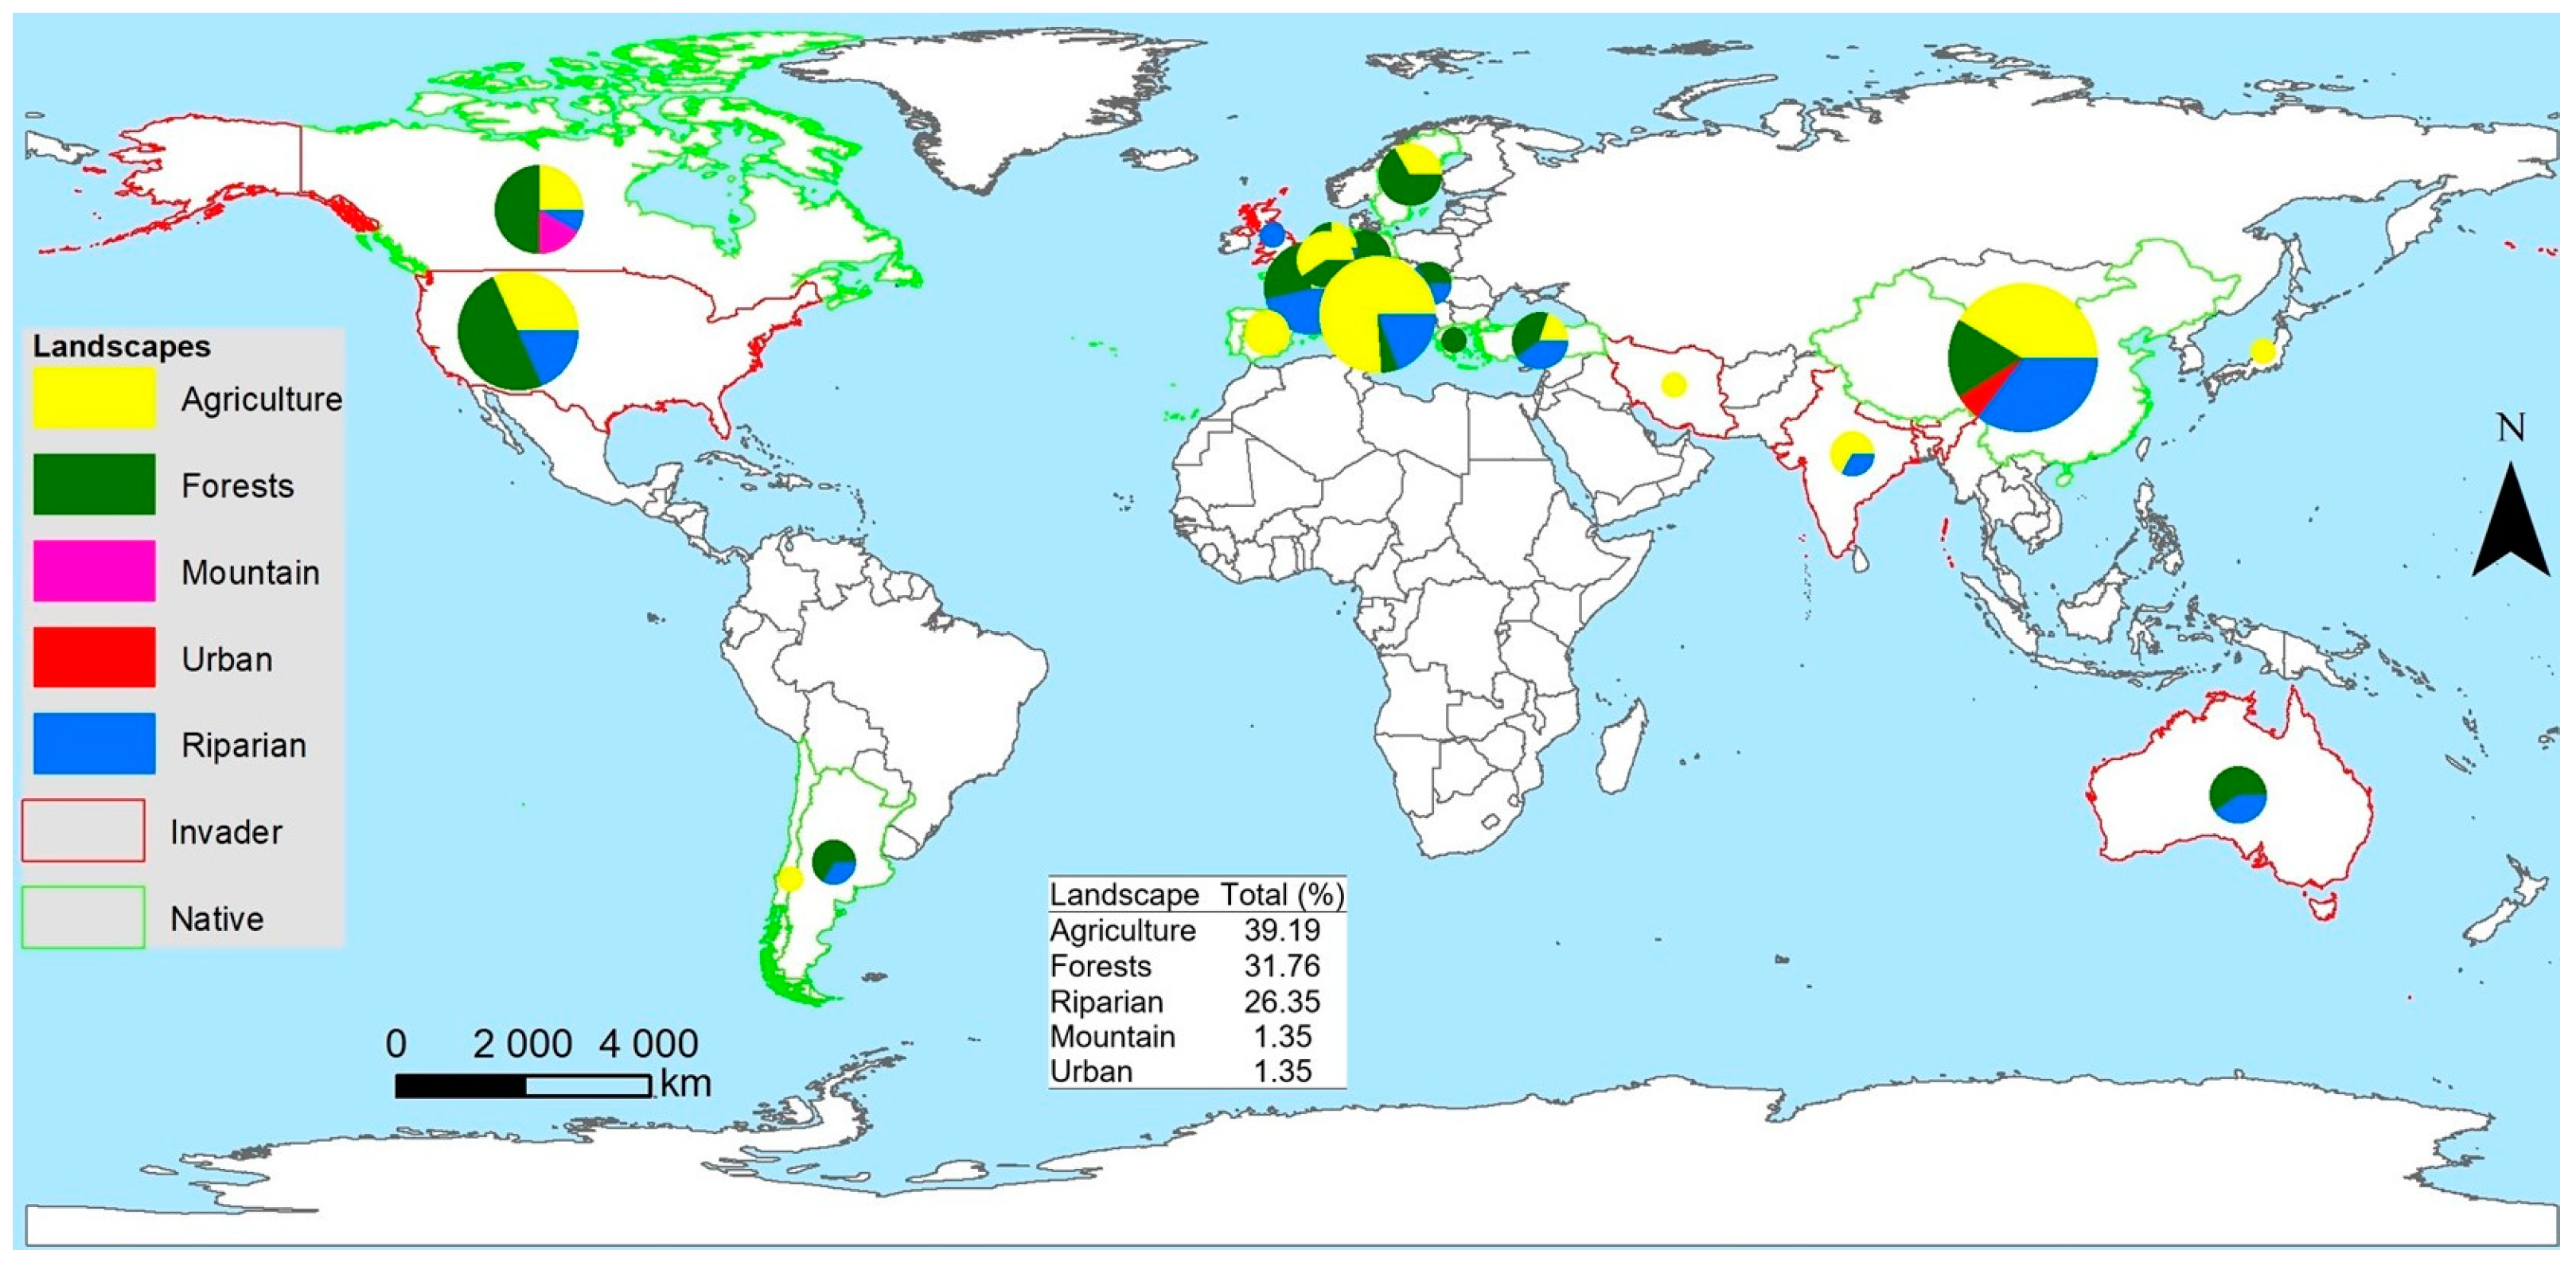
Figure 6.
The network visualization of terms in the title/abstract of publications in the remote sensing of poplar. Circle size represents the number of publications derived from the database. Circle colors represent: yellow is vegetation mapping; green is forest ecology; blue is vegetation physiology; and red is machine learning lines represent the link between titles and abstracts.

Table 1.
Inclusion and exclusion criteria for the review.
| Inclusion Criteria | Exclusion Criteria |
|---|---|
| Studies conducted on poplar species | Studies conducted without poplar species |
| Remote sensing-based data sources | Studies without the use of remote sensing data |
| Peer-reviewed published articles | Fugitive literature and review articles |
| Articles published in English | Articles not written in English |
Table 2.
Top 10 biophysical indicators (a), spectral indices (b), classifiers (c), and common software packages used in the reviewed studies.
Table 2.
Top 10 biophysical indicators (a), spectral indices (b), classifiers (c), and common software packages used in the reviewed studies.
| Biophysical Indicators | N | Spectral Indices | N |
| Canopy cover | 24 | Normalized difference vegetation index (NDVI) | 30 |
| Poplar growth | 20 | Leaf area index (LAI) | 22 |
| Poplar biomass | 18 | Diversity index | 15 |
| Poplar distribution | 15 | Soil-adjusted vegetation index (SAVI) | 7 |
| Poplar cover | 10 | Chlorophyll vegetation index (CVI) | 6 |
| Poplar volume | 8 | Normalized difference water index (NDWI) | 6 |
| Breast diameter | 7 | Difference normalized burn ratio index (dNBRI) | 5 |
| Crown cover | 7 | Green-red normalized difference vegetation index (GR-NDVI) | 5 |
| Crown diameter | 6 | Photochemical reflectance index (PRI) | 3 |
| Canopy structure | 5 | Stress susceptibility index (SSI) | 2 |
| Classifiers | N | Software | N |
| Random forest | 24 | MATLAB v 5.3.1, 6.0. 7.1, 7.9, 8, 9.2 and 9.6 (MathWorks, Natick, MA, USA) | 17 |
| Support vector machine | 15 | R studio v 2.7.1, 3.0.2, 3.5.0 and 4.1.0 (R Foundation for Statistical Computing, Vienna, Austria) | 14 |
| Maximum likelihood | 10 | Python v 3.3.3, 3.6.7, 3.5.8 and 3.10.9 (Altoros labs, Pleasanton, CA, USA) | 13 |
| Decision tree | 7 | ArcMap v 10.6.1 (ESRI, Redlands, CA, USA) | 9 |
| Classification and regression Tree | 6 | ENVI v 5.0 (NV5 Geospatial, Hollywood, FL, USA) | 9 |
| Object-based | 6 | LiDAR 360 v 4.0, 5.0 and 6.0 (Green valley International, Berkeley, CA, USA) | 8 |
| Neural network | 5 | ENVI v 5.0 and 5.1 (NV5 Geospatial, Hollywood, FL, USA) | 8 |
| k-nearest neighbor | 4 | ArcGIS 10.7 (ESRI, Redlands, CA, USA) | 7 |
| Density-based clustering | 3 | QGIS v 3.14, 3.18 and 3.30 (GeoApt LLC., Anchorage, AK, USA) | 7 |
| Rotation forest | 3 | SPSS v 22 and 25 (IBM Corp., Armonk, NY, USA) | 6 |
Table 3.
Journals where Popular studies were published and their funding agencies.
| Journals | Funder |
|---|---|
| International Geosciences and Remote sensing Symposium (14) | G (14) |
| Remote Sensing (8) | G (8) |
| Remote Sensing of the Environment (8) | G (8) |
| IEEE Transactions on Geoscience and Remote Sensing (7) | G (7) |
| International Journal of Remote Sensing (7) | G (7) |
| Proceedings of SPIE—the International Society for Optical Engineering (7) | G (7) |
| Canadian Journal of Remote Sensing (4) | G (3); G and P (1) |
| ISPRS Journal of Photogrammetry and Remote Sensing (4) | G (4) |
| International Archives of the Photogrammetry Remote Sensing and Spatial Information Science (4) | G (3); P (1) |
| Journal of Geophysical Research: Atmospheres (4) | G (3) and P (1) |
G = government and P = private.
Disclaimer/Publisher’s Note: The statements, opinions and data contained in all publications are solely those of the individual author(s) and contributor(s) and not of MDPI and/or the editor(s). MDPI and/or the editor(s) disclaim responsibility for any injury to people or property resulting from any ideas, methods, instructions or products referred to in the content. |
© 2023 by the authors. Licensee MDPI, Basel, Switzerland. This article is an open access article distributed under the terms and conditions of the Creative Commons Attribution (CC BY) license (https://creativecommons.org/licenses/by/4.0/).
Share and Cite
MDPI and ACS Style
Mapuru, M.J.; Xulu, S.; Gebreslasie, M. Remote Sensing Applications in Monitoring Poplars: A Review. Forests 2023, 14, 2301. https://doi.org/10.3390/f14122301
AMA Style
Mapuru MJ, Xulu S, Gebreslasie M. Remote Sensing Applications in Monitoring Poplars: A Review. Forests. 2023; 14(12):2301. https://doi.org/10.3390/f14122301
Chicago/Turabian StyleMapuru, Morena J., Sifiso Xulu, and Michael Gebreslasie. 2023. "Remote Sensing Applications in Monitoring Poplars: A Review" Forests 14, no. 12: 2301. https://doi.org/10.3390/f14122301
Note that from the first issue of 2016, this journal uses article numbers instead of page numbers. See further details here.