Article

Assessing the Potential of Urban Trees to Accumulate Potentially Toxic Elements: A Network Approach

Department of Ecology, Institute for Biological Research ‘Siniša Stanković’, National Institute of Republic of Serbia, University of Belgrade, Bulevar Despota Stefana 142, 11060 Belgrade, Serbia
*
Author to whom correspondence should be addressed.
Forests 2023, 14(11), 2116; https://doi.org/10.3390/f14112116
Submission received: 20 September 2023 / Revised: 13 October 2023 / Accepted: 20 October 2023 / Published: 24 October 2023
(This article belongs to the Special Issue The Response of Trees to Air Pollution in Urban Forests)

Abstract

:
In urbanized areas, mitigating the negative effects of pollutants from various anthropogenic sources is one of the most important issues in planning urban functioning and development. In this sense, urban vegetation plays one of the most important roles. The aim of this study was to investigate the performance of network analysis (NA) as a novel and potential method for determining different associations between potentially toxic elements (PTEs) in leaves of urban trees, their accumulation capacity and ecophysiological response to different types of pollution in urban environments. The results of NA showed that there is no association between elements in species that have lower or higher efficiency in uptake of PTEs, leading to the conclusion that the elements do not depend on mutual association but on accumulation itself. It was also found that there are differences in the content of photosynthetic pigments and carotenoids among the studied species, but these differences are not reflected in the values of the photosynthetic efficiency parameters. Overall, the studied species have good ecophysiological potential for growth and existence in the urban environment, despite the varying ability to accumulate elements and the different associations between them. This is the first study to investigate the interactions between PTEs in leaves of urban tree species using NA and provides a good basis for future research under different environmental conditions.

1. Introduction

According to the UN in 2020 [1,2], more than half of the world’s population became urban in 2007. Although cities occupy only 2% of the Earth’s surface, they are responsible for up to 75% of resource consumption at the global level [3,4,5,6,7], making cities the main drivers of global change. Precisely for this reason, cities represent specific environments whose stability is threatened by various anthropogenic pressures, mainly reflected in the pollution of air, water, soil and vegetation. In addition to significant environmental, social and economic changes, substantial changes are also occurring within and outside cities as they increase in size and complexity [2]. The main sources of pollution in such environments are combustion products from industry, traffic, urban heating plants, individual furnaces and construction activities but also improper storage of industrial and municipal waste [8,9,10,11]. In addition, the structural, topographical and infrastructural features of the city cause differences in air circulation and the way water drains, and often the absence of vegetation, which, together with the change in air quality, leads to the creation of a specific microclimate in cities. It is well known that trees and forests play a key role in mitigating global climate change, but it is important to keep in mind that urban forests cannot be compared to the contribution of natural forests, as they cover only a small portion of the global area [2]. However, vegetation in cities has an irreplaceable role in mitigating the negative impacts of climate and pollution on the urban environment [12], provided, of course, that it is managed appropriately in the sense that its welfare requires a deepening of knowledge about its structure and function in order to make decisions based on accurate knowledge [2,13]. Urban trees face many challenges in cities, reflected in a much warmer microclimate, high levels of air, water and soil pollution, the presence of particulate matter, artificial lighting, conflicts with surrounding infrastructure, paved and compacted soils, etc., all of which affect their ecophysiological properties. Despite all the challenges faced by urban trees, their utility and advantage for biomonitoring polluted environments is immeasurable because, as sessile and long-lived organisms, they reflect the collective impact of pollutants, and the availability of biological material and ease of identification and sampling allow research at larger spatial scales [2,11,14].
Exposure to potentially toxic elements (PTEs) from pollution, together with other stressors present in urban environments, affects numerous ecophysiological processes in plants, such as photosynthetic efficiency (Fv/Fm), photosynthetic pigment content (chlorophyll a (Chl a) and chlorophyll (Chl b) and total carotenoids (Tot carot)) and enzyme activity [15,16], so monitoring these parameters can provide useful information on the physiological condition of woody plants. Plants that exhibit tolerance to PTE pollution stress and stress from other environmental factors may contribute to environmental restoration by indirectly reducing the risk of exposure to pollutants [11].
In recent decades, many techniques and models have been developed and applied to analyze and quantify the impact of PTEs on the environment, especially in urban areas [17]. For example, receptor models that are very important in pollution prevention and control, such as positive matrix factorization (PMF), principal component analysis (PCA), absolute principal component score/multiple linear regression (APCS/MLR), edge analysis (UNMIX) and factor analysis with nonnegative constraints (FA-NNC), can be used in identifying and quantifying the sources of PTE distributions [18]. Geostatistical methods such as kriging, cokriging and inverse distance weighting are widely accepted in predicting the spatial distribution of PTEs [17], but with certain application limitations that are only partially clarified in the current literature [19]. Alternatively, recent machine learning algorithms (ML) such as boosted regression trees (BRT), random forest (RF) and support vector machine (SVM) have greatly improved the performance of spatial modeling, including PTE analysis, but also facilitated the understanding of the relationship and influence of different predictor variables [20]. On the other hand, network analysis (NA) is used as a relatively new methodological approach to analyze and explore the mathematical, statistical and structural properties of a set of items (nodes) and the connections between them [21], but currently, it is widely used by biologists, mathematicians and social scientists to study the interactions between different types of data [22,23,24]. Fundamentally, most existing statistical methods are limited in their ability to analyze complex and dynamic relationships between studied variables within a group or network, which is why NA is increasingly used in scientific research. For example, the study by Raiesi and Beheshti [25] found that NA can be successfully used as a practical and new tool in soil-quality assessment (SQI), especially in the formation or selection of a minimum data set (MDS) [26], but also in the function of efficient land use management [27] and in the interpretation of complex networks of SOC stands using soil, vegetation and topography data [28].
To our knowledge, this is the first study to examine the interactions between PTEs in leaves of urban tree species using NA. Therefore, to better understand PTEs in a complex urban environment, we conducted a study with the following objectives: (i) to determine the differences in accumulation capacity between urban tree species but also their ecophysiological response to different types of pollution in urban environments, and (ii) to answer the question of which tree species is most suitable for planting and restoring anthropogenically degraded habitats.

2. Materials and Methods

2.1. Study Area

The study area covers about 2250 km2 and is located in the central part of Serbia (Figure 1). It is characterized by a temperate continental climate with warm summers and cold, dry winters. Almost one-third of the total population of Serbia lives in these areas [29]. The average annual precipitation in this area ranges from 622.5 to 669.5 mm [30,31]. Detailed information about the climatic, geological and pedological properties of the study area were described in Pavlović et al. [29]. There are several important industrial centers in this area, four of which were selected as research sites. They are Pancevo, Smederevo, Obrenovac and Belgrade, and the main criteria for their selection was the various sources of pollution. Pancevo is known for its petrochemical industry, along with which an oil refinery was developed, as well as a nitrogen fertilizer factory, located in the immediate vicinity of the city center (approximately 5 km), and the national park garden, which was chosen as a sampling site. The Smederevo Ironworks, the main source of pollution, is 7 km away from the city center and the National Heroes Park, where the sampling was conducted. The largest thermal power plant in Serbia “Nikola Tesla A” (TENT A) with ash and slag dump sites is located in Obrenovac, the third industrial center selected as a sampling site, and is 4 km away from the City Park Trg dr Zoran Djindjic, the sampling site. Traffic was identified as the main source of pollution in the central area of Belgrade and also represents the only diffuse pollutant compared to all of the above. In Belgrade, samples were collected from two sampling sites, one located in close proximity to the dominant source of pollution (Pioneer Park) and the other further from the source of pollution (Topcider Park), located in a mixed oak forest (Quercetum farinetto cerris Rud.).

2.2. Sampling and Analysis

Plant material was sampled in three seasonal periods (June, August and October) in 2012, which was one of the driest and warmest years since the introduction of systematic measurements of climate parameters [32]. However, in order to obtain a comprehensive picture of the functioning of the selected woody species throughout the growing season, the mean values of all three seasonal periods were used for analysis and discussion. Considering that these tree species are highly represented in the tree rows and parks of the studied area, and also that they are frequently planted in urban areas throughout Europe, the following deciduous model species were selected for this study: Acer platanoides L., Acer pseudoplatanus L., Betula pendula Roth, Aesculus hippocastanum L., Tilia sp. L., Juglans regia L., Platanus acerifolia (Aiton) Willd. and a conifer species Pinus nigra Arnold, annual and biennial needles. Sampling followed standard procedures described in the scientific literature [14,33,34,35,36,37], and special attention was taken to select three individuals of approximately equal age from each species at all sampling sites. Samples of plant material from each species within the same sampling site were mixed to form a composite sample (30 g), resulting in 9 composite samples per park, i.e., 45 from the entire study area. The formation of a composite sample is a common practice in environmental science, aimed at reducing random sampling errors and ensuring heterogeneity of the material, since a single measurement can never provide a realistic picture of the area under study. Samples of the plant material were dried at room temperature for 10 days and then in a drying oven to a constant weight. The previously crushed plant tissue was ground in a mill with stainless blades (Polymix, Kinematica AG, Malters, Switzerland) and a sieve with a pore diameter of 2 mm.
The content of chemical elements (Al, B, Cd, Cr, Cu, Fe, Mn, Ni, Pb, Sr, Zn) in the plant material was determined according to the USEPA 3052 method [38]. Leaf samples (0.3 g) were digested in a microwave (CEM Mars 6) in iPrep 12 Teflon vessels using 9 mL of 65% HNO3 (Carlo Erba, Emmendingen, Germany) and 3 mL 30% H2O2 (Lachner, Neratovice, Czech Republic). The final extracts were filtered into 50 mL polyethylene volumetric flasks and then diluted to the mark with deionized water. Element concentrations were measured by inductively coupled plasma optical emission spectrometry for simultaneous multi-element analysis (ICP-OES) (SpectroGenesis Genesis Fee, Spectro-Analytical Instruments GmbH, Kleve, Germany). The content of chemical elements is expressed in mg kg−1 of the sample. Quality control was performed using blank samples and certified reference material—beech leaves (BCR—100) with an accuracy of 100% ± 15%. The standard reference material was obtained from the Institute for Reference Materials and Measurements (IRMM, Geel, Belgium) and certified by the European Commission (EC-JRC, European Commission—Joint Research Centre, Brussels, Belgium). All analyses were performed in five replicates (n = 5). The detection limits (mg kg−1) for the elements were as follows: Al—0.003, B—0.001, Cd—0.008, Cr—0.011, Cu—0.007, Fe—0.011, Mn—0.001, Ni—0.029, Pb—0.001, Sr—0.001 and Zn—0.004. Since Cd concentrations were below the detection limit in all samples tested, this was not addressed further.
Photosynthetic efficiency was determined using the method of induced chlorophyll fluorescence according to the method of Krause and Weis [39]. The measurement was performed in situ and in vivo with a portable fluorimeter (Plant Stress Meter, Biomonitor S.C.I. AB, Stockholm, Sweden) in 50 replicates. The following fluorescence parameters of chlorophyll PSII were measured: Fo (minimum fluorescence), Fm (maximum fluorescence), Fv (variable fluorescence, Fv = Fm-Fo) and Fv/Fm (photosynthetic efficiency). The Fv/Fm ratio is used as a measure of photosynthetic efficiency of the photosystem II (PSII) and correlates with the number of functionally active PSII reaction centers.
The chlorophyll content (Chl a and Chl b) and total carotenoids (Tot Carot) in the leaves of the plants were determined by measuring the absorbance of the leaf section extract in 1 mL of dimethyl sulfoxide (DMSO) at wavelengths of 663 nm, 645 nm and 480 nm on a spectrophotometer (Shimadzu UV-160, Kyoto, Japan). The extract was obtained by heating the DMSO solvent at 65 °C until the leaf section became colorless. The concentration of Chl a and Chl b was determined according to the formulas of Arnon [40], and the concentration of Tot Carot was determined according to the formula of Wellburn [41]. Chl a + b and the Chl a/b ratio were determined by calculation. Pigment values are expressed in mg g−1 of dry matter.

2.3. Network Structure and Centrality Measures Analysis

As mentioned above, NA allows the analysis of the studied variables, which can form bipartite or tripartite but also more complex relationships that can be only partially revealed by other statistical methods. For the aforementioned reason and taking into account the basic objectives of our research, the concentration of PTEs in leaves is formalized as a system of causally connected relationships and sets that can be visualized, analyzed and studied. In this context, and considering that the results of PTEs showed uneven and different concentrations, the NA in this study was created using the extended Bayesian information criterion (EBIC) model, graphical least absolute shrinkage and selection operator (gLASSO). For a more practical and simple interpretation of the results, a graphical representation was created in which green lines indicate positive relationships and red lines indicate negative relationships, and their significance is shown in the range of variation in the thickness and strength of the lines, establishing definitive relationships similar to the complex principles of multiple regression. Basically, then, NA consists of two basic forms (nodes and edges), where nodes indicate the mutual formation of groups between different PTEs, while edges reflect the strength of their relationship. To quantify the centrality of nodes in the network, we also calculated centrality measures. Although NA provides four measures of network centrality, namely, closeness, betweenness, strength and expected influence, in this study, expected influence (EI) was used in evaluating all nodes in the network because, unlike other measures, EI also takes into account negative associations and therefore has better performance than other measures [42]. Of course, it should be noted that EI reflects the sum of the absolute weights of the edges that they share with other nodes in the network [42]. Consistent with the guidelines presented in the study by Epskamp et al. [43], the procedure for applying NA in this study involved three basic steps in evaluating the relationships among PTEs in the network: (1) statistical review of the data, (2) basic analysis of the PTE network and (3) evaluation of the accuracy and identification of communities of PTE nodes in the network.

3. Results and Discussion

3.1. The Potential of Urban Trees for the Accumulation of PTEs

In the analyzed plant material, most of the measured PTE concentrations were within the normal range for plants [44], except for B and Sr (Table S1). In fact, in all deciduous trees, the B content (>50 mg kg−1; [44]) and Sr content (>30 mg kg−1; [44,45]) were in the toxic range for plant tissues. On the other hand, content deficit of Cu (<5 mg kg−1; [44]) was measured in B. pendula leaves and P. nigra needles, deficit of Mn (<30 mg kg−1; [44]) was measured in P. nigra and deficit of Zn (<20 mg kg−1; [44]) was measured in P. acerifolia leaves. Previous research has shown that the content of accumulated Cu varies in different wood species. For example, the research of Greksa et al. [46] showed that Cu content varied from 2.33 mg kg−1 in leaves of T. aregentea to 11.2 mg kg−1 in P. acerifolia, while Zn content varied from 12.22 mg kg−1 in P. acerifolia to 31.64 mg kg−1 in Q. robur, which is consistent with the results of the present research. In a study by Jia et al. [47], various contents of Cr (0–2.9 mg kg−1), Cu (1.95–17 mg kg−1) and Zn (4.7–112.5 mg kg−1) were also found in different woody and shrub species. On the other hand, the Pb content in the research of Greksa et al. [46] and Jia et al. [47] was significantly higher than the results of the present study. Aničić et al. [48] also studied the content of PTEs in the leaves of A. hippocastanum and Tilia spp. and found the following element concentrations over several years and seasons Cr: 0.26–1.99 mg kg−1, Cu: 5.5–87.5 mg kg−1, Ni: 0.24–2.38 mg kg−1, Pb: 0.5–21.5 mg kg−1, Zn: 13.4–42.9 mg kg−1. The results of this study showed that deciduous tree species are better PTE accumulators in relation to P. nigra. However, research by Wang et al. [49] on different pine species showed that most elements accumulated higher concentrations compared to P. nigra in this study, except Sr, which was similar (3.55–11.6 mg kg−1).

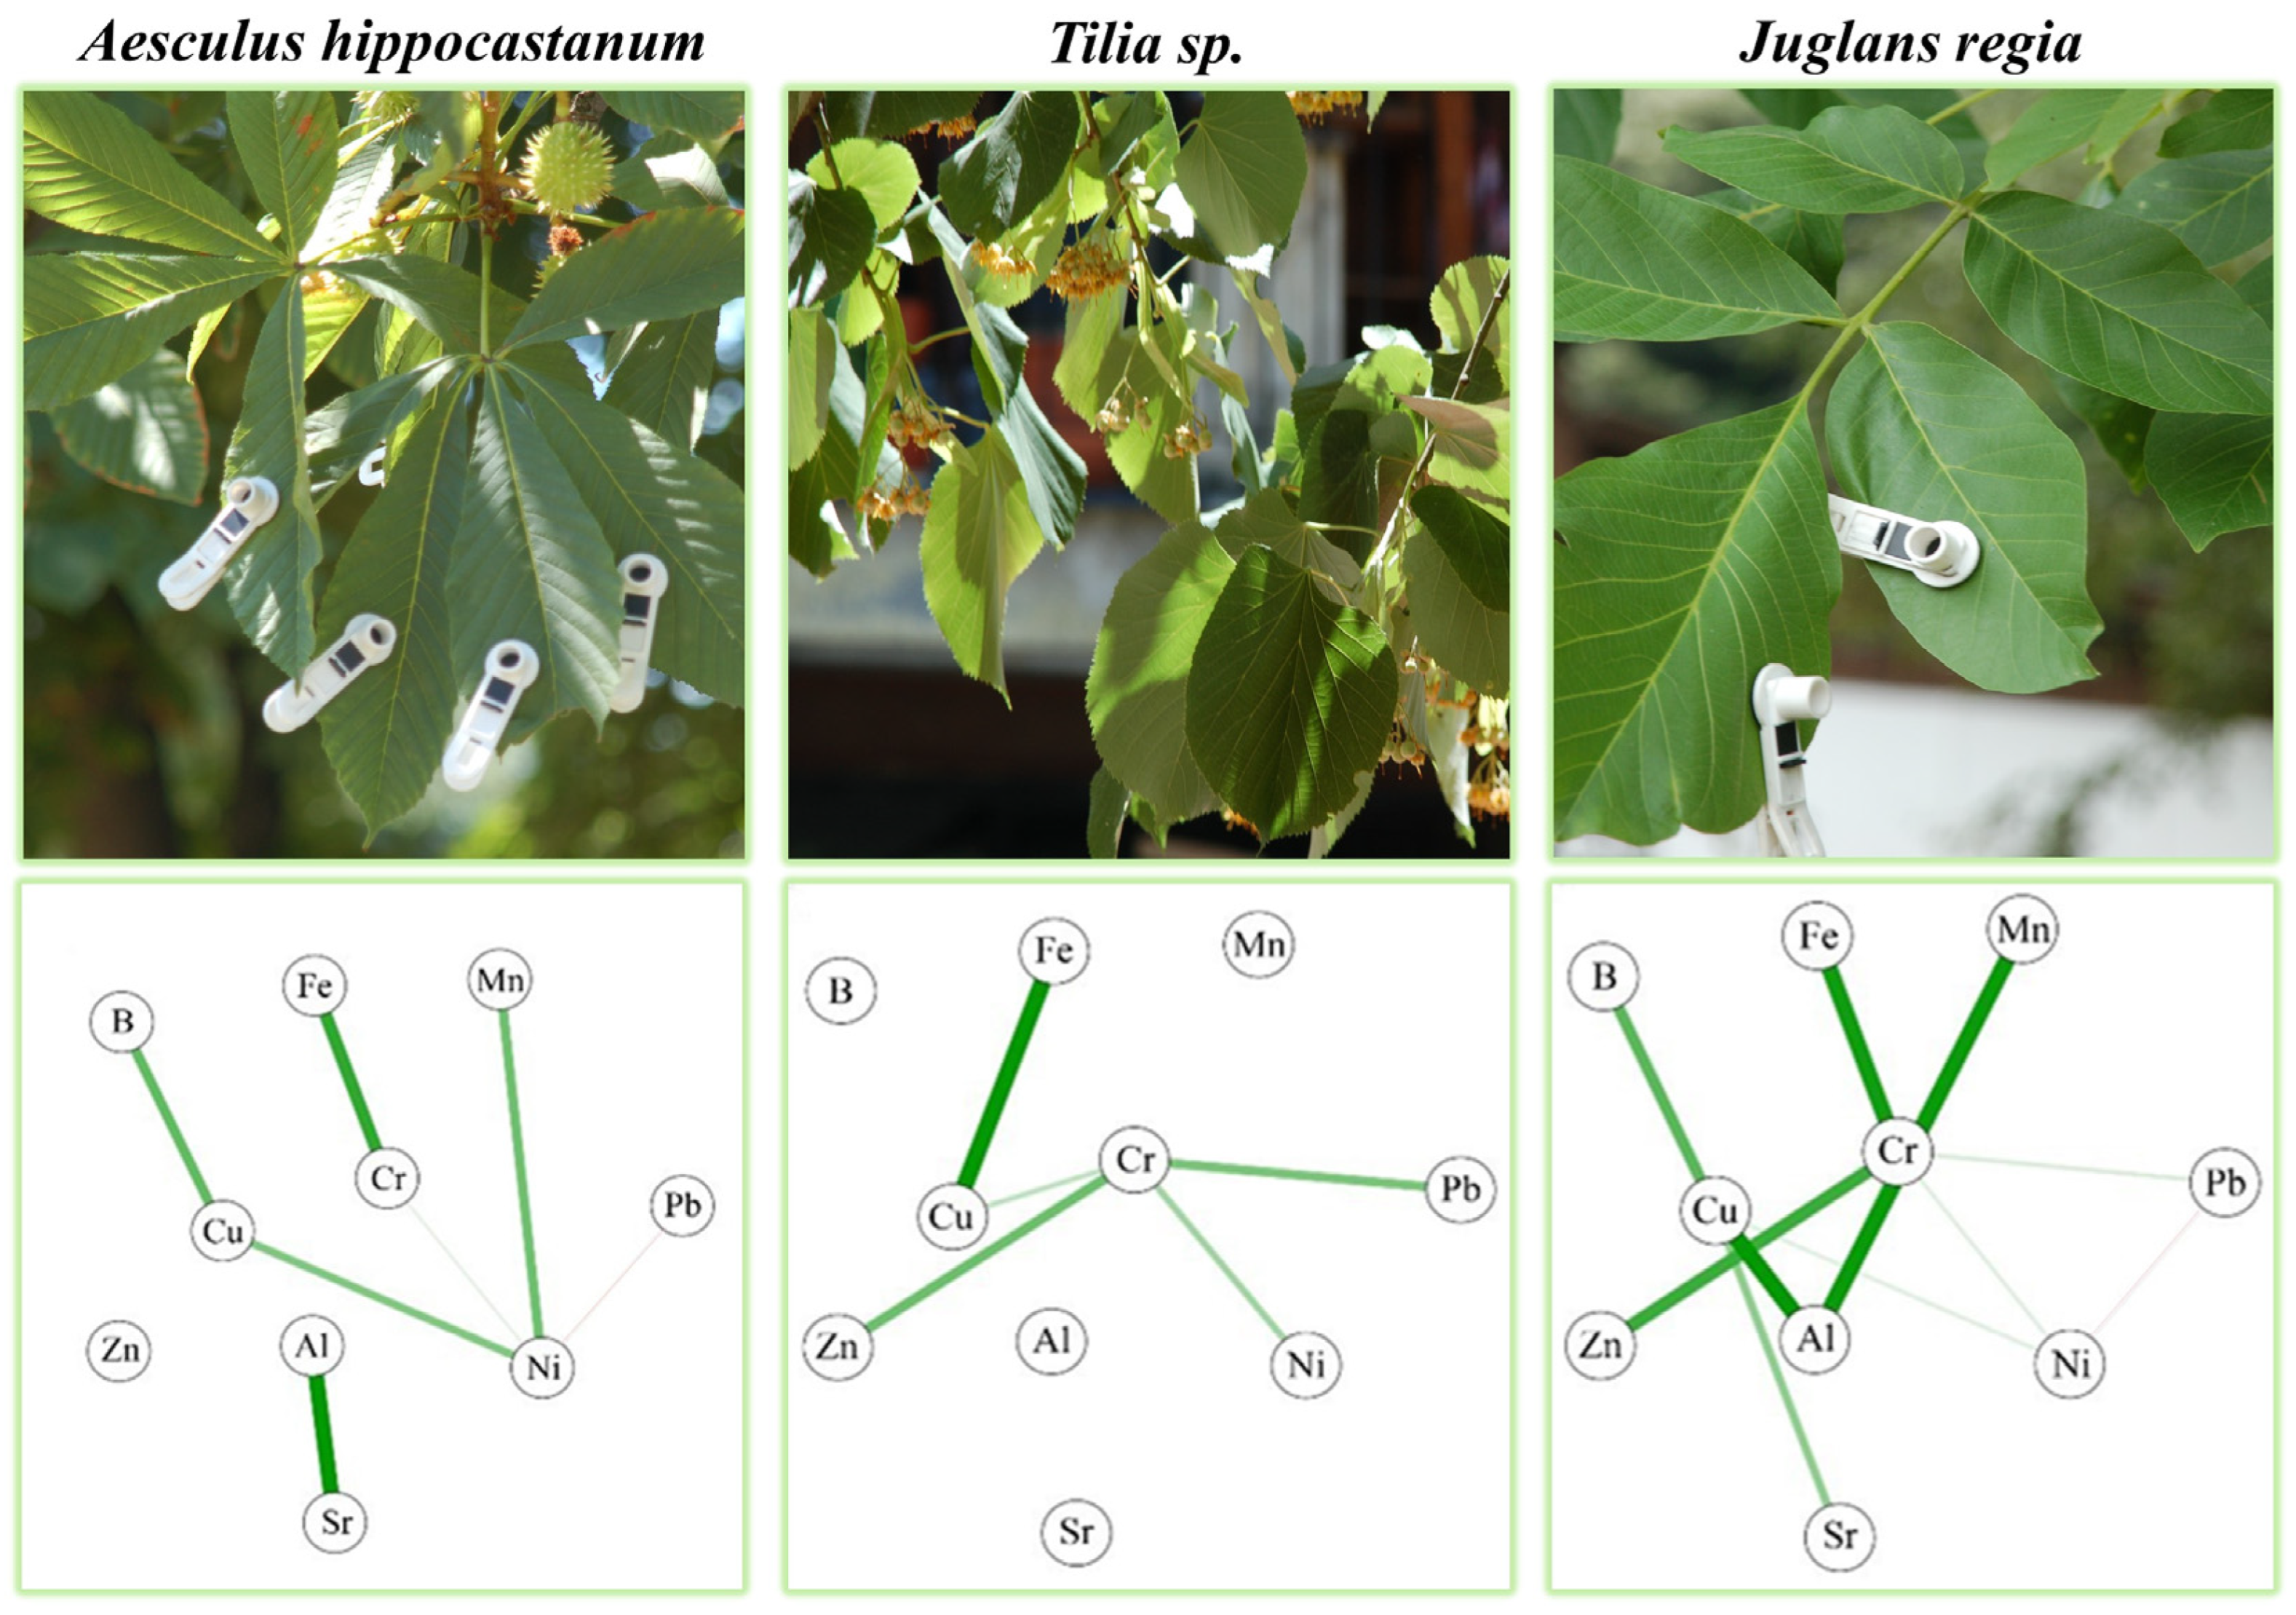
3.2. Associations between PTEs in Leaf Samples Using Network Analysis

Based on the results of NA, it was found that there are two nodes that form the community in A. platanoides. Copper was found to form the highest number of associations with all elements (Al, B, Cr, Sr and Zn). A strong association was observed between Sr and Al, as well as Mn and Fe, which could be a consequence of their high concentrations (Figure 2). Indeed, in A. platanoides, the highest concentrations of Sr and Mn were measured in relation to the species studied, with Mn showing the highest positive Ei (Table 1 and Table S1). In contrast, Pb showed the highest negative Ei (−1.812) in this species, as reflected by the formation of a (weak) negative association with Cr.
In A. pseudoplatanus leaves, the formation of two dominant nodes that form the community was observed (Figure 2). In the first node, the central element with the highest Ei is Cu (2.032), and it is closely related to Fe and Zn, which is probably related to the highest measured Cu content compared to all other species (Table 1 and Table S1). The central element in the second node is Cr, which forms a strong positive association with Sr. Similar to A. platanoides, the formation of a weak negative association between Cr and Pb was also observed. The element with the highest negative Ei is B (−1.336), which stands alone and does not form associations with other elements.
The formation of two dominant nodes that form the community was also observed in B. pendula leaves (Figure 2). The central element in the first node is Cr, which has the highest positive Ei (2.357) and achieved strong positive association with B and Al, which is related to the higher content of these elements in B. pendula compared to other species (Table S1). In contrast, low concentrations of Cu led to the formation of a negative association with Cr. In the second dominant node, Sr and Zn were singled out, which is expected considering that B. pendula is a species that has been confirmed to accumulate Zn in high concentrations [50,51], which was also obtained in this research. On the other hand, the content of Sr was the lowest among the examined deciduous species (Table S1).
Similar to A. pseudoplatanus and B pendula, the formation of two dominant nodes that form the community was also observed in the leaves of A. hippocastanum. The central element in the first node is Ni, which has a strong positive association with Cu and Mn and a weaker association with Cr and Pb (Figure 3). Similar to A. platanoides, Al formed a strong dominant association with Sr, probably because of the highest measured Al concentrations in relation to the other species studied (Table S1), which was also confirmed by the high positive Ei for Al (Table 1). The highest Ei in this species showed Cr (1.064), which caused strong association with Fe, enriching this species to the highest concentrations (Table S1). The highest negative Ei in A. hippocastanum leaves was found for Pb (1.816), which can be explained by the fact that its concentration was below the detection limit (Table S1). Moreover, Pb is not a physiological element, so its interaction with other elements is not expected, except with Cr and Ni, which are also not elements necessary for the normal physiological functioning of plants.
The leaves of Tilia sp. form one dominant node with Cr as the central element, which also has the highest Ei (2.160) and forms a strong association with Zn and Pb but a less strong association with Cu and Ni (Figure 3). The element with the highest negative Ei is B (−1.108), which stands alone and does not form associations with other elements, similar to A. pseudoplatanus. In addition to B, Al and Sr also stand out and do not form associations with other elements, probably due to more efficient accumulation of these elements compared to the other species studied (Table S1). In contrast, Tilia sp. accumulated the least amount of Mn compared to other deciduous tree species, an element which also stood out without any association.
J. regia—as in the above species, Cr is the central element with the highest number of associations between elements compared to all the species studied. Chromium is the most strongly associated with Al, Mn and Fe, while Al, Cu and Cr have the highest positive Ei (Table 1, Figure 3). On the other hand, the highest negative Ei was determined for Pb (−1.107), whose content was the highest in this species and which showed a negative association with Ni (Figure 3, Table S1).
P. acerifolia—this species stands out from the other studied species by having the smallest number of associations between elements, which is related to the fact that P. acerifolia has the weakest potential for accumulation of the studied elements compared to other deciduous tree species (Figure 4, Table S1). The element with the highest Ei is Cu (1.933), which has the strongest positive association with Al. A strong association between these two elements is also observed in both species of Acer, B. pendula and J. regia. The element with the highest negative Ei is Zn (−1.487), which, like Fe, Mn and Sr, stands alone and does not associate with other elements (Figure 4).
In P. nigra I needles, the formation of two dominant interconnected nodes was observed, the central element in the first node being Cr, which achieves a strong positive association with Mn and a slightly weaker one with Al and Ni, and a negative association with Cu. Nickel, the central element of the second node, shows a strong association with Sr and a somewhat weaker one with Pb, and a weak negative one with Cu (Figure 4). The element with the highest positive Ei is Zn (2.227), which has a strong association with Cu and Al. The elements that stand out and do not form association with other elements are B and Fe, and their content in the needles of P. nigra I was the lowest in relation to the other species studied (Table S1). Pinus nigra I needles generally had the worst ability for element accumulation in relation to examined tree species.
In P. nigra II needles, the formation of one dominant node was observed, with Al being the element with the highest Ei (1.887) and achieving the most associations with other elements (Table 1, Figure 4). Similar to P. nigra I, there is also a strong positive association between Zn and Cu. In contrast, B showed the highest negative Ei (−1.311) in this species and, like Mn, does not form associations with any element, probably due to the poor ability of P. nigra II needles to accumulate elements.
Chromium was found to have a positive association with most elements (Al, B, Fe, Mn, Sr and Zn) but also a negative association with Cu, which is to be expected considering that chromium can easily transition from one oxidation state to another due to its high redox potential and complicated electronic and valence shell chemistry [52]. Considering that Cr is a nonessential element and toxic to plants, no Cr-specific transporters or channels have been identified in plants. Therefore, Cr is transported by some essential element transporters, which is why it can affect numerous physiological, morphological and metabolic traits. Unlike Cr, Cu is involved in many physiological processes because it is a redox-active transition metal that is essential for plants and can assume multiple oxidation states in vivo. Cu has been found to interact with both essential (Fe, Zn) and nonessential elements (Al and Cr). Zinc is also an essential element, which is the main composition of ribosomes and is an active element in biochemical processes. It does not change its redox state, so it cannot participate directly in electron-transfer reactions. One of the most common interactions between elements is between Zn and Cu since they use similar absorption mechanisms [53]. Copper and Zn deficiencies can alter essential functions of plant metabolism, while optimal Cu and Zn concentrations in the medium positively affect chloroplast membrane system development and chlorophyll content. A strong positive interaction between these two elements was observed in the needles of P. nigra I and II but also of A. pseudoplatanus. Crosstalk between Fe and Cu is also a common interaction, considering that Fe and Cu serve as critical cofactors for components of the electron transport chain in the mitochondrion and chloroplast [54]. This association was found in A. pseudoplatanus and Tilia sp. leaves. Although Al can be beneficial to plants by stimulating growth and attenuating biotic and abiotic stresses, it remains unknown how Al mediates these effects, as its biological significance in cellular systems has not yet been identified. Aluminum achieved a strong positive association with Cu, Cr, Sr and Zn, which is to be expected considering that previous studies have shown that treatment of various plant species with 0.5–1 mM Al leads among other things to more efficient accumulation of Ca, Cu, Fe, Mn, N, P and Zn [55]. In the species A. platanoides and A. hippocastanum, Al was found to interact strongly with Sr, which can be explained by the fact that Sr is not a plant micronutrient and is taken up following the plant’s metabolic requirement for Ca [56]. Since Sr and Ca both belong to the alkaline earth series, they share many physical properties and are therefore generally assumed to behave in the same way in organisms [57].
It is interesting to discuss the negative interaction between Cr and Cu in the species B. pendula and P. nigra I. Considering that Cu prompts the uptake of Cr, the negative association between these two elements is probably due to the low Cu concentrations in these two species. Namely, research by Li et al. [58] showed that the combined application of Cr and Cu to the medium had a significantly greater effect on the species than single additions in treated cultivars. Moreover, antagonistic reactions appear to be related to the variable valence of Cr [56].
Although the association between Pb and Ni is weaker compared to the interactions described above, it was achieved in almost all the species studied. The only exceptions are A. pseudoplatanus and Tilia sp., where these two elements interact indirectly via Cr. Lead and Ni are taken up by plants through similar mechanisms and have a direct and indirect influence on the same processes in plants [59]. The interaction between Ni and Pb was found to be synergistic in broccoli leaf at lower Ni concentrations, which is consistent with the results of the present study. Consequently, the otherwise synergistic NixPb interaction turns into an antagonistic one at higher Ni concentrations, which also proved to be the case in J. regia in our research.

3.3. Ecophysiological Response of Plants to PTEs

Research on the ecophysiological characteristics of urban trees that exist and function under conditions of intense soil and air pollution in urban areas can guide the development of interventions for ecological restoration of degraded urban ecosystems. Analysis of the concentration of PTEs in plant tissues and determination of physiological–biochemical changes (changes in the amount of photosynthetic pigments, carotenoids, photosynthetic efficiency, etc.) is one of the most important parameters in early diagnosis of physiological symptoms of deficiency and toxicity. Chlorophylls (Chl a and Chl b) with carotenoids are the basic photosynthetic pigments that form the light-harvesting chlorophyll a/b (LHCP) complex and are associated with the photochemical reaction centers PSI and PSII [60,61]. In addition to their role in photosynthesis, carotenoids act as non-enzymatic antioxidants that protect the photosynthetic apparatus from photooxidative damage by converting excess energy into heat [62]. Numerous literature data show that a deficient and/or toxic content of PTEs has a varying impact on the values of ecophysiological parameters, which was also confirmed in this study, i.e., significant positive correlations were found between the studied ecophysiological parameters and the content of Al, B, Cu, Fe and Sr (Table S2).
Based on the values of the content and ratio of Chl a and Chl b, Tot carot and the parameter of photosynthetic efficiency (Table S3), it can be concluded that A. pseudoplatanus and A. hippocastanum have the highest content of Chl a and b and carotenoids among all the species studied, and at the same time the lowest values of the parameter of photosynthetic efficiency, which may be related, on the one hand, to the highest Cu content in these two species, which was also confirmed by the correlation analysis (p < 0.01 **, Table S2) and the higher Zn content in A. pseudoplatanus (Table S1). Copper is an essential component of electron-transfer reactions mediated by cytochrome c oxidase and plastocyanin [63], while Zn increases the biosynthesis of chlorophyll and carotenoids [64]. Therefore, optimal Cu and Zn concentrations in the medium have a positive effect on the development of the chloroplast membrane system and chlorophyll content [65]. Moreover, Fe is known to be involved in chlorophyll biosynthesis and stabilization [66,67] (p < 0.01 **, Table S2), and its content was the highest in A. hippocastanum (Table S1). In contrast to the higher content of photosynthetic pigments, the values of the photosynthetic efficiency parameter (Fv/Fm) in these two species were slightly lower than the optimal values established for deciduous species, which probably represents some kind of adaptation of these species to environmental conditions. In contrast, P. acerifolia had the lowest content of photosynthetic pigments and carotenoids (Table S3), probably due to the fact that this species accumulates Zn least effectively but maintains Fv/Fm efficiently in the optimal range. It should be noted that this species has the lowest number of associations between elements, probably due to its low potential for element accumulation. The species studied were generally not very sensitive to changes in PTE content, as indicated by the values of the Fv/Fm parameter, which were in the range or slightly below the values considered optimal for deciduous species [68,69]. The highest values of the Fv/Fm parameter were measured in B. pendula (Table S3), which is related to the highest measured Zn content but also the lowest Sr content. It is known that long-term exposure to high Sr concentrations can reduce electron transport but also lead to replacement of Ca in PSII, impairing its functionality [56,70].
In contrast, the lowest values of photosynthetic efficiency were measured in P. nigra I and II (Table S3), which is to be expected since conifer species differ not only in leaf shape and surface area but also in their ecophysiological response and are generally lower [71]. Another reason for the lower values of photosynthetic efficiency is certainly due to a deficiency of the essential elements Cu, Mn and Zn [56]. At the cellular level, Mn deficiency can lead to a reduction in the number of chloroplasts, the functional centers of PSII, and in the case of severe deficiency, damage of the thylakoid membranes of chloroplasts [72]. It was the deficiency of these elements that resulted in the lowest concentration of Chl a and Chl b, Tot carot, and Fv/Fm parameter in P. nigra, a species in which NA confirmed one of the strongest Cu-Zn associations.
The Chl a/b ratio was consistent among all species and ranged from 2.09 to 2.83 (Table S3). According to Lichtenthalter and Buschmann [73], the range of Chl a/b ratio for healthy plants is between 2.5 and 3.5, so it is noticeable that A. platanoides, A. pseudoplatanus, J. regia and A. hippocastanum have lower values of this parameter. The Chl a/b ratio is a parameter that can be used as an indicator of the toxic effect of the accumulation of PTE in plant tissues [74] and is a parameter of plant tolerance to darkness, i.e., acclimation of the photosynthetic apparatus [75].

4. Conclusions

The results of the network analysis show that all elements are associated with Cu or Cr, as these elements are characterized by a change in redox state. In addition, NA showed that there is no association between elements in species that have lower or higher efficiency in uptake of PTEs, leading to the conclusion that the elements do not depend on mutual association but on the accumulation itself. This study has shown that NA can be used as a practical, novel tool for evaluating the relationship between associations and concentrations of elements in leaves, providing the possibility of successfully applying this analysis to other biological systems.
Based on the differences in PTE accumulation capacity between urban tree species, it is shown that A. platanoides has a higher potential for the accumulation of Cr, Mn and Sr, while A. hippocastanum is more efficient in terms of accumulation of Al and Fe. On the other side, P. acerifolia has the weakest potential for accumulation of the studied elements compared to other deciduous tree species.
Based on the results of the ecophysiological response, it was shown that these species have good ecophysiological potential for growth and existence in the urban environment, despite the varying ability to take up elements and the different associations between them. Existing differences in the content of photosynthetic pigments were not reflected in the values of photosynthetic parameters, which were uniform and at an optimal level in all the deciduous trees studied. It was also determined that the content of photosynthetic pigments and carotenoids, as well as the parameters of photosynthetic efficiency, were lower in conifers than in deciduous trees.
This is the first study to investigate the interactions between PTEs in leaves of urban tree species using NA, which proved to be a good basis for future research in various scientific disciplines.
The science of urban trees and forests has been unjustly neglected, and a detailed knowledge of their functioning can be a good starting point for urban planners in creating green spaces in cities, as well as a decision-making guide for the government in adopting policies to improve the quality of life in cities.

Supplementary Materials

The following supporting information can be downloaded at https://www.mdpi.com/article/10.3390/f14112116/s1: Table S1: Potentially toxic element concentrations in the leaves of selected urban tree species (mg kg−1 d.w.), average and standard deviation (Std Dev); Table S2: Pearson’s correlations between the content of PTEs in leaves and the ecophysiological response of the studied species; Table S3: Content of Chl a, Chl b, Chl a + b, Chl a/b and Tot Carot (mg g−1 d.w.) and photosynthetic efficiency (Fv/Fm) of selected urban tree species, average and standard deviation (Std Dev).

Author Contributions

Conceptualization, M.M. (Marija Matić), D.P. and V.P.; Methodology, M.M. (Marija Matić), D.P., V.P. and D.Č.; Validation, M.M. (Marija Matić), D.P. and V.P.; Formal analysis, M.M. (Marija Matić) and D.P.; Investigation, M.M. (Marija Matić), D.P. and V.P.; Data Curation, M.M. (Marija Matić), D.P. and V.P.; Writing—Original Draft Preparation, M.M. (Marija Matić), D.P. and V.P.; Writing—Review and Editing, M.M. (Marija Matić), D.P. and V.P.; Visualization, M.M. (Marija Matić), D.P., V.P. and O.K.; Supervision, M.M. (Miroslava Mitrović) and P.P.; Funding Acquisition, P.P. All authors have read and agreed to the published version of the manuscript.

Funding

This work was supported by the Ministry of Science, Technological Development and Innovation of the Republic of Serbia (grant no. 451-03-47/2023-01/200007).

Data Availability Statement

The data presented in this study are available on request from the corresponding author.

Conflicts of Interest

The authors declare no conflict of interest.

References

  1. Baklanov, A.; Molina, L.T.; Gauss, M. Megacities, air quality and climate. Atmos. Environ. 2016, 126, 235–249. [Google Scholar] [CrossRef]
  2. Locosselli, G.M.; Buckeridge, M.S. The science of urban trees to promote well-being. Trees 2023, 37, 1–7. [Google Scholar] [CrossRef]
  3. Arnfield, A.J. Two decades of urban climate research: A review of turbulence, exchanges of energy and water, and the urban heat island. Int. J. Climatol. 2003, 23, 1–26. [Google Scholar] [CrossRef]
  4. Akbari, H.; Konopacki, S. Calculating energy-saving potentials of heat-island reduction strategies. Energy Policy 2005, 33, 721–756. [Google Scholar] [CrossRef]
  5. Biasioli, M.; Barberis, R.; Ajmone-Marsan, F. The influence of a large city on some soil properties and metals content. Sci. Total Environ. 2006, 356, 154–164. [Google Scholar] [CrossRef] [PubMed]
  6. Madlener, R.; Sunak, Y. Impacts of urbanization on urban structures and energy demand: What can we learn for urban energy planning and urbanization management? Sustain. Cities Soc. 2011, 1, 45–53. [Google Scholar] [CrossRef]
  7. Galitskova, Y.M.; Antonina, I.; Murzayeva, A.I. Urban Soil Contamination. Procedia Eng. 2016, 153, 162–166. [Google Scholar] [CrossRef]
  8. Bielicka-Giełdoń, A.; Rylko, E.; Zamojc, K. Distribution, bioavailability and fractionation of metallic elements in Allotment garden soils using the BCR sequential extraction procedure. Pol. J. Environ. Stud. 2013, 22, 1013–1021. [Google Scholar]
  9. Hamad, S.H.; Schauer, J.J.; Shafer, M.M.; Al-Rheem, E.A.; Skaar, P.S.; Heo, J.; Tejedor-Tejedor, I. Risk assessment of total and bioavailable potentially toxic elements (PTEs) in urban soils of Baghdad-Iraq. Sci. Total Environ. 2014, 494–495, 39–48. [Google Scholar] [CrossRef] [PubMed]
  10. Jiao, X.; Teng, Y.; Zhan, Y.; Wu, J.; Lin, X. Soil heavy metal pollution and risk assessment in Shenyang industrial district, Northeast China. PLoS ONE 2015, 10, e0127736. [Google Scholar] [CrossRef]
  11. Mitrović, M.; Blanusa, T.; Pavlović, M.; Pavlović, D.; Kostić, O.; Perović, V.; Jarić, S.; Pavlović, P. Using Fractionation Profile of Potentially Toxic Elements in Soils to Investigate Their Accumulation in Tilia sp. Leaves in Urban Areas with Different Pollution Levels. Sustainability 2021, 13, 9784. [Google Scholar] [CrossRef]
  12. Edmondson, J.L.; Stott, I.; Davies, Z.G.; Gaston, K.J.; Leake, J.R. Soil surface temperatures reveal moderation of the urban heat island effect by trees and shrubs. Sci. Rep. 2016, 6, 33708. [Google Scholar] [CrossRef] [PubMed]
  13. Miyahara, A.A.L.; Wild, T.; Sandre, A.A.; Pellegrino, P.R.M.; Filho, C.A.S.; Buckeridge, M.S.; Locosselli, G.M. Developing and classifying urban biomes as a basis for nature-based solutions. Urban Clim. 2022, 45, 101251. [Google Scholar] [CrossRef]
  14. Kandziora-Ciupa, M.; Ciepał, R.; Nadgórska-Socha, A.; Barczik, G. Accumulation of heavy metals and antioxidant responses in Pinus sylvestris L. needles in polluted and non-polluted sites. Ecotoxicology 2016, 25, 970–981. [Google Scholar] [CrossRef] [PubMed]
  15. Gajić, G.; Đurđević, L.; Kostić, O.; Jarić, S.; Mitrović, M.; Stevanović, B.; Pavlović, P. Assessment of the phytoremediation potential and an adaptive response of Festuca rubra L. sown on fly ash deposits: Native grass has a pivotal role in ecorestoration management. Ecol. Eng. 2016, 93, 250–261. [Google Scholar] [CrossRef]
  16. Sen, A.; Khan, I.; Kundu, D.; Das, K.; Datta, J.A. Ecophysiological evaluation of tree species for biomonitoring of air quality and identification of air pollution-tolerant species. Environ. Monit. Assess. 2017, 189, 262. [Google Scholar] [CrossRef] [PubMed]
  17. Shi, T.; He, L.; Wang, R.; Li, Z.; Hu, Z.; Wu, G. Digital mapping of heavy metals in urban soils: A review and research challenges. Catena 2023, 228, 107183. [Google Scholar] [CrossRef]
  18. Čakmak, D.; Pavlović, P.; Mrvić, V.; Saljnikov, E.; Perović, V.; Jaramaz, D.; Sikirić, B. Using different receptor models to determine the sources of available forms of potentially toxic elements in Rasina District—A case study. Catena 2023, 222, 106865. [Google Scholar] [CrossRef]
  19. Wadoux, A.M.J.-C.; Minasny, B.; McBratney, A.B. Machine learning for digital soil mapping: Applications, challenges and suggested solutions. Earth-Sci. Rev. 2020, 210, 103359. [Google Scholar] [CrossRef]
  20. Paes, É.C.; Veloso, G.V.; Silva, D.L.d.A.; Fernandes-Filho, E.I.; Fontes, M.P.F.; Soares, E.M.B. Use of modeling to map potentially toxic elements and assess the risk to human health in soils affected by mining activity. Catena 2023, 220, 106662. [Google Scholar] [CrossRef]
  21. Barberán, A.; Bates, S.; Casamayor, E.; Fierer, N. Using network analysis to explore co-occurrence patterns in soil microbial communities. ISME J. 2012, 6, 343–351. [Google Scholar] [CrossRef] [PubMed]
  22. Berry, D.; Widder, S. Deciphering microbial interactions and detecting keystone species with co-occurrence networks. Front. Microbiol. 2014, 5, 219. [Google Scholar] [CrossRef] [PubMed]
  23. Ofaim, S.; Ofek-Lalzar, M.; Sela, N.; Jinag, J.; Kashi, Y.; Minz, D.; Freilich, S. Analysis of microbial functions in the rhizosphere using a metabolic-network based framework for metagenomics interpretation. Front. Microbiol. 2017, 8, 1606. [Google Scholar] [CrossRef] [PubMed]
  24. Hewavitharana, S.S.; Klarer, E.; Reed, A.J.; Leisso, R.; Poirier, B.; Honaas, L.; Rudell, D.R.; Mazzola, M. Temporal dynamics of the soil metabolome and microbiome during simulated anaerobic soil disinfestation. Front. Microbiol. 2019, 10, 2365. [Google Scholar] [CrossRef] [PubMed]
  25. Raiesi, F.; Beheshti, A. Evaluating forest soil quality after deforestation and loss of ecosystem services using network analysis and factor analysis techniques. Catena 2022, 208, 105778. [Google Scholar] [CrossRef]
  26. Martín-Sanz, J.P.; de Santiago-Martín, A.; Valverde-Asenjo, I.; Quintana-Nieto, J.R.; González-Huecas, C.; López-Lafuente, A.L. Comparison of soil quality indexes calculated by network and principal component analysis for carbonated soils under different uses. Ecol. Ind. 2022, 143, 109374. [Google Scholar] [CrossRef]
  27. Zahedifar, M. Assessing alteration of soil quality, degradation, and resistance indices under different land uses through network and factor analysis. Catena 2023, 222, 106807. [Google Scholar] [CrossRef]
  28. Zhang, Z.; Wang, J.; Li, B. Determining the influence factors of soil organic carbon stock in opencast coal-mine dumps based on complex network theory. Catena 2019, 173, 433–444. [Google Scholar] [CrossRef]
  29. Pavlović, D.; Pavlović, M.; Perović, V.; Mataruga, Z.; Čakmak, D.; Mitrović, M.; Pavlović, P. Chemical Fractionation, Environmental, and Human Health Risk Assessment of Potentially Toxic Elements in Soil of Industrialised Urban Areas in Serbia. Int. J. Environ. Res. Public Health 2021, 18, 9412. [Google Scholar] [CrossRef] [PubMed]
  30. Secretariat for Environmental Protection. Environmental Protection Programme for the City of Belgrade; Secretariat for Environmental Protection, Kirilo Savić Institute: Belgrade, Serbia, 2013; pp. 1–241. (In Serbian) [Google Scholar]
  31. Secretariat for Environmental Protection. The Quality of the Environment in the City of Belgrade in 2012; The City Institute for Public Health: Belgrade, Serbia, 2013; pp. 1–372. (In Serbian) [Google Scholar]
  32. Smailagić, J.; Savović, A.; Nešić, D.; Milenković, M.; Zdravković, S. Climatological Analysis of Summer 2012 for Serbia, Seasonal Bulletin; Republic Hydrometeorological Service of Serbia: Belgrade, Serbia, 2012; pp. 1–22. (In Serbian)
  33. Piczak, K.; Lesniewicz, A.; Zyrnicki, W. Metal concentrations in deciduous tree leaves from urban areas in Poland. Environ. Monit. Assess. 2003, 86, 273–287. [Google Scholar] [CrossRef]
  34. Yanqun, Z.; Yuan, L.; Schvartz, C.; Langlade, L.; Fan, L. Accumulation of Pb, Cd, Cu and Zn in plants and hyperaccumulator choice in Lanping lead-zinc mine area, China. Environ. Int. 2004, 30, 567–576. [Google Scholar] [CrossRef] [PubMed]
  35. Rossini Oliva, S.; Mingorance, M.D. Study of the impact of industrial emission on the vegetation grown around Huelva (South of Spain) City. J. Atmos. Chem. 2004, 49, 291–302. [Google Scholar] [CrossRef]
  36. Serbula, S.M.; Radojevic, A.A.; Kalinovic, J.V.; Kalinovic, T.S. Indication of airborne pollution by birch and spruce in the vicinity of copper smelter. Environ. Sci. Pollut. Res. 2014, 21, 11510–11520. [Google Scholar] [CrossRef]
  37. Kalinovic, T.S.; Serbula, S.M.; Radojevic, A.A.; Kalinovic, J.V.; Steharnik, M.M.; Petrovic, J.V. Elder, linden and pine biomonitoring ability of pollution emitted from the copper smelter and the tailings ponds. Geoderma 2016, 262, 266–275. [Google Scholar] [CrossRef]
  38. USEPA (United States Enviromnental Protection Agency). Method 3052: Microwave assisted acid digestion of siliceous and organically based matrices. In Test Methods for Evaluating Solid Waste; SW 846; USEPA: Washington, DC, USA, 1996. [Google Scholar]
  39. Krause, G.; Weis, E. Chlorophyll fluorescence and photosynthesis: The basics. Annu. Rev. Plant Physiol. Plant Mol. Biol. 1991, 42, 313–349. [Google Scholar] [CrossRef]
  40. Arnon, D. I Copper enzymes in isolated chloroplasts. Polyphenoloxidases in Beta vulgaris. Plant Physiol. 1949, 24, 1–15. [Google Scholar] [CrossRef] [PubMed]
  41. Wellburn, A.R. The spectral determination of chlorophylls a and b, as well as total carotenoids using various solvents with spectrophotometers of different resolution. J. Plant Physiol. 1994, 144, 307–313. [Google Scholar] [CrossRef]
  42. Robinaugh, D.J.; Millner, A.J.; McNally, R.J. Identifying highly influential nodes in the complicated grief network. J. Abnorm. Psychol. 2016, 125, 747–757. [Google Scholar] [CrossRef] [PubMed]
  43. Epskamp, S.; Borsboom, D.; Fried, E.I. Estimating psychological networks and their accuracy: A tutorial paper. Behav. Res. 2018, 50, 195–212. [Google Scholar] [CrossRef]
  44. Kabata-Pendias, A.; Mukherjee, A.B. Trace Elements from Soil to Human; Springer: Berlin, Germany, 2007; pp. 1–550. [Google Scholar] [CrossRef]
  45. Shacklette, H.T.; Erdman, J.A.; Harms, T.F. Trace elements in plants foodstuffs. In Toxicity of Heavy Metals in the Environment; Oehme, F.W., Ed.; Part I; Marcel Dekker Inc.: New York, NY, USA, 1978; p. 25. [Google Scholar]
  46. Greksa, A.; Ljevnaić-Mašić, B.; Grabić, J.; Benka, P.; Radonić, V.; Blagojević, B.; Sekulić, M. Potential of urban trees for mitigating heavy metal pollution in the city of Novi Sad, Serbia. Environ. Monit. Assess. 2019, 191, 636. [Google Scholar] [CrossRef] [PubMed]
  47. Jia, M.; Zhou, D.; Lu, S.; Yu, J. Assessment of foliar dust particle retention and toxic metal accumulation ability of fifteen roadside tree species: Relationship and mechanism. Atmos. Pollut. Res. 2021, 12, 36–45. [Google Scholar] [CrossRef]
  48. Aničić, M.; Spasić, T.; Tomašević, M.; Rajšić, S.; Tasić, M. Trace elements accumulation and temporal trends in leaves of urban deciduous trees (Aesculus hippocastanum and Tilia spp.). Ecol. Indic. 2011, 11, 824–830. [Google Scholar] [CrossRef]
  49. Wang, J.; Huang, Y.; Beiyuan, J.; Wei, X.; Qi, J.; Wang, L.; Fang, F.; Liu, J.; Cao, J.; Xiao, T. Thallium and potentially toxic elements distribution in pine needles, tree rings and soils around a pyrite mine and indication for environmental pollution. Sci. Total Environ. 2022, 828, 154346. [Google Scholar] [CrossRef] [PubMed]
  50. Petrova, S.; Yurukova, L.; Velcheva, I. Possibilities of using deciduous tree species in trace element biomonitoring in an urban area (Plovdiv, Bulgaria). Atmos. Pollut. Res. 2014, 5, 196–202. [Google Scholar] [CrossRef]
  51. Kosiorek, M.; Modrzewska, B.; Wyszkowski, M. Levels of selected trace elements in Scots pine (Pinus sylvestris L.), silver birch (Betula pendula L.), and Norway maple (Acer platanoides L.) in an urbanized environment. Environ. Monit. Assess. 2016, 188, 598–610. [Google Scholar] [CrossRef] [PubMed]
  52. Sharma, A.; Kapoor, D.; Wang, J.; Shahzad, B.; Kumar, V.; Bali, A.S.; Jasrotia, S.; Zheng, B.; Yuan, H.; Yan, D. Chromium Bioaccumulation and Its Impacts on Plants: An Overview. Plants 2020, 9, 100. [Google Scholar] [CrossRef] [PubMed]
  53. Alloway, B.J. Heavy metals in soils. In Trace Metals and Metalloids in Soils and Their Bioavailability, 3rd ed.; Springer: New York, NY, USA, 2013; pp. 1–613. [Google Scholar]
  54. Marschner, H. Mineral Nutrition of Higher Plants, 2nd ed.; Academic Press: New York, NY, USA, 1995; pp. 1–889. [Google Scholar]
  55. Ofoe, R.; Thomas, R.H.; Asiedu, S.K.; Wang-Pruski, G.; Fofana, B.; Abbey, L. Aluminum in plant: Benefits, toxicity and tolerance mechanisms. Front. Plant Sci. 2023, 13, 1085998. [Google Scholar] [CrossRef] [PubMed]
  56. Kabata-Pendias, A.; Pendias, H. Trace Elements in Soils and Plants, 3rd ed.; CRC Press LLC: Boca Raton, FL, USA, 2001; pp. 1–413. [Google Scholar]
  57. Moyen, C.; Roblin, G. Uptake and translocation of strontium in hydroponically grown maize plants, and subsequent effects on tissue ion content, growth and chlorophyll a/b ration: Comparison with Ca effects. Environ. Exp. Bot. 2010, 68, 247–257. [Google Scholar] [CrossRef]
  58. Li, L.; Zhang, K.; Gill, R.A.; Islam, F.; Farooq, M.A.; Wang, J.; Zhou, W. Ecotoxicological and Interactive Effects of Copper and Chromium on Physiochemical, Ultrastructural, and Molecular Profiling in Brassica napus L. Biomed Res. Int. 2018, 2018, 9248123. [Google Scholar] [CrossRef]
  59. Amari, T.; Ghnaya, T.; Abdelly, C. Nickel, cadmium and lead phytotoxicity and potential of halophytic plants in heavy metal extraction. S. Afr. J. Bot. 2017, 111, 99–110. [Google Scholar] [CrossRef]
  60. Joshi, N.; Chauhan, A.; Joshi, P.C. Impact of industrial air pollutants on some biochemical parameters and yield in wheat and mustard plants. Environmentalist 2009, 29, 398–404. [Google Scholar] [CrossRef]
  61. Seyyednejad, S.M.; Niknejad, M.; Koochak, H. A review of some different effects of air pollution on plants. Res. J. Environ. Sci. 2011, 5, 302–309. [Google Scholar] [CrossRef]
  62. Smirnoff, N. Ascorbate, tocopherol and carotenoids: Metabolism, pathway engineering and functions. In Antioxidants and Reactive Oxygen Species in Plants; Smirnoff, N., Ed.; Blackwell Publishing: Oxford, UK, 2005; pp. 53–87. [Google Scholar]
  63. Yruela, I. Copper in plants. Braz. J. Plant Physiol. 2005, 17, 145–156. [Google Scholar] [CrossRef]
  64. Broadley, M.R.; White, P.J.; Hammond, J.P.; Zelko, I.; Lux, A. Zinc in plants. New Phytol. 2007, 173, 677–702. [Google Scholar] [CrossRef] [PubMed]
  65. Ahmad, N.; Alatar, A.A.; Faisal, M.; Khan, M.I.; Fatima, N.; Anis, M.; Hegazy, A.K. Effect of copper and zinc on the in vitro regeneration of Rauvolfia serpentina. Biol. Plant 2015, 59, 11–17. [Google Scholar] [CrossRef]
  66. Grotz, N.; Guerinot, M.L. Molecular aspects of Cu, Fe and Zn homeostasis in plants. Biochim. Biophys. Acta—Mol. Cell Res. 2006, 1763, 595–608. [Google Scholar] [CrossRef] [PubMed]
  67. Briat, J.F.; Duc, C.; Ravet, K.; Gaymard, F. Ferritins and iron storage in plants. Biochim. Biophys. Acta—Mol. Cell Res. 2010, 1800, 806–814. [Google Scholar] [CrossRef] [PubMed]
  68. Demming-Adams, B.; Adams, W.W. Photoprotection and other responses of plants to high light stress. Annu. Rev. Plant. Physiol. Plant. Mol. Biol. 1992, 43, 99–626. [Google Scholar] [CrossRef]
  69. Maxwell, K.; Johnson, G.N. Chlorophyll fluorescence-A practical guide. J. Exp. Bot. 2000, 51, 659–668. [Google Scholar] [CrossRef] [PubMed]
  70. Boussac, A.; Rappaport, F.; Carrier, P.; Verbavatz, J.M.; Gobin, R.; Kirilovsky, D.; Rutherford, A.W.; Sugiura, M. Biosynthetic Ca2+/Sr2+ exchange in the photosystem II oxygenevolving enzyme of Thermosynechococcus elongatus. J. Biol. Chem. 2004, 279, 22809–22819. [Google Scholar] [CrossRef] [PubMed]
  71. Pavlović, M.; Pavlović, D.; Kostić, O.; Jarić, S.; Čakmak, D.; Pavlović, P.; Mitrović, M. Evaluation of urban contamination with trace elements in city parks in Serbia using pine (Pinus nigra Arnold) needles, bark and urban topsoil. Int. J. Environ. Res. 2017, 11, 625–639. [Google Scholar] [CrossRef]
  72. Schmidt, S.B.; Jensen, P.E.; Husted, S. Review: Manganese deficiency in plants: The impact on photosystem II. Trends Plant Sci. 2016, 21, 622–623. [Google Scholar] [CrossRef] [PubMed]
  73. Lichtenthalter, H.K.; Buschmann, C. Chlorophylls and carotenoids—Measurement and characterisation by UV-VIS Spectroscopy. In Currenent Protocols in Food Analytical Chemistry; Wrolstad, R.E., Acree, T.E., An, H., Decker, E.A., Penner, M.H., Reid, D.S., Schwartz, S.J., Shoemaker, C.F., Sporns, P., Eds.; John Wiley and Sons: New York, NY, USA, 2001; Volume 1, pp. F4.3.1–F4.3.8. [Google Scholar]
  74. Sumalan, R.L.; Nescu, V.; Berbecea, A.; Sumalan, R.M.; Crisan, M.; Negrea, P.; Ciulca, S. The Impact of Heavy Metal Accumulation on Some Physiological Parameters in Silphium perfoliatum L. Plants Grown in Hydroponic Systems. Plants 2023, 12, 1718. [Google Scholar] [CrossRef] [PubMed]
  75. Beneragama, C.K.; Goto, K. Chlorophyl a:b ratio increases under low-light in ‘shade tolerant’ Euglena gracilis. Trop. Agric. Res. 2010, 22, 12–25. [Google Scholar] [CrossRef]
Figure 1. Map of the study area showing sampling sites.
Forests 14 02116 g001
Figure 2. Estimated network model for A. platanoides, A. pseudoplatanus and B. pendula. Note: green edges represent positive association between two nodes, whereas red edges represent negative association.
Forests 14 02116 g002
Figure 3. Estimated network model for A. hippocastanum, Tilia sp. and J. regia. Note: green edges represent positive association between two nodes, whereas red edges represent negative association.
Forests 14 02116 g003
Figure 4. Estimated network model for P. acerifolia and P. nigra (1- and 2-year-old needles). Note: green edges represent positive association between two nodes, whereas red edges represent negative association.
Forests 14 02116 g004
Table 1. Expected influence (EI) centrality indices of each network node. Positive EI values are denoted in bold and negative EI values in red color.
PTEsA.
platanoides
A.
pseudoplatanus
B.
pendula
A.
hippocastanum
Tilia
sp.
J.
regia
P.
acerifolia
P.
nigra I
P.
nigra II
Al0.778−0.6980.8171.047−0.7691.2760.5800.9381.887
B0.234−1.336−0.178−0.883−1.108−0.673−0.220−0.921−1.311
Cr−0.9361.2082.3571.0642.1601.5690.1400.3630.277
Cu0.8912.0320.3440.8880.9001.3311.933−0.7001.245
Fe−0.2390.052−0.933−0.6070.490−0.311−0.526−0.724−0.277
Mn1.406−0.662−0.727−0.368−0.565−0.156−0.524−0.179−0.680
Ni−0.319−0.110−0.7170.725−0.357−0.8211.1900.361−0.659
Pb−1.812−0.794−0.840−1.8160.277−1.107−0.334−0.870−0.832
Sr0.7890.232−0.1040.637−0.970−0.712−0.752−0.496−0.254
Zn−0.7930.076−0.019−0.687−0.059−0.396−1.4872.2270.604
Disclaimer/Publisher’s Note: The statements, opinions and data contained in all publications are solely those of the individual author(s) and contributor(s) and not of MDPI and/or the editor(s). MDPI and/or the editor(s) disclaim responsibility for any injury to people or property resulting from any ideas, methods, instructions or products referred to in the content.

