
Spatial Patterns of ‘Ōhi‘a Mortality Associated with Rapid ‘Ōhi‘a Death and Ungulate Presence

 , ,
, ,
Abstract
:1. Introduction
Rapid ‘Ōhi‘a Death
2. Materials and Methods
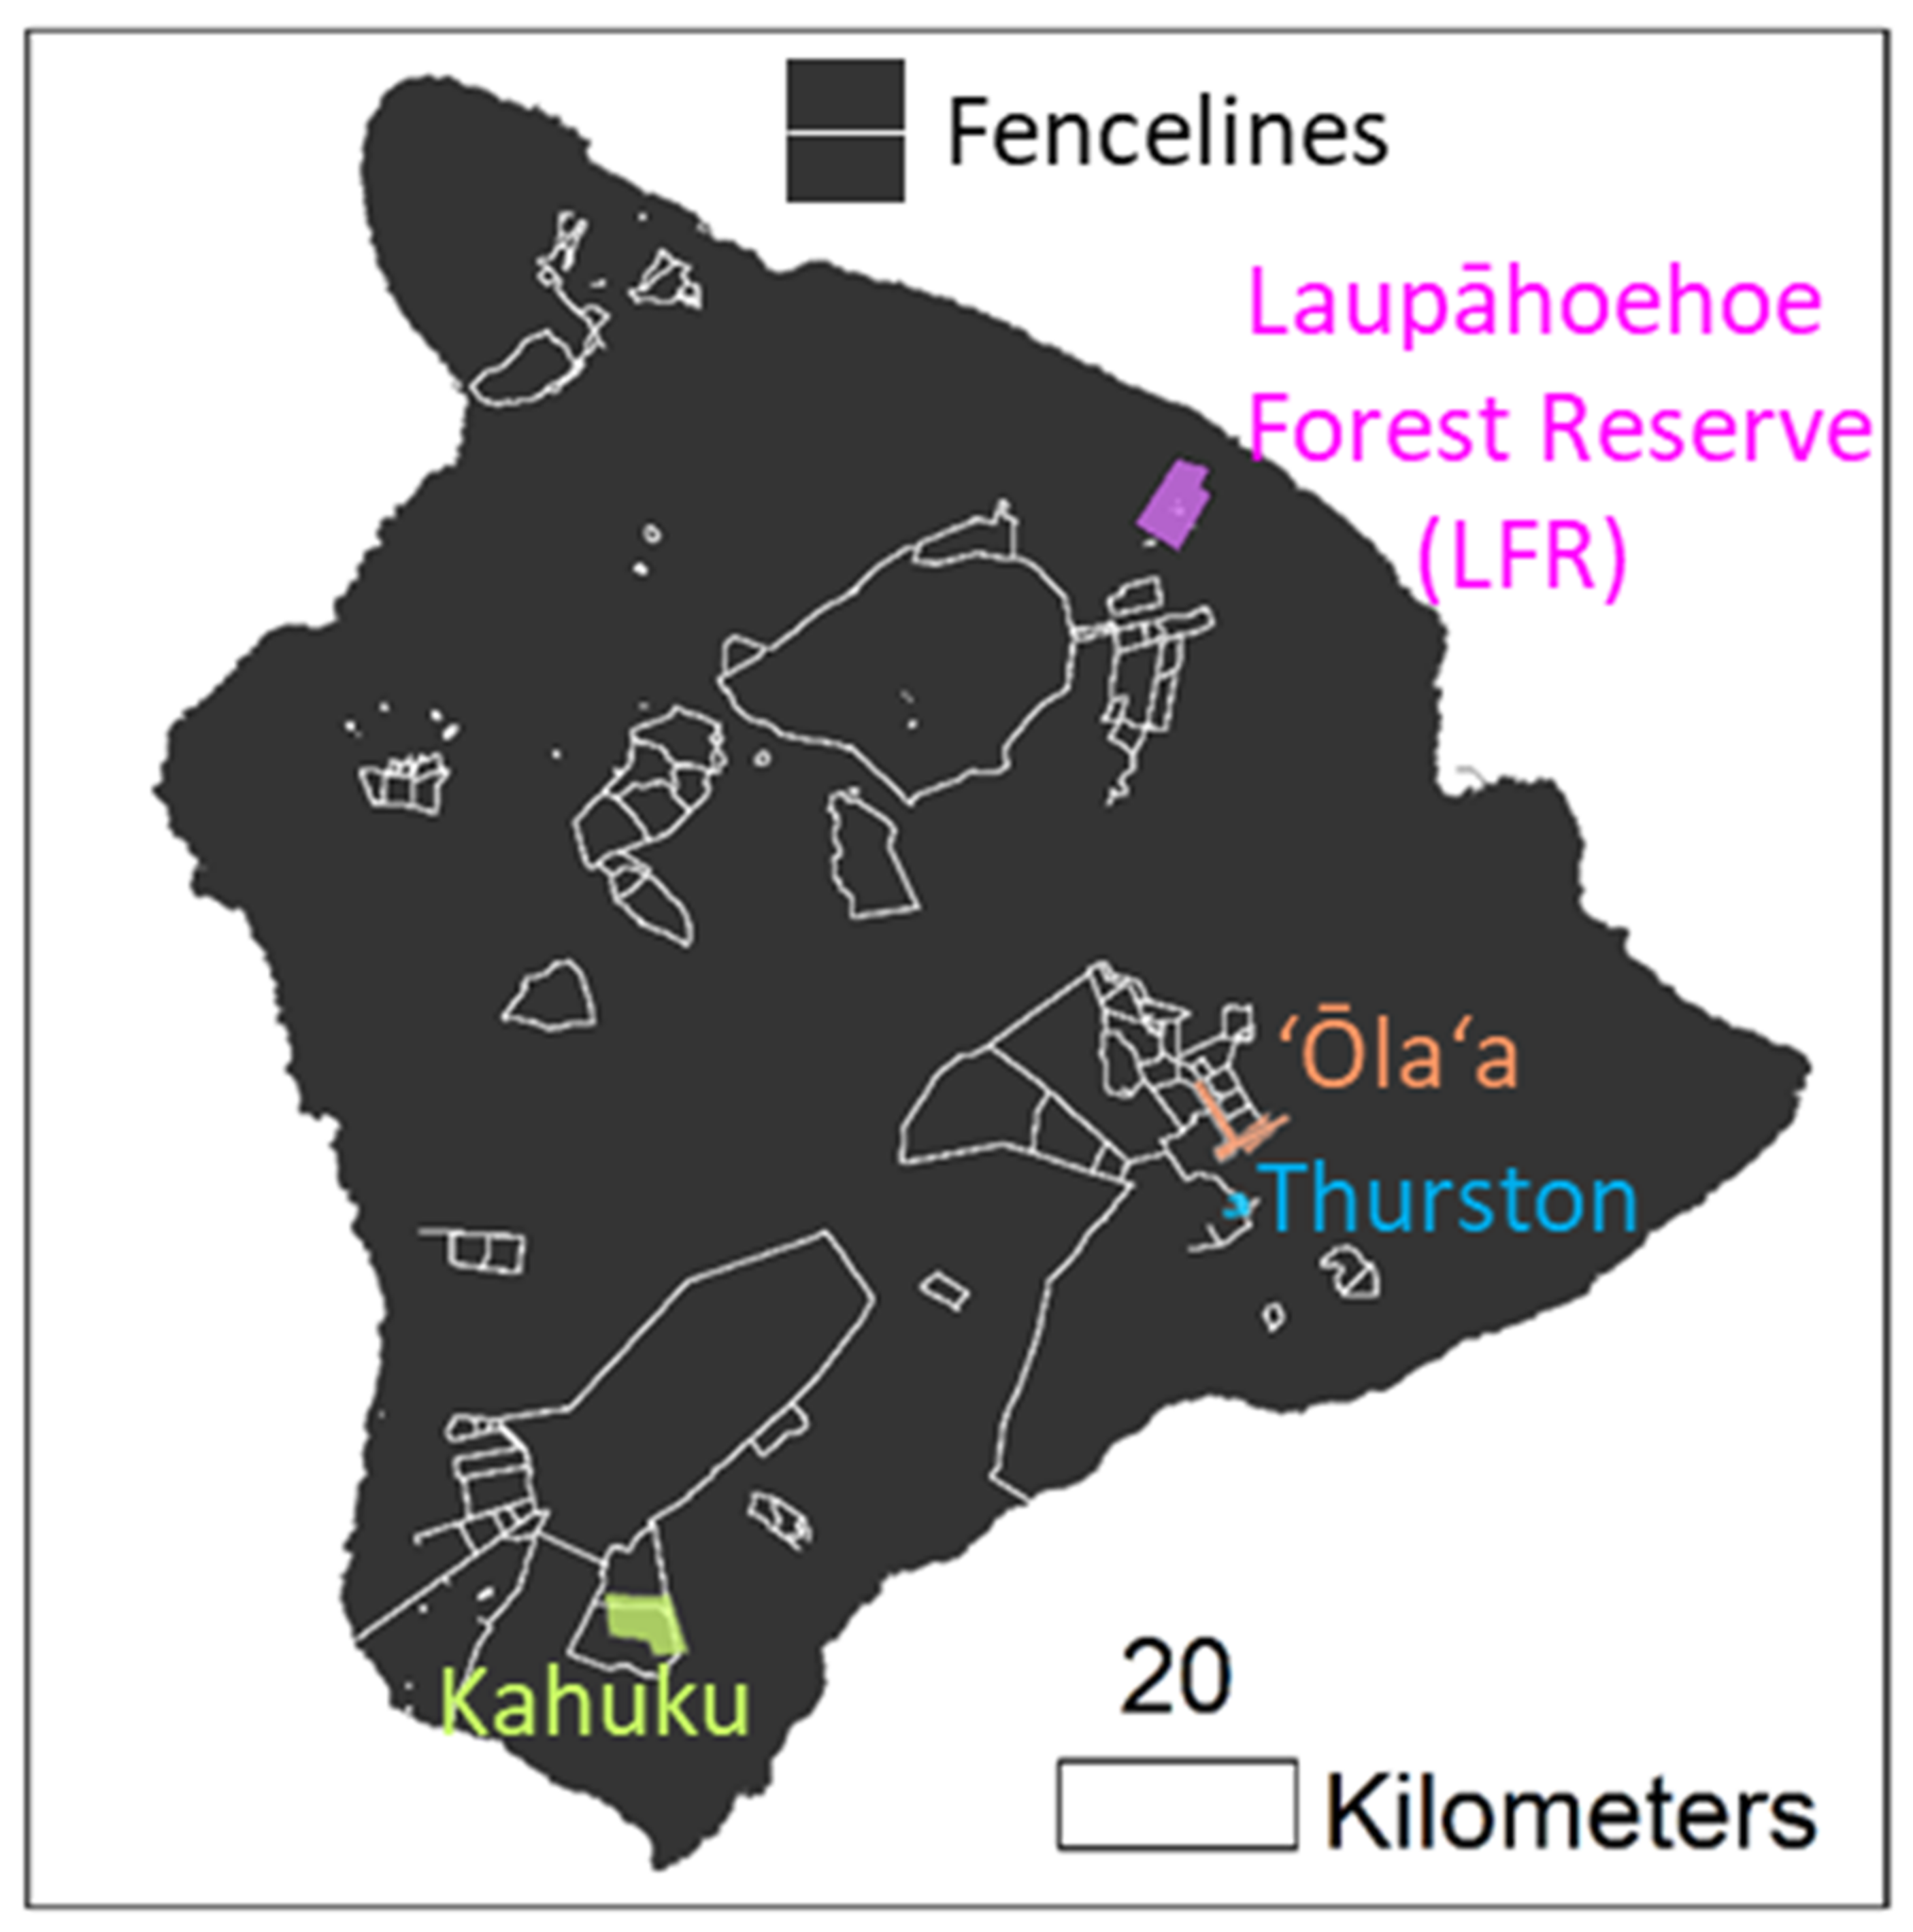
2.1. Study Site Locations
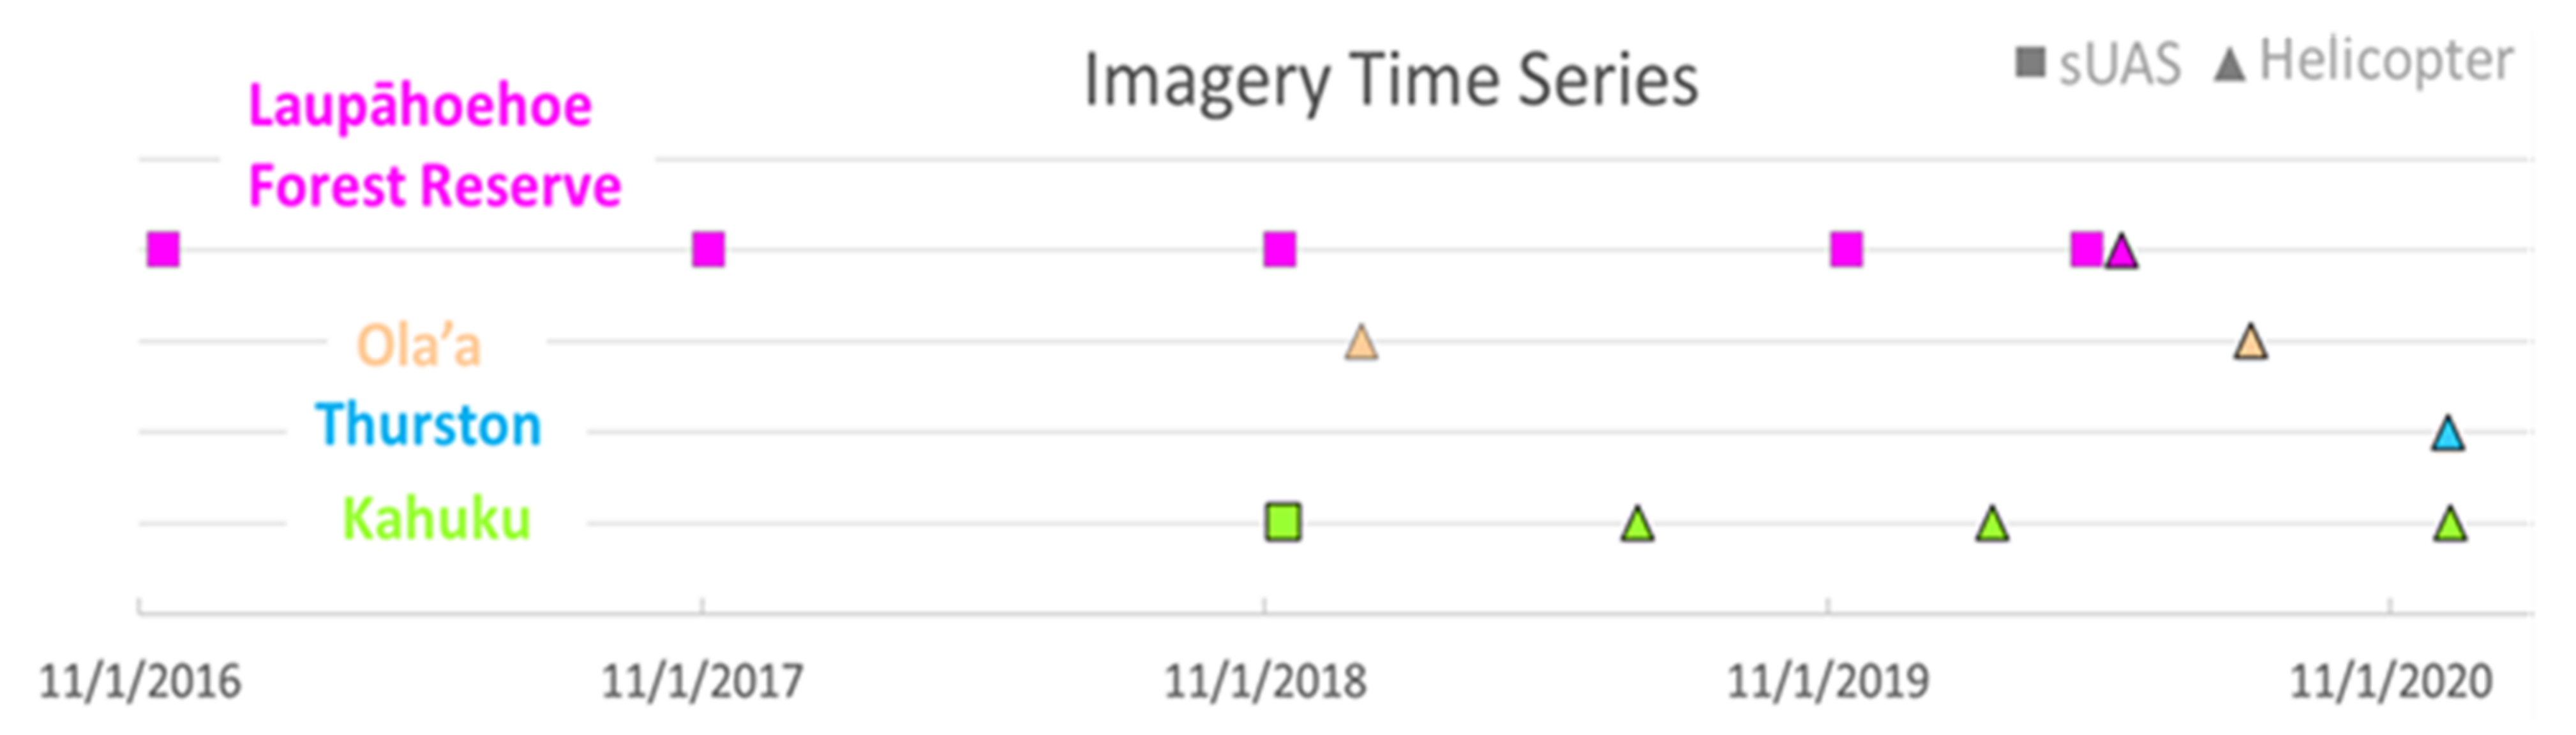
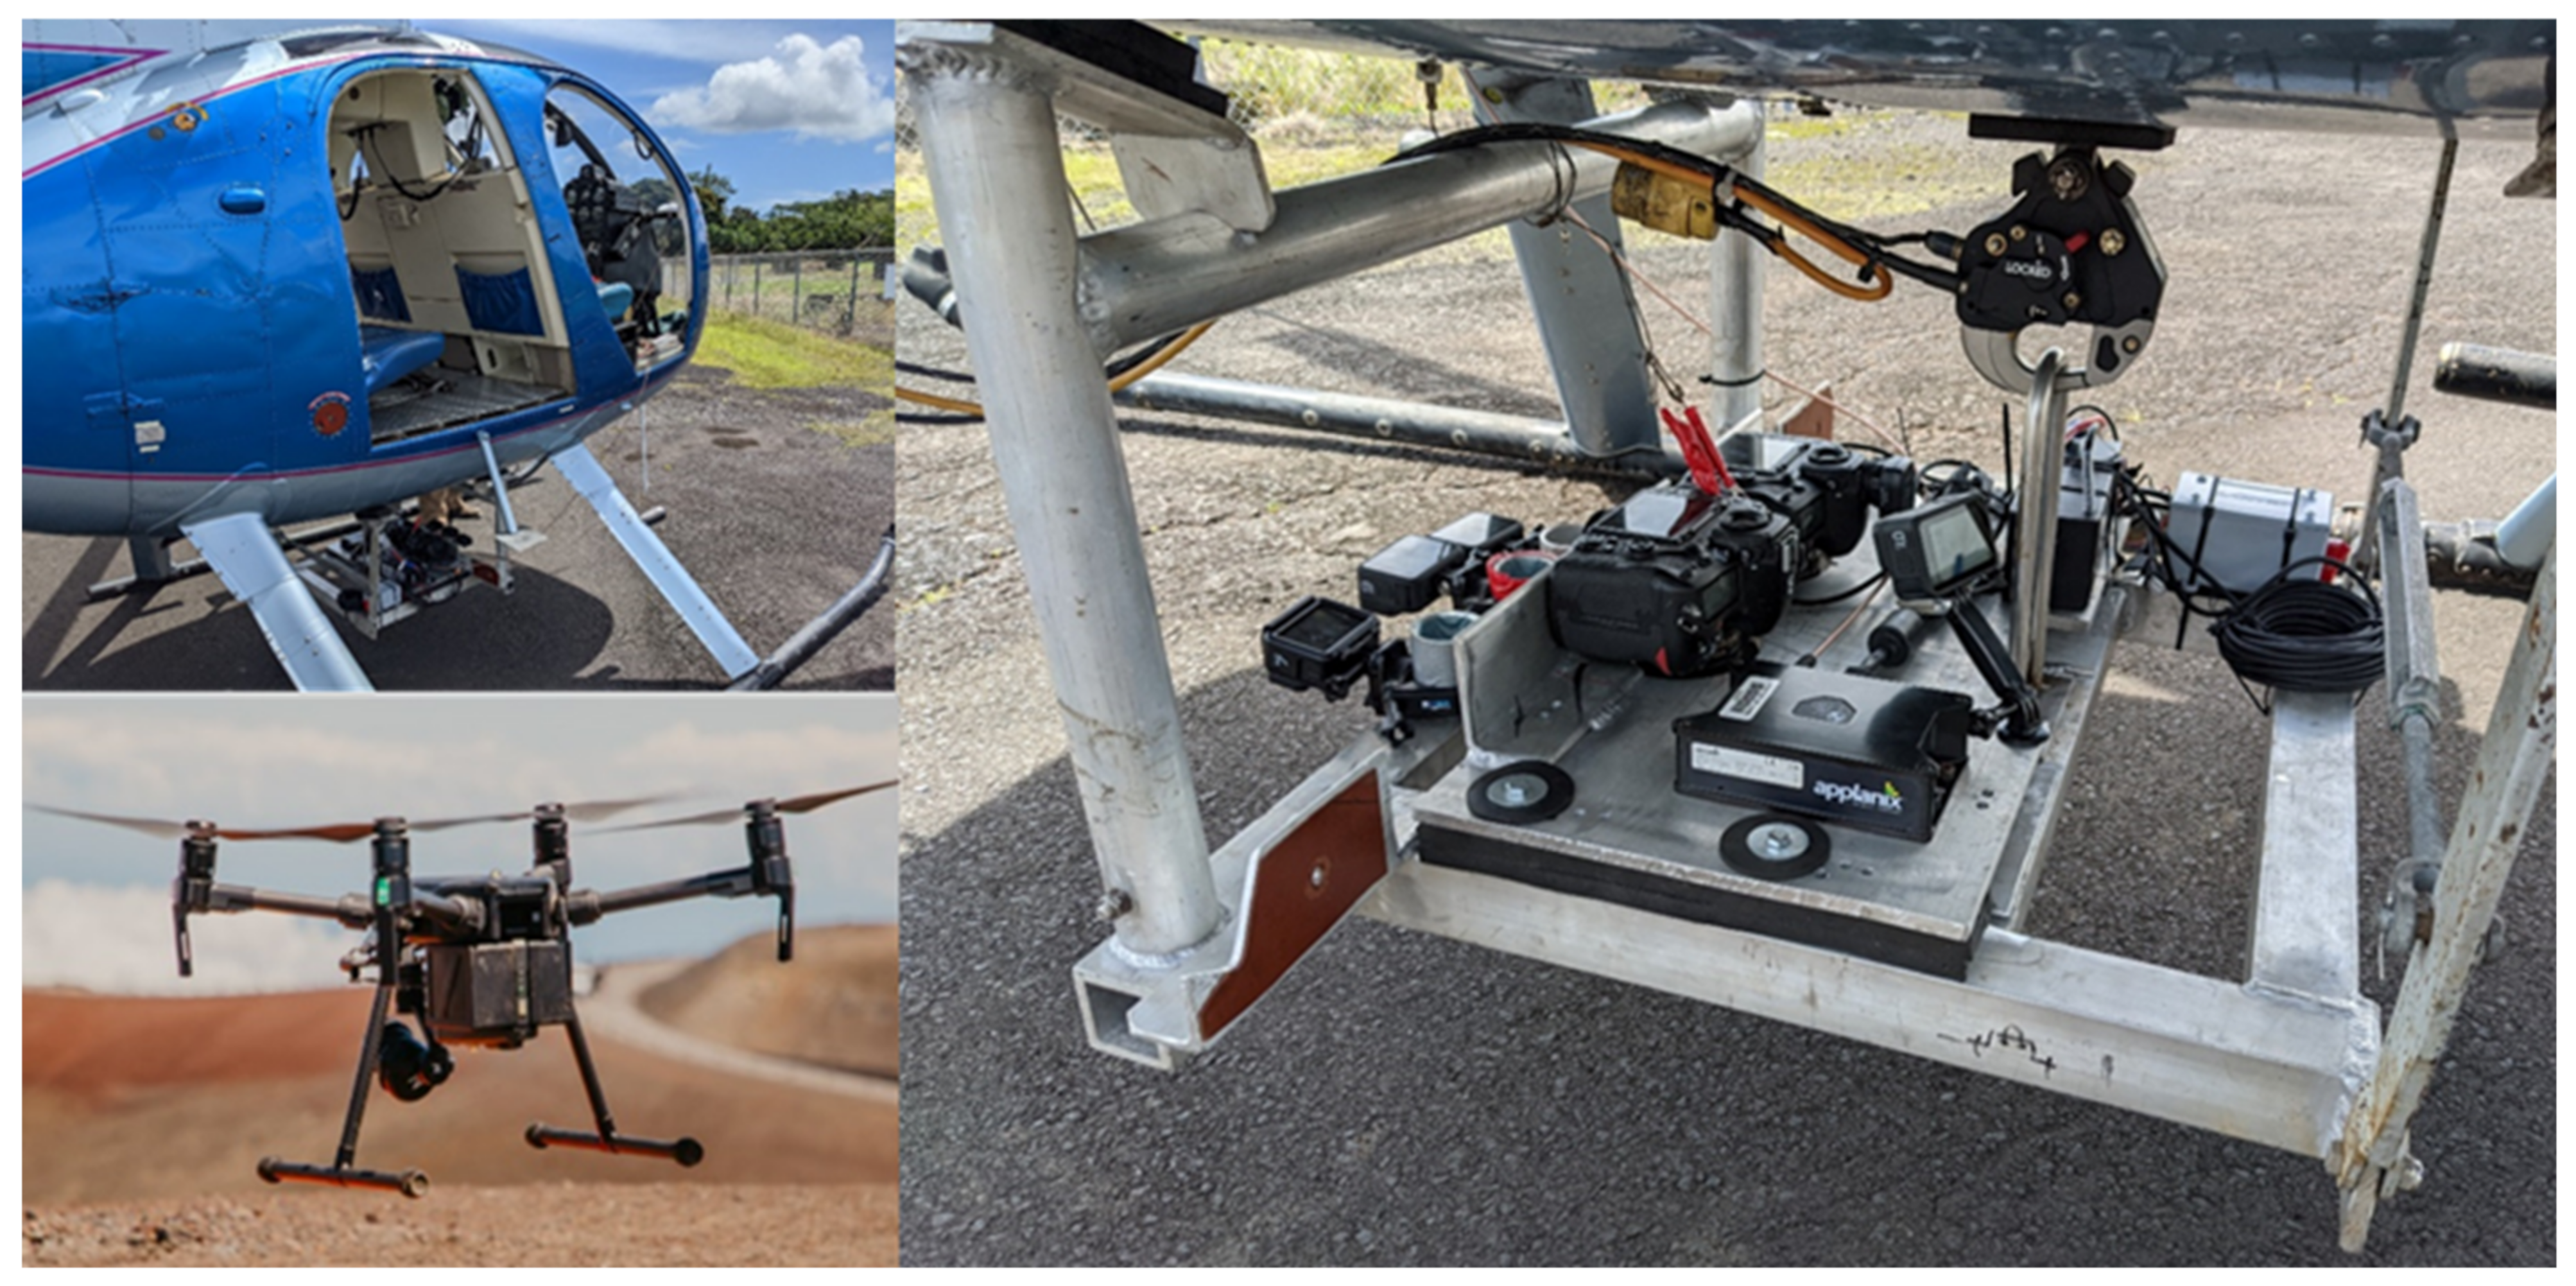
2.2. Remote Sensing Platforms and Imaging Campaigns
2.2.1. sUAS Operations
2.2.2. Manned Helicopter Imaging Operations
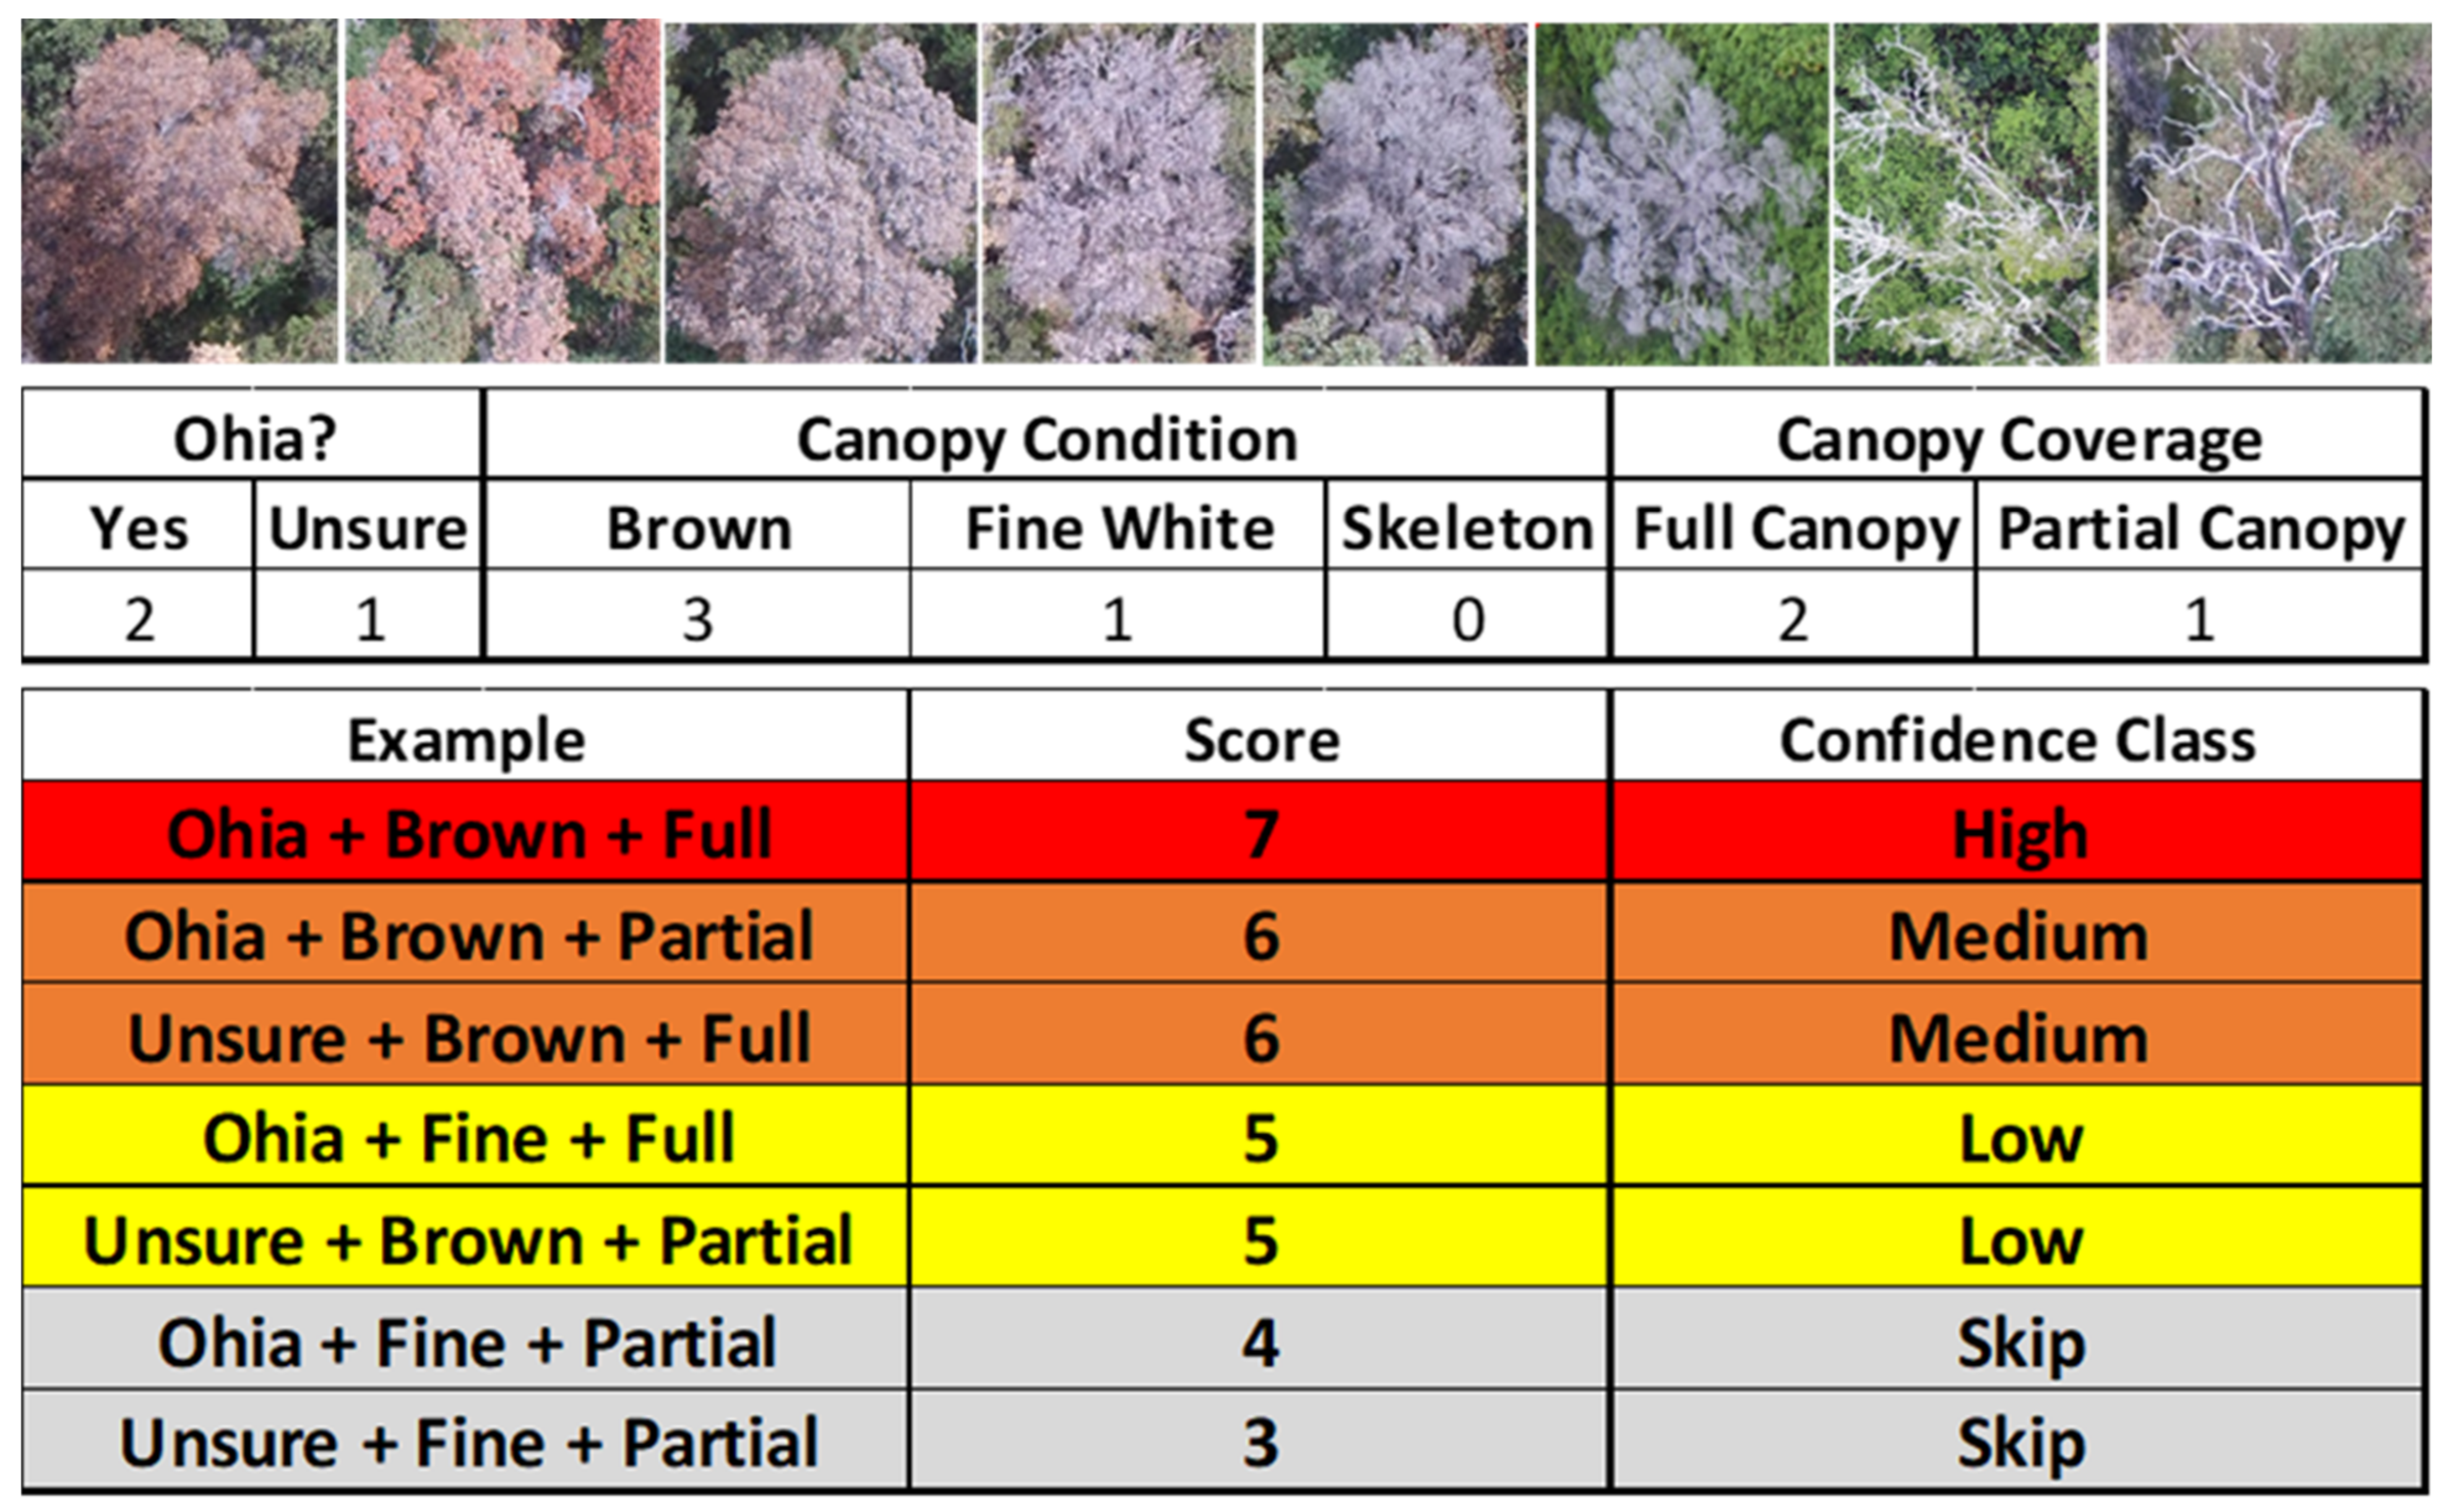
2.3. Suspect Tree Detection and Confidence Rating
2.4. Determination of Spatial Densities of Suspect ROD Trees
2.5. Sampling and Laboratory Analyses
3. Results
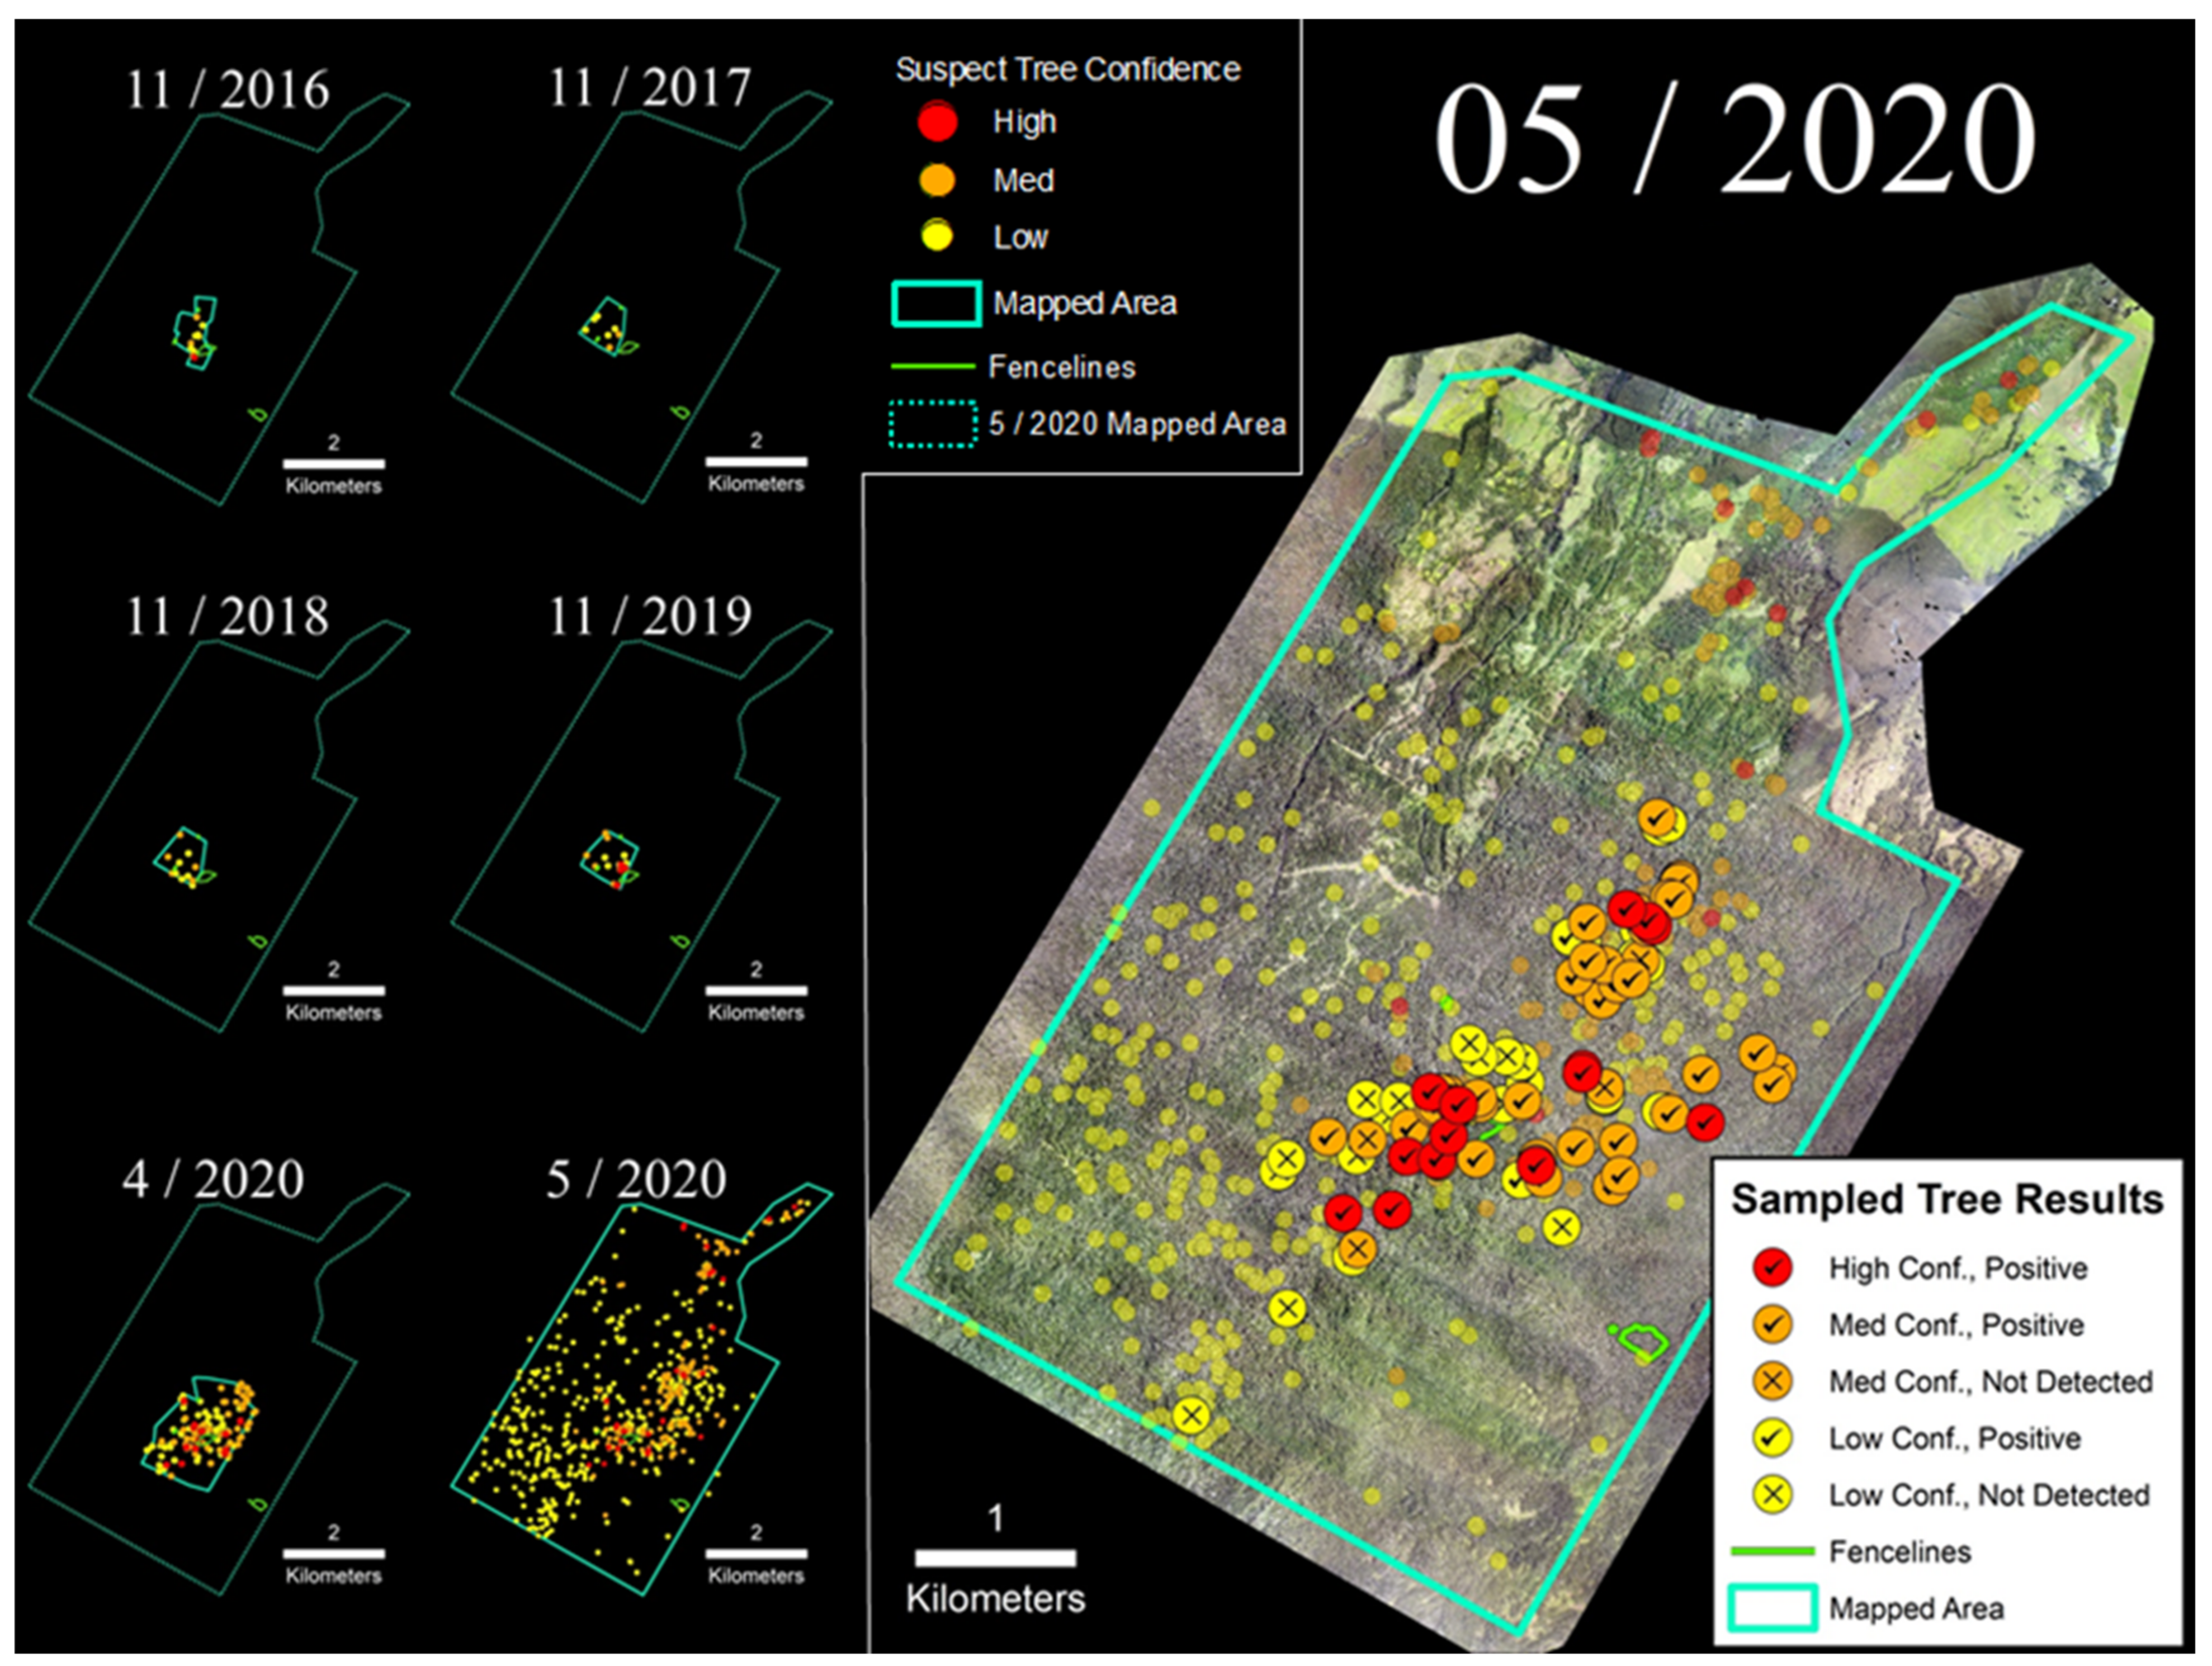
3.1. Laupāhoehoe Forest Reserve (LFR)
3.2. ‘Ōla‘a Tract
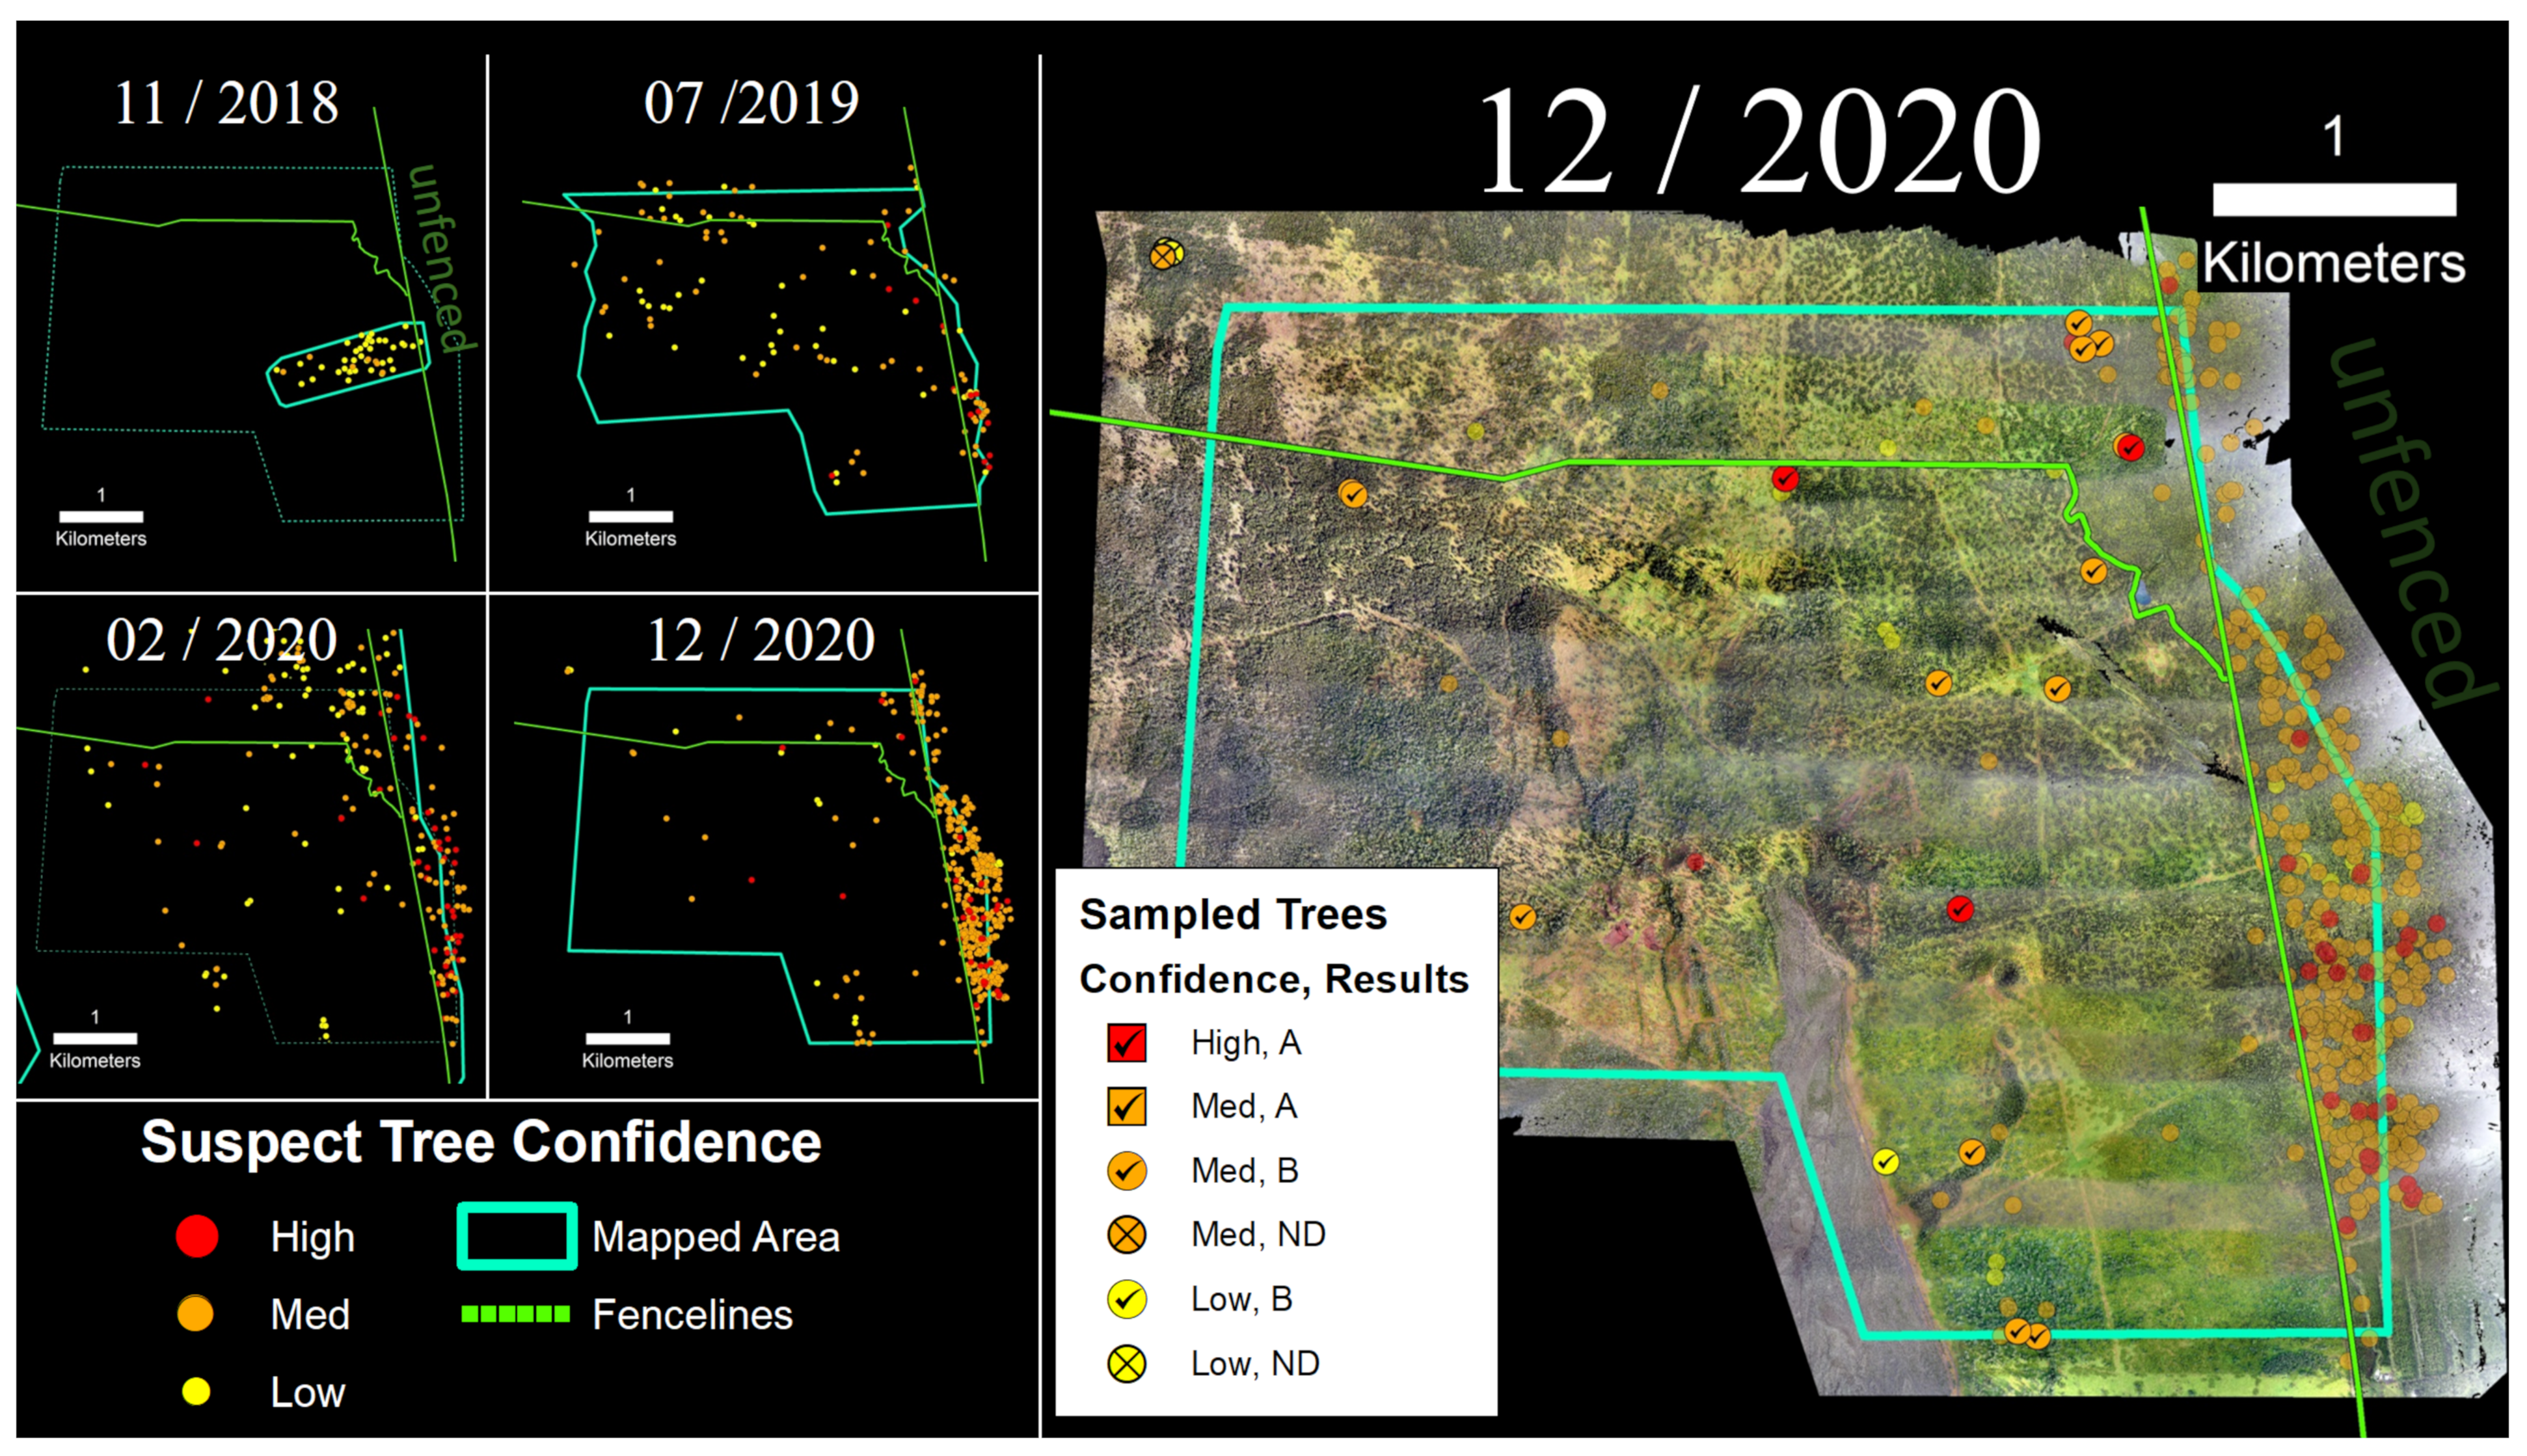
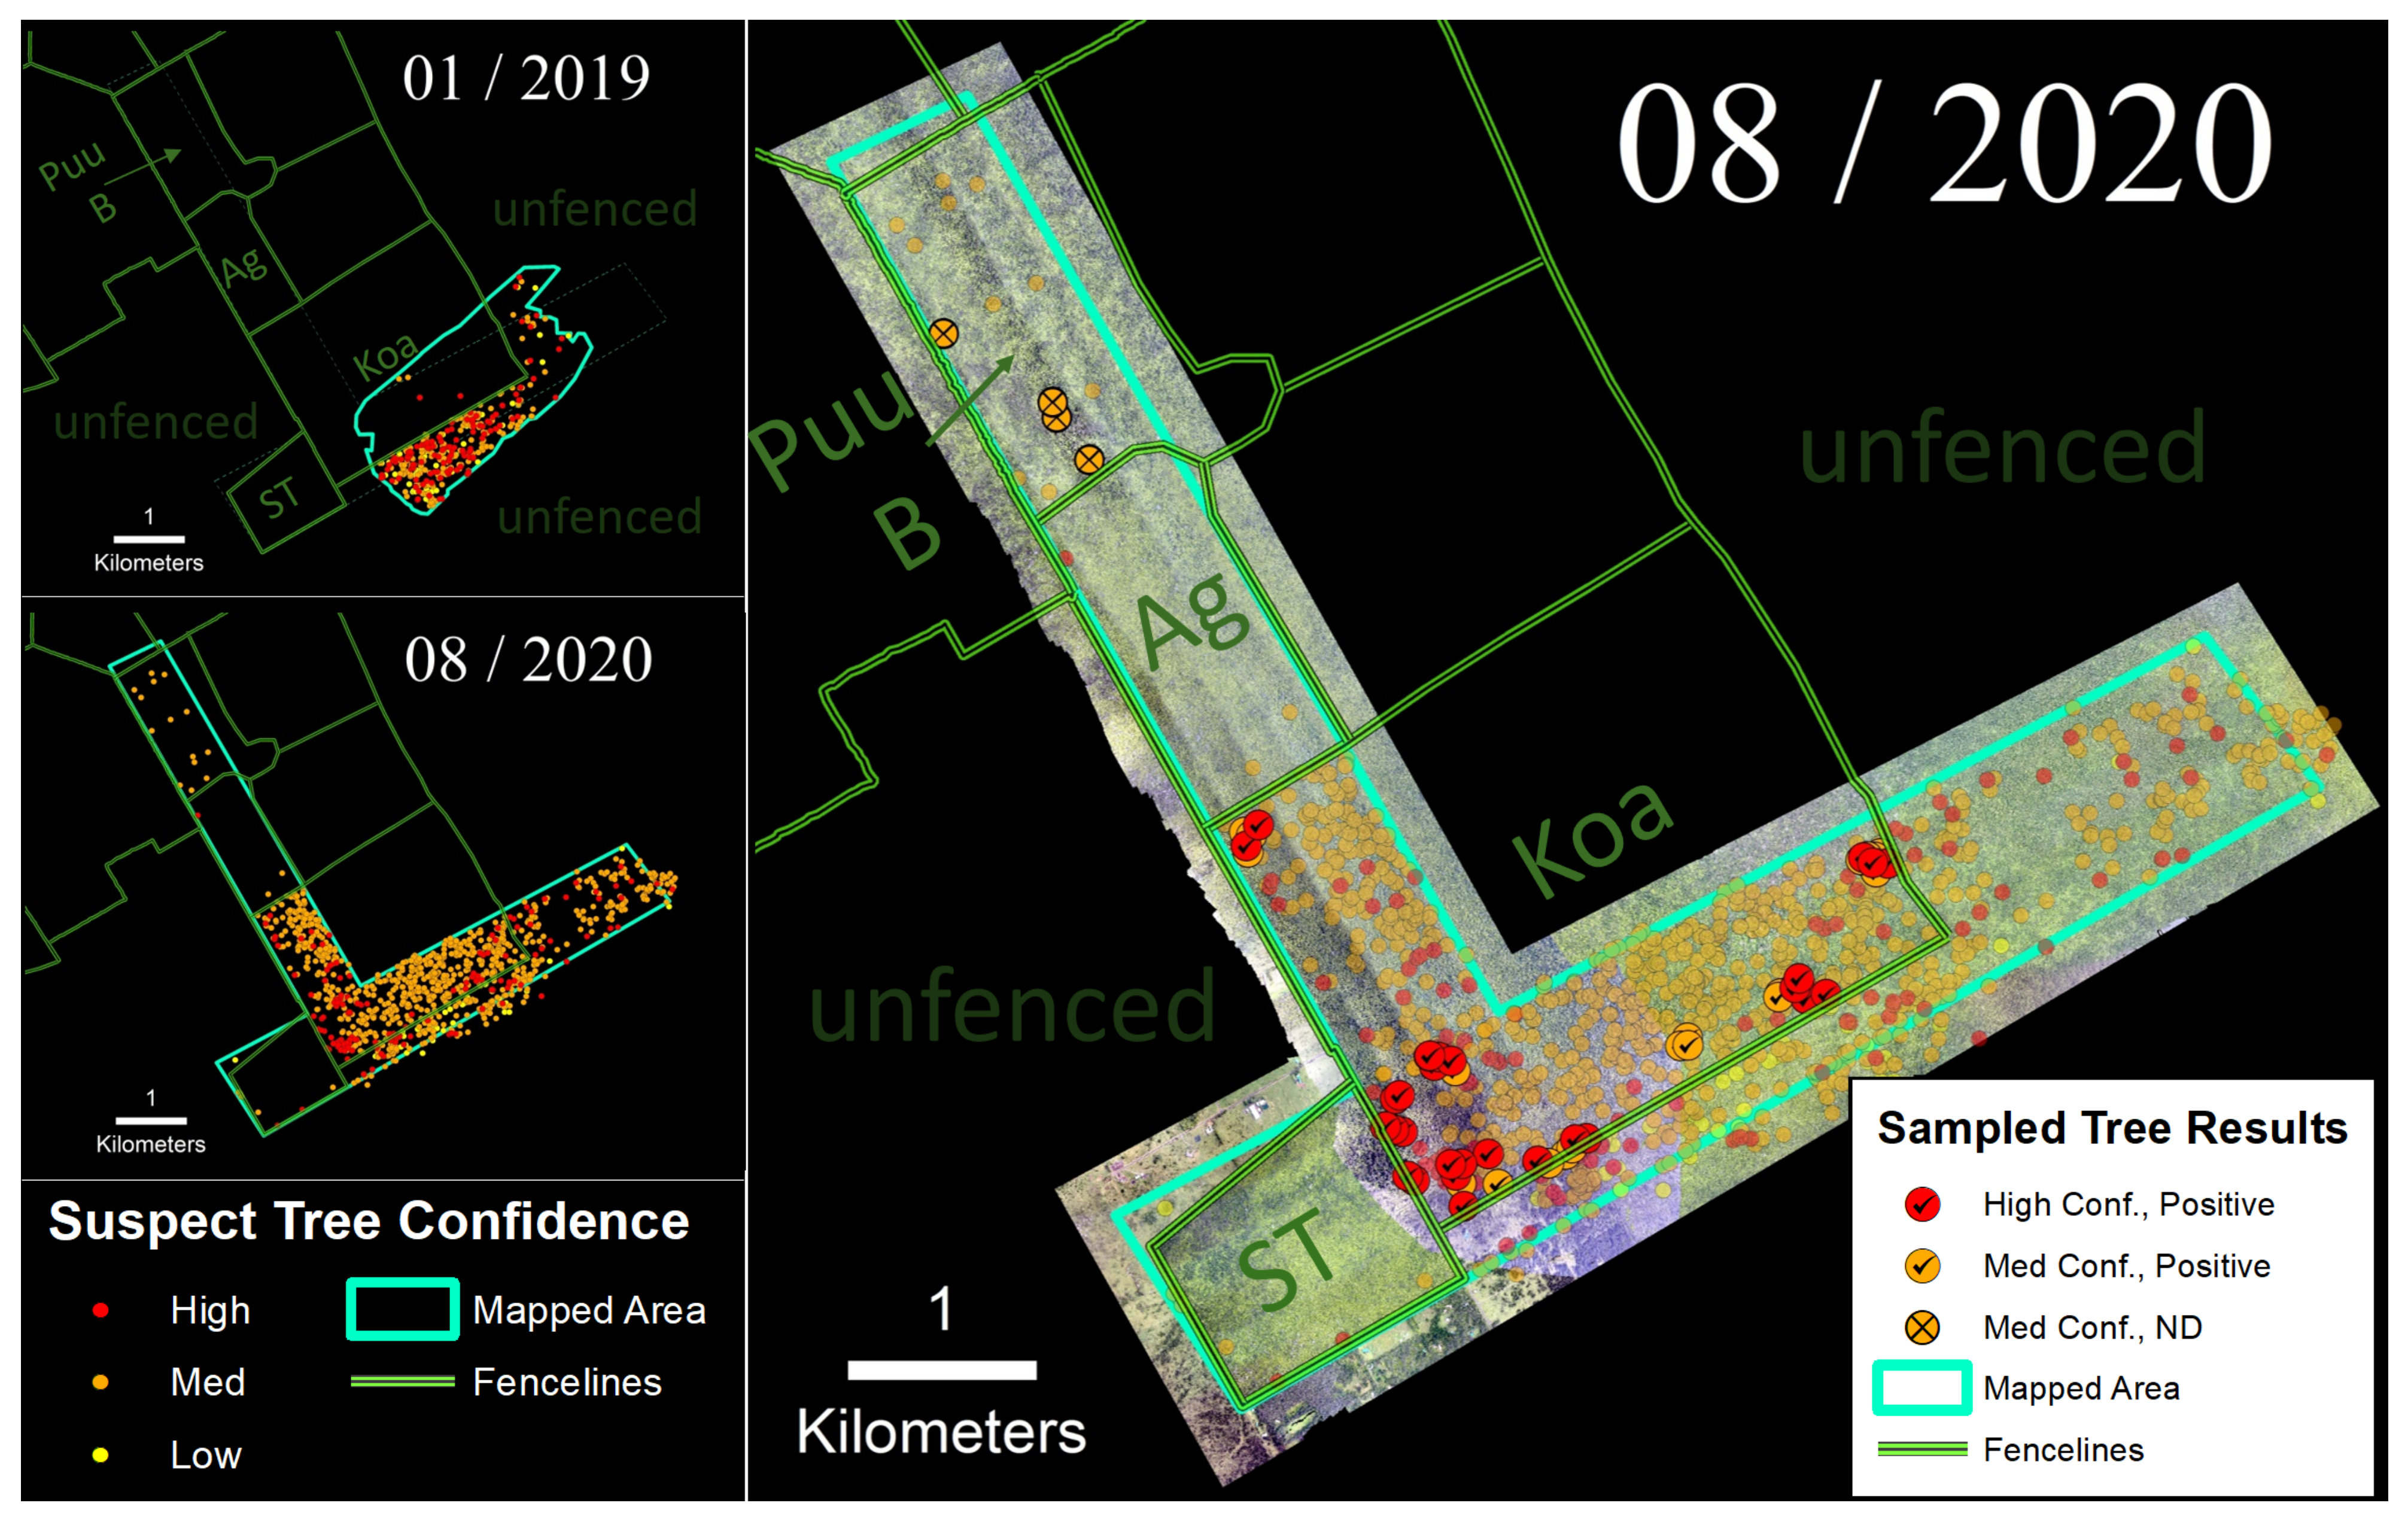
3.3. Kahuku Unit
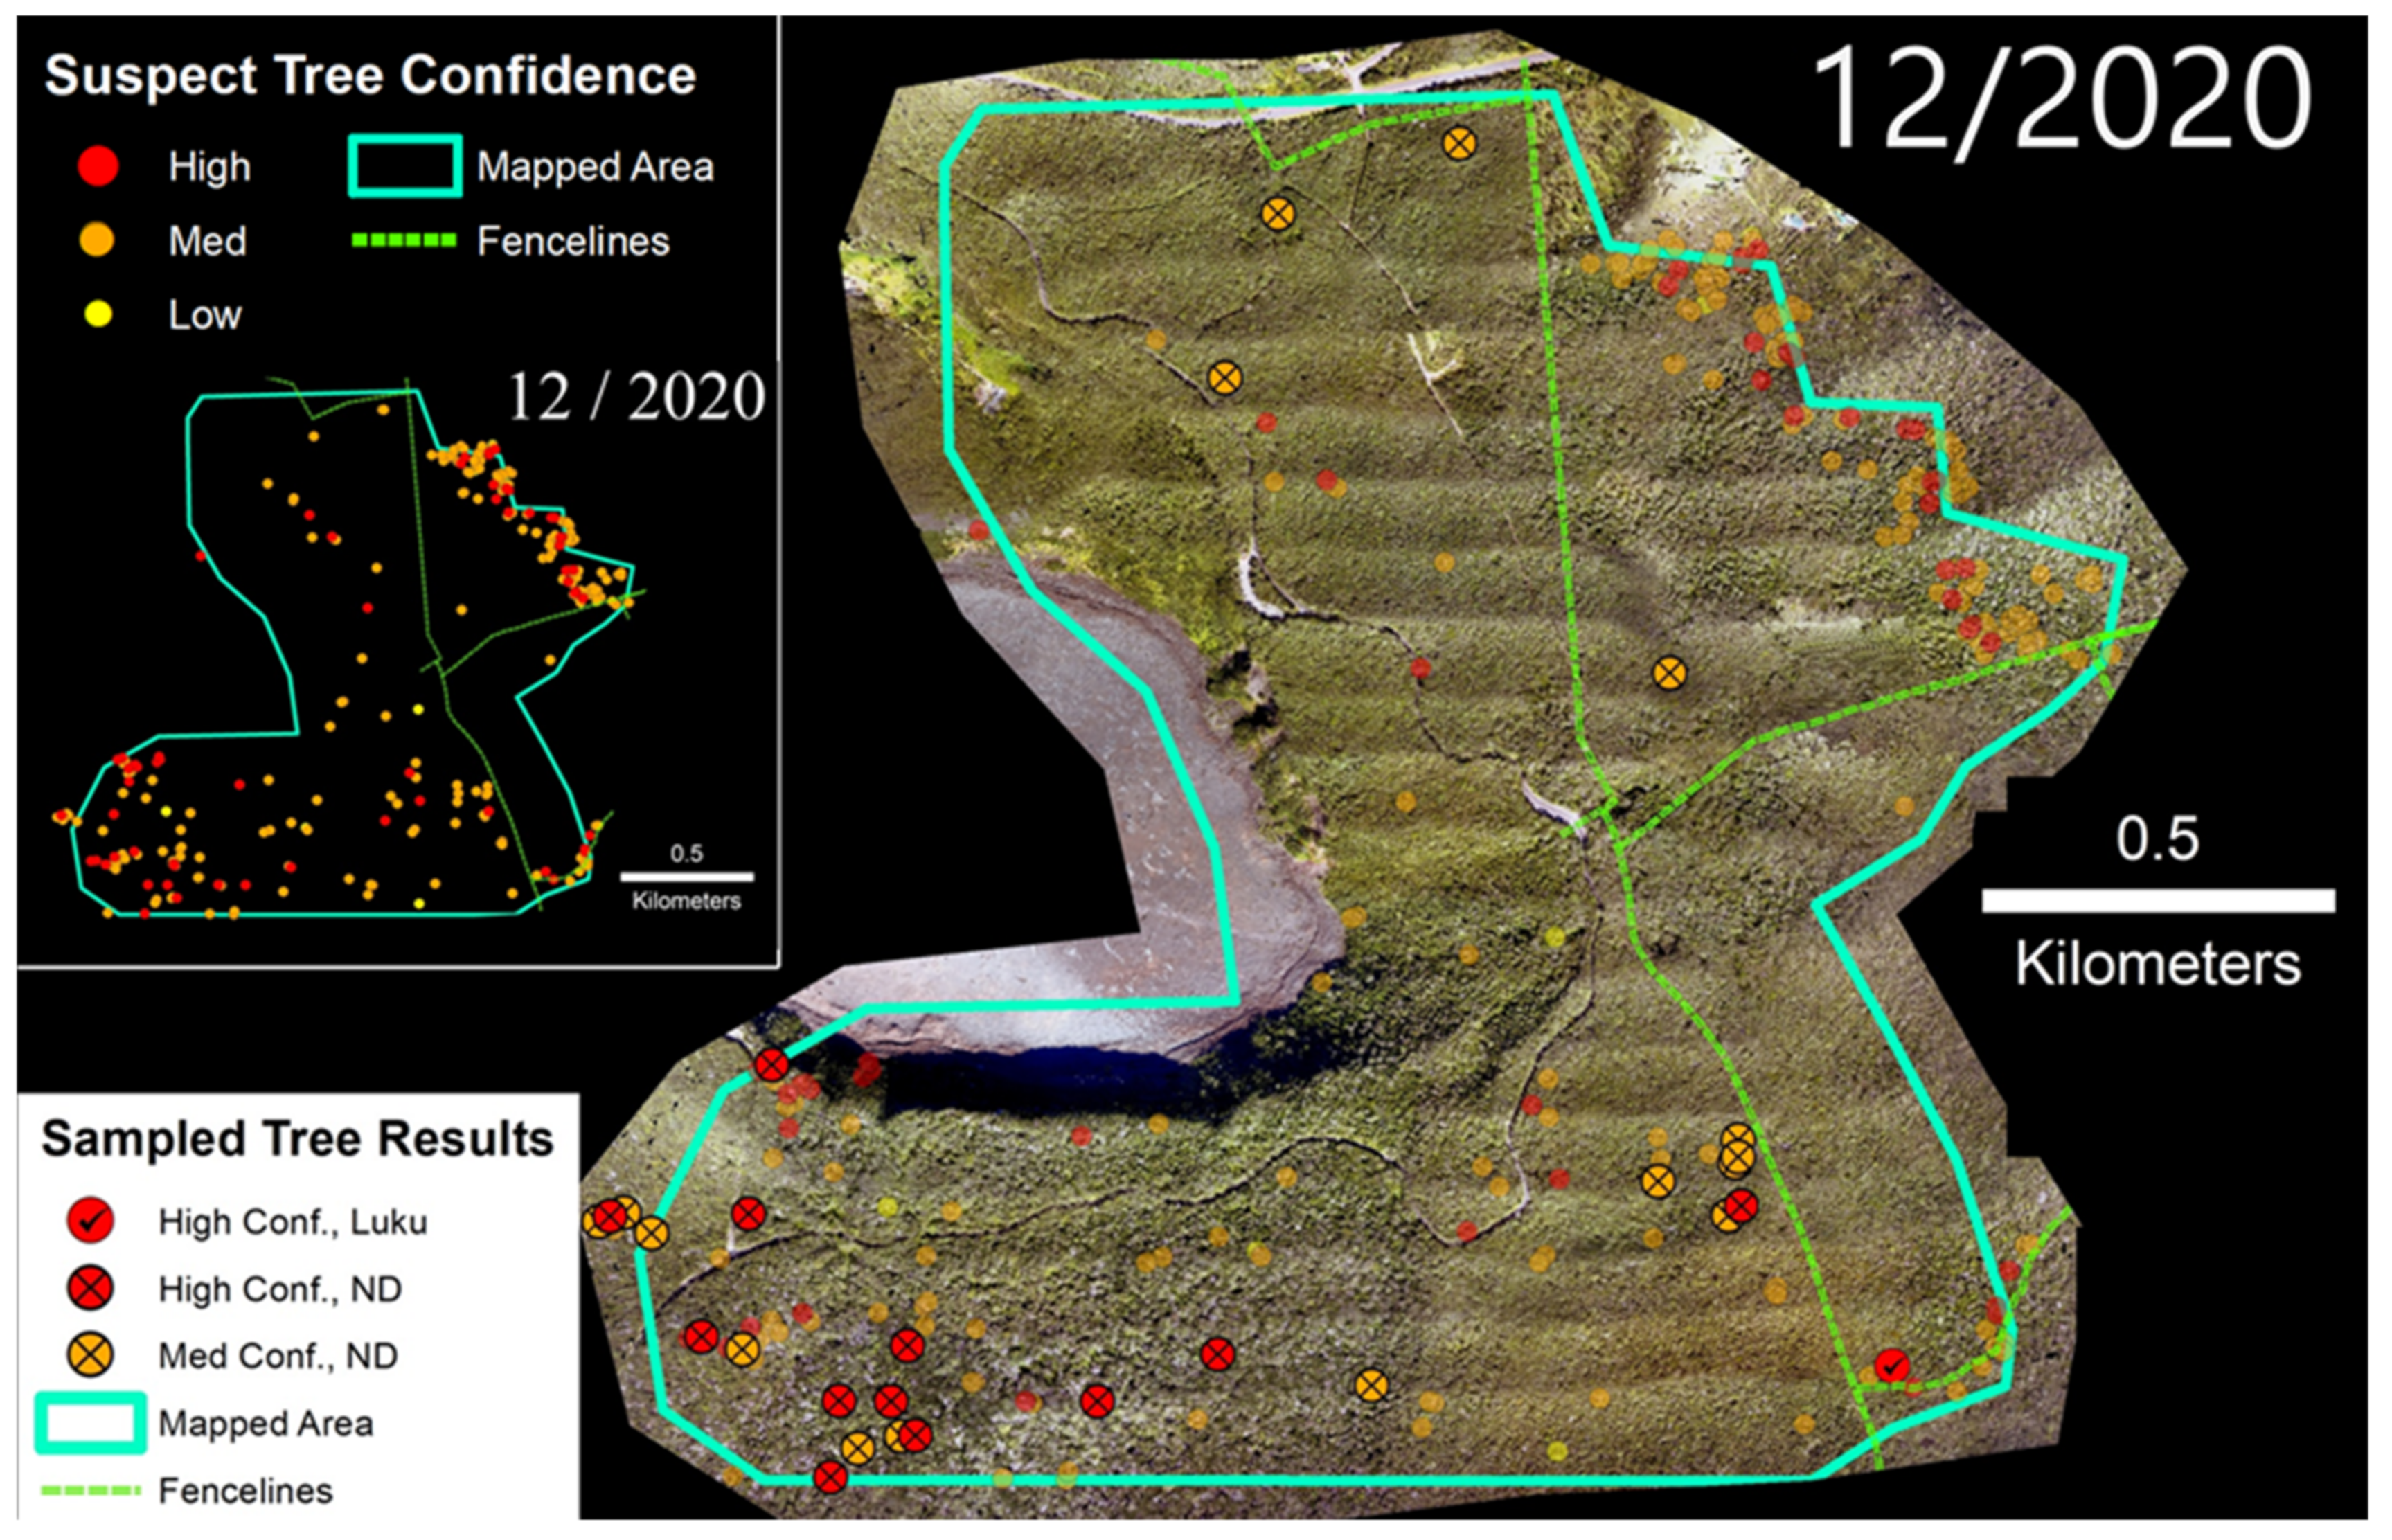
3.4. Thurston Unit
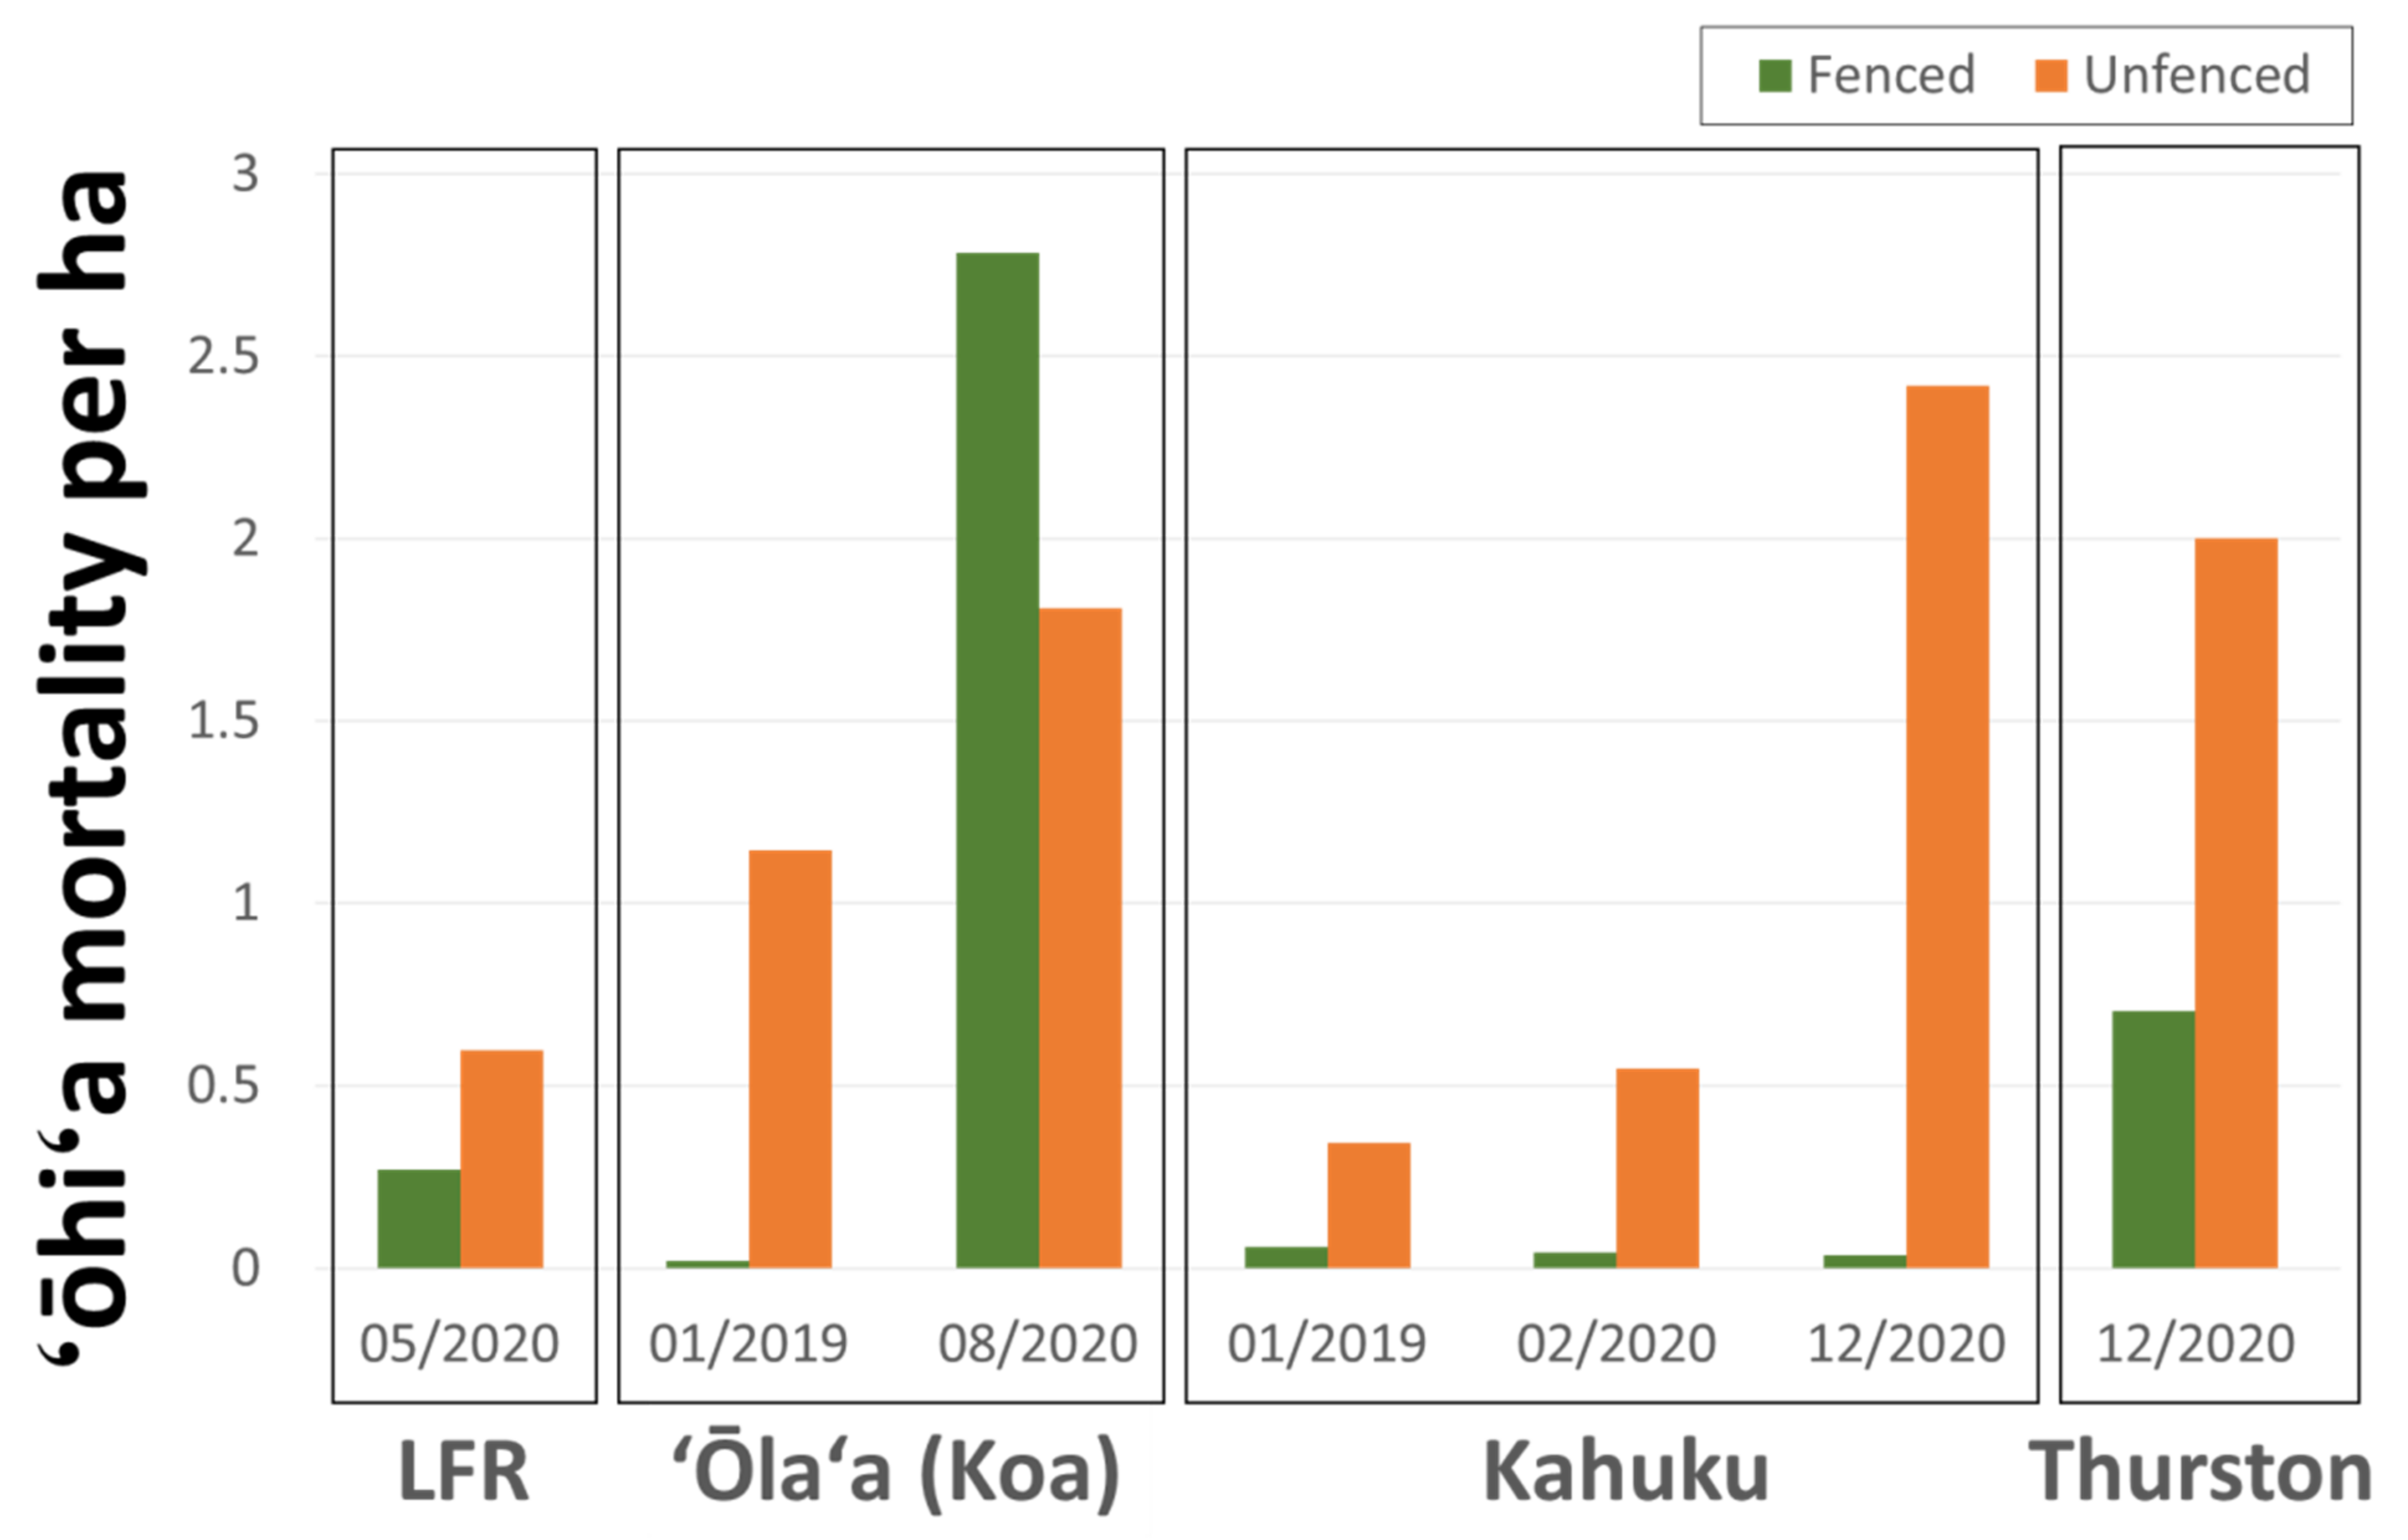
3.5. Ungulate Presence and ROD-Related ‘Ōhi‘a Mortality
4. Discussion
4.1. Confidence Ratings and Laboratory Sample Results
4.2. Ungulates, Fence Lines, and Spatial Patterns of ROD-Related ‘Ōhi‘a Mortality
5. Conclusions
Author Contributions
Funding
Data Availability Statement
Acknowledgments
Conflicts of Interest
References
- Charnley, S.; Carothers, C.; Satterfield, T.; Levine, A.; Poe, M.R.; Norman, K.; Donatuto, J.; Breslow, S.J.; Mascia, M.B.; Levin, P.S.; et al. Evaluating the best available social science for natural resource management decision-making. Environ. Sci. Policy 2017, 73, 80–88. [Google Scholar] [CrossRef]
- Esmail, B.A.; Geneletti, D. Multi-criteria decision analysis for nature conservation: A review of 20 years of applications. Methods Ecol. Evol. 2018, 9, 42–53. [Google Scholar] [CrossRef] [Green Version]
- Soliku, O.; Schraml, U. Making sense of protected area conflicts and management approaches: A review of causes, contexts and conflict management strategies. Biol. Conserv. 2018, 222, 136–145. [Google Scholar] [CrossRef]
- Yousefpour, R.; Temperli, C.; Jacobsen, J.B.; Thorsen, B.J.; Meilby, H.; Lexer, M.J.; Lindner, M.; Bugmann, H.; Borges, J.G.; Palma, J.H.N.; et al. A framework for modeling adaptive forest management and decision making under climate change. Ecol. Soc. 2017, 22, 40. [Google Scholar] [CrossRef]
- Chuvieco, E.; Aguado, I.; Salas, J.; García, M.; Yebra, M.; Oliva, P. Satellite remote sensing contributions to wildland fire science and management. Curr. For. Rep. 2020, 6, 81–96. [Google Scholar] [CrossRef]
- Feng, Y.; Negrón-Juárez, R.I.; Chambers, J.Q. Remote sensing and statistical analysis of the effects of hurricane María on the forests of Puerto Rico. Remote Sens. Environ. 2020, 247, 111940. [Google Scholar] [CrossRef]
- Pontius, J.; Schaberg, P.; Hanavan, R. Remote sensing for early, detailed, and accurate detection of forest disturbance and decline for protection of biodiversity. In Remote Sensing of Plant Biodiversity; Springer: Cham, Switzerland, 2020; pp. 121–154. [Google Scholar]
- Senf, C.; Seidl, R.; Hostert, P. Remote sensing of forest insect disturbances: Current state and future directions. Int. J. Appl. Earth Obs. Geoinf. 2017, 60, 49–60. [Google Scholar] [CrossRef] [Green Version]
- Lechner, A.M.; Foody, G.M.; Boyd, D.S. Applications in remote sensing to forest ecology and management. One Earth 2020, 2, 405–412. [Google Scholar] [CrossRef]
- Sharma, L.K.; Gupta, R.; Pandey, P.C. Future aspects and potential of the remote sensing technology to meet the natural resource needs. In Advances in Remote Sensing for Natural Resource Monitoring; John Wiley & Sons, Ltd.: Hoboken, NJ, USA, 2021; pp. 445–464. ISBN 978-1-119-61601-6. [Google Scholar]
- Waser, L.T.; Ginzler, C.; Rehush, N. Wall-to-wall tree type mapping from countrywide airborne remote sensing surveys. Remote Sens. 2017, 9, 766. [Google Scholar] [CrossRef] [Green Version]
- Coleman, T.W.; Graves, A.D.; Heath, Z.; Flowers, R.W.; Hanavan, R.P.; Cluck, D.R.; Ryerson, D. Accuracy of aerial detection surveys for mapping insect and disease disturbances in the United States. For. Ecol. Manag. 2018, 430, 321–336. [Google Scholar] [CrossRef]
- Sylvain, J.-D.; Drolet, G.; Brown, N. Mapping dead forest cover using a deep convolutional neural network and digital aerial photography. ISPRS J. Photogramm. Remote Sens. 2019, 156, 14–26. [Google Scholar] [CrossRef]
- Hughes, M.A.; Juzwik, J.; Harrington, T.C.; Keith, L.M. Pathogenicity, symptom development, and colonization of metrosideros polymorpha by Ceratocystis Lukuohia. Plant. Dis. 2020, 104, 2233–2241. [Google Scholar] [CrossRef]
- Keith, L.M.; Hughes, R.F.; Sugiyama, L.S.; Heller, W.P.; Bushe, B.C.; Friday, J.B. First report of Ceratocystis wilt on Ohia (Metrosideros polymorpha). Plant Disease 2015, 99, 1276. [Google Scholar] [CrossRef] [Green Version]
- Friday, J.B.; Herbert, D.A. Metrosideros Polymorpha (‘ōhi‘a), ver 3.2. In Species Profiles for Pacific Island Agroforestry; Elevitch, C.R., Ed.; Permanent Agricultural Resources (PAR): Holualoa, Hawaii, 2006; Available online: http://www.traditionaltree.org (accessed on 2 August 2021).
- Akashi, Y.; Mueller-Dombois, D. A landscape perspective of the Hawaiian rain forest Dieback. J. Veg. Sci. 1995, 6, 449–464. [Google Scholar] [CrossRef]
- Camp, R.J.; LaPointe, D.A.; Hart, P.J.; Sedgwick, D.E.; Canale, L.K. Large-scale tree mortality from rapid ohia death negatively influences avifauna in Lower Puna, Hawaii Island, USA. Condor 2019, 121, duz007. [Google Scholar] [CrossRef]
- Barnes, I.; Fourie, A.; Wingfield, M.J.; Harrington, T.C.; McNew, D.L.; Sugiyama, L.S.; Luiz, B.C.; Heller, W.P.; Keith, L.M. New Ceratocystis species associated with rapid death of Metrosideros Olymorpha in Hawaii. Persoonia Mol. Phylogeny Evol. Fungi 2018, 40, 154–181. [Google Scholar] [CrossRef] [Green Version]
- Mortenson, L.A.; Flint Hughes, R.; Friday, J.B.; Keith, L.M.; Barbosa, J.M.; Friday, N.J.; Liu, Z.; Sowards, T.G. Assessing spatial distribution, stand impacts and rate of Ceratocystis fimbriata induced ohia (Metrosideros polymorpha) mortality in a tropical wet forest, Hawaii Island, USA. For. Ecol. Manag. 2016, 377, 83–92. [Google Scholar] [CrossRef] [Green Version]
- Perroy, R.L.; Hughes, M.; Keith, L.M.; Collier, E.; Sullivan, T.; Low, G. Examining the utility of visible near-infrared and optical remote sensing for the early detection of Rapid Ohia Death. Remote Sens. 2020, 12, 1846. [Google Scholar] [CrossRef]
- Brill, E.; Hughes, M.A.; Heller, W.P.; Keith, L.M. First report of Ceratocystis lukuohia on Metrosideros olymorpha on the Island of Kauai, Hawaii. Plant Dis. 2019, 103, 2961. [Google Scholar] [CrossRef]
- Asner, G.P.; Martin, R.E.; Keith, L.M.; Heller, W.P.; Hughes, M.A.; Vaughn, N.R.; Hughes, R.F.; Balzotti, C. A spectral mapping signature for the Rapid Ohia Death (ROD) pathogen in Hawaiian forests. Remote Sens. 2018, 10, 404. [Google Scholar] [CrossRef] [Green Version]
- Vaughn, N.R.; Asner, G.P.; Brodrick, P.G.; Martin, R.E.; Heckler, J.W.; Knapp, D.E.; Hughes, R.F. An approach for high-resolution mapping of Hawaiian Metrosideros forest mortality using laser-guided imaging spectroscopy. Remote Sens. 2018, 10, 502. [Google Scholar] [CrossRef] [Green Version]
- Potter, K.M.; Conkling, B.L. Large-Scale Patterns of Insect and Disease Activity in the Conterminous United States, Alaska and Hawaii from the National Insect and Disease Survey, 2015; US Department of Agriculture, Forest Service, Research: Asheville, NC, USA, 2017. [Google Scholar]
- Weller, S.G.; Sakai, A.K.; Clark, M.; Lorence, D.H.; Flynn, T.; Kishida, W.; Tangalin, N.; Wood, K. The effects of introduced ungulates on native and alien plant species in an island ecosystem: Implications for change in a diverse mesic forest in the Hawaiian Islands. For. Ecol. Manag. 2018, 409, 518–526. [Google Scholar] [CrossRef]
- Spear, D.; Chown, S.L. Non-indigenous ungulates as a threat to biodiversity. J. Zool. 2009, 279, 1–17. [Google Scholar] [CrossRef]
- Hughes, R.F.; Asner, G.P.; Baldwin, J.A.; Mascaro, J.; Bufil, L.K.K.; Knapp, D.E. Estimating aboveground carbon density across forest landscapes of Hawaii: Combining FIA plot-derived estimates and airborne LiDAR. For. Ecol. Manag. 2018, 424, 323–337. [Google Scholar] [CrossRef]
- Inman-Narahari, F.; Ostertag, R.; Cordell, S.; Giardina, C.P.; Nelson-Kaula, K.; Sack, L. Seedling recruitment factors in low-diversity Hawaiian wet forest: Towards global comparisons among tropical forests. Ecosphere 2013, 4, 1–19. [Google Scholar] [CrossRef]
- Pratt, L.W.; Abbott, L.L. Rare Plants within Managed Units of ’Ola’a Forest, Hawaii Volcanoes National Park; Cooperative National Park Resources Studies Unit Technical Report 115; Department of Botany, University of Hawaii at Manoa: Honolulu, HI, USA, 1997. [Google Scholar]
- Giambelluca, T.W.; Shuai, X.; Barnes, M.L.; Alliss, R.J.; Longman, R.J.; Miura, T.; Chen, Q.; Frazier, A.G.; Mudd, R.G.; Cuo, L. Evapotranspiration of Hawaii. Final Rep. Submitt. US Army Corps Eng. Dist. Comm. Water Resour. Manag. State Hawaii 2014, 13, 766. [Google Scholar]
- Giambelluca, T.W.; Chen, Q.; Frazier, A.G.; Price, J.P.; Chen, Y.-L.; Chu, P.-S.; Eischeid, J.K.; Delparte, D.M. Online rainfall atlas of Hawaii. Bull. Am. Meteorol. Soc. 2013, 94, 313–316. [Google Scholar] [CrossRef]
- Wolfe, E.W.; Wise, W.S.; Dalrymple, G.B. The Geology and Petrology of Mauna Kea Volcano, Hawaii; A Study of Postshield Volcanism; U.S. Geological Survey Professional Paper; U.S. Government Publishing Office: Washington, DC, USA, 1997; Volume 1557.
- Heller, W.P.; Keith, L.M. Real-time PCR assays to detect and distinguish the rapid Ohia death pathogens Ceratocystis Lukuohia and C. huliohia. Phytopathology 2018, 108, 1395–1401. [Google Scholar] [CrossRef] [Green Version]
- Davis, C. Notes on Forest Insect Conditions, Hawaii National Park for the Year 1946; Mimeo. Report; US Department of Interior, National Park Service: Washington, DC, USA, 1947; 7p.
- Hodges, C.S.; Adee, K.T.; Stein, J.D.; Wood, H.B.; Doty, R.D. Decline of Ohia (Metrosideros polymorpha) in Hawaii: A review. In General Technical Report PSW-86; U.S. Department of Agriculture, Forest Service, Pacific Southwest Forest and Range Experiment Station: Berkeley, CA, USA, 1986; Volume 86, 22p. [Google Scholar] [CrossRef]
- Mertelmeyer, L.; Jacobi, J.D.; Mueller-Dombois, D.; Brinck, K.; Boehmer, H.J.; Ward, D. Regeneration of Metrosideros Polymorpha forests in Hawaii after landscape-level canopy dieback. J. Veg. Sci. 2019, 30, 146–155. [Google Scholar] [CrossRef] [Green Version]
- Barton, K.E.; Jones, C.; Edwards, K.F.; Shiels, A.B.; Knight, T. Local adaptation constrains drought tolerance in a tropical foundation tree. J. Ecol. 2020, 108, 1540–1552. [Google Scholar] [CrossRef]
- Tunison, J.T.; Loh, R.L.; Leialoha, J.A. Fire Effects in the Submontane Seasonal Zone, Hawaii Volcanoes National Park; Cooperative National Park Resources Studies Unit Technical Report 97; Department of Botany, University of Hawaii at Manoa: Honolulu, HI, USA, 1995. [Google Scholar]
- Westerband, A.C.; Kagawa-Viviani, A.K.; Bogner, K.K.; Beilman, D.W.; Knight, T.M.; Barton, K.E. Seedling drought tolerance and functional traits vary in response to the timing of water availability in a keystone Hawaiian tree species. Plant. Ecol. 2019, 220, 321–344. [Google Scholar] [CrossRef]
- Chan, A.H.Y.; Barnes, C.; Swinfield, T.; Coomes, D.A. Monitoring ash dieback (Hymenoscyphus fraxineus) in British forests using hyperspectral remote sensing. Remote Sens. Ecol. Conserv. 2021, 7, 306–320. [Google Scholar] [CrossRef]
- Fallon, B.; Yang, A.; Lapadat, C.; Armour, I.; Juzwik, J.; Montgomery, R.A.; Cavender-Bares, J. Spectral differentiation of oak wilt from foliar fungal disease and drought is correlated with physiological changes. Tree Physiol. 2020, 40, 377–390. [Google Scholar] [CrossRef] [PubMed]
- Heim, R.H.J.; Wright, I.J.; Scarth, P.; Carnegie, A.J.; Taylor, D.; Oldeland, J. Multispectral, aerial disease detection for myrtle rust (Austropuccinia psidii) on a lemon myrtle plantation. Drones 2019, 3, 25. [Google Scholar] [CrossRef] [Green Version]
- Sandino, J.; Pegg, G.; Gonzalez, F.; Smith, G. Aerial mapping of forests affected by pathogens using UAVs, hyperspectral sensors, and artificial intelligence. Sensors 2018, 18, 944. [Google Scholar] [CrossRef] [Green Version]
- Natesan, S.; Armenakis, C.; Vepakomma, U. Resnet-based tree species classification using UAV images. In Proceedings of the ISPRS Geospatial Week 2019, Enschede, The Netherlands, 10–14 June 2019; Volume 7. [Google Scholar]
- Schiefer, F.; Kattenborn, T.; Frick, A.; Frey, J.; Schall, P.; Koch, B.; Schmidtlein, S. Mapping forest tree species in high resolution UAV-based RGB-imagery by means of convolutional neural networks. ISPRS J. Photogramm. Remote Sens. 2020, 170, 205–215. [Google Scholar] [CrossRef]
- Safonova, A.; Tabik, S.; Alcaraz-Segura, D.; Rubtsov, A.; Maglinets, Y.; Herrera, F. Detection of fir trees (Abies sibirica) damaged by the bark beetle in unmanned aerial vehicle images with deep learning. Remote Sens. 2019, 11, 643. [Google Scholar] [CrossRef] [Green Version]
- Komárek, J. The perspective of unmanned aerial systems in forest management: Do we really need such details? Appl. Veg. Sci. 2020, 23, 718–721. [Google Scholar] [CrossRef]
- Kattenborn, T.; Leitloff, J.; Schiefer, F.; Hinz, S. Review on Convolutional Neural Networks (CNN) in vegetation remote sensing. ISPRS J. Photogramm. Remote Sens. 2021, 173, 24–49. [Google Scholar] [CrossRef]
- Housman, I.W.; Chastain, R.A.; Finco, M.V. An evaluation of forest health insect and disease survey data and satellite-based remote sensing forest change detection methods: Case studies in the United States. Remote Sens. 2018, 10, 1184. [Google Scholar] [CrossRef] [Green Version]
- Haghighian, F.; Yousefi, S.; Keesstra, S. Identifying tree health using sentinel-2 images: A case study on Tortrix viridana, L. Infected oak trees in Western Iran. Geocarto Int. 2020, 1, 1–11. [Google Scholar] [CrossRef]
- Lastovicka, J.; Svec, P.; Paluba, D.; Kobliuk, N.; Svoboda, J.; Hladky, R.; Stych, P. Sentinel-2 data in an evaluation of the impact of the disturbances on forest vegetation. Remote Sens. 2020, 12, 1914. [Google Scholar] [CrossRef]
- Lottering, R.; Mutanga, O. Optimising the spatial resolution of worldview-2 pan-sharpened imagery for predicting levels of Gonipterus Scutellatus defoliation in KwaZulu-Natal, South Africa. ISPRS J. Photogramm. Remote Sens. 2016, 112, 13–22. [Google Scholar] [CrossRef]
- Wagner, F.H.; Sanchez, A.; Tarabalka, Y.; Lotte, R.G.; Ferreira, M.P.; Aidar, M.P.M.; Gloor, E.; Phillips, O.L.; Aragão, L.E.O.C. Using the U-net convolutional network to map forest types and disturbance in the Atlantic rainforest with very high resolution images. Remote Sens. Ecol. Conserv. 2019, 5, 360–375. [Google Scholar] [CrossRef] [Green Version]
- Dixon, D.J.; Callow, J.N.; Duncan, J.M.A.; Setterfield, S.A.; Pauli, N. Satellite prediction of forest flowering phenology. Remote Sens. Environ. 2021, 255, 112197. [Google Scholar] [CrossRef]
- Michael, Y.; Lensky, I.M.; Brenner, S.; Tchetchik, A.; Tessler, N.; Helman, D. Economic assessment of fire damage to urban forest in the wildland–urban interface using planet satellites constellation images. Remote Sens. 2018, 10, 1479. [Google Scholar] [CrossRef] [Green Version]
- Wegmueller, S.A.; Townsend, P.A. Astrape: A system for mapping severe abiotic forest disturbances using high spatial resolution satellite imagery and unsupervised classification. Remote Sens. 2021, 13, 1634. [Google Scholar] [CrossRef]
- Duffy, J.P.; Cunliffe, A.M.; DeBell, L.; Sandbrook, C.; Wich, S.A.; Shutler, J.D.; Myers-Smith, I.H.; Varela, M.R.; Anderson, K. Location, location, location: Considerations when using lightweight drones in challenging environments. Remote Sens. Ecol. Conserv. 2018, 4, 7–19. [Google Scholar] [CrossRef]
- Güldenring, J.; Gorczak, P.; Eckermann, F.; Patchou, M.; Tiemann, J.; Kurtz, F.; Wietfeld, C. Reliable long-range multi-link communication for unmanned search and rescue aircraft systems in beyond visual line of sight operation. Drones 2020, 4, 16. [Google Scholar] [CrossRef]
- McCrink, M.H.; Gregory, J.W. Design and development of a high-speed UAS for beyond visual line-of-sight operations. J. Intell. Robot. Syst. 2021, 101, 31. [Google Scholar] [CrossRef]
- Baker, S.C.; Chuter, A.; Munks, S.A.; Koch, A.J. Retention of large, old trees in alternatives to clearcutting with a comparison of ground- and helicopter-based assessments. For. Ecol. Manag. 2020, 475, 118390. [Google Scholar] [CrossRef]
- Gentle, M.; Finch, N.; Speed, J.; Pople, A.; Gentle, M.; Finch, N.; Speed, J.; Pople, A. A comparison of unmanned aerial vehicles (drones) and manned helicopters for monitoring macropod populations. Wildl. Res. 2018, 45, 586–594. [Google Scholar] [CrossRef]
- Kelaher, B.P.; Peddemors, V.M.; Hoade, B.; Colefax, A.P.; Butcher, P.A. Comparison of sampling precision for nearshore marine wildlife using unmanned and manned aerial surveys. J. Unmanned Veh. Syst. 2019, 8, 30–43. [Google Scholar] [CrossRef]
- Campbell, T.A.; Long, D.B. Feral swine damage and damage management in forested ecosystems. For. Ecol. Manag. 2009, 257, 2319–2326. [Google Scholar] [CrossRef] [Green Version]
- Murphy, M.J.; Inman-Narahari, F.; Ostertag, R.; Litton, C.M. Invasive feral pigs impact native tree ferns and woody seedlings in Hawaiian Forest. Biol. Invasions 2014, 16, 63–71. [Google Scholar] [CrossRef]
- Fortini, L.B.; Kaiser, L.R.; Keith, L.M.; Price, J.; Hughes, R.F.; Jacobi, J.D.; Friday, J.B. The evolving threat of Rapid Ohia Death (ROD) to Hawaii’s native ecosystems and rare plant species. For. Ecol. Manag. 2019, 448, 376–385. [Google Scholar] [CrossRef]
- Roy, K.; Jaenecke, K.A.; Peck, R.W. Ambrosia Beetle (Coleoptera: Curculionidae) communities and frass production in Ohia (Myrtales: Myrtaceae) infected with ceratocystis (Microascales: Ceratocystidaceae) fungi responsible for Rapid Ohia Death. Environ. Entomol. 2020, 49, 1345–1354. [Google Scholar] [CrossRef]
- Roy, K.; Granthon, C.; Peck, R.W.; Atkinson, C.T. Effectiveness of Rapid Ohia Death Management Strategies at a Focal Disease Outbreak on Hawaii Island; HCSU Technical Report Series 99; University of Hawai‘i at Manoa: Honolulu, HI, USA, 2021. [Google Scholar]


| LFR | ‘Ōla‘a | Thurston | Kahuku | |
|---|---|---|---|---|
| Elevation (m) | 730–1350 | 1150–1350 | 1100–1150 | 700–1250 |
| Mean Annual Rainfall (mm) | 2800–4700 | 2800–4300 | 2400–2900 | 1100–1650 |
| Substrate Age (years) | 5000–64,000 | 5000–11,000 | 500–3000 | 1500–5000 |
| Vegetation | Hawai‘i Montane Rainforest | Hawai‘i Lowland/ Hawai‘i Montane Rainforest | Hawai‘i Montane-Subalpine Mesic Forest | Hawai‘i Lowland Mesic Forest |
| Mean Annual Air Temperature | 13 °C | 15 °C | 15.5 °C | 18 °C |
| Mean Annual Relative Humidity | 0.80 | 0.85 | 0.85 | 0.86 |
| Average Windspeed (m/s) | 2.8 | 2.5 | 3.0 | 3.8 |
| LFR (n = 99) | Ola’a (n = 56) | Thurston (n = 36) | Kahuku (n = 55) | |||||||
|---|---|---|---|---|---|---|---|---|---|---|
| Results | Low | Medium | High | Medium | High | Medium | High | Low | Medium | High |
| C. lukuohia | 16 | 43 | 15 | 24 | 28 | 0 | 1 | 4 | 31 | 5 |
| C. huliohia | 0 | 0 | 0 | 0 | 0 | 0 | 0 | 1 | 6 | 1 |
| ND | 19 | 6 | 0 | 4 | 0 | 20 | 15 | 3 | 3 | 1 |
| % Positive | 46% | 88% | 100% | 86% | 100% | 0% | 6% | 63% | 93% | 83% |
Publisher’s Note: MDPI stays neutral with regard to jurisdictional claims in published maps and institutional affiliations. |
© 2021 by the authors. Licensee MDPI, Basel, Switzerland. This article is an open access article distributed under the terms and conditions of the Creative Commons Attribution (CC BY) license (https://creativecommons.org/licenses/by/4.0/).
Share and Cite
Perroy, R.L.; Sullivan, T.; Benitez, D.; Hughes, R.F.; Keith, L.M.; Brill, E.; Kissinger, K.; Duda, D. Spatial Patterns of ‘Ōhi‘a Mortality Associated with Rapid ‘Ōhi‘a Death and Ungulate Presence. Forests 2021, 12, 1035. https://doi.org/10.3390/f12081035
Perroy RL, Sullivan T, Benitez D, Hughes RF, Keith LM, Brill E, Kissinger K, Duda D. Spatial Patterns of ‘Ōhi‘a Mortality Associated with Rapid ‘Ōhi‘a Death and Ungulate Presence. Forests. 2021; 12(8):1035. https://doi.org/10.3390/f12081035
Chicago/Turabian StylePerroy, Ryan L., Timo Sullivan, David Benitez, R. Flint Hughes, Lisa M. Keith, Eva Brill, Karma Kissinger, and Daniel Duda. 2021. "Spatial Patterns of ‘Ōhi‘a Mortality Associated with Rapid ‘Ōhi‘a Death and Ungulate Presence" Forests 12, no. 8: 1035. https://doi.org/10.3390/f12081035
APA StylePerroy, R. L., Sullivan, T., Benitez, D., Hughes, R. F., Keith, L. M., Brill, E., Kissinger, K., & Duda, D. (2021). Spatial Patterns of ‘Ōhi‘a Mortality Associated with Rapid ‘Ōhi‘a Death and Ungulate Presence. Forests, 12(8), 1035. https://doi.org/10.3390/f12081035