Article

Forest Structure, Diversity and Dynamics in Terra Firme and Igapó Gallery Forests in the Colombian Orinoco Basin

by
Juan S. González-Abella
1,*,
Ana M. Aldana
1,2,
Diego F. Correa
1,3,
Luisa Fernanda Casas
1,4 and
Pablo R. Stevenson
1
1
Laboratorio de Ecología de Bosques Tropicales y Primatología, Departamento de Ciencias Biológicas, Universidad de los Andes, Bogotá 111711, Colombia
2
Grupo Mutis, Vicerrectoría, Universidad del Rosario, Bogotá 111711, Colombia
3
Centre for Biodiversity and Conservation Science (CBCS), The University of Queensland, Brisbane, QLD 4072, Australia
4
Fundación Natura Colombia, Bogotá 111311, Colombia
*
Author to whom correspondence should be addressed.
Forests 2021, 12(11), 1568; https://doi.org/10.3390/f12111568
Submission received: 26 August 2021 / Revised: 31 October 2021 / Accepted: 5 November 2021 / Published: 15 November 2021
(This article belongs to the Special Issue Structure, Function, and Dynamics of Tropical Floodplain Forests)

Abstract

:
Studies of dynamics and biomass accumulation are essential for understanding forest functioning and productivity. They are also valuable when planning strategies for the conservation and sustainable use of natural resources. This study was conducted in five one-hectare plots of gallery forest in the Orinoco basin (three in terra firme and two in igapó floodplains), located in the Tomogrande Reserve, Santa Rosalía municipality, Vichada, Colombia. The differences between these forest types were determined and quantified considering diversity, floristic composition, aboveground biomass, forest dynamics and the influence of soils’ physicochemical composition. Terra firme forests were more diverse (Fisher’s α = 30.4) and had higher mortality and recruitment rates than igapó forests but there were no significant differences in stem turnover rates between forest types. Relative tree growth rate was also higher in terra firme than in igapó, but the opposite was found for biomass change (1.47 t/ha/year in igapó), resulting in an average carbon accumulation rate of 0.33 t/ha/year in terra firme and 0.66 t/ha/year in igapó. Igapó forest has high carbon accumulation potential given the high wood density of certain dominant species. Igapó soils contained a higher concentration of sand, silt, phosphorus and potassium ions, while terra firme soils had a higher clay content with lower pH. In general, the demographic and growth rates were consistent with those described for Amazonian forests. This study highlights the potential of igapó forest in the Orinoco basin as important carbon sinks, which should be included in the management and conservation strategies for this region.

1. Introduction

Gallery forests are characterized by a high level of spatial and temporal heterogeneity, mainly owing to their geomorphology and hydrological regimes [1,2]. Gallery forests are embedded in tropical savannas and mostly correspond to narrow forest in proximity to streams and rivers. Despite covering less land area than nearby savannas, they are of high biological value for the Colombian Orinoco basin [3]. These riparian ecosystems are rich in species, water and forest resources not found in open savannas. They also have important ecological roles [4,5], serving as biological corridors and providing shelter and food for numerous species [3,6,7]. They act as carbon sinks [8,9] and fulfill important hydrological functions such as runoff control, riverbank stability, thermal balance of water, nutrient cycling and control of soil erosion [7].
Moreover, gallery forests can be useful for assessing the effects of long-term fragmentation in tropical forests, serving as proxies for the stability of fragments of tropical forest [10]. The management and sustainable use of tropical forests is of prime importance for the conservation of global biodiversity and the survival of the people who depend on forest resources [11,12]. The appropriate use of natural resources and comprehensive conservation of tropical forests largely depends on understanding how these forests vary in time and space [13,14]. Studies of biomass accumulation and carbon fixation in tropical forests have therefore gradually gained importance [15,16,17]. Most of these studies are based on measurements of forest productivity and dynamics achieved through the monitoring of permanent vegetation plots [14,18]. Forest dynamics are usually estimated based on annual changes in the diametric growth of trees and seasonal changes in the composition, mortality and recruitment of trees in natural [19,20,21] and disturbed [20,22] areas. Spatial and temporal differences in the dynamics and variation of biomass accumulation have been analyzed in neotropical forests [20,23,24], and are mostly associated with soil characteristics [22,25] and seasonal events such as flooding [26,27,28]. Diversity, productivity and carbon accumulation also vary within flooded forests, as a function of the physicochemical properties of fluvial systems [29,30]. Várzea floodplains are flooded by whitewater rivers, rich in sediments and nutrients, while igapó floodplains are flooded by blackwater rivers, which are nutrient poor and contain dissolved organic matter in the form of tannins [31].
The occurrence, frequency and duration of floods influence tree ecophysiology by causing changes in the availability of nutrients, oxygen levels and concentrations of phytotoxins [32,33]. These conditions drive floodplain trees to survive and adapt to periodical floods, leading to the hydrological segregation of niche species [28,34] and the shaping of tree species’ diversity and geographical distribution [28,35]. As a result, forests exposed to flooding normally contain fewer tree species than adjacent terra firme forests [30,31,32,33]. One of the adaptations of floodplain trees that enables them to endure periodical anoxia conditions is a reduction in metabolism rates during the aquatic phase, leading to reduced wood growth rates [32]. For igapó forests, the lower rates of diameter increases in tree species and the low nutrient content of the soil have been associated with higher wood density [36,37]. Since wood density and tree diameter are crucial parameters for estimating the aboveground biomass [38], it has been reported that flood regimes can be positively correlated with the biomass stock and carbon accumulation in neotropical forests [37,39].
Most forest ecological dynamics studies in the neotropics are focused on the Amazon [30,31,32,33,36]. Ecological studies of gallery forests in the Colombian Orinoco basin are very limited, despite their significance in maintaining regional biodiversity and biomass [7,40]. Most available research in this region focuses on the composition and structure of these forests [1,3,41], and there are no known quantitative studies on population dynamics or carbon accumulation [42]. To our knowledge, there are only seven one-hectare permanent vegetation plots for research in the gallery forests of the Colombian Orinoco basin [43]. We studied five of these one-hectare vegetation plots, three in terra firme [44] and two in igapó flooded forests [4].
Our aim was to describe the differences between terra firme and igapó gallery forests in terms of diversity, forest structure, forest dynamics, as well as variation in aboveground biomass and the physicochemical composition of their soils. We hypothesized that, due to various ecological processes driven by the periodic floods, igapó forest would differ from terra firme forest in tree species composition and diversity; forest structure (tree diameter at the breast height (DBH), total height); annual dynamics (mortality, recruitment, stem turnover and growth rates); soil composition; and biomass stock and accumulation, despite being less than 2 km apart [20,22,32,34,43,45]. Considering what is known from the Amazon about the adaptations of floodplain tree species to the stress imposed by flooding, including periodic hypoxia, soil microflora alteration and associated reduction in growth periods [29,30,32,36,46], we predicted: (1) higher plant diversity, growth rates and biomass accumulation in terra firme than in igapó forests [32,43,47,48], (2) higher mortality rates in igapó than in terra firme forests, as a result of the impact of flooding on trees [14,46] and (3) lower tree recruitment rates in igapó than in terra firme forests due to low levels of soil nutrients in igapó forests [30,49,50].

2. Materials and Methods

2.1. Study Area

The study was conducted in the Tomogrande Biological Reserve (municipality of Santa Rosalía, Vichada, Colombia) (Figure 1). The area is located in the highlands of the Colombian Eastern Plains and is part of the seasonal tropical savanna pedobiome, characterized by extensive savannas and gallery forests. The annual average temperature ranges from 24.5 °C to 27.0 °C. The precipitation recorded at the nearest climatological station shows an annual average of 2673 mm [51]. Precipitation is seasonal and unimodal, with a maximum value in June. A long dry season (4 or 5 months, between November and March) favors the periodic occurrence of fires in the savannas [52,53].
The largest floodplains in this area are located on the banks of the Tomo River, which has blackwaters and supports igapó forests [54]. Based on in situ measurements and satellite imagery, these floodplains remain flooded for up to 8 ½ months of the year [55].

2.2. Data Collection

Three one-hectare plots of terra firme forest were established during the first half of 2009 [44] and two one-hectare plots of igapó forest were established between February and March 2010 [4]. The five plots were re-sampled from January to May 2014, following the RAINFOR protocol [56], according to the recommended time interval census for tropical forest plots [13,19]. The minimum linear distance between plots of igapó and terra firme forest was 1.5 km (Figure 1). Individuals with a DBH (i.e., 1.3 m) of >10 cm were included in the analyses. Total height (H) was calculated for each individual using an inclinometer. Tree inclination was recorded for individuals with a slant angle of >10° with respect to the vertical axis. For tilted trees, the length of the stem (H) was estimated using the inclination angle (θ, angle between the vertical axis and the stem), following the formula:
H = h sin ( 90 ° θ )
where h is the vertical distance from the tree crown to the ground.
All individuals not previously tagged with a DBH >10 cm were included as recruits. Mode of death was recorded for tagged dead individuals, following RAINFOR [56], which describes the physical mechanism that caused the death of the tree. We collected 25 samples of topsoil per plot, from the center of 20 × 20 m2 subplots, and analyzed them to obtain soil texture (% of clay, sand and silt), pH and composition of organic carbon and inorganic elements (N, Na, P, Ca, Mg, K). We also divided each one-hectare plot into 20 m × 20 m subplots to statistically quantify variations in diversity, structure, composition and forest dynamics between forest types.

2.3. Data Analysis

2.3.1. Diversity and Structure

Species richness, Fisher’s α diversity index and the exponential Shannon entropy index eH were used to estimate tree species diversity. Fisher’s α diversity is a common index, useful for comparisons [57]; it is defined by the following formula:
S =   α   ln ( 1 + n α )
where S is the number of species; n is the number of individuals; and α is the Fisher’s alpha.
The exponential Shannon entropy index is a transformation of Shannon’s index that weights species in proportion to their frequency [58] and is calculated as:
e H =   exp ( i = 1 S p i   ln ( p i ) )
where S is the number of species and pi is the proportion of species i.
Rarefaction curves of cumulative individuals were created, one for each type of forest, using the BiodiversityR package in R 4.0.5 [59]. A simple linear regression model was performed to determine the relationship between DBH and the total height of individuals in each forest type using the total height as the response variable. Palms were excluded from this analysis because stem thickening occurs before stem elongation in most species [60]. A classification was performed according to diameter class, every 10 cm, to quantify variations in abundance between the different classes. The percentage of tilted individuals was also calculated per forest type.

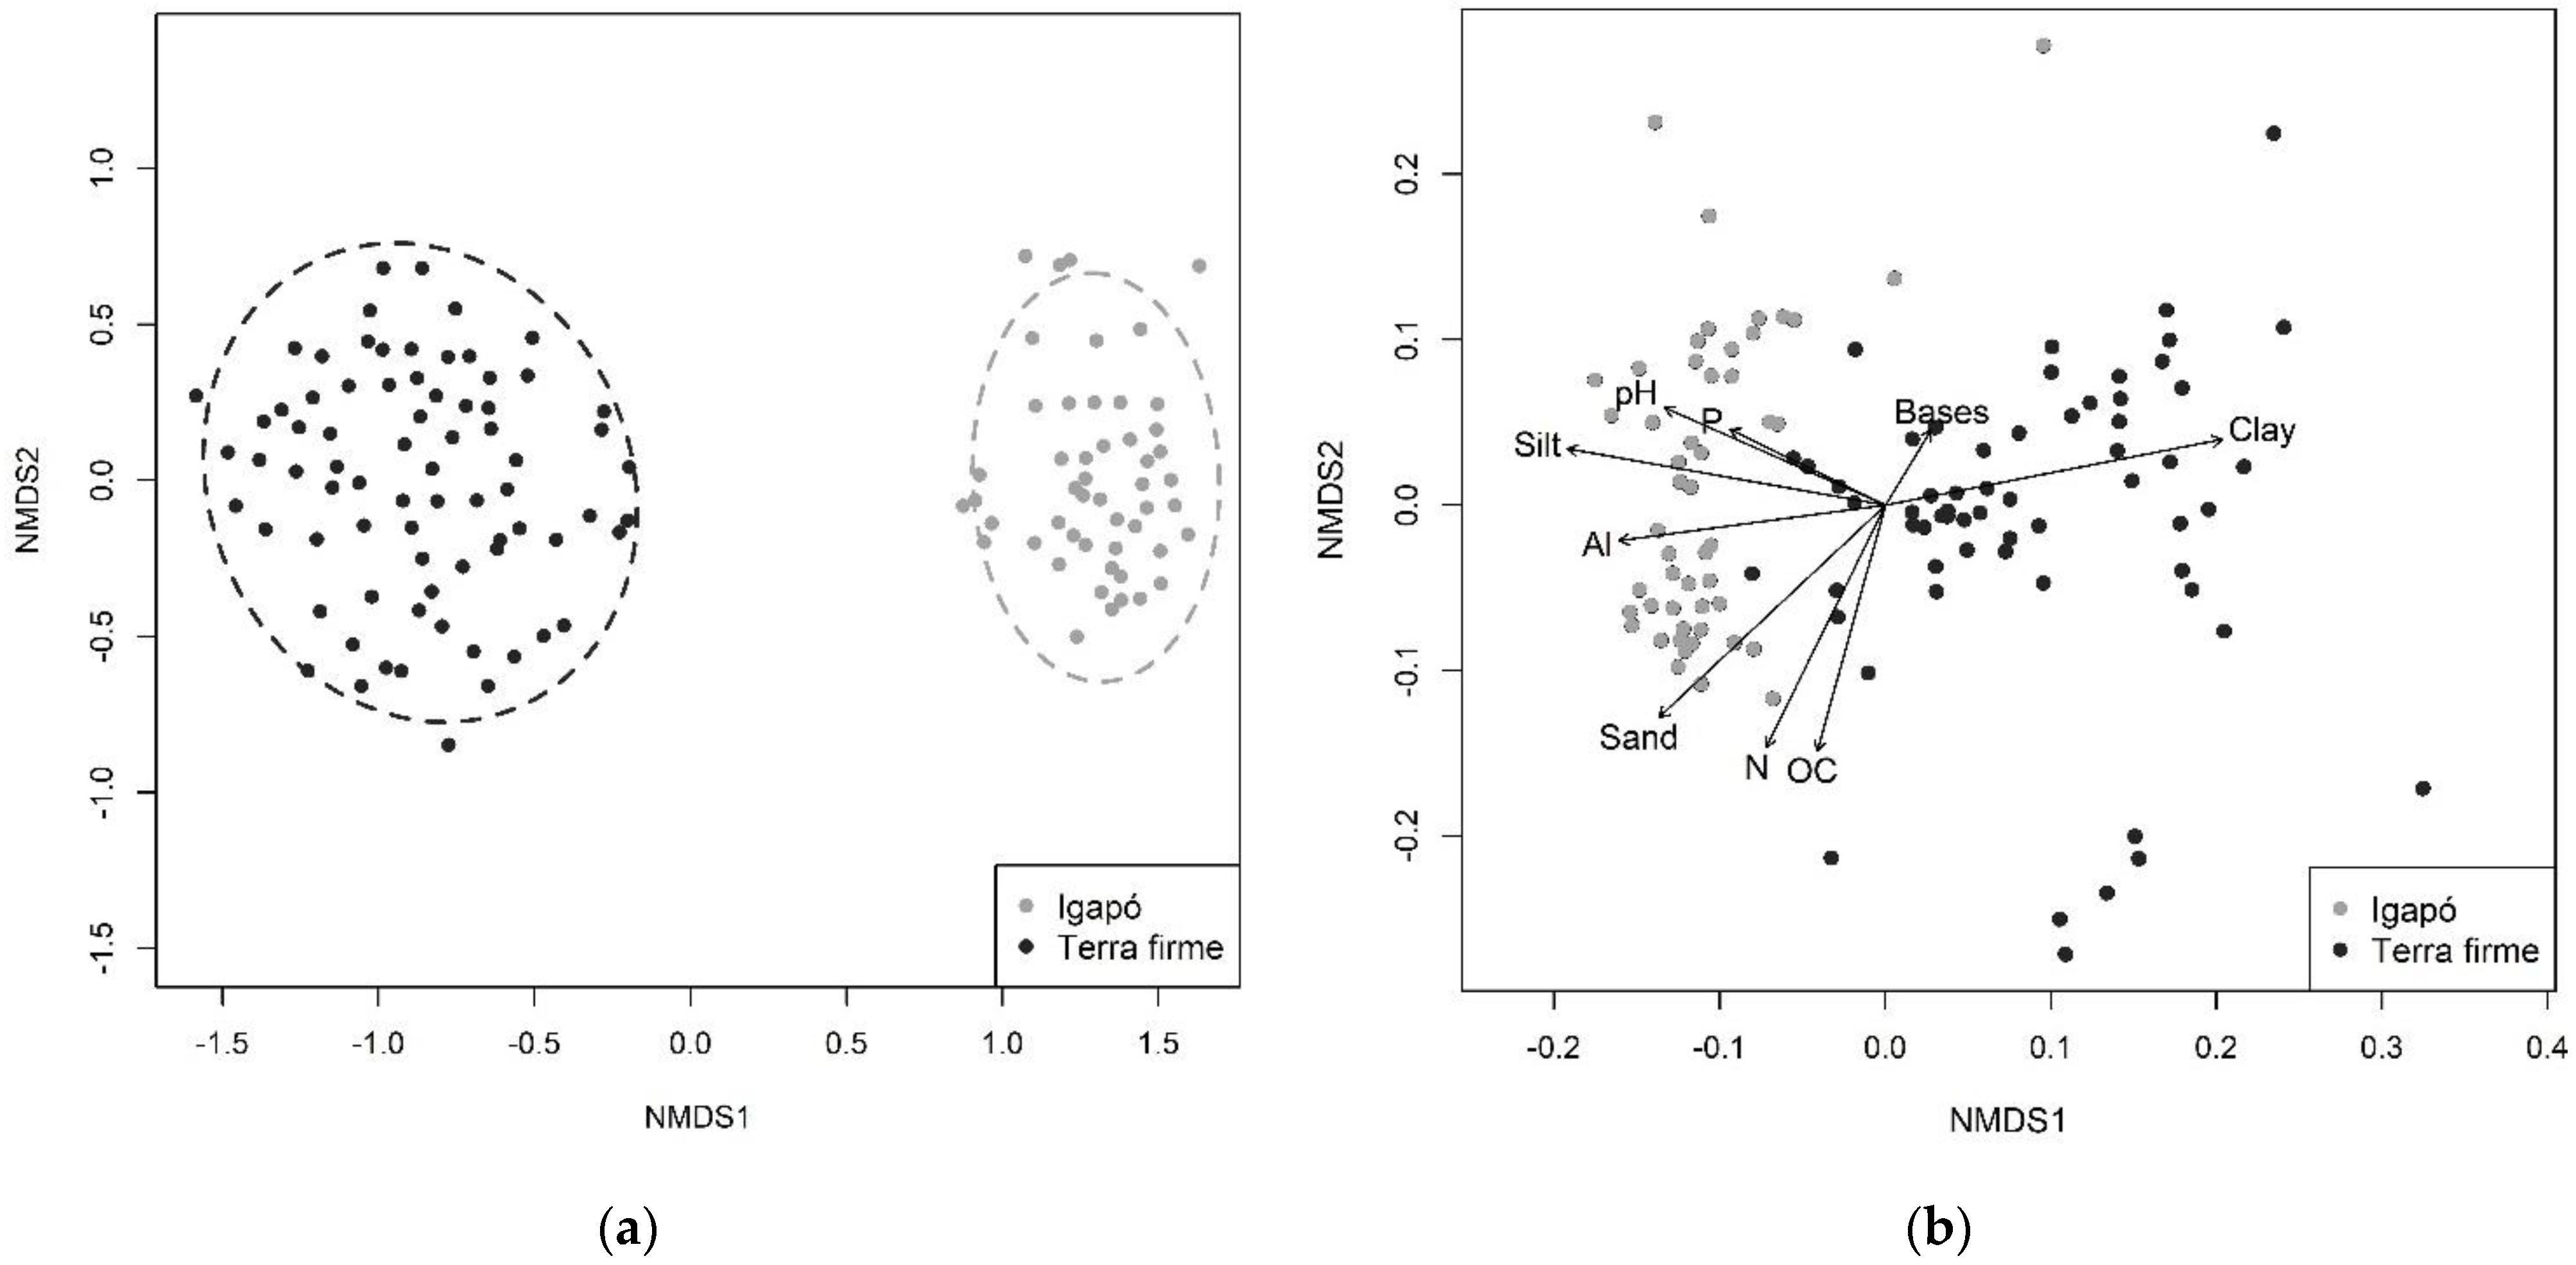
2.3.2. Floristic and Soil Composition

A non-metric multidimensional scaling (NMDS) ordination was performed based on the Bray–Curtis dissimilarity index (BC), using R 4.0.5 [59] to compare the floristic and soil composition data of the five vegetation plots. The Bray–Curtis dissimilarity index was calculated by the formula:
B C i j = s = 1 n | x i s x j s | s = 1 n ( x i s + x j s )
where BCij is the Bray–Curtis distance between plots i and j; n is the number of species; and xis and xjs are the abundances of species s in plots i and j [61]. For soil composition, BCij is the Bray–Curtis distance between subplots i and j, n is the number of physicochemical variables and xis and xjs are the values of variable s in subplots i and j [61].
To analyze floristic composition, the five plots were compared using the abundance of species and the Importance Value Index (IVI), which is a useful indicator to determine the ecological importance of species per forest type based on their relative values of abundance, dominance and frequency [62]. For soil composition, we estimated the mean values of the physicochemical parameters (clay, silt, sand, organic carbon, nitrogen, phosphorus, pH, exchange acidity, cation exchange capacity (CEC), effective CEC (ECEC), calcium, magnesium, potassium and sodium) for both forest types.

2.3.3. Estimation of the Aboveground Biomass of Trees

The type I model of allometric models for Colombia, which includes diameter (D), total tree height (H) and wood density (ρ) [63], was applied to estimate the aboveground biomass (AGB) of the two gallery forest types.
AGB = exp ( 2.261 + 0.937     ln ( D     2 H     ρ ) )
The equation was assigned according to the life zones proposed by Holdridge et al. (1971) to which the study area corresponds (i.e., tropical humid forest) [64]. The wood density of each species (genus or family mean were used when species identity was unknown) was obtained from the database available from L.F. Casas et al. 2017 [65], which presents data from wood cores collected from the same study system. AGB was estimated for each plot and each forest type for each census period. The AGB of dead and recruit trees was calculated between census periods. The Wilcoxon test was used to detect significant differences in AGB between forest types. Carbon stocks and accumulation were estimated, considering that in the tropics 45% of aboveground biomass corresponds to carbon [66].

2.3.4. Forest Dynamics

The data obtained in 2009 and 2010 were compared to those from 2014, to establish annual tree relative growth rates (RGR), mortality (m), recruitment (r) and stem turnover (γ), for each forest type. These rates were calculated by applying an exponential growth model in continuous time, proposed by Lewis et al. (2004) [67]. As the time interval between measurements was different, we applied the correction factor proposed by Lewis et al., 2004 [68].
m = ln n 0 ln ( n 0 D t ) t × 100
r = ln n t ln ( n 0 D t ) t × 100
γ =   ln   n t   ln n 0   t × 100
λ corr = λ × t 0.08
where t is the time between censuses; nt and n0 are the number of individuals at the end and at the beginning of the census, respectively; D is the number of individuals dying over the census interval; and λcorr is a corrected rate of mortality, recruitment or turnover. Equivalent equations were used to calculate mortality, recruitment rates and net change in terms of AGB, substituting n0 with the total AGB in the first census, Dt with AGB lost from died stems over the census interval and nt with the total AGB in the second census [67].
To reduce the effect of pseudo-replication in the 25 subplots, a subset of eight non-adjacent subplots were selected for each one-hectare plot to statistically analyze differences in mortality, recruitment, stem turnover, AGB mortality and AGB recruitment between forest types. Moran´s index (Moran’s I) was calculated for each of these variables to analyze possible spatial autocorrelation. We used Student´s t-tests and Wilcoxon tests to analyze statistical differences according to data normality.
RGR were calculated for surviving trees using the following formula:
RGR = ln   DBH t 2 ln DBH t 1 t 2 t 1 × 100
where DBH is the diameter at the breast height of an individual at time t2 and time t1, divided by the number of years between censuses [25]. The total forest RGR is the mean of the individual trees RGR by forest type. We used the Wilcoxon test to analyze RGR differences between forests.

3. Results

3.1. Forest Structure and Diversity

Twice the number of species was recorded in terra firme forest compared to igapó forest (Table 1). Furthermore, terra firme was the most diverse forest type based on Fisher’s α index and the exponential Shannon entropy index. Rarefaction curves (Figure S1) corroborate these differences and suggest that the sampling effort in each forest covered most of the species present.
A higher proportion of individuals was found within the smallest diameter classes in both forest types. Trees with the smallest DBH were mainly found in igapó (Figure 2a), which also had more individuals per hectare than terra firme forests. The largest diameter individuals in terra firme plots belonged to the species Erisma uncinatum Warm. (DBH = 74.6 cm) and Enterolobium schomburgkii (Benth) Benth. (DBH = 77.3 cm). In igapó, individuals with the highest DBH were Licania heteromorpha Benth. (DBH = 65.9 cm) and Tachigali tinctoria (Benth.) Zarucchi & Herend. (DBH= 64.9). When considering the DBH vs. height relationship, lower dispersion was found in terra firme than igapó (R2 = 0.50 vs. R2 = 0.26), thus large trees with the same DBH tend to be taller on terra firme than igapó (Figure 2b).

3.2. Floristic and Soil Composition

The dissimilarity in the floristic composition of terra firme and igapó can be visualized in the NMDS (Figure 3a); this ordination shows that, in terms of species abundance, igapó forest is distinct from terra firme forest. This dissimilarity is confirmed by the IVI scores of the most important species of each forest type. The species with the highest IVI in terra firme forest were Attalea maripa (Aubl.) Mart. (25.3) and Jacaranda copaia (Aubl.) D. Don. (24.0) because of their high density and dominance values (Table S1). J. copaia had the highest density values (11.0%) in this forest type; however, the most dominant species was A. maripa (8.1%). Mabea trianae Pax was the most dominant (16.4%) and important species in the igapó forest (35.8%). Two species of the Fabaceae family ranked second and third in importance in the igapó forest: Tachigali vaupesiana van der Werff and T. tinctoria. These igapó forest species showed much higher dominance values than the most important terra firme forest species (Table S1).
Igapó soils differ from those of terra firme in terms of physicochemical composition (Figure 3b), although some samples from terra firme tend to group with those from igapó. Differences were observed in soil texture, where the terra firme soil was mainly composed of clay and igapó soil was composed of sand and silt (Table S3). Igapó soils had higher pH than terra firme soils, as well as higher concentrations of nitrogen (N), potassium (K), and phosphorus (P), and therefore ECEC.

3.3. Forest Dynamics

There was no spatial autocorrelation among subplots in any of the estimated variables (Table S2). The average annual mortality rate in igapó forest (1.48%, n = 16) was lower than in terra firme forest (3.35%, n =24) (W = 1477, p < 0.05) (Figure 4a). Similarly, there were significant differences in annual recruitment rates (W = 1006, p < 0.05), with lower values for recruitment in igapó (2.01%, n = 16) than in terra firme (3.88%, n = 24) (Figure 4b). The mean stem turnover rate was positive and equal for both forests (0.53%, n = 16 for igapó and 0.53%, n = 24 for terra firme) (t= −0.00095, p = 0.999) (Figure 4c). Similar forest dynamics were evident when including all the subplots per forest type (50 for igapó and 75 for terra firme) in the analysis. In this scenario, stem turnover was lower in igapó than in terra firme forest (Figure S2).
The most common mode of death in igapó forest was standing dead (50%), while mortality patterns were more balanced in terra firme forest. In terra firme, 35% of trees died with broken trunks, 28% were uprooted and 22% died but remained standing (Figure S3). In igapó forest, the percentage of dead individuals per hectare was highest in trees with smaller diameters, where 90.1% had a DBH of ≤25 cm. In terra firme, the percentage of dead trees with DBH ≤ 25 cm was 74.0%.
The mean RGR of individuals in the terra firme forest (1.40%, n = 75) is much higher than those of the igapó individuals (1.06%, n = 50) (W = 12.89, p < 0.05, n = 50 (Igapó), n = 75 (Terra firme)) (Figure 4d). Some abundant and important species stand out, with a higher RGR than those of the other species, including T. tinctoria (1.8%) in igapó and Bocageopsis multiflora (Mart.) R.E. Fr. (2.1%) in terra firme.

3.4. Estimation of Biomass Stock and Carbon Accumulation

Total average biomass values were higher for igapó (169.9 t/ha) than terra firme forest (128.7 t/ha). The change in AGB showed higher values for igapó (1.47 t/ha/year) than for terra firme forest (0.73 t/ha/year). Thus, carbon accumulation was almost twice as high in igapó forest (Table 2). In terms of AGB, rates were recorded in each forest type for mortality (terra firme: 2.93% and igapó: 1.09%) and recruitment (terra firme: 3.26% and igapó: 2.64%). It should be noted that there was spatial correlation for AGB recruitment (I = 0,27, p < 0.05) (Table S2) and that the death of large trees contributed substantially to biomass mortality rates.

4. Discussion

We confirmed our hypothesis that plots of terra firme gallery forest and igapó floodplain forest differ in terms of floristic composition, tree species diversity, forest structure and annual forest dynamics. Since our study plots in the Colombian Orinoco basin are connected and close to each other (less than 3 km) (Figure 1), the effect of geographic distance seems unimportant. It is therefore likely that the annual flood regime of 8½ months acts as an environmental filter for species adapted to the flooded conditions, affecting forest species composition and reducing tree species diversity in the flooded forest. It is also likely that the strong environmental pressure imposed by flooding causes the observed differences in soil composition, forest structure and dynamics between the two forest types.
As we also hypothesized, terra firme forest was more diverse than igapó forest. Fisher’s α index, the exponential Shannon entropy index (Table 1) and rarefaction curves (Figure S1) support this finding and also provide an idea as to how different these forests are. This pattern was also found by ter Steege (2000) [48] for the entire Amazon, and could be explained by more stressful conditions and selection pressures within igapó forest, resulting from flooding patterns. Periodical flooding conditions can affect the recruitment and distribution of species in flooded forests [34] so that only species adapted to these conditions can persist [47,69]. At the regional level, the diversity of gallery forests in the Orinoco basin is similar to the less diverse forest types in Amazonia. Tree species diversity in an igapó plot is similar to that of swamp or flooded forest in the Guiana shield; tree species diversity in a terra firme plot is similar to that of swamp forest in western Amazonia or in a floodplain forest in eastern Amazonia [44,48]. Although this study broadens our knowledge of tree diversity in gallery forests in the Orinoco basin, we consider that other aspects that could influence the richness and diversity of these forests should be taken into account for future studies in the region, such as edge effects, and the influence of flood depth and duration [30,70,71].
Although the number of individuals per hectare was higher in igapó than in terra firme, over 60% of individuals had a DBH of between 10 and 30 cm in both forest types. Our DBH distribution results (Figure 2a) coincide with the typical DBH distribution curve in tropical forests [72] and support the positive balance in stem turnover. It was similarly determined that, on average, terra firme trees attain a greater height:diameter ratio than igapó (Figure 2b). Lower height:diameter ratios in flooded forests have been reported to be related to a morphological adaptation to increase plant stability against water flow and water disturbances [73]. Tree species adapted to nutrient-poor and low-water-retention sandy soils (Table S3) also tend to be shorter [74]. Water flow stress could be related to the higher percentage of inclined trees in igapó (8.5%) than in terra firme (2.1%) [46] (Table 1).
Our study confirmed the hypothesis that the floristic compositions of terra firme and igapó forests differ remarkably (Figure 3a), probably as a consequence of the morphological, anatomical and ecological adaptations of the species present in the floodplains [24,29]. We also observed that igapó forests include two dominant species (M. trianae and T. tinctoria), which make up 26% of the igapó forests in terms of importance value. Igapó species with high IVI such as M. trianae, L. heteromorpha and Eschweileira parviflora Mart. ex DC. were reported as common species in other inventories of igapó forest along the Negro River and Tapajós Rivers in the Amazon basin [30,75,76]. Furthermore, the gallery forests in our study include individuals from the most abundant families of the flooded Amazon as well as the surrounding forests of the eastern Venezuelan plains (Annonaceae, Rubiaceae, Moraceae, Burseraceae, Fabaceae, Chrysobalanaceae and Euphorbiaceae) [28,44].
The annual rates of recruitment and mortality observed in terra firme and igapó gallery forests are within the range previously reported for neotropical forests [20,26]. Contrary to our hypothesis, high mortality rates were not found in igapó forests (Figure 4a), even though these forests are exposed to flood disturbances and anoxic stress during prolonged floods [10,23]. However, the pattern of tree mortality found in igapó forests, where more trees with DBH ≤ 25 cm die, may be explained by the fact that individuals in juvenile stages in igapó forests do not easily survive flooding seasons and die despite their specialized functional traits [22], leading to low recruitment rates in this forest. On the other hand, in terra firme gallery forests, edge effects caused by winds may be important for the mortality of individuals [10,70]. The mode of death in terra firme forest is consistent with wind disturbance, where broken trunks and uprootings were very common deaths (Figure S3). This pattern of death may lead to gap formations and could help explain the higher mortality and recruitment rates in terra firme, compared with igapó [26], where 50% of deaths were dead standing. Although this result gives us an indication of the dynamics of the forest over a period of five years, it is not a conclusive result and more long-term studies are required to better understand this forest dynamic [14].
The difference in RGR between both forest types supported our main hypothesis, since RGR for terra firme (1.40%) was higher than that for igapó (1.06%). One of the factors that can explain this result is the fact that the flood regime has a negative effect on growth rates due to the lack of oxygen supply to the root, which decreases metabolic activity and the initiation of dormancy in some species during flood periods [29,46]. However, there are species with greater tolerance and adaptation to these ecosystems, such as the case of two species of the Tachigali genus—T. tinctoria and T. vaupesiana—which are very common in the floodplains, with RGRs of 1.79% and 1.37%, respectively.
The annual diameter increment values for these gallery forests are within the range reported for other tropical forests (0.3–5%) [10,57,77]. Kellman et al. (1998) [10] found an increase in diameter of 1.21% for a gallery forest in Belize; however, they included edge species, which have higher growth rates. Sherman et al. (2012) [25] also found similar RGR results to our values from terra firme and igapó forests in surveys of tropical montane forest at low and high altitudes, respectively. It can therefore be inferred that gallery forests of the Orinoco high plains have a relatively low mean RGR compared with Amazonian forests, but similar RGR compared to montane forests and other gallery forests. For more conclusive diameter increment results, we would recommend taking more censuses and using more vegetation plots [29].
Although the annual stem turnover rate (Figure 4c) was positive and equal in both forest types, the annual change in AGB was greater in igapó than in terra firme. This may be associated with the size of dead individuals, as terra firme showed a higher frequency of large dead individuals and hence a higher AGB mortality rate. Thus, the death of large individuals was the main driver for the higher rates of mortality in terms of AGB in terra firme.
The igapó forest had the highest amount of AGB (170 t/ha). Although, on average, terra firme trees are taller and have greater DBH values than igapó, this result can be explained by the difference in the number of individuals per hectare, i.e., stem density (Table 1), and the wood density of individuals in each forest type [4,65]. According to the results of Casas et al. 2017 [65] for the same study system, igapó forest contained trees with higher wood densities compared to terra firme forest. This result may be related to the lack of nutrients in igapó soils and consequent lower growth rates, which produce hard woods [78], such as the case of important (Table S1) and slow-growing species such as Duroia micrantha (Ladbr.) Zarucchi & J.H.K (0.34%) and E. parviflora (0.15%) with high wood densities [4,65]. Our AGB results are consistent with those found in transitional and seasonal Amazonian forests, as well as in flooded forests. Similarly, the average AGB in both forest types appears to be higher than that found in a secondary forest in the Amazon, but lower than the average found in a mature Amazonian forest in terra firme or in an Andean forest [79,80,81,82]. On the other hand, the accumulation of carbon in igapó forest (Table 2) was higher than the average observed in Amazonian forests (0.45 t/ha/year) [20], which may be important for planning conservation strategies for gallery forests or payment schemes for environmental services within the region.
These results will serve to develop regional strategies for conservation, ecological restoration, environmental compensation, environmental services and the sustainable use of tree species of interest for local people. For example, individuals of the genus Tachigali are commonly used in the region for their timber value, but other species such as B. multiflora and Byrsonima japurensis A. Juss. are not widely used in the area but are classified as species with high timber value [83] and are abundant in these gallery forests. Periodic and long-term studies that include data on topography, climatic variation and flood pulses are important to increase our knowledge of the functioning and productivity of these forests.

5. Conclusions

This study confirms the patterns found throughout neotropical forests, where terra firme forests have a richer variety of species and are more diverse than floodplain forests. We found that on average, terra firme trees have a greater height:diameter ratio than igapó trees, i.e., trees with the same DBH tend to be taller in terra firme. The floristic composition of both forest types was also quite different, likely owing to the adaptations of tree species that occur in flooded forests.
We found differences in recruitment, stem turnover and relative growth rates between both forest types in terms of forests dynamics. Conversely, there was no difference in the mortality rate per individual between forest types, but there was in terms of AGB due to the higher death rate of larger trees in terra firme forest. Similarly, both the total AGB and change in AGB per hectare were greater in igapó forest owing to the higher density of individuals per hectare and high wood density of species in igapó forest. Thus, we found that carbon accumulation was two-fold higher in igapó forest compared with that in terra firme. It was also found that soils in igapó had a higher concentration of sand, silt, nitrogen, potassium and phosphorous, and higher pH values than terra firme forest.
Our study details the ecological characteristics that distinguish terra firme and floodplain gallery forests of the igapó type in the Orinoco plains. These results can serve as a basis for the sustainable use and conservation of forests in this region.

Supplementary Materials

The following are available online at https://www.mdpi.com/article/10.3390/f12111568/s1, Figure S1: Rarefaction curve comparing the richness of the flooded forest and the terra firme forest in the Tomogrande Reserve, Vichada (Colombia); Figure S2: Results and significant differences in (a) annual mortality rate (W = 1477, p-value ≤ 0.05), (b) annual recruitment rate (W = 1006, p-value ≤ 0.05) and (c) annual stem turnover rate (t = −2.14, p-value ≤ 0.05) in percentages, for each forest type, taking a 20 m × 20 m subplot as the sample unit: 50 subplots for igapó and 75 for terra firme. The thick line represents the average for each group, and the dotted lines represent the variance. The letters above indicate statistically significant differences among forest types (p < 0.05); Figure S3: Individual’s death mode percentage for each type of forest, according to the mode of death proposed by RAINFOR (2009) [20], where a: dead standing, b: snapped trunk, c: uprooted, d: standing or broken, dead standing, k: vanished, l: presumed dead, o: lightning, u: killed, no more information, w: killed by another tree that uprooted, y: killed by branches fallen from living tree, z: killed by strangler; Table S1: List of the 10 most important species in the flooded and terra firme forests in the Tomogrande Reserve, where D = relative dominance (basal area/total basal area), ρ = relative density (total number of individuals per species/total number of individuals), F = relative frequency (presence of species per subplots/total number of subplots per plot) and IVI = importance value index; Table S2: Moran spatial autocorrelation index (Moran’s I) values, for each demographic rate for each forest type in the Tomogrande Reserve (Vichada, Colombia), taking 20 m × 20 m subplots as sample units (16 subplots for igapó and 24 for terra firme). Values greater than zero are indicative of positive spatial autocorrelation, while values less than 0 are indicative of negative spatial autocorrelation. * indicates positive significant autocorrelation among subplots with p ≤ 0.05; Table S3: Average values of all variables sampled in the soil of terra firme and flooded forests, taking 20 m × 20 m subplots as sample units (50 subplots for igapó and 75 for terra firme). Organic carbon (CO), nitrogen (N), phosphorus (p), pH, exchange acidity (Al), cation exchange capacity (CEC), effective cation exchange capacity (ECEC), calcium (Ca), Magnesium (Mg), potassium (K) and sodium (Na).

Author Contributions

Conceptualization and methodology, A.M.A. and P.R.S.; formal analysis, J.S.G.-A.; investigation, J.S.G.-A., D.F.C., L.F.C., A.M.A. and P.R.S.; resources, A.M.A. and P.R.S.; data curation, J.S.G.-A., D.F.C., L.F.C.; writing—original draft preparation, J.S.G.-A.; writing—review and editing, J.S.G.-A., A.M.A., D.F.C., P.R.S.; visualization, J.S.G.-A.; supervision, project administration and funding acquisition A.M.A. and P.R.S. All authors have read and agreed to the published version of the manuscript.

Funding

This research was funded by Facultad de Ciencias at Universidad de los Andes, grant number INV-2018-50-1336. The APC was funded by Universidad del Rosario.

Institutional Review Board Statement

Not applicable.

Informed Consent Statement

Not applicable.

Data Availability Statement

The data generated during the study have not yet been reported in any public repository.

Acknowledgments

We would like to thank the Departamento de Ciencias Biológicas, Facultad de Ciencias at Universidad de los Andes and Ecopetrol for their financial support. We would also like to thank Alejandra Jiménez, Luz Dary Rivas and John Fredy Barrera and the Advance Ecology class group (2013-2) for their collaboration in the field phase and the Tomogrande Biological Reserve for its logistical support. Ana M. Aldana would like to thank L’Oréal FWIS Colombia and Universidad del Rosario, since funds from these sources covered translation, copyediting services and Article Processing Charges. We also thank four anonymous reviewers for constructive comments on an earlier version of this manuscript.

Conflicts of Interest

The authors declare no conflict of interest.

References

  1. Cabrera, D.M. Análisis Florístico, Estructural y Biotipológico Foliar de La Vegetación Leñosa En Bosques Ribereños de La Cuenca Baja Del Río Pauto (Casanare-Colombia). Master’s Thesis, Universidad Nacional de Colombia, Bogotá, Colombia, 2014. [Google Scholar]
  2. Capon, S.J.; Dowe, J.L. Diversity and Dynamics of Riparian Vegetation. In Principles for Riparian Lands Management; Lovett, S., Price, P., Eds.; Land & Water Australia: Camberra, Australia, 2007; pp. 13–32. [Google Scholar]
  3. Veneklaas, E.J.; Fajardo, A.; Obregon, S.; Lozano, J. Gallery Forest Types and Their Environmental Correlates in a Colombian Savanna Landscape. Ecography 2005, 28, 236–252. [Google Scholar] [CrossRef]
  4. Casas, L.F.; Stevenson, P.R. Variación de Biomasa Aérea y Densidad de Madera En Bosques de Tierras Bajas Con Planos de Inundación de Aguas Negras y Aguas Blancas. Master’s Thesis, Universidad de los Andes, Bogotá, Colombia, 2013. [Google Scholar]
  5. Vásquez, L.C.; Matallana, C.L. Identificación de Los Servicios Ecosistémicos Que Proveen Las Diferentes Áreas Protegidas En La Orinoquia Colombiana. Biodivers. En La Práctica 2016, 1, 77–127. [Google Scholar]
  6. Redford, K.H.; Da Fonseca, G.A.B. The Role of Gallery Forests in The Zoogeography of the Cerrado’s Non-Volant Mammalian Fauna. Biotropica 1986, 18, 126–135. [Google Scholar] [CrossRef]
  7. Calderón García, A. Revisión Literaria de Los Bosques de Galería. 2010. Available online: http://repositorio.utn.edu.ec/bitstream/123456789/103/14/03%20REC%20119%20Cap2%20REVISION%20DE%20LITERATURA.pdf (accessed on 20 January 2021).
  8. Andrade, H.; Segura, M.; Somarriba, E.; Villalobos, M. Valoración Biofísica y Financiera de La Fijación de Carbono Por Uso Del Suelo En Fincas Cacaoteras Indígenas de Talamanca, Costa Rica. Agroforestería en las Américas 2008, 46, 45–50. [Google Scholar]
  9. Valera, V.; Carvajal, N. Valoración Económica Del Secuestro de Carbono En Un Sector Del Parque Nacional Waraira Repano (Caracas, Venezuela). An. de la Univ. Metrop. 2014, 14, 241–264. [Google Scholar]
  10. Kellman, M.; Tackaberry, R.; Rigg, L. Structure and Function in Two Tropical Gallery Forest Communities: Implications for Forest Conservation in Fragmented Systems. J. Appl. Ecol. 1998, 35, 195–206. [Google Scholar] [CrossRef]
  11. Bruening, E.F. Conservation and Management of Tropical Rainforests. In An Integrated Approach to Sustainability, 2nd ed.; CAB International: Wallingford, UK, 1996. [Google Scholar]
  12. Bawa, K.S.; Seidler, R. Natural Forest Management and Conservation of Biodiversity in Tropical Forests. Conserv. Biol. 1998, 12, 46–55. [Google Scholar] [CrossRef]
  13. Condit, R. Tropical Forest Census Plots: Methods and Results from Barro Colorado Island, Panama and a Comparison with Other Plots; Springer Science & Business Media: Berlin, Germany, 1998. [Google Scholar] [CrossRef]
  14. Londoño, A.C. Flora and Dynamics of an Upland and a Floodplain Forest in Peña Roja, Colombian Amazonia. Ph.D. Thesis, Universiteit van Amsterdam, Amsterdam, The Netherlands, 2011. [Google Scholar]
  15. Silver, W.L.; Ostertag, R.; Lugo, A.E. The Potential for Carbon Sequestration through Reforestation of Abandoned Tropical Agricultural and Pasture Lands. Restor. Ecol. 2000, 8, 394–407. [Google Scholar] [CrossRef]
  16. Brown, S. Measuring Carbon in Forests: Current Status and Future Challenges. Environ. Pollut. 2002, 116, 363–372. [Google Scholar] [CrossRef]
  17. Pan, Y.; Birdsey, R.A.; Fang, J.; Houghton, R.; Kauppi, P.E.; Kurz, W.A.; Phillips, O.L.; Shvidenko, A.; Lewis, S.L.; Canadell, J.G.; et al. A Large and Persistent Carbon Sink in the World’s Forests. Science. 2011, 333, 988–993. [Google Scholar] [CrossRef] [PubMed] [Green Version]
  18. Peacock, J.; Baker, T.R.; Lewis, S.L.; Lopez-Gonzalez, G.; Phillips, O.L. The RAINFOR Database: Monitoring Forest Biomass and Dynamics. J. Veg. Sci. 2007, 18, 535–542. [Google Scholar] [CrossRef]
  19. Phillips, O.L.; Lewis, S.L. Recent Changes in Tropical Forest Biomass and Dynamics. In Forests and Global Change; Coomes, D., Burslem, D.F.R.P., Simonson, W.D., Eds.; Cambridge University Press: Cambridge, UK, 2014; pp. 77–108. [Google Scholar] [CrossRef] [Green Version]
  20. Phillips, O.L.; Baker, T.R.; Arroyo, L.; Higuchi, N.; Killeen, T.J.; Laurance, W.F.; Lewis, S.L.; Lloyd, J.; Malhi, Y.; Monteagudo, A.; et al. Pattern and Process in Amazon Tree Turnover, 1976–2001. Philos. Trans. R. Soc. Lond. Ser. B Biol. Sci. 2004, 359, 381–407. [Google Scholar] [CrossRef]
  21. Veblen, T.T.; Kitzberger, T.; Villalba, R. Nuevos Conocimientos En Ecología y Su Influencia Sobre El Conocimiento de La Dinámica de Los Bosques Del Sur de Argentina y Chile. In Ecología y Manejo De Bosques en Argentina; Goya, J.F., Frangi, J.L., Arturi, M.F., Eds.; Universidad Nacional de la Plata: La Plata, Argentina, 2005; pp. 442–447. [Google Scholar] [CrossRef]
  22. Quesada, C.A.; Phillips, O.L.; Schwarz, M.; Czimczik, C.I.; Baker, T.R.; Patiño, S.; Fyllas, N.M.; Hodnett, M.G.; Herrera, R.; Almeida, S.; et al. Basin-Wide Variations in Amazon Forest Structure and Function Are Mediated by Both Soils and Climate. Biogeosciences 2012, 9, 2203–2246. [Google Scholar] [CrossRef] [Green Version]
  23. Martins, K.G.; Marques, M.C.M.; Dos Santos, E.; Marques, R. Effects of Soil Conditions on the Diversity of Tropical Forests across a Successional Gradient. For. Ecol. Manag. 2015, 349, 4–11. [Google Scholar] [CrossRef]
  24. Phillips, O.L.; Hall, P.; Gentry, A.H.; Sawyer, S.A.; Vásquez, R. Dynamics and Species Richness of Tropical Rain Forests. Proc. Natl. Acad. Sci. USA 1994, 91, 2805–2809. [Google Scholar] [CrossRef] [PubMed] [Green Version]
  25. Sherman, R.E.; Fahey, T.J.; Patrick, M.H.; Battles, J.J. Patterns of Growth, Recruitment, Mortality and Biomass across an Altitudinal Gradient in a Neotropical Montane Forest, Dominican Republic. J. Trop. Ecol. 2012, 28, 483–495. [Google Scholar] [CrossRef] [Green Version]
  26. Nebel, G.; Kvist, L.; Vanclay, J.; Vidaurre, H. Ecology and Management of Flood Plain Forests in the Peruvian Amazon. For. Ecol. Manag. 2001, 150, 79–92. [Google Scholar] [CrossRef] [Green Version]
  27. Marques, M.C.M.; Burslem, D.F.R.P.; Britez, R.M.; Silva, S.M. Dynamics and Diversity of Flooded and Unflooded Forests in a Brazilian Atlantic Rain Forest: A 16-Year Study. Plant Ecol. Divers. 2009, 2, 57–64. [Google Scholar] [CrossRef]
  28. Luize, B.G.; Magalhães, J.L.L.; Queiroz, H.; Lopes, M.A.; Venticinque, E.M.; Leão de Moraes Novo, E.M.; Silva, T.S.F. The Tree Species Pool of Amazonian Wetland Forests: Which Species Can Assemble in Periodically Waterlogged Habitats? PLoS ONE 2018, 13, e0198130. [Google Scholar] [CrossRef] [PubMed] [Green Version]
  29. Parolin, P.; Wittmann, F. Struggle in the Flood: Tree Responses to Flooding Stress in Four Tropical Floodplain Systems. AoB Plants 2010, plq003. [Google Scholar] [CrossRef] [Green Version]
  30. Wittmann, F.; Schöngart, J.; Junk, W.J. Phytogeography, Species Diversity, Community Structure and Dynamics of Central Amazonian Floodplain Forest. In Amazonian Floodplain Forest: Ecophysiology, Biodiversity and Sustainable Management; Junk, W.J., Piedade, M.T., Wittmann, F., Schöngart, J., Parolin, P., Eds.; Springer Science+Business Media: Berlin/Heidelberg, Germany, 2010; pp. 61–102. [Google Scholar] [CrossRef]
  31. Junk, W.J. The Central Amazon Floodplain. Ecology of a Pulsing System; Springer-Verlag: Heidelberg, Berlin; New York, NY, USA, 1997. [Google Scholar] [CrossRef]
  32. Parolin, P.; De Simone, O.; Haase, K.; Waldhoff, D.; Rottenberger, S.; Kuhn, U.; Kesselmeier, J.; Kleiss, B.; Schmidt, W.; Piedade, M.T.; et al. Central Amazonian Floodplain Forest: Tree Adaptations in a Pulsing System. Bot. Rev. 2004, 70, 357–380. [Google Scholar] [CrossRef]
  33. Wittmann, F.; Schöngart, J.; Montero, J.C.; Motzer, T.; Junk, W.J.; Piedade, M.T.F.; Queiroz, H.L.; Worbes, M. Tree Species Composition and Diversity Gradients in White-Water Forests across the Amazon Basin. J. Biogeogr. 2006, 33, 1334–1347. [Google Scholar] [CrossRef]
  34. Silvertown, J.; Araya, Y.; Gowing, D. Hydrological Niches in Terrestrial Plant Communities: A Review. J. Ecol. 2015, 103, 93–108. [Google Scholar] [CrossRef] [Green Version]
  35. Wittmann, F.; Marques, M.C.M.; Júnior, G.D.; Budke, J.C.; Piedade, M.T.F.; De Wittmann, A.O.; Montero, J.C.; De Assis, R.L.; Targhetta, N.; Parolin, P.; et al. The Brazilian Freshwater Wetscape: Changes in Tree Community Diversity and Composition on Climatic and Geographic Gradients. PLoS ONE 2017, 12, e0175003. [Google Scholar] [CrossRef]
  36. Parolin, P.; Ferreira, L.V.; Junk, W.J. Central Amazonian Floodplains: Effect of Two Water Types on the Wood Density of Trees. Int. Ver. Für Theor. Und Angew. Limnol. Verh. 1998, 26, 1106–1112. [Google Scholar] [CrossRef]
  37. Baker, T.R.; Burslem, D.F.R.P.; Swaine, M.D. Associations between Tree Growth, Soil Fertility and Water Availability at Local and Regional Scales in Ghanaian Tropical Rain Forest. J. Trop. Ecol. 2003, 19, 109–125. [Google Scholar] [CrossRef]
  38. Chave, J.; Andalo, C.; Brown, S.; Cairns, M.A.; Chambers, J.Q.; Eamus, D.; Fölster, H.; Fromard, F.; Higuchi, N.; Kira, T.; et al. Tree Allometry and Improved Estimation of Carbon Stocks and Balance in Tropical Forests. Oecologia 2005, 145, 87–99. [Google Scholar] [CrossRef] [PubMed]
  39. Schöngart, J.; Wittmann, F. Biomass and Net Primary Production of Central Amazonian Floodplain Forests. In Amazonian Floodplain Forests: Ecophysiology, Biodiversity and Sustainable Management; Junk, W.J., Piedade, M.T., Wittmann, F., Schöngart, J., Parolin, P., Eds.; Springer Science+Business Media B.V: Berlin/Heidelberg, Germany, 2010; pp. 347–388. [Google Scholar] [CrossRef]
  40. Núñez-Avellaneda, L.A.; Castro, M.I.; Mestre, G.; Lozano, L. Los Bosques de Galería Conectores de Vida. Ámbito Investig. 2019, 4, 14–19. [Google Scholar]
  41. Garibello, J. Estructura de La Vegetación Leñosa Del Ecotono Bosque de Galería Sabana En La Altillanura de La Cuenca Alta Del Río Tomo (Estación Biológica Bachaqueros—Departamento Del Vichada). Bachelor´s Thesis, Universidad Nacional de Colombia, Bogotá, Colombia, 2000. [Google Scholar]
  42. Parrado-Rosselli, A.; Gonzales-M, R.; García, H. Estado Actual de La Investigación Científica Publicada Sobre Los Bosques de Colombia. Biodivers. En La Práctica 2016, 1, 177–197. [Google Scholar]
  43. Stevenson, P.R.; Aldana, A.M.; Cárdenas, S.; Negret, P.J. Flooding and Soil Composition Determine Beta Diversity of Lowland Forests in Northern South America. Biotropica 2018, 50, 568–577. [Google Scholar] [CrossRef]
  44. Correa-Gómez, D.F.; Stevenson, P.R. Estructura y Diversidad de Bosques de Los Llanos Orientales Colombianos (Reserva Tomo Grande, Vichada). Orinoquia 2010, 14, 31–48. [Google Scholar]
  45. Felfili, J.M. Diameter and Height Distributions in a Gallery Forest Tree Community and Some of Its Main Species in Central Brazil over a Six-Year Period (1985–1991). Braz. J. Bot. 1997, 20, 155–162. [Google Scholar] [CrossRef] [Green Version]
  46. Parolin, P. Submerged in Darkness: Adaptations to Prolonged Submergence by Woody Species of the Amazonian Floodplains. Ann. Bot. 2009, 103, 359–376. [Google Scholar] [CrossRef] [Green Version]
  47. Duivenvoorden, J. Patterns of tree species richness in rain forest of the middle Caquetá area, Colombia, NW Amazonia. Biotropica 1996, 28, 142–158. [Google Scholar] [CrossRef]
  48. Ter Steege, H.; Sabatier, D.; Castellanos, H.; Van Andel, T.; Duivenvoorden, J.; De Oliveira, A.; Ek, R.; Lilwah, R.; Maas, P.; Mori, S. An Analysis of the Floristic Composition and Diversity of Amazonian Forests Including Those of the Guiana Shield. J. Trop. Ecol. 2000, 16, 801–828. [Google Scholar] [CrossRef] [Green Version]
  49. Wittmann, A.O.; Lopes, A.; Dos Santos Conserva, A.; Wittmann, F.; Piedade, M.T. Seed Germination and Seedlong Establishment of Amazonian Floodplain Trees. In Amazonian Floodplain Forest: Ecophysiology, Biodiversity and Sustainable Management; Junk, W.J., Piedade, M.T., Wittmann, F., Schöngart, J., Parolin, P., Eds.; Springer Science+Business Media: Berlin/Heidelberg, Germany, 2010; Volume 210, pp. 259–281. [Google Scholar]
  50. Furch, K. Chemistry of Várzea and Igapó Soils and Nutrient Inventory of Their Floodplain Forests. Ecol. Stud. 1997, 126, 47–67. [Google Scholar] [CrossRef]
  51. Hurtado, G.; González, O.C.; Montaña, J.A. Tercera Parte: Aspectos Departamentales; Henríquez, M., Ed.; Atlas climatológico de Colombia; Instituto de Hidrología, Meteorología y Estudios Ambientales de Colombia IDEAM: Bogotá, Colombia, 2005. [Google Scholar]
  52. Hernández, J.; Sánchez, H. Sabanas de Colombia. In Sabanas Naturales de Colombia; Banco de Occidente: Cali, Colombia, 1994; pp. 57–161. [Google Scholar]
  53. Romero, M. Estado de La Biodiversidad En El Piedemonte Orinoquense. In Sabanas y Bosques Asociados Al Norte Del Río Guaviare: Nivel de Ecosistemas; Romero, M., Maldonado-Ocampo, J., Eds.; Instituto de Investigaciones de Recursos Biológicos Alexander von Humboldt: Bogotá, Colombia, 2009. [Google Scholar]
  54. Prance, G.T. Notes on the Vegetation of Amazonia III. The Terminology of Amazonian Forest Types Subject to Inundation. Brittonia 1979, 31, 26–38. [Google Scholar] [CrossRef]
  55. Quiñones-Fernández, M.; Flórez-Ayala, C.; Estupiñán-Suarez, L. Historias Contadas Por El Agua. Frecuencias de Inundación. In Colombia Anfibia. Un País De Humedales; Jaramillo, U., Cortés-Duque, J., Flórez-Ayala, C., Eds.; Instituto de Investigación de recursos biológicos Alexander von Humboldt: Bogotá, Colombia, 2015; pp. 78–81. [Google Scholar]
  56. Phillips, O.; Baker, T.; Feldpausch, T.; Brienen, R. RAINFOR Manual de Campo Para La Remedición y Establecimiento de Parcelas; Pan-Amazonia. 2009. Available online: https://www.google.com.hk/url?sa=t&rct=j&q=&esrc=s&source=web&cd=&ved=2ahUKEwir7Mb99pH0AhXlr1YBHZUZDcAQFnoECAMQAQ&url=http%3A%2F%2Fwww.rainfor.org%2Fupload%2FManualsSpanish%2FManual%2FRAINFOR_field_manual_version2016_ES.pdf&usg=AOvVaw3Cd2ugEh_fbtl2XKkH6eB4 (accessed on 11 April 2020).
  57. Ter Steege, H.; Pitman, N.; Sabatier, D.; Castellanos, H.; Van Der Hout, P.; Daly, D.C.; Silveira, M.; Phillips, O.; Vasquez, R.; Van Andel, T.; et al. A Spatial Model of Tree α-Diversity and Tree Density for the Amazon. Biodivers. Conserv. 2003, 12, 2255–2277. [Google Scholar] [CrossRef]
  58. Jost, L. Entropy and Diversity. Oikos 2006, 113, 363–375. [Google Scholar] [CrossRef]
  59. R Core Team. R: A Language and Environment for Statistical Computing. R: A Language and Environment for Statistical Computing; R Foundation for Statistical Computing: Vienna, Austria. Available online: http://www.R-project.org/ (accessed on 26 August 2021).
  60. Henderson, A. Evolution and Ecology of Palms; The New York Botanical Garden Press: Bronx, Nueva York, NY, USA, 2002. [Google Scholar]
  61. Bray, J.R.; Curtis, J.T. An Ordination of the Upland Forest Communities of Southern Wisconsin. Ecol. Monogr. 1957, 27, 325–349. [Google Scholar] [CrossRef]
  62. Rangel-Ch, J.O.; Lowy-C, P.D.; Aguilar-P, M. Métodos de Estudio de la Vegetación. Colombia Diversidad Biótica II: Tipos de Vegetación en Colombia; Universidad Nacional de Colombia, Instituto de Ciencias Naturales: Bogotá, Colombia, 1997; pp. 59–87. [Google Scholar]
  63. Alvarez, E.; Duque, A.; Saldarriaga, J.; Cabrera, K.; de las Salas, G.; del Valle, I.; Lema, A.; Moreno, F.; Orrego, S.; Rodríguez, L. Tree Above-Ground Biomass Allometries for Carbon Stocks Estimation in the Natural Forests of Colombia. For. Ecol. Manag. 2012, 267, 297–308. [Google Scholar] [CrossRef]
  64. Holdridge, L.R.; Grenke, W.C.; Hatheway, W.H.; Liang, T.; Tosi, J.A. Forest Environments in Tropical Life Zones; Pergamon Press: Oxford, UK, 1971. [Google Scholar]
  65. Casas, L.F.; Aldana, A.M.; Henao-Diaz, F.; Villanueva, B.; Stevenson, P.R. Specific Gravity of Woody Tissue from Lowland Neotropical Plants: Differences among Forest Types. Ecology 2017, 98, 1474. [Google Scholar] [CrossRef] [Green Version]
  66. Pan, Y.; Birdsey, R.A.; Phillips, O.L.; Jackson, R.B. The Structure, Distribution, and Biomass of the World’s Forests. Annu. Rev. Ecol. Evol. Syst. 2013, 44, 593–622. [Google Scholar] [CrossRef] [Green Version]
  67. Lewis, S.L.; Phillips, O.L.; Baker, T.R.; Lloyd, J.; Malhi, Y.; Almeida, S.; Higuchi, N.; Laurance, W.F.; Neill, D.A.; Silva, J.N.M.; et al. Concerted Changes in Tropical Forest Structure and Dynamics: Evidence from 50 South American Long-Term Plots. Philos. Trans. R. Soc. B Biol. Sci. 2004, 359, 421–436. [Google Scholar] [CrossRef] [PubMed]
  68. Lewis, S.L.; Phillips, O.L.; Sheil, D.; Vinceti, B.; Baker, T.R.; Brown, G.; Andrew, W.H.; Niro, H.; David, W.; Laurance, W.F.; et al. Tropical forest tree mortality, recruitment and turnover rates: Calculation, interpretation and comparison when census intervals vary. J. Ecol. 2004, 92, 929–944. [Google Scholar] [CrossRef]
  69. Umaña, M.N.; Norden, N.; Cano, Á.; Stevenson, P.R. Determinants of Plant Community Assembly in a Mosaic of Landscape Units in Central Amazonia: Ecological and Phylogenetic Perspectives. PLoS ONE 2012, 7, e45199. [Google Scholar] [CrossRef]
  70. Laurance, W.F.; Lovejoy, T.E.; Vasconcelos, H.L.; Bruna, E.M.; Didham, R.K.; Stouffer, P.C.; Gascon, C.; Bierregaard, R.O.; Laurance, S.G.; Sampaio, E. Ecosystem Decay of Amazonian Forest Fragments a 22-Year Investigation. Conserv. Biol. 2002, 16, 605–618. [Google Scholar] [CrossRef] [Green Version]
  71. Ferreira, L.V. Effects of the Duration of Flooding on Species Richness and Floristic Composition in Three Hectares in the Jau National Park in Floodplain Forests in Central Amazonia. Biodivers. Conserv. 1997, 6, 1353–1363. [Google Scholar] [CrossRef]
  72. De Jesus Veiga Carim, M.; Wittmann, F.K.; Piedade, M.T.F.; Da Silva Guimarães, J.R.; de Cássia Leôncio Tostes, L. Composition, Diversity, and Structure of Tidal “Várzea” and “Igapó” Floodplain Forests in Eastern Amazonia, Brazil. Rev. Bras. Bot. 2017, 40, 115–124. [Google Scholar] [CrossRef]
  73. Mori, G.B.; Schietti, J.; Poorter, L.; Piedade, M.T.F. Trait Divergence and Habitat Specialization in Tropical Floodplain Forests Trees. PLoS ONE 2019, 14, 1–14. [Google Scholar] [CrossRef]
  74. Targhetta, N.; Kesselmeier, J.; Wittmann, F. Effects of the Hydroedaphic Gradient on Tree Species Composition and Aboveground Wood Biomass of Oligotrophic Forest Ecosystems in the Central Amazon Basin. Folia Geobot. 2015, 50, 185–205. [Google Scholar] [CrossRef]
  75. Ferreira, L.V. Species Richness and Floristic Composition in Four Hectares in the Jaú National Park in Upland Forest in Central Amazonia. Biodivers. Conserv. 1998, 7, 1349–1364. [Google Scholar] [CrossRef]
  76. Parolin, J.A.; Rodrigues, W.A.; Amaral, I.; Piedade, M.T.F. Floristic Study of Igapó Floodplain in Central Amazonia, Brazil (Tarumã-Mirim, Rio Negro). Amazoniana 2004, 18, 29–47. [Google Scholar]
  77. Condit, R.; Hubbell, S.P.; Foster, R.B. Short-Term dynamics of a neotropical forest. Bioscience 1992, 42, 822–828. [Google Scholar] [CrossRef]
  78. Parolin, P. Radial Gradients in Wood Specific Gravity in Trees of Central Amazonian Floodplains. IAWA J. 2002, 23, 449–457. [Google Scholar] [CrossRef]
  79. Saatchi, S.; Houghton, R.A.; Dos Santos Alvalá, R.C.; Soares, J.V.; Yu, Y. Distribution of Aboveground Live Biomass in the Amazon Basin. Glob. Chang. Biol. 2007, 13, 816–837. [Google Scholar] [CrossRef]
  80. Clark, D.A.; Brown, S.; Kicklighter, D.W.; Chambers, J.Q.; Thomlinson, J.R.; Ni, J.; Holland, E.A. Net Primary Production in Tropical Forests: An Evaluation and Synthesis of Existing Field Data. Ecol. Appl. 2001, 11, 371–384. [Google Scholar] [CrossRef]
  81. Yepes, A.; Herrera, J.; Phillips, J.; Cabrera, E.; Galindo, G.; Granados, E.; Duque, Á.; Barbosa, A.; Olarte, C.; Cardona, M. Contribución de Los Bosques Tropicales de Montaña En El Almacenamiento de Carbono En Colombia. Rev. Biol. Trop. 2014, 63, 69–82. [Google Scholar] [CrossRef] [Green Version]
  82. Restrepo, I.C.; Aldana, A.M.; Stevenson, P. Dinámica de Bosques En Diferentes Escenarios de Tala Selectiva En El Magdalena Medio (Colombia). Colomb. For. 2016, 19, 195–208. [Google Scholar] [CrossRef]
  83. Landínez, A.; Linares, E. Plantas Dendroenergéticas Utilizadas Por Una Comunidad Indígena Piapoco En Guainía, Colombia. Cult. Científica 2006, 4, 29–35. [Google Scholar]
Figure 1. Map showing the study area in the Colombian Orinoco basin, municipality of Santa Rosalía, Vichada (indicated by the red square in the inset map), and the locations of five one-hectare permanent vegetation plots in terra firme (black) and igapó forests (grey). The map was generated using ArcGIS v10.7.
Forests 12 01568 g001
Figure 2. (a) Vegetation structure based on the frequency of individuals per hectare, classified according to diameter at breast height (DBH) classes for igapó and terra firme gallery forests in Tomogrande Reserve. (b) Relationship between DBH and total tree height for all tree individuals (excluding palms) sampled in two igapó and three terra firme one-hectare plots. The lines represent the linear regression fit.
Forests 12 01568 g002
Figure 3. (a) Non-metric multidimensional scaling (NMDS) arrangement (stress value = 0.11), based on Bray–Curtis dissimilarity, representing the floristic composition of woody plants with DBH ≥ 10 cm in five permanent vegetation plots in terra firme and igapó gallery forests. Ellipses represent 95% confidence intervals groups formed by the subplots (20 × 20m) of each forest type. (b) NMDS arrangement (stress value = 0.13), using Bray–Curtis dissimilarity, of the physicochemical composition of soils based on soil texture (clay, silt, sand), nitrogen (N), phosphorus (P), bases (Ca + Mg + K + Na), aluminum (Al), organic carbon content, and pH for terra firme and igapó flooded forests. Black and grey points represent samples of topsoil taken from the center of each 20 × 20 m in terra firme and igapó forests, respectively.
Forests 12 01568 g003
Figure 4. (a) Annual mortality rate, (b) annual recruitment rate, (c) annual stem turnover rate and (d) annual growth rate, in percentages, for each forest type, using 20 m × 20 m subplots as the sample unit. A subset of eight non-adjacent subplots per hectare was used to reduce pseudo-replication effects in mortality, recruitment and stem turnover rates: 16 subplots for igapó and 24 for terra firme. Thick horizontal lines represent the mean for each forest type, and the dotted lines represent the variance. The letters above indicate statistically significant differences among forest types (p < 0.05) using a Wilcoxon test for mortality and recruitment rates and a t-test for stem turnover and relative growth rates.
Forests 12 01568 g004
Table 1. Summary of diversity, species richness and percentage of tilted individuals, according to forest type, based on three one-hectare vegetation plots in terra firme forest and two plots in igapó flooded forest in the Tomogrande Reserve, Vichada. eH refers to the exponential Shannon entropy index.
Forest TypeMean No. of Individuals/ha (Min.–Max.)Mean No. of Species /ha
(Min.–Max.)
Fisher’s αeHTilted Trees (%)
(Min.–Max.)
Terra firme450.3 (440–478)77 (65–85)30.3949.892.07 (3.2–1.1)
Igapó691.5 (607–776)41 (36–46)12.5222.598.53 (6.1–10.4)
Table 2. Aboveground biomass (AGB) mean, annual change, carbon stock and carbon accumulation in terra firme and igapó forests in the Colombian Orinoco basin, calculated over five one-hectare permanent vegetation plots. Carbon mean values consider that 45% of AGB is carbon.
Forest TypeMean AGB (t/ha) Change in AGB (t/ha/Year) Carbon Stock
(t/ha)
Carbon Accumulation
(t/ha/Year)
Terra firme (n = 3)128.7 ± 22.140.73 ± 1.1557.92 ± 9.960.33 ± 0.51
Igapó (n = 2)169.9 ± 0.831.47 ± 0.0676.46 ± 0.370.66 ± 0.03
Publisher’s Note: MDPI stays neutral with regard to jurisdictional claims in published maps and institutional affiliations.

