How Do Tilia cordata Greenspire Trees Cope with Drought Stress Regarding Their Biomass Allocation and Ecosystem Services?


1
Chair for Forest Growth and Yield Science, School of Life Sciences, Technische Universität München, Hans-Carl-von-Carlowitz-Platz 2, 85354 Freising, Germany
2
Department of Landscape Architecture, Weihenstephan-Triesdorf University of Applied Sciences, Weihenstephaner Berg 17, 85354 Freising, Germany
*
Author to whom correspondence should be addressed.
Forests 2019, 10(8), 676; https://doi.org/10.3390/f10080676
Submission received: 29 June 2019
/
Revised: 7 August 2019
/
Accepted: 8 August 2019
/
Published: 9 August 2019
(This article belongs to the Special Issue Growth and Ecosystem Services of Urban Trees)
Abstract
:In the context of climate change, drought is likely to become more frequent and more severe in urban areas. Urban trees are considered to play an important role in fixing carbon, improving air quality, reducing noise and providing other ecosystem services. However, data on the response of urban trees to climate change, particularly to drought, as well as the relationship between their below- and above-ground processes in this context, are still limited, which prevents a comprehensive understanding of the role of urban trees in ameliorating some of the adverse effects of climate change and their ability to cope with it. To investigate whole-plant responses to water shortages, we studied the growth of Tilia cordata Greenspire, a commonly planted urban tree, including development of its roots and stem diameter, leaf parameters and the harvested biomass. Our results showed that this cultivar was susceptible to drought and had reduced biomass in all three compartments: branch (30.7%), stem (16.7%) and coarse roots (45.2%). The decrease in the root:shoot ratio under drought suggested that more carbon was invested in the above-ground biomass. The development of fine roots and the loss of coarse root biomass showed that T. cordata Greenspire prioritised the growth of fine roots within the root system. The CityTree model’s simulation showed that the ability of this cultivar to provide ecosystem services, including cooling and CO2 fixation, was severely reduced. For use in harsh and dry urban environments, we recommend that urban managers take into account the capacity of trees to adapt to drought stress and provide sufficient rooting space, especially vertically, to help trees cope with drought.
1. Introduction
In the future, drought is projected to occur more frequently under the warmer conditions associated with the progression of climate change [1]. Additionally, in association with increasing urbanisation, extreme heat events have become more prevalent than in previous decades, which reduce environmental quality [2,3,4]. Urban trees can mitigate environmental degradation by storing carbon, purifying the air, reducing storm water and providing other ecosystem services [5,6,7]. Urban trees can also be a key component in the adaptation of cities to climate change [8]. Hence, in recent decades, the use of urban trees for various purposes has drawn increasing interest from researchers [9]. For example, Nowak et al. [10] studied how urban trees can filter pollutants that have adverse effects on human health. Konarska et al. [11] quantified the magnitude of daytime and night-time transpiration of common urban tree species. In addition, Velasco et al. [12] reported that carbon sequestration depends on the characteristics of urban trees, and Pretzsch et al. [13] proposed that urban climates can either accelerate or decelerate tree growth.
Water availability is considered to be the most important determinant of tree growth [14,15], and a higher frequency of drought events will expose urban trees to more restrictive growth conditions. To improve the quality of ecosystem services, how different urban tree species cope with drought stress has been commonly discussed [16]. Rötzer et al. [17] pointed out that stress caused by a water deficit could reduce photosynthetic productivity and tree growth. Moser et al. [18] found marked growth reductions during drought periods and subsequent rapid recovery in Robinia pseudoacacia L. Furthermore, Stratópoulos et al. [19] proposed that trees from dry regions, such as Ostrya carpinifolia Scop. and Tilia tomentosa Moench ‘Brabant’, show a high tolerance to drought stress; however, this tolerance can come at the expense of above-ground biomass production.
The adaptation of urban trees to drought has been a recent topic of research, but there is still a knowledge gap regarding carbon allocation as well as ecosystem services [20]. Carbon allocation between below- and above-ground biomasses is one of the key parameters towards understanding tree survival, especially under the global change accompanied by urbanisation [21]. Data on the relationship between below- and above-ground processes is limited, which may result in scarce information of the ecophysiology and hydric behaviour of urban trees under climate change [22,23,24]. The development of below-ground biomass has also been rarely studied because of multiple factors such as soil compaction, limited root volume and harsh paved environments [25,26,27]. Furthermore, urban trees can make an enormous contribution to mitigating the urban heat islands by providing a cooling effect [28,29], which is considered a feasible option for adapting to climate change [30]. Hence, information regarding how urban trees allocate their biomass and provide ecosystem services such as cooling and carbon fixation is crucial for city planners to implement appropriate management practices [31].
In some previous studies, only allometric equations were used to estimate such allocation because of the expensive and time-consuming harvesting process [32]. This has led to a lack of precise information on carbon allocation, and hence researchers have been prevented from establishing appropriate strategies for managing urban trees. Against this background, in this study, we selected Tilia cordata Mill. ‘Greenspire’, a cultivar widely planted in Central European cities, to analyse tree growth and carbon allocation under undisturbed growing conditions (control) and under extreme drought. Combined with a harvesting campaign, we applied the urban tree model CityTree to simulate biomass development as well as ecosystem services. The following research questions are addressed in this work: (1) How does T. cordata Greenspire respond to extreme drought in terms of growth and carbon allocation? (2) What is the cultivar’s strategy within the root system? (3) Are its ecosystem services severely affected under drought?
2. Materials and Methods
2.1. Study Site and Drought Experiment in 2017
This study was performed at the municipal nursery of Munich (48°08′05′′ N, 11°28′47′′ E, 534 m a.s.l.), the major city in the southeast of Germany under the marine west coast climate. With the predominant soil types ranging from moderate sandy loam to strong loamy sand, the 42 ha nursery shows very little variation in terms of microclimatic conditions. The measurements in this study were performed from April 12 to November 12, 2017. Eight young individuals of T. cordata Greenspire with diameters of 5–6 cm at a height of 1 m were selected, four of which were set as a ‘control’ group and the other four as a ‘dry-treatment’ group. Each tree was more than 2 m away from the others to avoid the mutual effect.
For the drought-stress experiment, we used experimental settings in which conditions of an enduring drought event were simulated to investigate the tree growth responses. The rooting spaces of the four trees in the dry-treatment group were covered by a rainfall exclusion roof (RER) from May to November in 2017, whereas the four trees in the control group were exposed to normal weather conditions. The RER was made up of several waterproof tents (2 × 3 m) combined with nylon ropes and installed at a height of 1 m, sloping to the ground in the north and south directions at 3 m from the trees (Figure 1).
2.2. Measurement of Climate Variables and Soil Moisture
Climate variables, including temperature and precipitation, were sampled every 10 min with a weather station (Davis Vantage Pro2; Davis Instruments, Hayward, CA, USA) located at an unshaded site approximately 200 m away from the experimental plots. 2017 was a warm year at the site, with an mean temperature of 10.3 °C and a total precipitation of 887 mm. The spring of 2017 was warm, sunny and dry. After a strong return to cold weather in April, the temperature started to increase at the beginning of May and remained exceptionally high, in that the average temperature was 19.6 °C from July to August. In this period, monthly precipitation levels of 101 and 123 mm were similar to the long-term records (within 1981–2010) of 122 and 115 mm. The temperature showed a declining trend in early September, and night frost started in the middle of November (DWD, 2018) (see Figure 2).
We measured the volumetric soil water content (VWC; Vol.%) with a portable tool (UMP-1; UGT, Müncheberg, Germany) at the rooting zones of all the trees four times in the summer of 2017, with the goal of comparing the moisture differences between the control and the dry-treatment groups (see Table 1). The values of VWC between the control and the dry-treatment groups were significantly different for all the four times (p < 0.01), which proved the success of the drought simulation.
2.3. Measurement of Above- and Below-Ground Biomasses
The stem diameter at a height of 1 m was measured using a digital caliper at the beginning of each month from April to November 2017. Measurements in two perpendicular directions (N–S and E–W) were performed and averaged.
Fine root coring campaigns were launched for all trees in May, September and November: that is, at the beginning (pre-drought), in the middle and at the end of the growing season. A pre-test coring campaign showed that the range of the root system was similar to a cylinder, with a diameter of 70 cm and a height of 35 cm. Therefore, during every coring campaign, four soil cores were collected for every individual tree: two at a distance of 15 cm from the trunk and two at a distance of 30 cm. The soil was sampled down to a depth of 30 cm using a soil auger with a length of 30 cm and a radius of 3 cm. Each sample was divided into three horizons: soil depths of 0–10 cm (upper layer), 10–20 cm (middle layer) and 20–30 cm (deep layer). Fine roots (< 2 cm) were filtered using sieves (2-mm mesh size) and separated by forceps in the laboratory. Then, the samples were washed and dried in an oven at 65°C for 72 h. Finally, all the samples were weighed using a balance with an accuracy of four decimal places to obtain the dry weight. The fine root biomass at different depths was calculated using the dry weight divided by the cross-sectional area of the auger.
In November, a harvest campaign was launched in which all the trees were excavated with a tree digger and divided into three parts: branch, stem and coarse roots. All these compartments were dried at 65 °C for 72 h and weighed using a balance with an accuracy of up to four decimal places to obtain the dry weight. Before drying, the root systems were washed to remove attached soil and stones. An image analysis process including taking high-resolution photos from five views (N, S, W, E and top) was applied to measure the root architecture with the help of the software ‘Root System Analyzer’ (RSA, University of Vienna, Austria). On the basis of a graphical representation of the skeletonised image of the root system as well as segmentation algorithms, RSA was used to describe some of the root traits, including root nodes, width and depth.
The leaf area index (m2 m−2; LAI) was determined using hemispherical photographs (Nikon Coolpix P5100 camera with a fisheye lens and Mid-OMount) and analysed with the program WinSCANOPY (Régent Instruments Inc., Quebec, Canada). Data acquisition was performed under conditions of a uniformly overcast sky in the middle of June, shortly after implementation of the drought experiment. Sufficient numbers of points (7–11 x, z pairs) were measured and input into the software FV2200 (LICOR Biosciences, Lincoln, NE) to compute the projected crown area (PCA) of each tree. Combined with the specific leaf area (SLA), the leaf biomass was calculated as follows:
Therefore, the below-ground biomass was the sum of the fine and coarse root biomasses, and the above-ground biomass was the sum of the branch, stem and leaf biomasses.
2.4. Simulation of Biomass and Ecosystem Services
A process-based model was used to simulate the wood biomass of T. cordata Greenspire and calculate its ecosystem services [33,34]. On the basis of the basic measurements of trees (e.g., DBH (diameter at breast height) and tree height), climate and soil data, this model consists of seven modules to calculate tree growth and ecosystem services such as CO2 fixation, evapotranspirational cooling and shading. The core function of the simulation of a tree’s net assimilation is as follows:
where A is gross assimilation (g C m−2 d−1), d is mean day length of the month, Jp is reaction of photosynthesis on absorbed photosynthetic radiation (g C m−2 h−1), Jr is the Rubisco-limited rate of photosynthesis (g C m−2 h−1), and θ is the form factor (= 0.7).
Jp is a function of the photosynthetic active radiation (PAR) and the efficiency of carbon fixation per absorbed PAR, which can be calculated on the basis of the intrinsic quantum efficiency for CO2 uptake, the partial pressure of internal CO2, the CO2 compensation point, the influence of temperature on the efficiency and a species-dependent adjustment function for tree age. The Rubisco-limited rate of photosynthesis Jr can be estimated by the maximum catalytic Rubisco capacity, the maximum day length, the Michaelis–Menten constant of CO2 depending on temperature, the inhibition constant of O2 against CO2 (temperature-dependent) and the O2 concentration.
Net assimilation AN is calculated as follows:
where Rd is the product of the maximum catalytic Rubisco capacity and the ratio of the maximum catalytic Rubisco capacity and the respiration cost. A fixed share of 50% of the net assimilation is assumed for growth and maintenance respiration [35]. The tree growth represented the fixation of carbon, and the fixation of CO2 was calculated based on fixation of carbon and the relative molecular mass.
For the ecosystem service of evapotranspiration, the central water balance equation from the water balance module was as:
With prec = precipitation (mm), int = interception (mm), eta = actual evapotranspiration (mm), ro = runoff (mm), ∆φ = change of the soil content (mm).
Within the module cooling the energy needed for the transition of water from liquid to gaseous phase was calculated based on the CPA (crown projected area) and the transpiration eta sum:
With EA: energy released by a tree through transpiration (kWh tree−1), LO: energy needed for the transition of the 1 kg of water from the liquid to gaseous phase = 2.498 MJ (kgH2O)−1 and temp = temperature in °C, fcon: conversion factor.
2.5. Statistical Analysis
The software package R [36] was used for statistical analysis. To investigate the difference between means, two-sampled t-test and analysis of variance (ANOVA) with Tukey’s HSD (honestly significant difference) test were used. In all the cases the means were reported as significant when p < 0.05. Where necessary, data were log or power transformed in order to correct for data displaying heteroscedasticity.
3. Result
3.1. Stem Growth Under Drought
At the beginning of the growing season, the two groups had similar and slight decreases in diameter. From May to August, distinctly different increases were observed, with the control group exhibiting more rapid growth than the dry-treatment group (p < 0.05). Despite the similar patterns, in autumn, the dry-treatment group had a more obvious and severe decrease in the diameter increment (see Figure 3).
3.2. Fine Root Development and Root Image Analysis
The total fine root biomasses of the control and dry-treatment groups were not significantly different in May, September and November (p > 0.05). However, we found different patterns from the control and treatment group. From May to September, the total fine root biomass in the control group had an obvious increase from 118.8 to 160.4 g m−2 while that decreased from 177.9 to 145.7 g m−2 in the treatment group (p < 0.05). From September to November, both the control and treatment groups had slight growths from 160.4 to 162.2 g m−2 and from 145.7 to 155.8 g m−2 (p < 0.05).
For more detailed information of the dynamics of the fine root biomass, we divided the fine roots into three layers. For the control group, except for a distinct growth for the deep layer (from 43.5 to 84.9 g m−2), slight development was found for the other circumstances (see Figure 4). From May to September, however, the biomass in the upper and middle soil layers (0–10 and 10–20 cm) in the dry-treatment group decreased from 43.4 and 70.1 g m−2 to 10.0 and 29.9 g m−2, whereas the fine roots in the deep layer still maintained distinct development from 64.4 to 105.8 g m−2. Additionally in autumn, an adverse growth pattern was observed: only the deep fine root biomass decreased, whereas the upper and middle fine roots increased from 10.0 to 30.1 g m−2 and from 29.9 to 48.9 g m−2, respectively.
Although no significant difference was found between the control and dry-treatment groups (p > 0.05), the RSA software showed that the root system in the dry-treatment group exhibited decreases compared with the control group in terms of width, root number and node number. The numbers of root and node in the dry-treatment group were 1015 ± 155 and 804 ± 116, which were less than the control ones with the number of 1087 ± 182 and 841 ± 130. Besides maintaining the rooting depth, the root system in the dry-treatment group showed a slight decrease from 0.69 ± 0.04 to 0.65 ± 0.07 m in rooting width (see Figure 5).
3.3. Biomass Allocation and Root:Shoot Ratio
Generally, the stem biomass had the largest proportion of the tree, followed by the root system, and the branches had the lowest share (see Table 2). From the harvesting campaign, reductions of branch biomass (30.7%), stem biomass (16.7%) and coarse root biomass (45.2%) were observed. The biomasses of all three compartments in the dry-treatment group showed a distinct decrease in comparison to the control group, with the coarse roots in particular showing the largest difference (Pbranch < 0.01, Pstem < 0.05 and Pcoarse roots < 0.001).
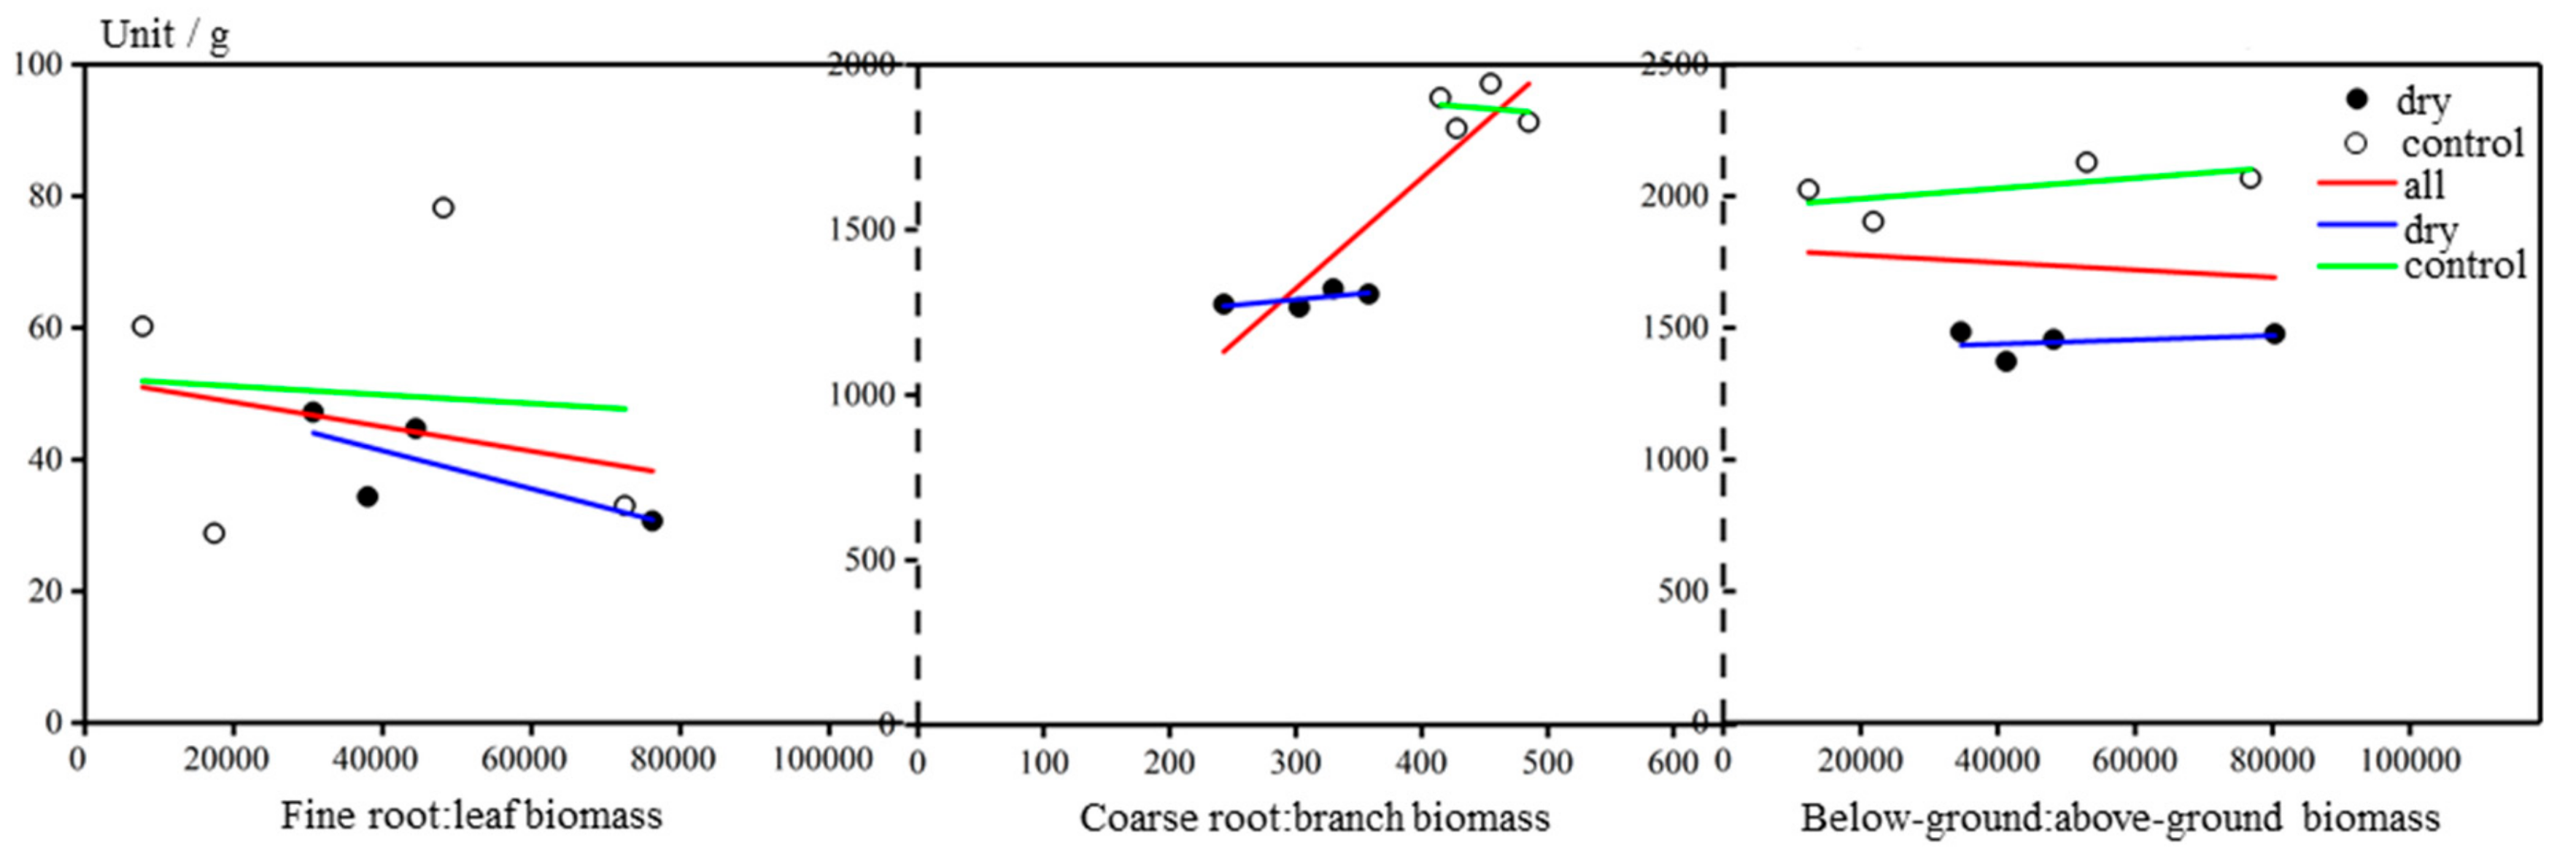
Three types of root:shoot ratio were calculated: (1) fine root:leaf biomass ratio, (2) coarse root:branch biomass ratio and (3) below-ground:above-ground biomass ratio. All the root:shoot ratios were significantly different (p < 0.05), with roots in the dry-treatment group constituting less of a proportion of the whole tree than in the control group (Figure 6). Among the ratios, the coarse root:branch ratio showed the greatest difference (p < 0.01).
3.4. Simulation of Biomass and Ecosystem Services
Using the urban tree growth model CityTree [34], the above-ground, below-ground and overall biomasses for both the control and dry-treatment groups can be simulated. The measured and simulated biomasses of the trees, including the above-ground, below-ground and overall biomasses, had no significant differences, which showed the model’s reliability in prediction (p > 0.05). Higher but not significantly different simulation was found in the dry-treatment group for the above-ground and overall biomasses (see Figure 7).
The CityTree model also simulated biomass development for the entire year 2017 (Figure 8). In the control group, for the above- and below-ground biomasses, distinct increases of 0.6 kg tree−1 (from 3.9 to 4.5 kg tree−1) and 0.4 kg tree−1 (from 0.9 to 1.3 kg tree−1) were obtained, respectively. In the treatment group, however, trees showed scarce development, in that only a slight increase of 0.1 kg tree−1 was observed (from 5.4 to 5.5 kg tree−1). For the root:shoot ratio, increases were found from 0.23 to 0.29 and from 0.02 to 0.27 for the control and treatment groups, respectively, from January to December.
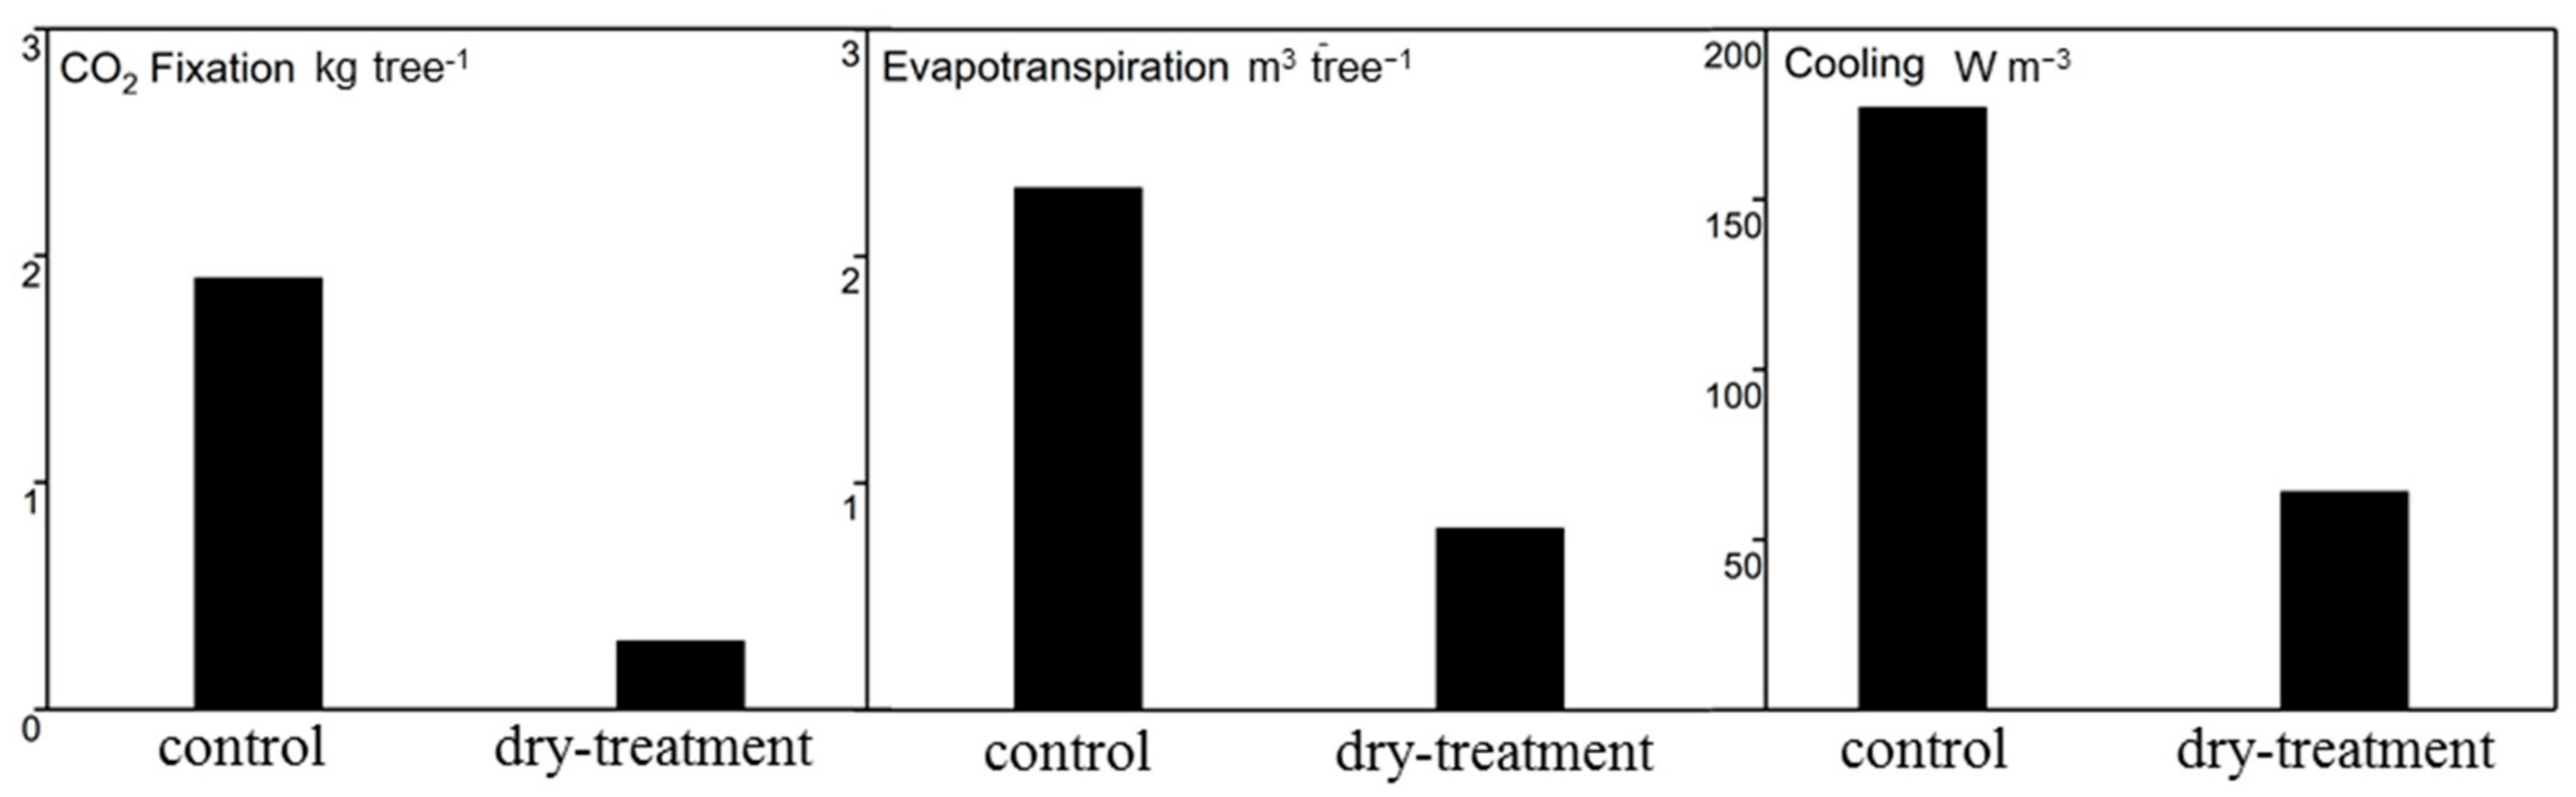
By using the model CityTree, the ecosystem services of the trees, such as CO2 fixation, water consumption and cooling potential by transpiration, could also be estimated. Figure 9 gives the values of these variables.
The trees of the control group showed significantly higher CO2 fixation than those of the dry-treatment group. Each tree in the control group could fix 1.9 kg CO2 year−1, which was far more than 0.3 kg CO2 year−1 calculated for trees of the dry-treatment group. With a three times higher evapotranspiration (2.3 m3 tree−1 compared with 0.8 m3 tree−1), the cooling potential provided by the control group trees was almost trebled compared with that of the dry-treatment group trees (177 W m−3 compared with 64 W m−3). In summary, under the intense drought conditions associated with rainfall exclusion, all the ecosystem services of the lime trees were markedly reduced.
4. Discussion
4.1. Growth Patterns Under Drought
This study aimed to compare and analyse the growth patterns of T. cordata Greenspire from the control and dry-treatment groups. On the basis of the significant difference in soil water between the control and treatment groups (p < 0.01), our RER proved to be successful at simulating drought stress. The effects of drought manipulations are very complex [37], and the responses of plants to water scarcity are complicated, involving adaptive changes [38]. Under normal conditions, T. cordata Greenspire exhibited steady growth, especially in spring, which is consistent with previous research [18]. Since the RER was established, T. cordata Greenspire showed reduced stem growth in the dry-treatment group (p < 0.05). Furthermore, a large number of leaves died in the summer of 2017, in line with the decreased LAI. From the harvesting campaign, all the three compartments (branch, stem and coarse roots) showed significant reductions in their biomass in the dry-treatment group compared with the levels in the control group. Overall, the findings showed that T. cordata Greenspire did not cope well with a dry period and lost a great deal of biomass, which could be thought of as being associated with a negative water balance due to insufficient water supply. This is also in line with previous research showing that the water management of T. cordata Greenspire was disrupted following growth reduction [19,39].
The root:shoot ratio is often used to estimate relative biomass allocation between roots and shoots [37,40,41]. Previous studies have reported that, for some drought-resistant tree species, drought induced root growth to enhance water uptake, which led to an increase in the root:shoot ratio [42,43]. Mokany et al. [44] proposed that an increase in the root:shoot ratio could be a strategy when facing drought in the long term, whereas water shortage could shift carbon allocation to storage in the short term [45]. In our study, drought significantly (p < 0.05) reduced all three types of root:shoot ratio (fine root:leaf biomass ratio, coarse root:branch biomass ratio and below-ground:above-ground biomass ratio), which showed an opposite pattern to those drought-resistant tree species. Besides, the early discolouring and fall of leaves together with the biomass decrease in all the three compartments (i.e. coarse roots, stem and branches) suggested that T. cordata Greenspire did not have the means to positively adapt to drought. Additionally, the differences in water use efficiency between T. cordata Greenspire on the one hand and Acer campestre L. subsp. campestre, O. carpinifolia and T. tomentosa ‘Brabant’ from drier habitats on the other were measured and analysed [19]. The results showed that T. cordata Greenspire coped poorly with drought with highly reduced water use, whereas the other three tree species/cultivars maintained higher water use efficiency, possibly because of the better use of carbon for root production at the expense of above-ground biomass. Hence, the growth patterns of stem growth, biomass allocation and root:shoot ratios showed that T. cordata Greenspire failed to act as a drought-resistant cultivar.
4.2. Strategy Within the Root System
Fine roots are the main plant component involved in absorbing water and nutrients, whereas coarse roots provide stability [46,47]. Joslin et al. [48] and Germon et al. [49] proposed that the cost of fine root construction could be balanced by the uptake of water under drought stress. In this study, the control group showed gradual development from May to September and maintained its biomass from September to November. In contrast, fine root biomass was reduced from May to September but slightly increased from September to November in the dry-treatment group. Combined with the results of Figure 5, the root system in the dry-treatment group had fewer roots and nodes as well as decreased widths. Taking into account the decreased root:shoot ratio, it was shown that T. cordata Greenspire did not invest greatly in the root system.
Nevertheless, we found a particular pattern where the deep fine roots achieved substantial development, whereas the fine root biomass of the upper and middle layers clearly decreased. Gewin [50] showed that deep roots could be crucial to alleviating water stress in plants, especially for plants living in tropical and subtropical environments [51]. This suggests that, within the root system, T. cordata Greenspire prioritises deep fine roots to enhance its water uptake capacity rather than the shallow ones, which is in line with previous findings [52,53]. Furthermore, from September to November, it was observed that the deep roots had a decrease while the biomass from the upper and middle layer had an obvious development. This could be implied that the response of fine root to drought had a time difference among layers. Overall, despite inadequate investment in the root system, the dynamics of fine roots in different layers could reflect the positive behavior under drought.
4.3. Simulated Ecosystem Service Provision Under Drought Stress
Ecological process-based models have been applied widely for ecological issues, including biodiversity, phenology, hydrology and ecosystem services [54]. To obtain reliable predictions, however, the process-based models need to be validated first, in combination with observational data [55]. In our study, the CityTree model was first used to simulate the biomass from the below-ground and above-ground processes. The results showed high performance of the model, in that little difference was found between the observation and the simulation. Hence, the model should be reliable for simulating ecosystem services.
Figure 9. suggests that T. cordata Greenspire trees provided much less ecosystem services under heavy drought than unstressed trees in terms of CO2 fixation, transpiration and cooling. This can be explained by the fact that, under conditions of water shortage, the lime trees had to expend more energy in seeking out water to survive. However, on the basis of clearly reduced total transpiration, the total biomass growth was markedly reduced, which led to a reduction in carbon fixation of 84% in the drought-stressed lime trees compared with the unstressed trees. Along with the smaller amounts of transpiration, the cooling effect was reduced by 64% for the drought-stressed trees. Besides, Figure 8 shows that the model predicted higher (albeit not significantly) biomass for the drought-stressed trees than for the control trees, which suggests that drought stress had a more severe impact in reality than predicted by the model. Taking this conservative prediction into account, the negative impact of drought stress on the ecosystem services provided by T. cordata Greenspire might be more serious.
5. Conclusions
In 2014, the IPCC (The Intergovernmental Panel on Climate Change) predicted that extreme climatic events such as severe drought would become more common and severe in the future. The urbanisation accompanying such global change can alter the composition, structure and biogeography of vegetation in cities and surrounding areas [56]. Hence, obtaining comprehensive knowledge about how urban trees react to and cope with dry conditions can be of utmost importance for ecosystem services in cities.
We analysed tree growth and simulated ecosystem services under drought conditions for T. cordata Greenspire. The cultivar appeared to be susceptible to drought, in that the biomasses of coarse roots, stem and branches decreased following a decrease in the root:shoot ratio and demonstrated substantial failure to provide ecosystem services. With the loss of much root biomass, it tended to invest in fine roots. At the beginning of drought, investment was given to the deep fine roots and in autumn the shallow fine roots obtained more development. Therefore, urban trees, particularly drought-susceptible tree species and cultivars such as T. cordata Greenspire, should be planted in large soil pits so that water shortages are minimised. Intensive maintenance of the trees based on their growth patterns as well as on the site and soil conditions could preserve tree vitality and enhance tree growth and the provision of ecosystem services.
Against a background of global climate change and increasing urbanisation, featuring an enhanced impact of urban heat on tree growth and vitality, T. cordata Greenspire will become a vulnerable urban tree species in Central European cities. Especially in temperate cities where currently the precipitation in summer is low and where future climate conditions may feature droughts of increasing number and intensity, tree species and cultivars such as T. cordata Greenspire will suffer severely. Long-term drought experiments are necessary to obtain detailed knowledge about the behaviour of urban tree species under intense drought conditions, and such information will be crucial for landscape planners and architects.
Author Contributions
Data curation, C.Z. and L.M.F.S.; Formal analysis, C.Z., L.M.F.S. and T.R.; Investigation, C.Z.; Methodology, C.Z., L.M.F.S. and T.R.; Project administration, T.R.; Resources, L.M.F.S. and T.R.; Software, T.R.; Supervision, H.P. and T.R.; Validation, C.Z.; Writing—original draft, C.Z.; Writing—review & editing, L.M.F.S. and T.R.
Acknowledgments
We thank the municipal nursery of Munich for the support and encouragement to conduct our field study there. The authors also express their gratitude to Yuan Ni for her help in creating the graphs and Jonas Schweiger for his assistance in field data collection.
Conflicts of Interest
The authors declare no conflicts of interest.
References
- Change, I.C. Impacts, Adaptation, and Vulnerability. Part A: Global and Sectoral Aspects. Contribution of Working Group II to the Fifth Assessment Report of the Intergovernmental Panel on Climate Change; IPCC: Geneva, Switzerland, 2014. [Google Scholar]
- Gregg, J.W.; Jones, C.G.; Dawson, T.E. Urbanization effects on tree growth in the vicinity of New York City. Nature 2003, 424, 183. [Google Scholar] [CrossRef] [PubMed]
- Breshears, D.D.; Cobb, N.S.; Rich, P.M.; Price, K.P.; Allen, C.D.; Balice, R.G.; Romme, W.H.; Kastens, J.H.; Floyd, M.L.; Belnap, J. Regional vegetation die-off in response to global-change-type drought. Proc. Natl. Acad. Sci. USA 2005, 102, 15144–15148. [Google Scholar] [CrossRef] [PubMed] [Green Version]
- Alberti, M. The effects of urban patterns on ecosystem function. Int. Reg. Sci. Rev. 2005, 28, 168–192. [Google Scholar] [CrossRef]
- Greene, C.S.; Robinson, P.J.; Millward, A.A. Canopy of advantage: Who benefits most from city trees? J. Environ. Manag. 2018, 208, 24–35. [Google Scholar] [CrossRef] [PubMed]
- Xing, Y.; Brimblecombe, P. Role of vegetation in deposition and dispersion of air pollution in urban parks. Atmos. Environ. 2019, 201, 73–83. [Google Scholar] [CrossRef]
- Roy, S.; Byrne, J.; Pickering, C. A systematic quantitative review of urban tree benefits, costs, and assessment methods across cities in different climatic zones. Urban For. Urban Green. 2012, 11, 351–363. [Google Scholar] [CrossRef] [Green Version]
- Tyrväinen, L.; Pauleit, S.; Seeland, K.; de Vries, S. Benefits and uses of urban forests and trees. In Urban Forests and Trees; Springer: Berlin/Heidelberg, Germany, 2005; pp. 81–114. [Google Scholar]
- Dwyer, J.F.; Schroeder, H.W.; Gobster, P.H. The significance of urban trees and forests: Toward a deeper understanding of values. J. Arboric. 1991, 17, 276–284. [Google Scholar]
- Nowak, D.J.; Greenfield, E.J.; Hoehn, R.E.; Lapoint, E. Carbon storage and sequestration by trees in urban and community areas of the United States. Environ. Pollut. 2013, 178, 229–236. [Google Scholar] [CrossRef] [Green Version]
- Konarska, J.; Uddling, J.; Holmer, B.; Lutz, M.; Lindberg, F.; Pleijel, H.; Thorsson, S. Transpiration of urban trees and its cooling effect in a high latitude city. Int. J. Biometeorol. 2016, 60, 159–172. [Google Scholar] [CrossRef]
- Velasco, E.; Roth, M.; Norford, L.; Molina, L.T. Does urban vegetation enhance carbon sequestration? Landsc. Urban Plan. 2016, 148, 99–107. [Google Scholar] [CrossRef]
- Pretzsch, H.; Biber, P.; Uhl, E.; Dahlhausen, J.; Schütze, G.; Perkins, D.; Rötzer, T.; Caldentey, J.; Koike, T.; van Con, T. Climate change accelerates growth of urban trees in metropolises worldwide. Sci. Rep. 2017, 7, 15403. [Google Scholar] [CrossRef] [PubMed]
- Zhao, M.; Running, S.W. Drought-induced reduction in global terrestrial net primary production from 2000 through 2009. Science 2010, 329, 940–943. [Google Scholar] [CrossRef] [PubMed]
- Williams, A.P.; Allen, C.D.; Macalady, A.K.; Griffin, D.; Woodhouse, C.A.; Meko, D.M.; Swetnam, T.W.; Rauscher, S.A.; Seager, R.; Grissino-Mayer, H.D. Temperature as a potent driver of regional forest drought stress and tree mortality. Nat. Clim. Chang. 2013, 3, 292. [Google Scholar] [CrossRef]
- Del Río, M.; Schütze, G.; Pretzsch, H. Temporal variation of competition and facilitation in mixed species forests in C entral E urope. Plant Biol. 2014, 16, 166–176. [Google Scholar] [CrossRef] [PubMed]
- Rötzer, T.; Seifert, T.; Gayler, S.; Priesack, E.; Pretzsch, H. Effects of stress and defence allocation on tree growth: Simulation results at the individual and stand level. In Growth and Defence in Plants; Springer: Berlin/Heidelberg, Germany, 2012; pp. 401–432. [Google Scholar]
- Moser, A.; Rötzer, T.; Pauleit, S.; Pretzsch, H. The urban environment can modify drought stress of small-leaved lime (Tilia cordata Mill.) and black locust (Robinia pseudoacacia L.). Forests 2016, 7, 71. [Google Scholar] [CrossRef]
- Stratópoulos, L.M.F.; Duthweiler, S.; Häberle, K.-H.; Pauleit, S. Effect of native habitat on the cooling ability of six nursery-grown tree species and cultivars for future roadside plantings. Urban For. Urban Green. 2018, 30, 37–45. [Google Scholar] [CrossRef]
- Johnson, A.D.; Gerhold, H.D. Carbon storage by urban tree cultivars, in roots and above-ground. Urban For. Urban Green. 2003, 2, 65–72. [Google Scholar] [CrossRef]
- Barbaroux, C.; Bréda, N.; Dufrêne, E. Distribution of above-ground and below-ground carbohydrate reserves in adult trees of two contrasting broad-leaved species (Quercus petraea and Fagus sylvatica). New Phytol. 2003, 157, 605–615. [Google Scholar] [CrossRef]
- West, J.B.; Hobbie, S.E.; Reich, P.B. Effects of plant species diversity, atmospheric [CO2], and N addition on gross rates of inorganic N release from soil organic matter. Glob. Chang. Biol. 2006, 12, 1400–1408. [Google Scholar] [CrossRef]
- Bardgett, R.D.; Wardle, D.A. Aboveground-Belowground Linkages: Biotic Interactions, Ecosystem Processes, and Global Change; Oxford University Press: Oxford, UK, 2010. [Google Scholar]
- Eisenhauer, N.; Cesarz, S.; Koller, R.; Worm, K.; Reich, P.B. Global change belowground: impacts of elevated CO2, nitrogen, and summer drought on soil food webs and biodiversity. Glob. Chang. Biol. 2012, 18, 435–447. [Google Scholar] [CrossRef]
- Li, Z.; Kurz, W.A.; Apps, M.J.; Beukema, S.J. Belowground biomass dynamics in the Carbon Budget Model of the Canadian Forest Sector: recent improvements and implications for the estimation of NPP and NEP. Can. J. For. Res. 2003, 33, 126–136. [Google Scholar] [CrossRef]
- Rowell, D.P.; Jones, R.G. Causes and uncertainty of future summer drying over Europe. Clim. Dyn. 2006, 27, 281–299. [Google Scholar] [CrossRef]
- Meier, I.C.; Leuschner, C. Belowground drought response of European beech: fine root biomass and carbon partitioning in 14 mature stands across a precipitation gradient. Glob. Chang. Biol. 2008, 14, 2081–2095. [Google Scholar] [CrossRef]
- Oliveira, S.; Andrade, H.; Vaz, T. The cooling effect of green spaces as a contribution to the mitigation of urban heat: A case study in Lisbon. Build. Environ. 2011, 46, 2186–2194. [Google Scholar] [CrossRef]
- Rahman, M.A.; Moser, A.; Rötzer, T.; Pauleit, S. Microclimatic differences and their influence on transpirational cooling of Tilia cordata in two contrasting street canyons in Munich, Germany. Agric. For. Meteorol. 2017, 232, 443–456. [Google Scholar] [CrossRef]
- Gill, S.; Rahman, M.; Handley, J.; Ennos, A. Modelling water stress to urban amenity grass in Manchester UK under climate change and its potential impacts in reducing urban cooling. Urban For. Urban Green. 2013, 12, 350–358. [Google Scholar] [CrossRef]
- Gillner, S.; Vogt, J.; Tharang, A.; Dettmann, S.; Roloff, A. Role of street trees in mitigating effects of heat and drought at highly sealed urban sites. Landsc. Urban Plan. 2015, 143, 33–42. [Google Scholar] [CrossRef]
- Poudel, K.; Temesgen, H. Methods for estimating aboveground biomass and its components for Douglas-fir and lodgepole pine trees. Can. J. For. Res. 2015, 46, 77–87. [Google Scholar] [CrossRef]
- Rötzer, T.; Grote, R.; Pretzsch, H. The timing of bud burst and its effect on tree growth. Int. J. Biometeorol. 2004, 48, 109–118. [Google Scholar] [CrossRef]
- Rötzer, T.; Rahman, M.; Moser-Reischl, A.; Pauleit, S.; Pretzsch, H. Process based simulation of tree growth and ecosystem services of urban trees under present and future climate conditions. Sci. Total Environ. 2019, 676, 651–664. [Google Scholar] [CrossRef]
- Pretzsch, H.; Dieler, J.; Seifert, T.; Rötzer, T. Climate effects on productivity and resource-use efficiency of Norway spruce (Picea abies [L.] Karst.) and European beech (Fagus sylvatica [L.]) in stands with different spatial mixing patterns. Trees 2012, 26, 1343–1360. [Google Scholar] [CrossRef]
- Team, R.C. R: A Language and Environment for Statistical Computing; R Foundation for Statistical Computing: Vienna, Austria, 2013. [Google Scholar]
- Poorter, H.; Niklas, K.J.; Reich, P.B.; Oleksyn, J.; Poot, P.; Mommer, L. Biomass allocation to leaves, stems and roots: Meta-analyses of interspecific variation and environmental control. New Phytol. 2012, 193, 30–50. [Google Scholar] [CrossRef] [PubMed]
- Chaves, M.M.; Pereira, J.S.; Maroco, J.; Rodrigues, M.L.; Ricardo, C.P.P.; Osório, M.L.; Carvalho, I.; Faria, T.; Pinheiro, C. How plants cope with water stress in the field? Photosynthesis and growth. Ann. Bot. 2002, 89, 907–916. [Google Scholar] [CrossRef] [PubMed]
- Moser, A.; Rahman, M.A.; Pretzsch, H.; Pauleit, S.; Rötzer, T. Inter-and intraannual growth patterns of urban small-leaved lime (Tilia cordata mill.) at two public squares with contrasting microclimatic conditions. Int. J. Biometeorol. 2017, 61, 1095–1107. [Google Scholar] [CrossRef] [PubMed]
- Wilson, J.B. A review of evidence on the control of shoot: root ratio, in relation to models. Ann. Bot. 1988, 61, 433–449. [Google Scholar] [CrossRef]
- Gowda, V.R.; Henry, A.; Yamauchi, A.; Shashidhar, H.; Serraj, R. Root biology and genetic improvement for drought avoidance in rice. Field Crops Res. 2011, 122, 1–13. [Google Scholar] [CrossRef]
- Asch, F.; Dingkuhn, M.; Sow, A.; Audebert, A. Drought-induced changes in rooting patterns and assimilate partitioning between root and shoot in upland rice. Field Crops Res. 2005, 93, 223–236. [Google Scholar] [CrossRef]
- Lemoine, R.; La Camera, S.; Atanassova, R.; Dédaldéchamp, F.; Allario, T.; Pourtau, N.; Bonnemain, J.-L.; Laloi, M.; Coutos-Thévenot, P.; Maurousset, L. Source-to-sink transport of sugar and regulation by environmental factors. Front. Plant Sci. 2013, 4, 272. [Google Scholar] [CrossRef] [Green Version]
- Mokany, K.; Raison, R.J.; Prokushkin, A.S. Critical analysis of root: shoot ratios in terrestrial biomes. Glob. Chang. Biol. 2006, 12, 84–96. [Google Scholar] [CrossRef]
- McDowell, N.; Pockman, W.T.; Allen, C.D.; Breshears, D.D.; Cobb, N.; Kolb, T.; Plaut, J.; Sperry, J.; West, A.; Williams, D.G. Mechanisms of plant survival and mortality during drought: why do some plants survive while others succumb to drought? New Phytol. 2008, 178, 719–739. [Google Scholar] [CrossRef]
- Jackson, R.B.; Mooney, H.; Schulze, E.-D. A global budget for fine root biomass, surface area, and nutrient contents. Proc. Natl. Acad. Sci. USA 1997, 94, 7362–7366. [Google Scholar] [CrossRef] [PubMed] [Green Version]
- Reubens, B.; Poesen, J.; Danjon, F.; Geudens, G.; Muys, B. The role of fine and coarse roots in shallow slope stability and soil erosion control with a focus on root system architecture: A review. Trees 2007, 21, 385–402. [Google Scholar] [CrossRef]
- Joslin, J.; Gaudinski, J.B.; Torn, M.S.; Riley, W.; Hanson, P.J. Fine-root turnover patterns and their relationship to root diameter and soil depth in a 14C-labeled hardwood forest. New Phytol. 2006, 172, 523–535. [Google Scholar] [CrossRef] [PubMed]
- Germon, A.; Cardinael, R.; Prieto, I.; Mao, Z.; Kim, J.; Stokes, A.; Dupraz, C.; Laclau, J.-P.; Jourdan, C. Unexpected phenology and lifespan of shallow and deep fine roots of walnut trees grown in a silvoarable Mediterranean agroforestry system. Plant Soil 2016, 401, 409–426. [Google Scholar] [CrossRef]
- Gewin, V. Food: An underground revolution. Nat. News 2010, 466, 552–553. [Google Scholar] [CrossRef] [PubMed]
- Pierret, A.; Maeght, J.-L.; Clément, C.; Montoroi, J.-P.; Hartmann, C.; Gonkhamdee, S. Understanding deep roots and their functions in ecosystems: an advocacy for more unconventional research. Ann. Bot. 2016, 118, 621–635. [Google Scholar] [CrossRef] [Green Version]
- Goisser, M.; Geppert, U.; Rötzer, T.; Paya, A.; Huber, A.; Kerner, R.; Bauerle, T.; Pretzsch, H.; Pritsch, K.; Häberle, K. Does belowground interaction with Fagus sylvatica increase drought susceptibility of photosynthesis and stem growth in Picea abies? For. Ecol. Manag. 2016, 375, 268–278. [Google Scholar] [CrossRef]
- Leuschner, C.; Hertel, D.; Schmid, I.; Koch, O.; Muhs, A.; Hölscher, D. Stand fine root biomass and fine root morphology in old-growth beech forests as a function of precipitation and soil fertility. Plant Soil 2004, 258, 43–56. [Google Scholar] [CrossRef]
- He, Y.; Yang, J.; Zhuang, Q.; McGuire, A.D.; Zhu, Q.; Liu, Y.; Teskey, R.O. Uncertainty in the fate of soil organic carbon: A comparison of three conceptually different decomposition models at a larch plantation. J. Geophys. Res. Biogeosci. 2014, 119, 1892–1905. [Google Scholar] [CrossRef] [Green Version]
- Parmesan, C.; Burrows, M.T.; Duarte, C.M.; Poloczanska, E.S.; Richardson, A.J.; Schoeman, D.S.; Singer, M.C. Beyond climate change attribution in conservation and ecological research. Ecol. Lett. 2013, 16, 58–71. [Google Scholar] [CrossRef]
- Allen, C.D.; Macalady, A.K.; Chenchouni, H.; Bachelet, D.; McDowell, N.; Vennetier, M.; Kitzberger, T.; Rigling, A.; Breshears, D.D.; Hogg, E.T. A global overview of drought and heat-induced tree mortality reveals emerging climate change risks for forests. For. Ecol. Manag. 2010, 259, 660–684. [Google Scholar] [CrossRef] [Green Version]
Figure 1.
Schematic structure of the drought experiment. The rooting zones of trees on the right were covered by rainfall exclusion constructions (‘dry-treatment’), whereas trees on the left were exposed to normal weather conditions (’control’).
Figure 1.
Schematic structure of the drought experiment. The rooting zones of trees on the right were covered by rainfall exclusion constructions (‘dry-treatment’), whereas trees on the left were exposed to normal weather conditions (’control’).
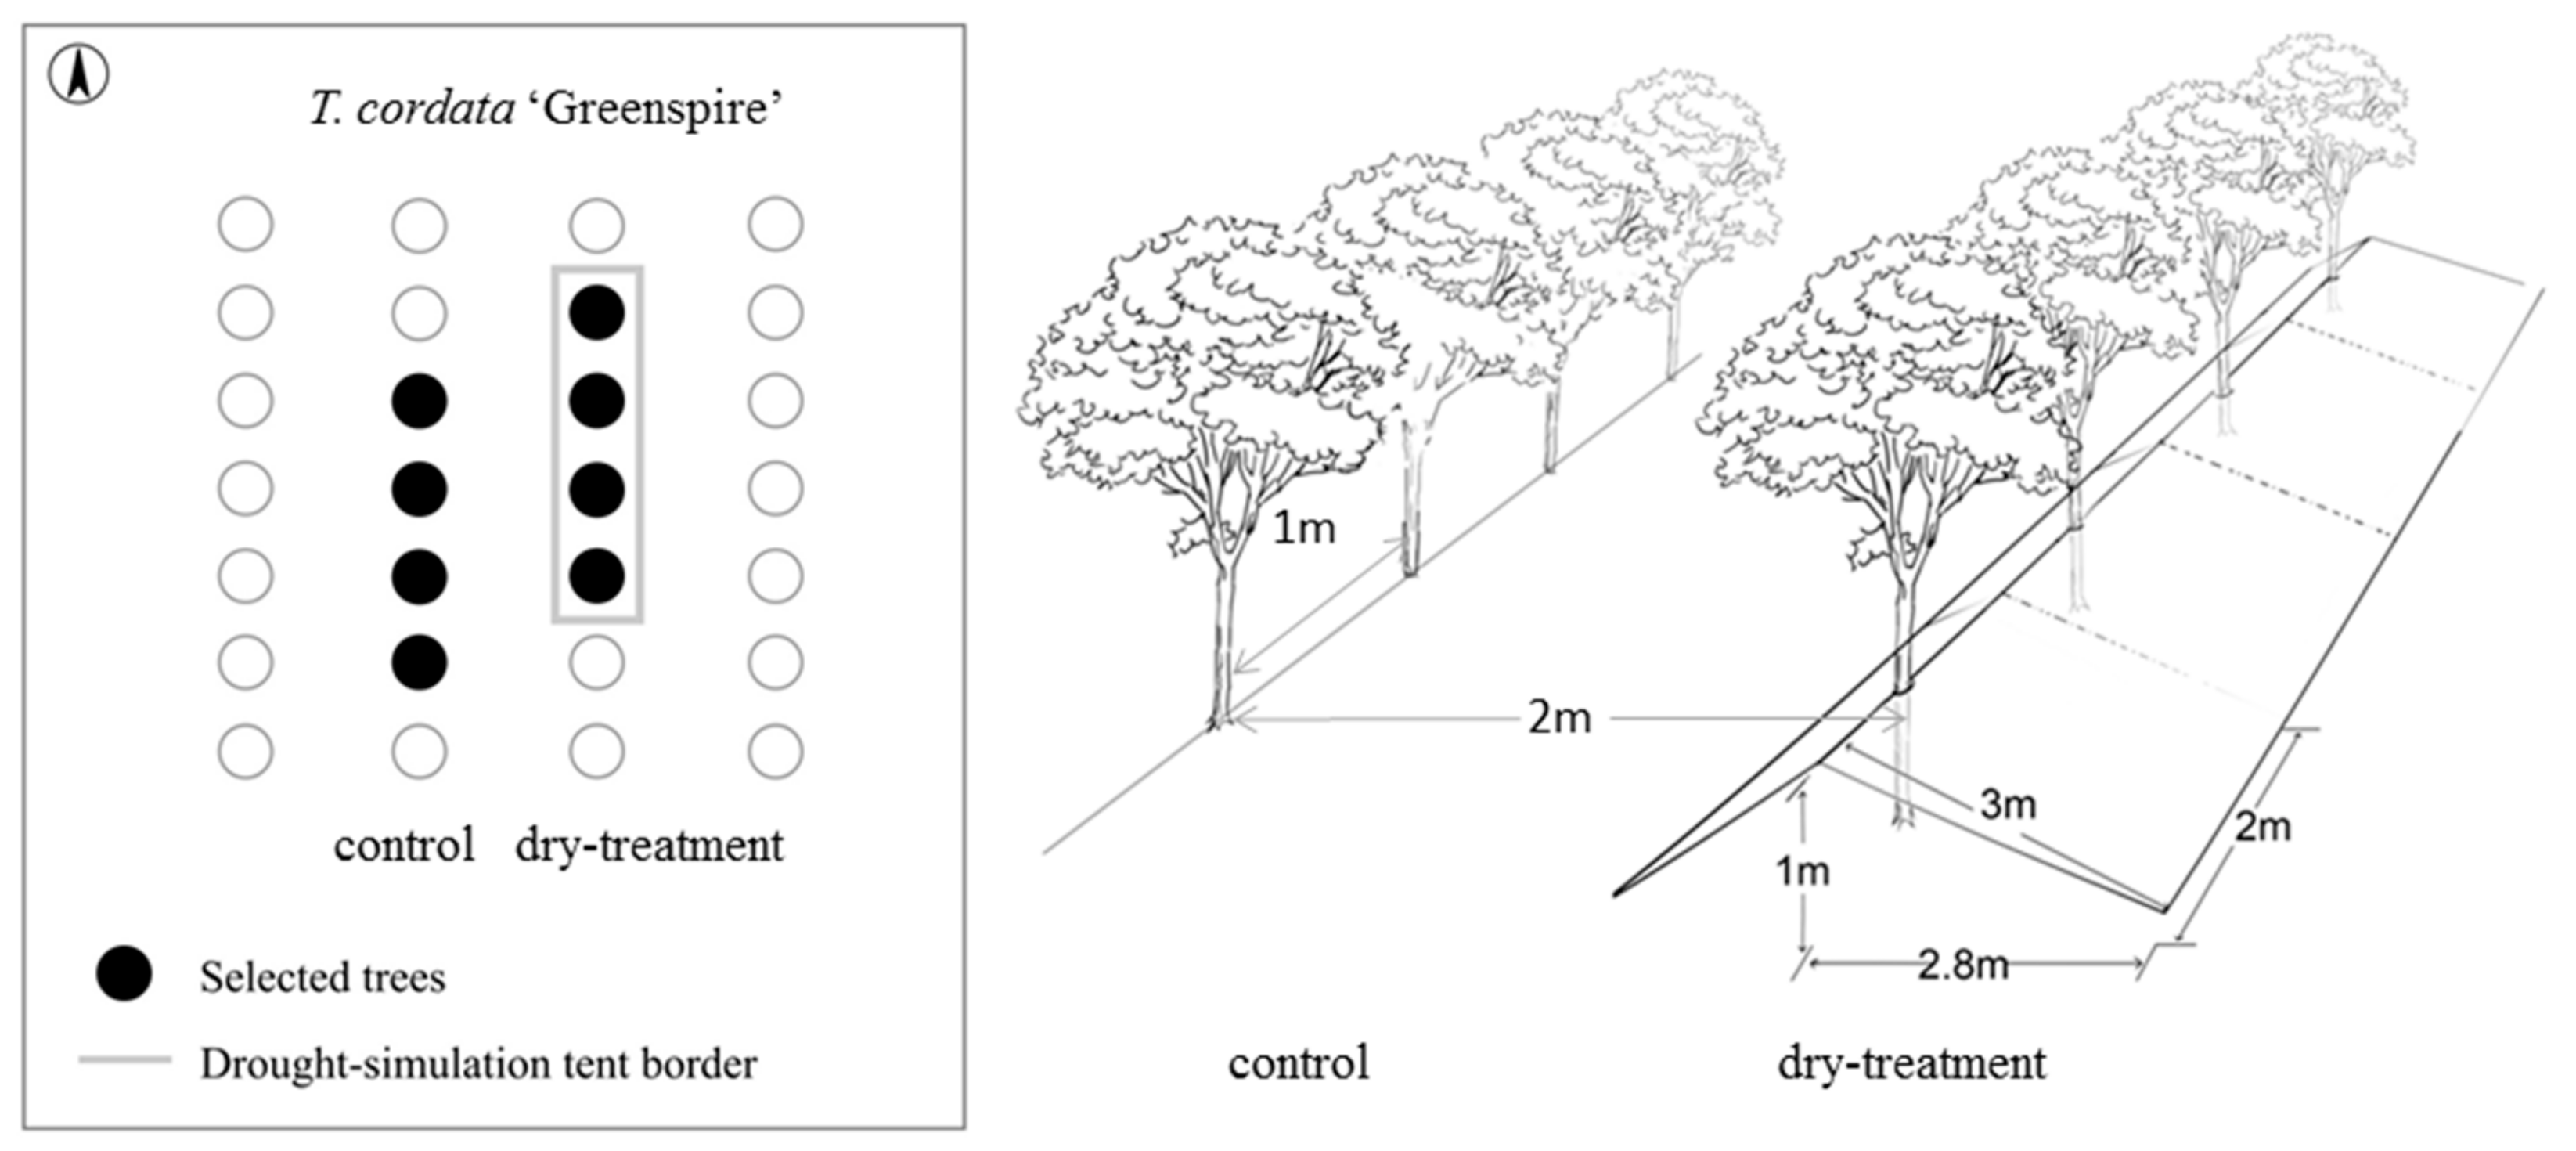
Figure 2.
Monthly totals of precipitation (mm; bar graph) and monthly average temperature (°C; dotted line) for the study site from April to October 2017.
Figure 2.
Monthly totals of precipitation (mm; bar graph) and monthly average temperature (°C; dotted line) for the study site from April to October 2017.

Figure 3.
Stem diameter growth of the control and dry-treatment groups of T. cordata Greenspire measured at a height of 1 m from April to November 2017. The panel represents the mean value, and error bars indicate standard deviation. Due to an unexpected failure of the digital caliper, the data for the treatment group in November was missing.
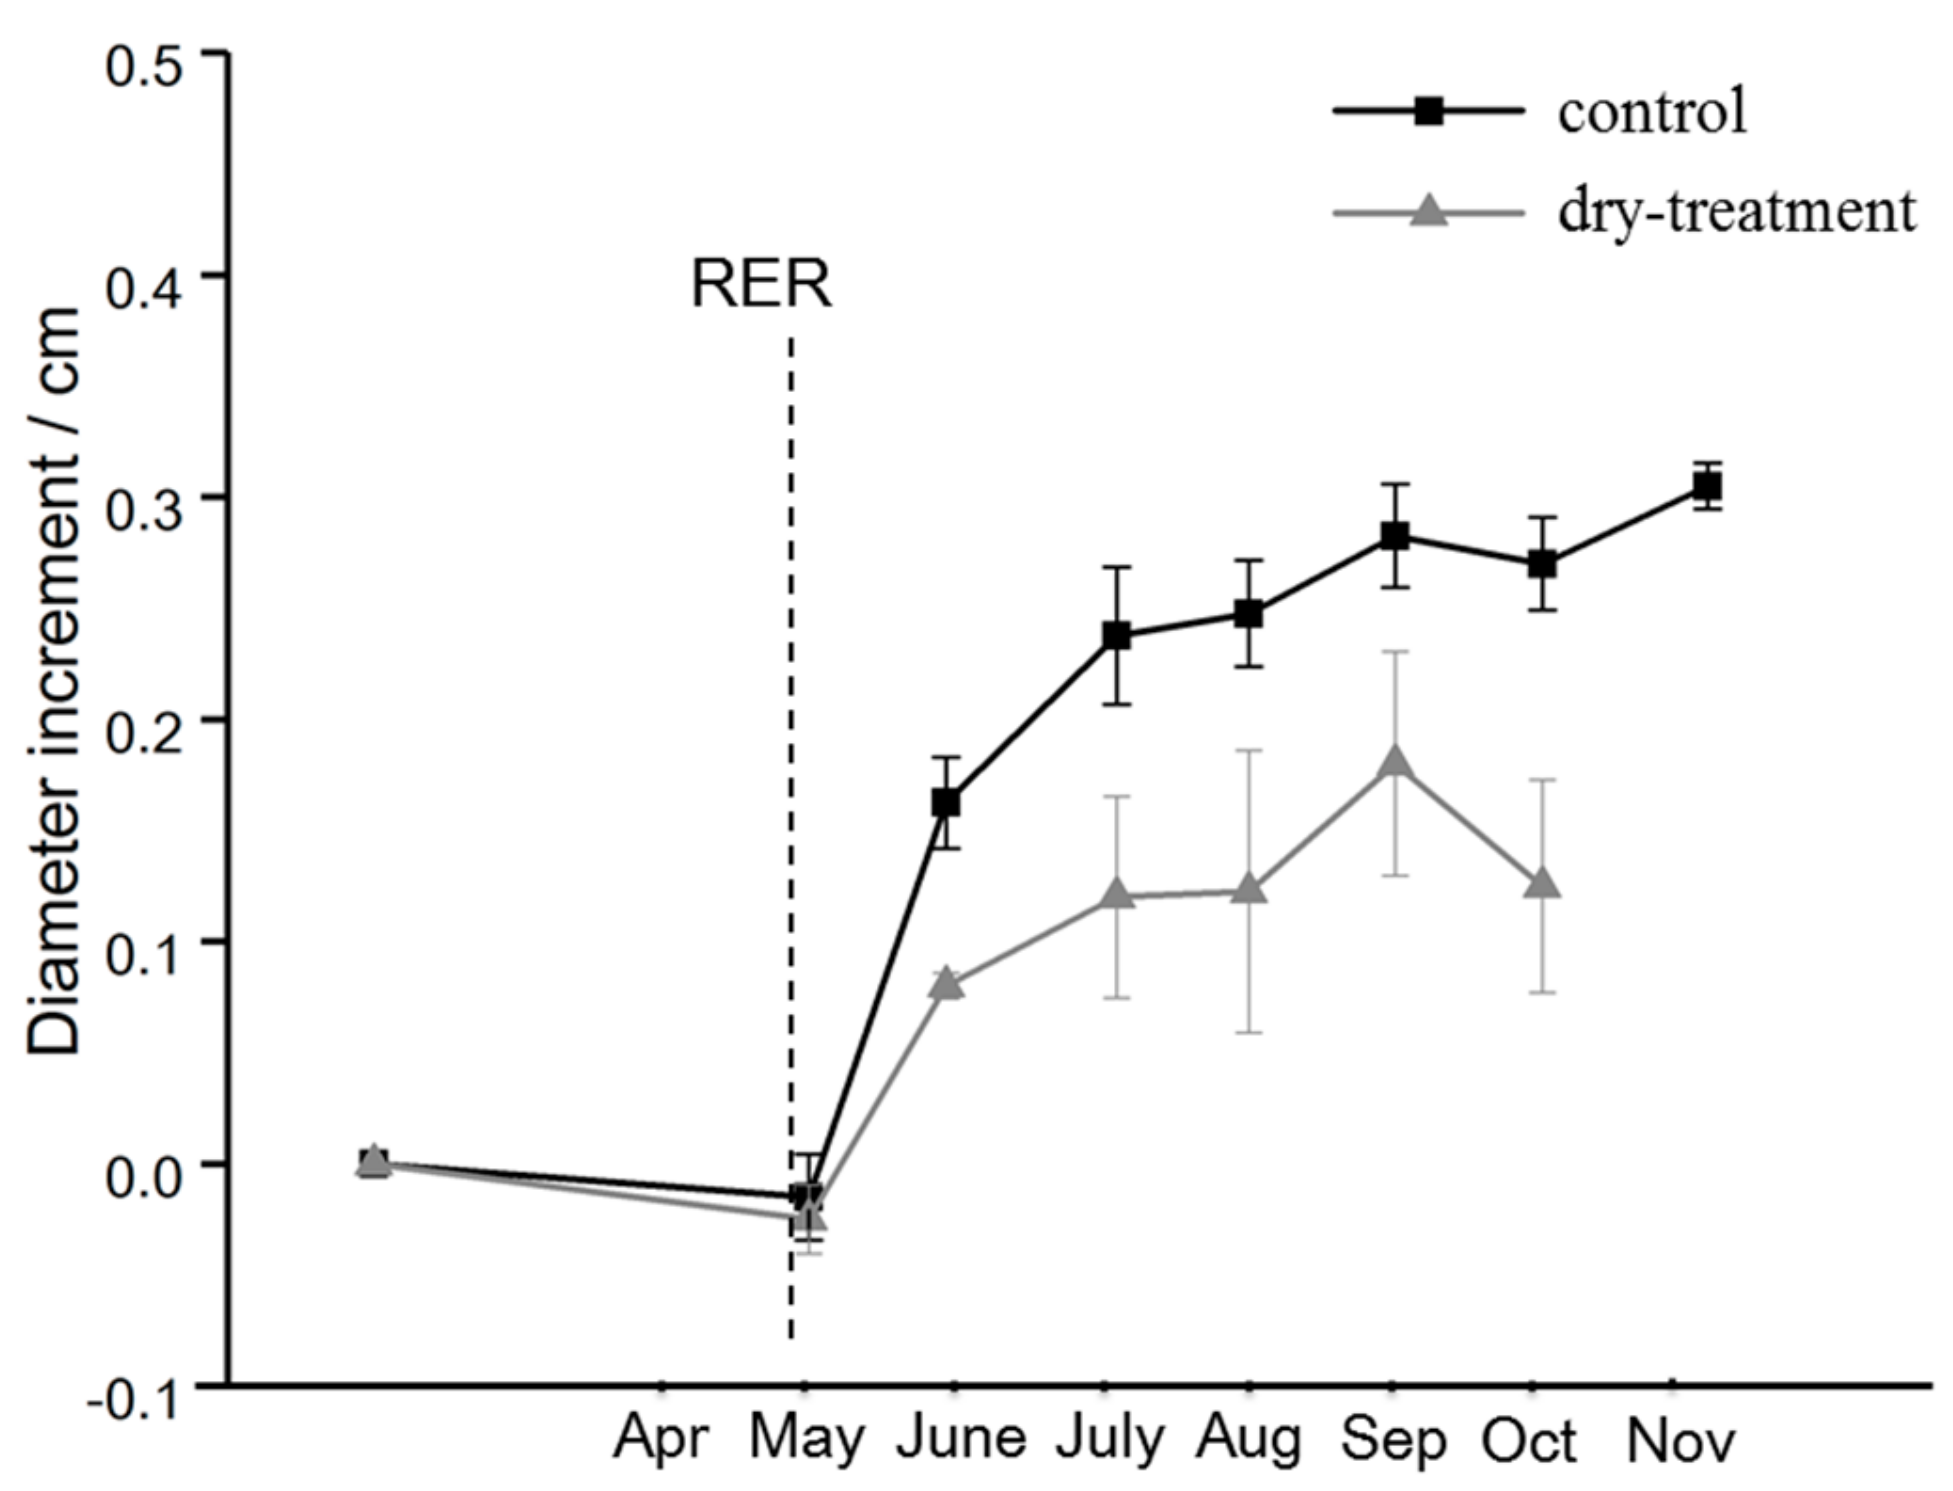
Figure 4.
Development of fine root biomass from both the control and dry-treatment groups in May, September and November. Data are means of four soil cores for each individual tree for three vertical layers: 0–10, 10–20 and 20–30 cm. The letters indicate no significant differences (p > 0.05) between the control and dry-treatment groups for the total fine root biomass.

Figure 5.
Two-dimensional illustration of the root systems in the control and dry-treatment groups. Red circles represent the rooting nodes.
Figure 5.
Two-dimensional illustration of the root systems in the control and dry-treatment groups. Red circles represent the rooting nodes.
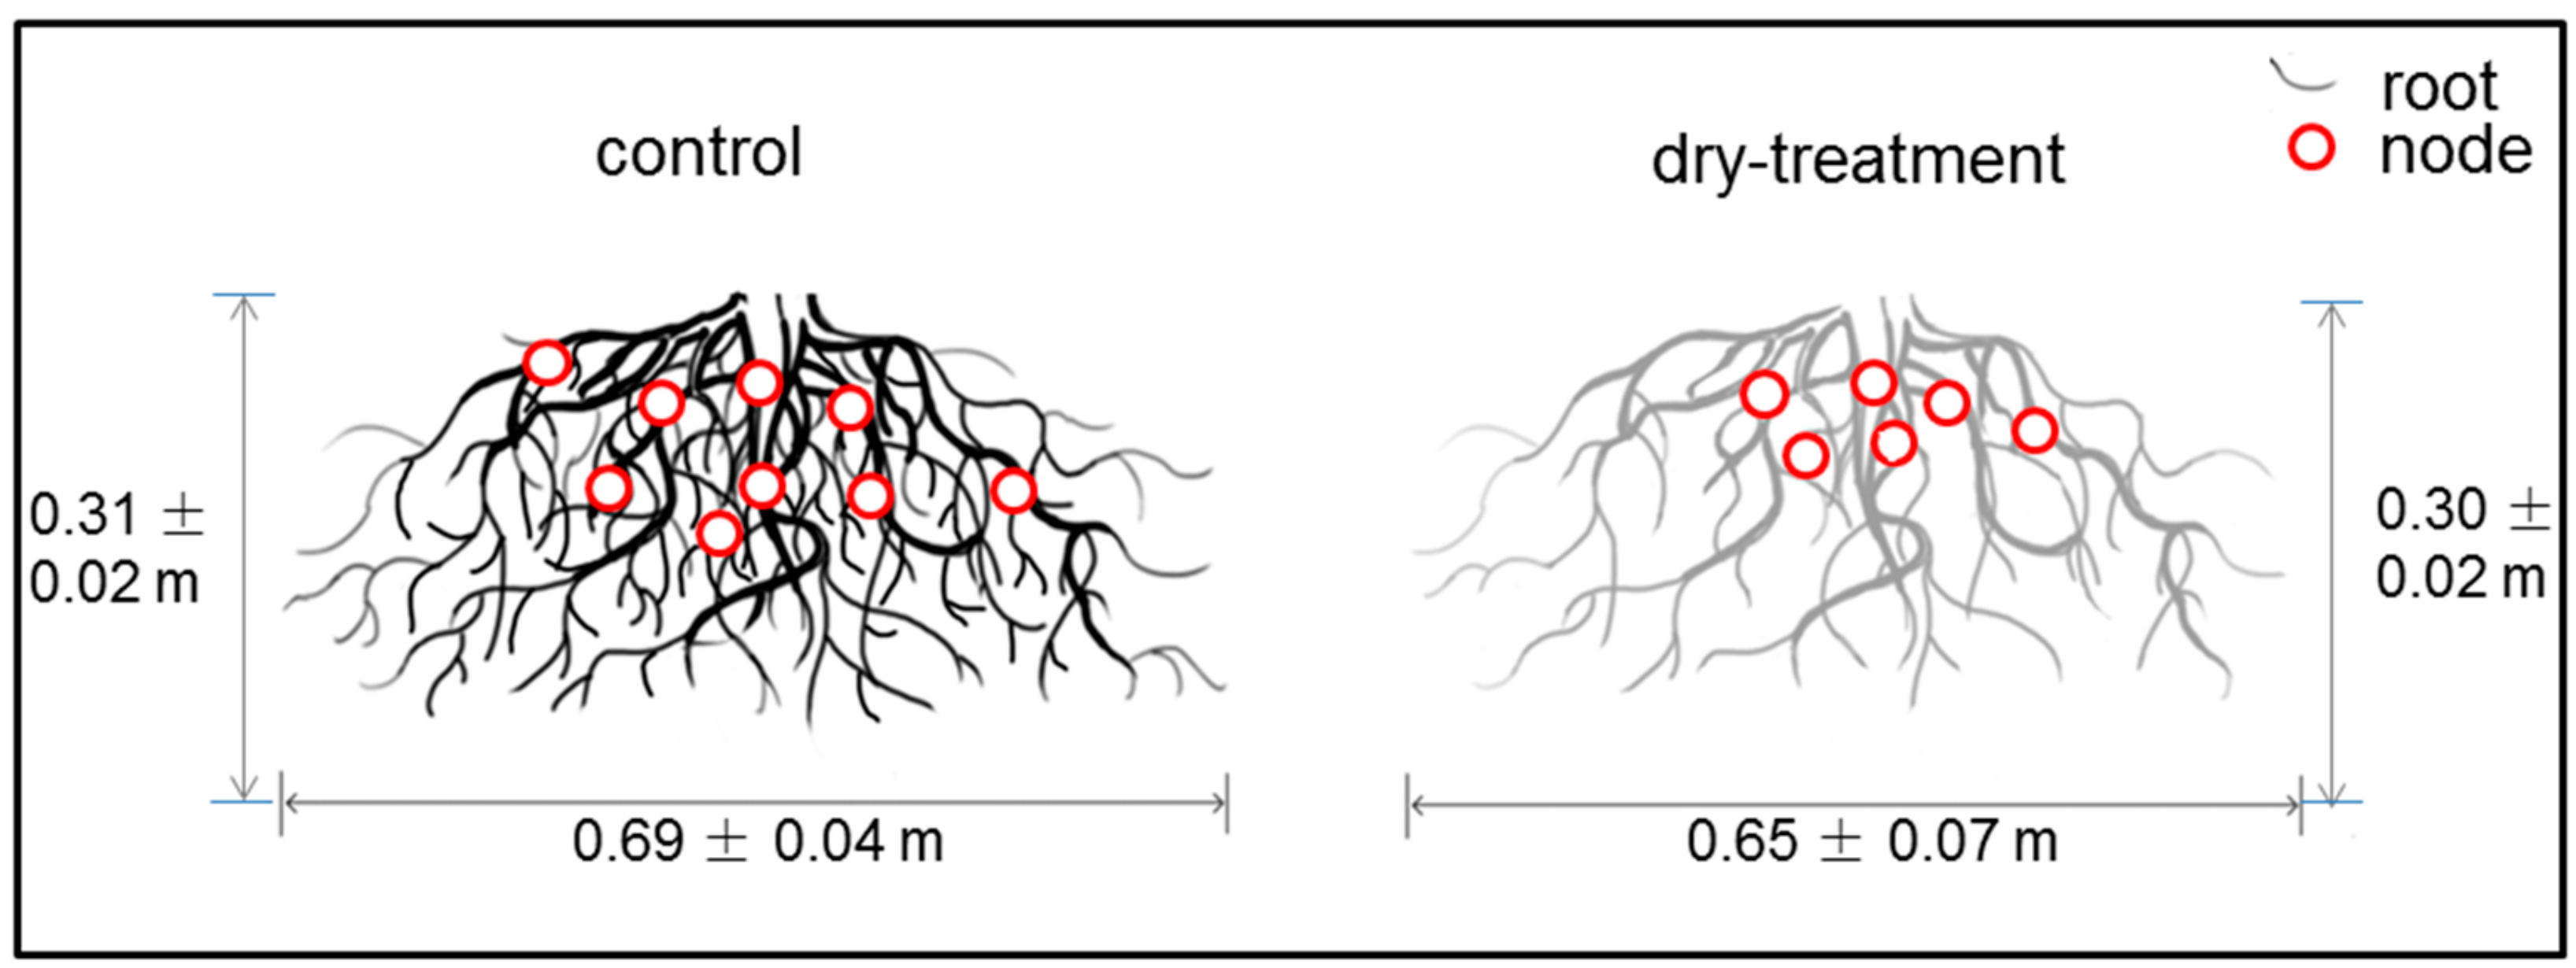
Figure 6.
Three types of root:shoot ratio: fine root:leaf biomass ratio, coarse root:branch biomass ratio and below-ground:above-ground biomass ratio. White circles represent the control group, and black circles represent the dry-treatment group. Red, green and blue lines are the fitting regressions for all trees, the control group and the dry-treatment group, respectively.

Figure 7.
Comparison of measurements and simulations for the above-ground, below-ground and overall biomasses of trees from the control and dry-treatment groups.
Figure 7.
Comparison of measurements and simulations for the above-ground, below-ground and overall biomasses of trees from the control and dry-treatment groups.
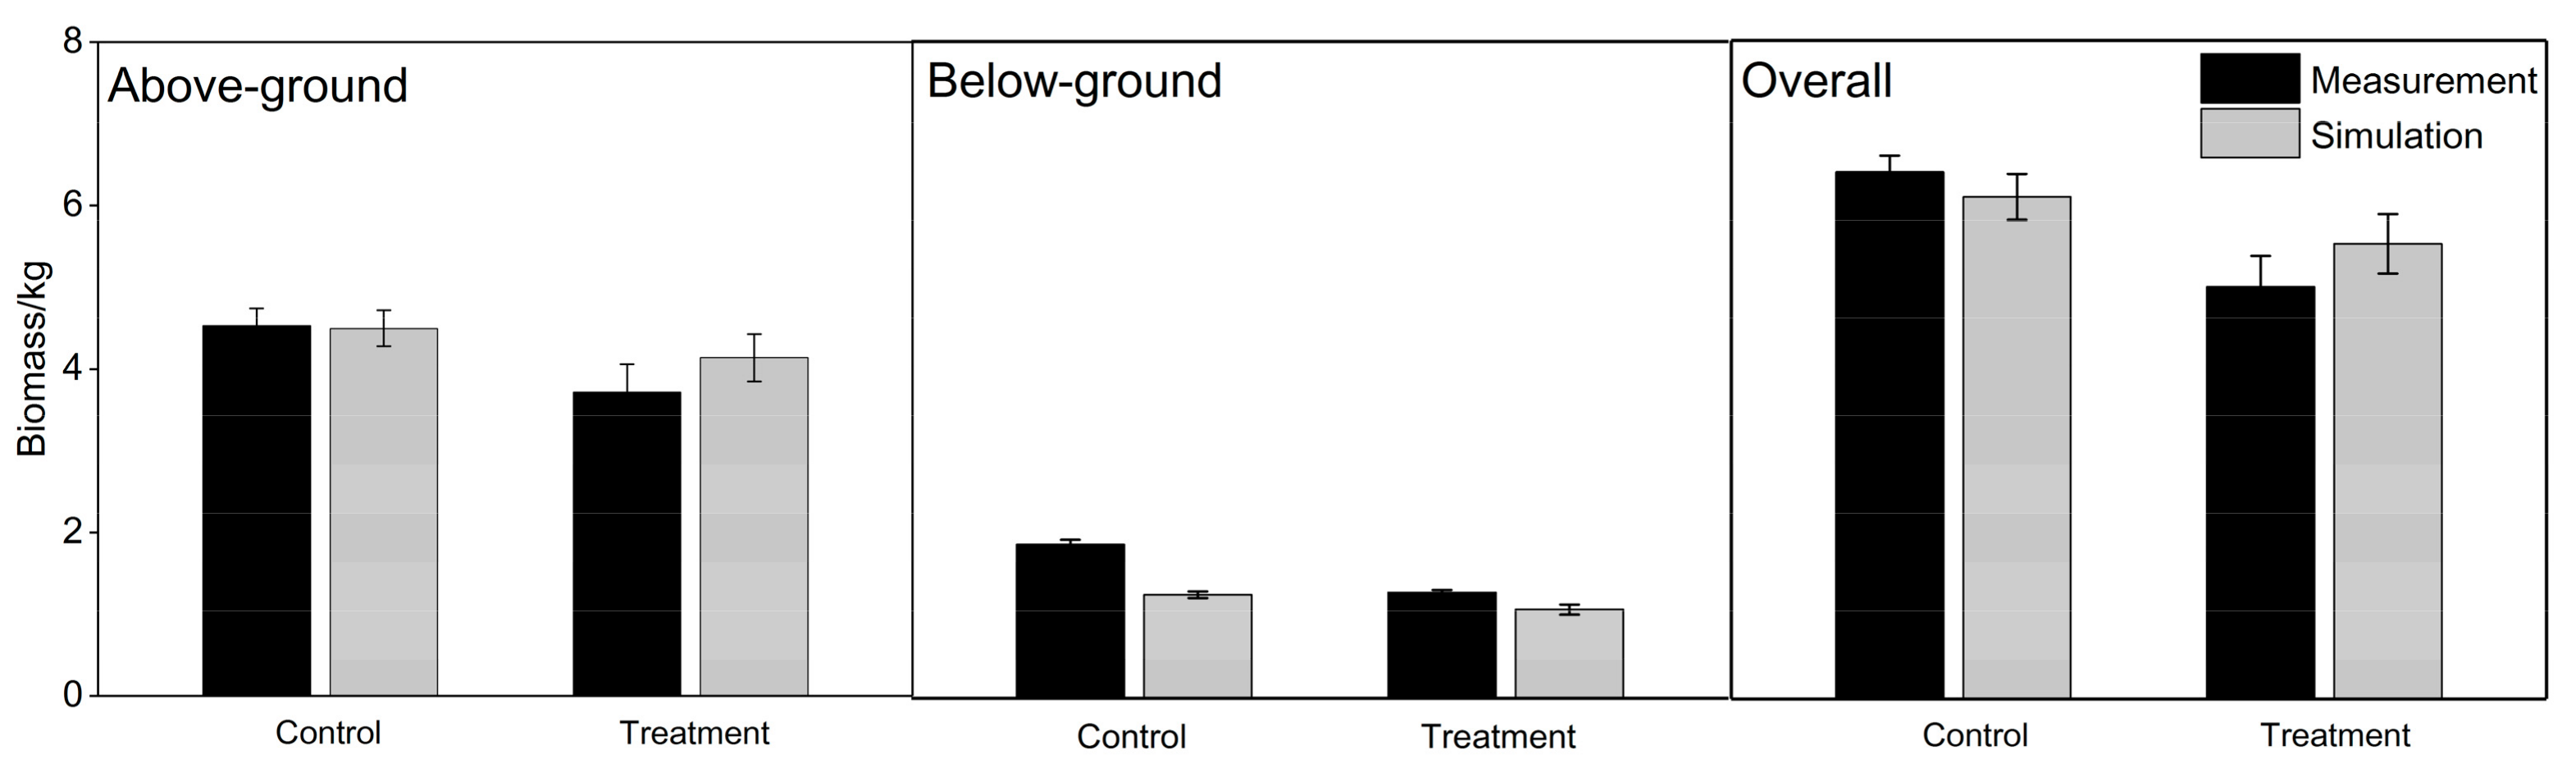
Figure 8.
Simulated above- and below-ground biomasses for trees of the control and treatment groups for the entire year 2017.
Figure 8.
Simulated above- and below-ground biomasses for trees of the control and treatment groups for the entire year 2017.
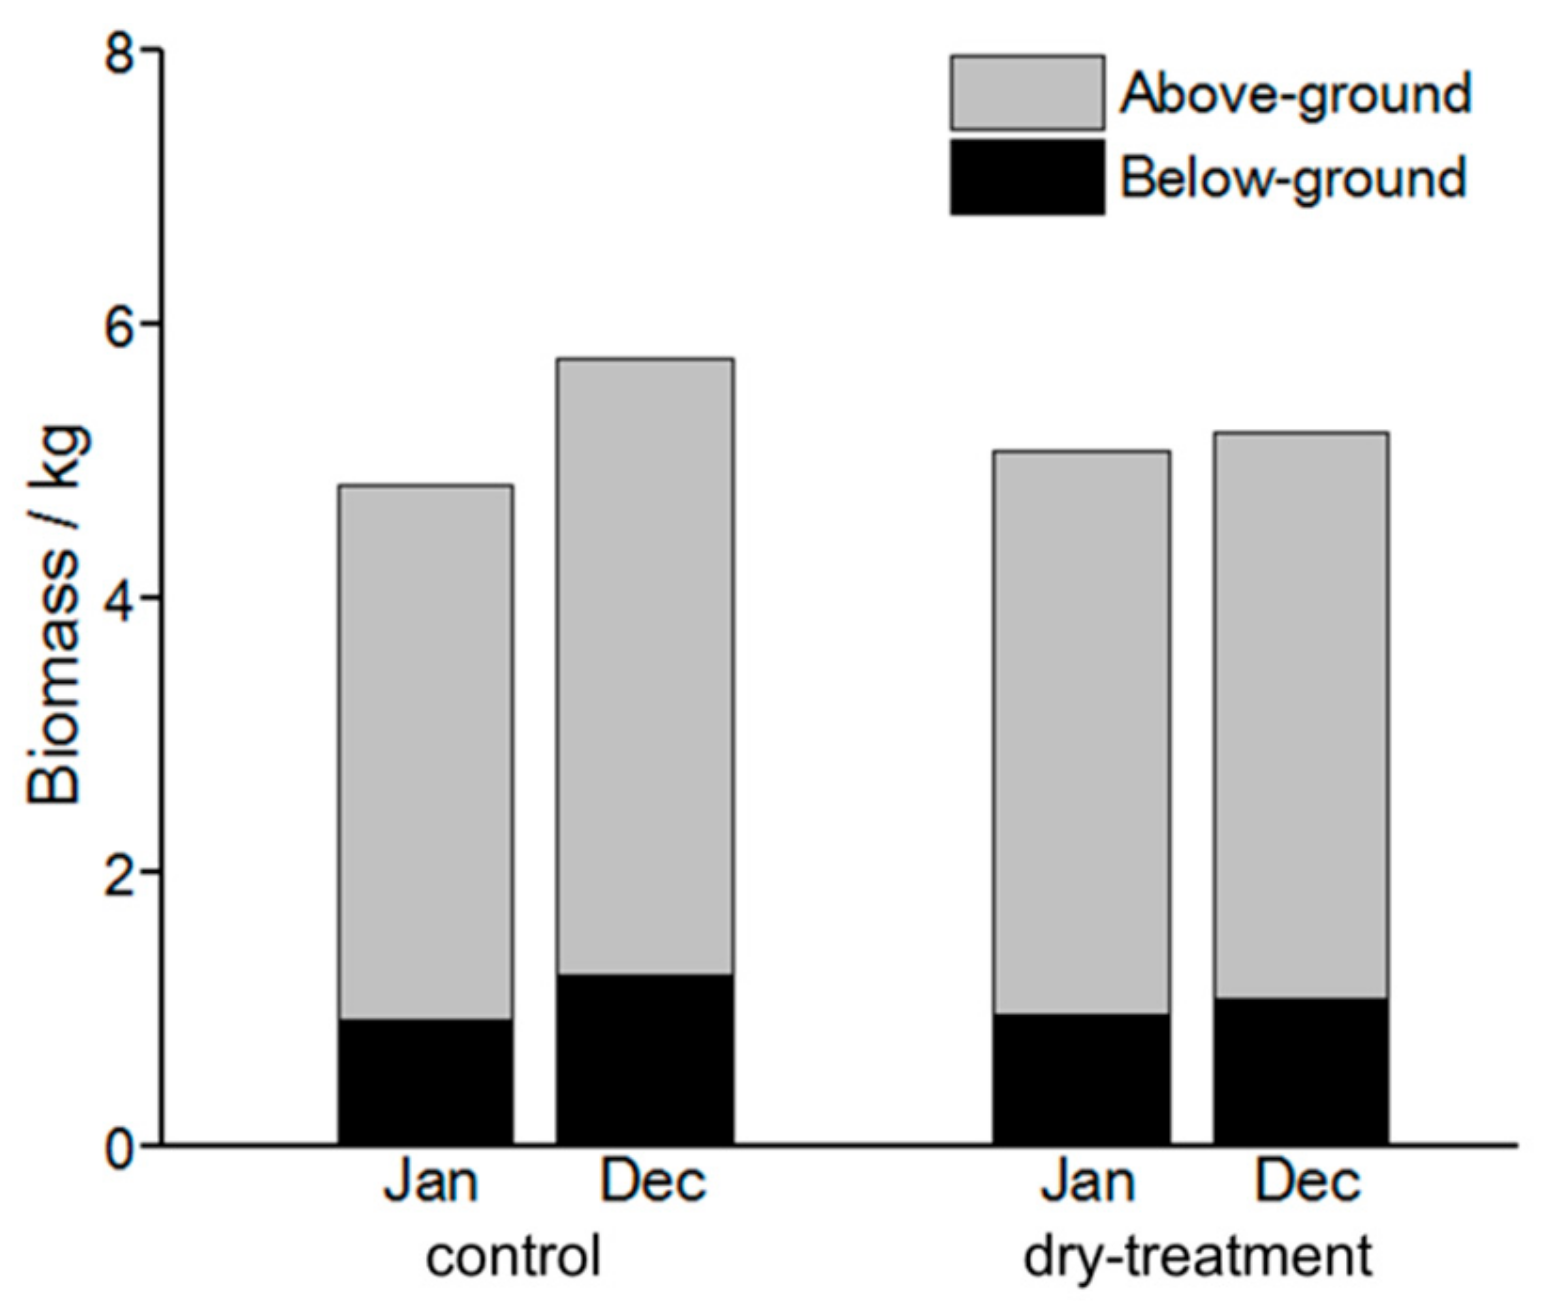
Figure 9.
Ecosystem services, including CO2 fixation, evapotranspiration and cooling potential by transpiration, for trees of the control and treatment groups in the year 2017.
Figure 9.
Ecosystem services, including CO2 fixation, evapotranspiration and cooling potential by transpiration, for trees of the control and treatment groups in the year 2017.

Table 1.
Volumetric soil water content (Vol.%; VWC) at 10 cm soil depth for the control and dry treatment groups of T. cordata Greenspire four times in 2017.
Table 1.
Volumetric soil water content (Vol.%; VWC) at 10 cm soil depth for the control and dry treatment groups of T. cordata Greenspire four times in 2017.
| Group | n | Date | |||
|---|---|---|---|---|---|
| July 12 | July 31 | Aug 16 | Sep 7 | ||
| control | 4 | 16.5 ± 1.3 | 19.6 ± 0.7 | 25.3 ± 4.6 | 21.3 ± 1.7 |
| dry-treatment | 4 | 12.0 ± 1.2 | 12.1 ± 2.0 | 12.8 ± 1.0 | 13.4 ± 1.6 |
Table 2.
Biomasses of branch, stem and coarse roots of both the control and the dry-treatment groups from the harvesting campaign as well as leaf area index (LAI) and projected canopy area (PCA) measured in summer 2017.
Table 2.
Biomasses of branch, stem and coarse roots of both the control and the dry-treatment groups from the harvesting campaign as well as leaf area index (LAI) and projected canopy area (PCA) measured in summer 2017.
| Group | n | Wood Biomass | Leaf | ||||
|---|---|---|---|---|---|---|---|
| Branch (g ± sd) | Stem (g ± sd) | Coarse Root (g ± sd) | LAI (m2 m−2 ± sd) | PCA (m2 ± sd) | SLA 1 (m2 g−1) | ||
| control | 4 | 445.8 ± 31.0 | 4089.3 ± 220.2 | 2440.3 ± 219.5 | 2.53 ± 0.25 | 0.58 ± 0.04 | 0.023 |
| dry-treatment | 4 | 308.5 ± 49.1 | 3407.0 ± 322.4 | 1338. 7 ± 89.4 | 2.13 ±0.24 | 0.58 ± 0.05 | |
In this study, we did not measure the SLA but used the same value of specific leaf area (SLA) from the literature for both the control and treatment group. 1 According to [34], the SLA of T. cordata in urban areas is 23.44 kg m−2.
© 2019 by the authors. Licensee MDPI, Basel, Switzerland. This article is an open access article distributed under the terms and conditions of the Creative Commons Attribution (CC BY) license (http://creativecommons.org/licenses/by/4.0/).
Share and Cite
MDPI and ACS Style
Zhang, C.; Stratopoulos, L.M.F.; Pretzsch, H.; Rötzer, T. How Do Tilia cordata Greenspire Trees Cope with Drought Stress Regarding Their Biomass Allocation and Ecosystem Services? Forests 2019, 10, 676. https://doi.org/10.3390/f10080676
AMA Style
Zhang C, Stratopoulos LMF, Pretzsch H, Rötzer T. How Do Tilia cordata Greenspire Trees Cope with Drought Stress Regarding Their Biomass Allocation and Ecosystem Services? Forests. 2019; 10(8):676. https://doi.org/10.3390/f10080676
Chicago/Turabian StyleZhang, Chi, Laura Myrtiá Faní Stratopoulos, Hans Pretzsch, and Thomas Rötzer. 2019. "How Do Tilia cordata Greenspire Trees Cope with Drought Stress Regarding Their Biomass Allocation and Ecosystem Services?" Forests 10, no. 8: 676. https://doi.org/10.3390/f10080676
Note that from the first issue of 2016, this journal uses article numbers instead of page numbers. See further details here.