Article

Multivariate Discriminant Analysis of Single Seed Near Infrared Spectra for Sorting Dead-Filled and Viable Seeds of Three Pine Species: Does One Model Fit All Species?

1
Forestry College, Fujian Agriculture and Forestry University, Fuzhou 350002, China
2
Southern Swedish Forest Research Center, Faculty of Forest Science, Swedish University of Agricultural Sciences, PO Box 49, SE-230 53 Alnarp, Sweden
3
Department of Biology, Faculty of Basic Sciences and Engineering, Gonbad Kavous University, Shahid Fallahi Street, Basirat Blvd, P.O. Box 163 Golestan, Iran
4
Fujian Engineering Research Center of Chinese Fir Germplasm Enhancement, Fuzhou 350002, China
*
Author to whom correspondence should be addressed.
Forests 2019, 10(6), 469; https://doi.org/10.3390/f10060469
Submission received: 13 May 2019 / Revised: 26 May 2019 / Accepted: 29 May 2019 / Published: 30 May 2019
(This article belongs to the Special Issue The Scientific Basis of the Target Plant Concept)

Abstract

:
Seed lots of pine species are composed of viable, dead-filled and empty seeds, and the success of complete sorting of dead-filled seeds using the conventional method (Incubation, Drying and Separation in water) is difficult to achieve; leaving a considerable scope for upgrading the sorting efficiency. The objective of this study was to evaluate the prospect of sorting viable and dead-filled seeds of pine species using Near Infrared (NIR) spectroscopy. To demonstrate this, dead-filled and viable seeds of Mason’s pine, slash pine and loblolly pine were incubated in moist medium for three days, dried for six hours and scanned by XDS Rapid Content Analyzer from 780–2500 nm. Orthogonal Projection to Latent Structure-Discriminant Analysis was used to develop discriminant models for each species separately and for all species combined. The results showed that the sensitivity (the model’s ability to correctly classify members of a given class) and the specificity (the model’s ability to reject non-members of a given class) were 100% for each species model and 98%–99% for combined species model. The overall classification accuracy was 100% and 99% for individual species and combined species models, respectively. The absorption band in the 1870–1950 nm with a major peak at 1930 nm, which is related to water, was responsible for discrimination as dead-filled seeds dried quicker than viable seeds during the drying process. Our study is the first attempt to simultaneously discriminate dead-filled and viable seeds of pines by NIR spectroscopy. The results demonstrates that a global calibration model of seed lots of several pine species can be equally effective as the individual species model to discriminate viable and dead-filled seeds by NIR spectroscopy, thereby ensuring precision sowing (also known as single seed sowing) in nurseries.

Graphical Abstract

1. Introduction

The increasing demand for wood, fiber and pulp coupled with risks associated with global climate change has put immense importance on the development of forest plantations. The global planted forest area increased from 167.5 million ha to 277.9 million ha during 1990–2015 with the increase varying by region and climate domain [1]. Several species in the genus Pinus L., which are economically important, are dominating the planted forests globally, accounting up to 67% of the planted forests, depending on the region [2]. Commonly, seeds are used to produce planting stocks (containerized seedlings and/or bare-root seedlings) in nurseries for afforestation/reforestation purpose. Hence, there is a growing interest in precision sowing, that is, single seed sowing per planting pots, as containerized seedling production in nurseries has become expensive and to warrant the success of seedling emergence and establishment after direct sowing [3]. Thus, supply of high quality seeds is deemed necessary to produce the target seedlings in nurseries for successful reforestation endeavor. According to the Target Plant Concept, the morphological and physiological qualities of seedlings determines the outplanting success in a given site [4], which in turn, requires an iterative interaction between nursery mangers and clients to establish reforestation objectives and defining target plant materials [5]. The target plants will thus meet the challenges of reforestation through better survival and growth in a plantation site. Therefore, the first step in nursery seedling production is the use of seeds with high viability and vigor to produce high quality seedlings.
Seed lots of many conifers are often composed of viable, empty, dead-filled and insect-attacked seeds in varying proportions. Pollination and fertilization failures often result in the production of empty seeds [6], while post-zygotic degeneration and environmental conditions during seed development and filling results in dead-filled seeds [7]. Such non-viable seeds should be sorted out during seed handling operations to produce the desired number of seedlings in the nursery, provided that other growth conditions are favorable. As a result, different seed sorting techniques have been developed to upgrade the germinability of a given seed lot. Particularly, the Incubation, Drying and Separation (IDS) method is operationally applied on a large-scale in Sweden and elsewhere to remove empty, dead-filled and anatomically underdeveloped seeds from seed lots of conifers [8,9]. The principle behind IDS is that viable and dead-filled or empty seeds can be sorted in water based on differences in specific density, created during incubation and subsequently dried for a certain time period [8]. When seeds are incubated at certain moisture content for some time and then subjected to a uniform drying condition, non-viable seeds lose their moisture more rapidly than live seeds; and hence the non-viable seeds will float while the viable seeds sink in water or other liquids. However, the success of the IDS method varies from species to species and complete separation is difficult to achieve [10]. With the current IDS method, a loss of 10%–15% of good seeds during sorting is not uncommon (Erik Walfridsson, Pers. com). Thus, there is still a need to further improve the sorting efficiency that will result in complete separation of viable and non-viable seeds of tree species.
Near infrared (NIR) spectroscopy has emerged as a rapid and non-destructive technique for single seed sorting [11]. Details about the theory, band assignments and applications of NIR spectroscopy can be found elsewhere [12,13]. In short, when NIR radiation in 780–2500 nm wavelength region interacts with biological samples, it causes stretching and bending vibration of molecular bond, notably C–H, O–H and N–H bonds. The resulting molecular bond variations produce overtones and combination bands, which are uniquely associated with chemical moieties of major organic compounds and water in the sample. These spectral data can be used for qualitative and quantitative analyses of chemical composition of biological samples. For instance, NIR spectroscopy has been successfully applied to discriminate insect-attacked seeds [14,15,16,17,18], empty seeds [16,19,20], and petrified seeds [21] from viable seeds. It has also demonstrated its usefulness to separate filled-viable and dead-filled seeds of Scots pine after incubation and drying for different time periods [22]. The technique, however, needs specific calibration for seed lots of interest prior to its application as a sorting system. As there are several pine species suitable for plantation purposes, it would be more appealing to develop one calibration model that fits all species.
In this study, the potential of NIR spectroscopy has been demonstrated as a rapid and non-destructive method for simultaneously sorting viable and dead-filled seeds of three pine species: Mason’s pine (Pinus massoniana Lamb), slash pine (Pinus elliottii Engelm) and loblolly pine (Pinus tabuliformis Carrieres) after incubating in moist medium for three days followed by uniform drying for six hours. The following question was specifically asked: Does one discriminant model fit to separate viable and dead-filled seeds of three pine species? The classification performance of individual species model and combined species model was compared so that a global calibration model that works for several pine species can be developed. To do this, NIR reflectance spectra (log 1/R) were collected from single seeds and multivariate discriminant models were developed by Orthogonal Projection to Latent Structure-Discriminant Analysis (OPLS-DA). Unlike the classic Partial least squares-discriminant analysis (PLS-DA), the OPLS-DA incorporates Orthogonal Signal Correction (OSC)-filter to remove unwanted spectral variation that has no correlation with the response variable prior to model building [23], thereby resulting in a parsimonious model. Our study is the first attempt to simultaneously discriminate viable and dead-filled seeds of several pine species and provides valuable insight into future development of on-line sorting systems by seed technologists.

2. Materials and Methods

2.1. Sample Preparation

Two seed lots of Mason’s pine, slash pine and loblolly pine, which differed in origin and year of collection (2015 and 2016) were bought from a commercial tree seed company in China, and stored at 5 °C and ca. 6% moisture content in cloth bags for one month until the study was carried out. To create a distinct class of dead-filled and viable seeds of the pine species, two sub-samples of 200 seeds each from each species were taken and one of the sub-samples was killed in a drying oven set at 95 °C for 24 hours. Thereafter, both sub-samples (the killed and non-killed seeds) were placed separately between two moistened germination papers (Munktell filter paper, Ø 125 mm) in an incubation cabinet (Inventum Denmark 11) for 3 days at 5 °C, ca. 95% relative humidity. Such an arrangement permitted free imbibition of water by seeds. After incubation, seeds were evenly distributed on a piece of blotting paper and dried with a fan-ventilation at 20 °C and ca. 40% relative humidity for six hours. The drying hour was selected based on our preliminary drying experiment. Immediately after drying, killed and non-killed seeds were placed in bowls containing Millipore-filtered water separately and stirred to assist the separation process. The floated and sunken fractions were collected separately after five minutes. The floated seeds represented the dead-filled seeds while the sunken seeds represent the viable seeds [8]. In total 900 seeds (n = 150 dead-filled and viable seeds each per species) were used for NIR analysis. The relative water content of dead-filled and viable seeds is given in Table 1. The relative water content was determined as the difference in weight after incubation to the weight after six hours of drying divided by the initial weight and multiplied by 100.

2.2. Measurement of NIR Spectra

Absorbance values (log (1/Reflectance)) of individual seeds were measured using XDS Rapid Content Analyzer (FOSS NIRSystems, Inc., Hilleroed, Denmark) from 780 to 2498 nm at a wavelength resolution of 0.5 nm. Before scanning individual seeds, a reference measurement was recorded on the instrument’s standard built-in reference material. Thereafter, individual seeds were scanned by putting them at the center of the scanning white quartz glass window of the instrument with 9 mm aperture in stationary position and then covered with the instrument’s lid, which had a black background. For each seed, the average of 32 monochromatic scans was recorded. The scanned seeds were further verified for their viability status (viable and dead-filled) by germination and subsequent cutting tests. The germination test was carried out on a germination table at a constant temperature of 20 ± 1 °C day and night with an illumination of ca. 20 μE m−2 s−1 for 30 days. At the end of the germination test, non-germinated seeds were cut individually and examined for their viability. Seeds were considered as viable when they have a firm white embryo and dead-filled when seeds were covered with fungi, collapsed when pinched and had grey, yellow, or brownish embryos [24]. The cutting test enabled us to make sure that sorting with the flotation in water had resulted in 100% separation of dead-filled and viable seeds, thereby the classes were clearly set before developing the calibration models.

2.3. Model Development and Validation

At first, Principal Component Analysis (PCA) was performed on the entire data set to detect outlier and data anomalies. PCA score plot showed that few samples from each species were found outside the 95% confidence limit (data not shown), but they were not serious outliers, and hence kept in the final data set. The data sets were then divided into calibration sets to fit the models and validation sets to evaluate the prediction performance of fitted models. The data set for calibration was composed of 540 seeds from one seed lot (three replicates of 30 seeds × 2 classes × 3 species) and the data set for validation was composed of 360 seeds from another seed lot (three replicates of 20 seeds × 2 classes × 3 species). Orthogonal Projection to Latent Structures-Discriminant Analysis (OPLS-DA) was used to develop discriminant models for each species separately and for all species combined. Basically, the OPLS-DA modelling approach first filters general types of interferences in the spectra by removing components orthogonal to the response calibrated variable [25]. The filtered spectra were then computed by subtracting components orthogonal to the response variable from the original spectral data. The final discriminant models were developed using the filtered absorbance values as a regressor and a Y-matrix of dummy variables as a regress (1.0 for member of a given class, 0.0 otherwise). It should be noted that NIR spectroscopic data are often pre-processed using different spectral pretreatment techniques to remove spectral noises arising from light scattering, base line shift, and path length differences [26], which in turn were induced by differences in individual seed size and moisture content [15,17]. The model was also fitted on truncated spectra, 1870–1950 nm wavelength region, where a major absorption peak was observed. The number of significant components (factors) to be included in the model was selected based on a seven-segment cross validation. A significant component was the one having the ratio of the prediction error sum of squares to the residual sum of squares of the previous dimension statistically smaller than 1.0.
Finally, the fitted models were applied to classify samples in the validation set; and seeds with predicted values greater than the threshold for classification (Ypred ≥ 0.5) were considered viable, and all others were considered dead-filled. To evaluate the classification performances of the fitted models, the following parameters were used: sensitivity (the ability of the model to correctly recognize samples belonging to that class), specificity (the ability of the model to reject samples of all other classes), classification accuracy (the proportion of correctly classified samples), and classification error rate (the proportion of misclassified samples). The following equations were employed to compute the classification parameters:
S n =   T P ( T P   + F N )
S p   =   T N ( F P + T N )
C A =   ( T P + T N ) ( T P + F P + T N + F N )
E R = 1 ( S n + S p ) 2
Sn, Sp, CA and ER stand for sensitivity, specificity, classification accuracy and error rate, respectively. TP (True Positive) is the number of viable seeds of a given species correctly classified as viable seeds. FN (False Negative) is the number of viable seeds of a given species incorrectly classified as dead-filled seeds. TN (True Negative) is the number of dead seeds of a given species correctly classified as dead seeds, and FP (False Positive) is the number of dead seeds of a given species incorrectly classified as viable seeds, and n is the number of classes [27].
To obtain insight into the absorption bands, which were relevant for discriminating viable and dead-filled seeds, a parameter called Variable Influence on Projection (VIP) was computed. The formula used to calculate the VIP for predictive components (PRED_VIPOPLS) was:
P R E D _ V I P O P L S = K p   × ( [ a = 1   A p ( P a   2   ×   S S X c o m p   a ) ] S S X c u m   + [ a = 1 A p ( P a 2   ×   S S Y c o m p   a ) ] S S Y c u m )
Kp denotes the total number of variables in the model; P is the normalized loadings; a is the number of predictive component; Ap is the total number of predictive components; SSXcomp and SSYcomp denote the explained sum of squares of ath component for X and Y data matrices, respectively; and SSXcum and SSYcum represent the cumulative explained sum of squares by all A components in the model for X and Y data matrices, respectively [28]. Predictors with VIP value greater than 1.0 are highly relevant for the discriminant model, but VIP values around 0.7–0.8 were recommended as a cut off to distinguish between relevant and irrelevant predictor variables [29]. All model computations were made on mean-centered data sets using Simca-P + software (Version 14, Umetrics AB, Umeå, Sweden).

3. Results

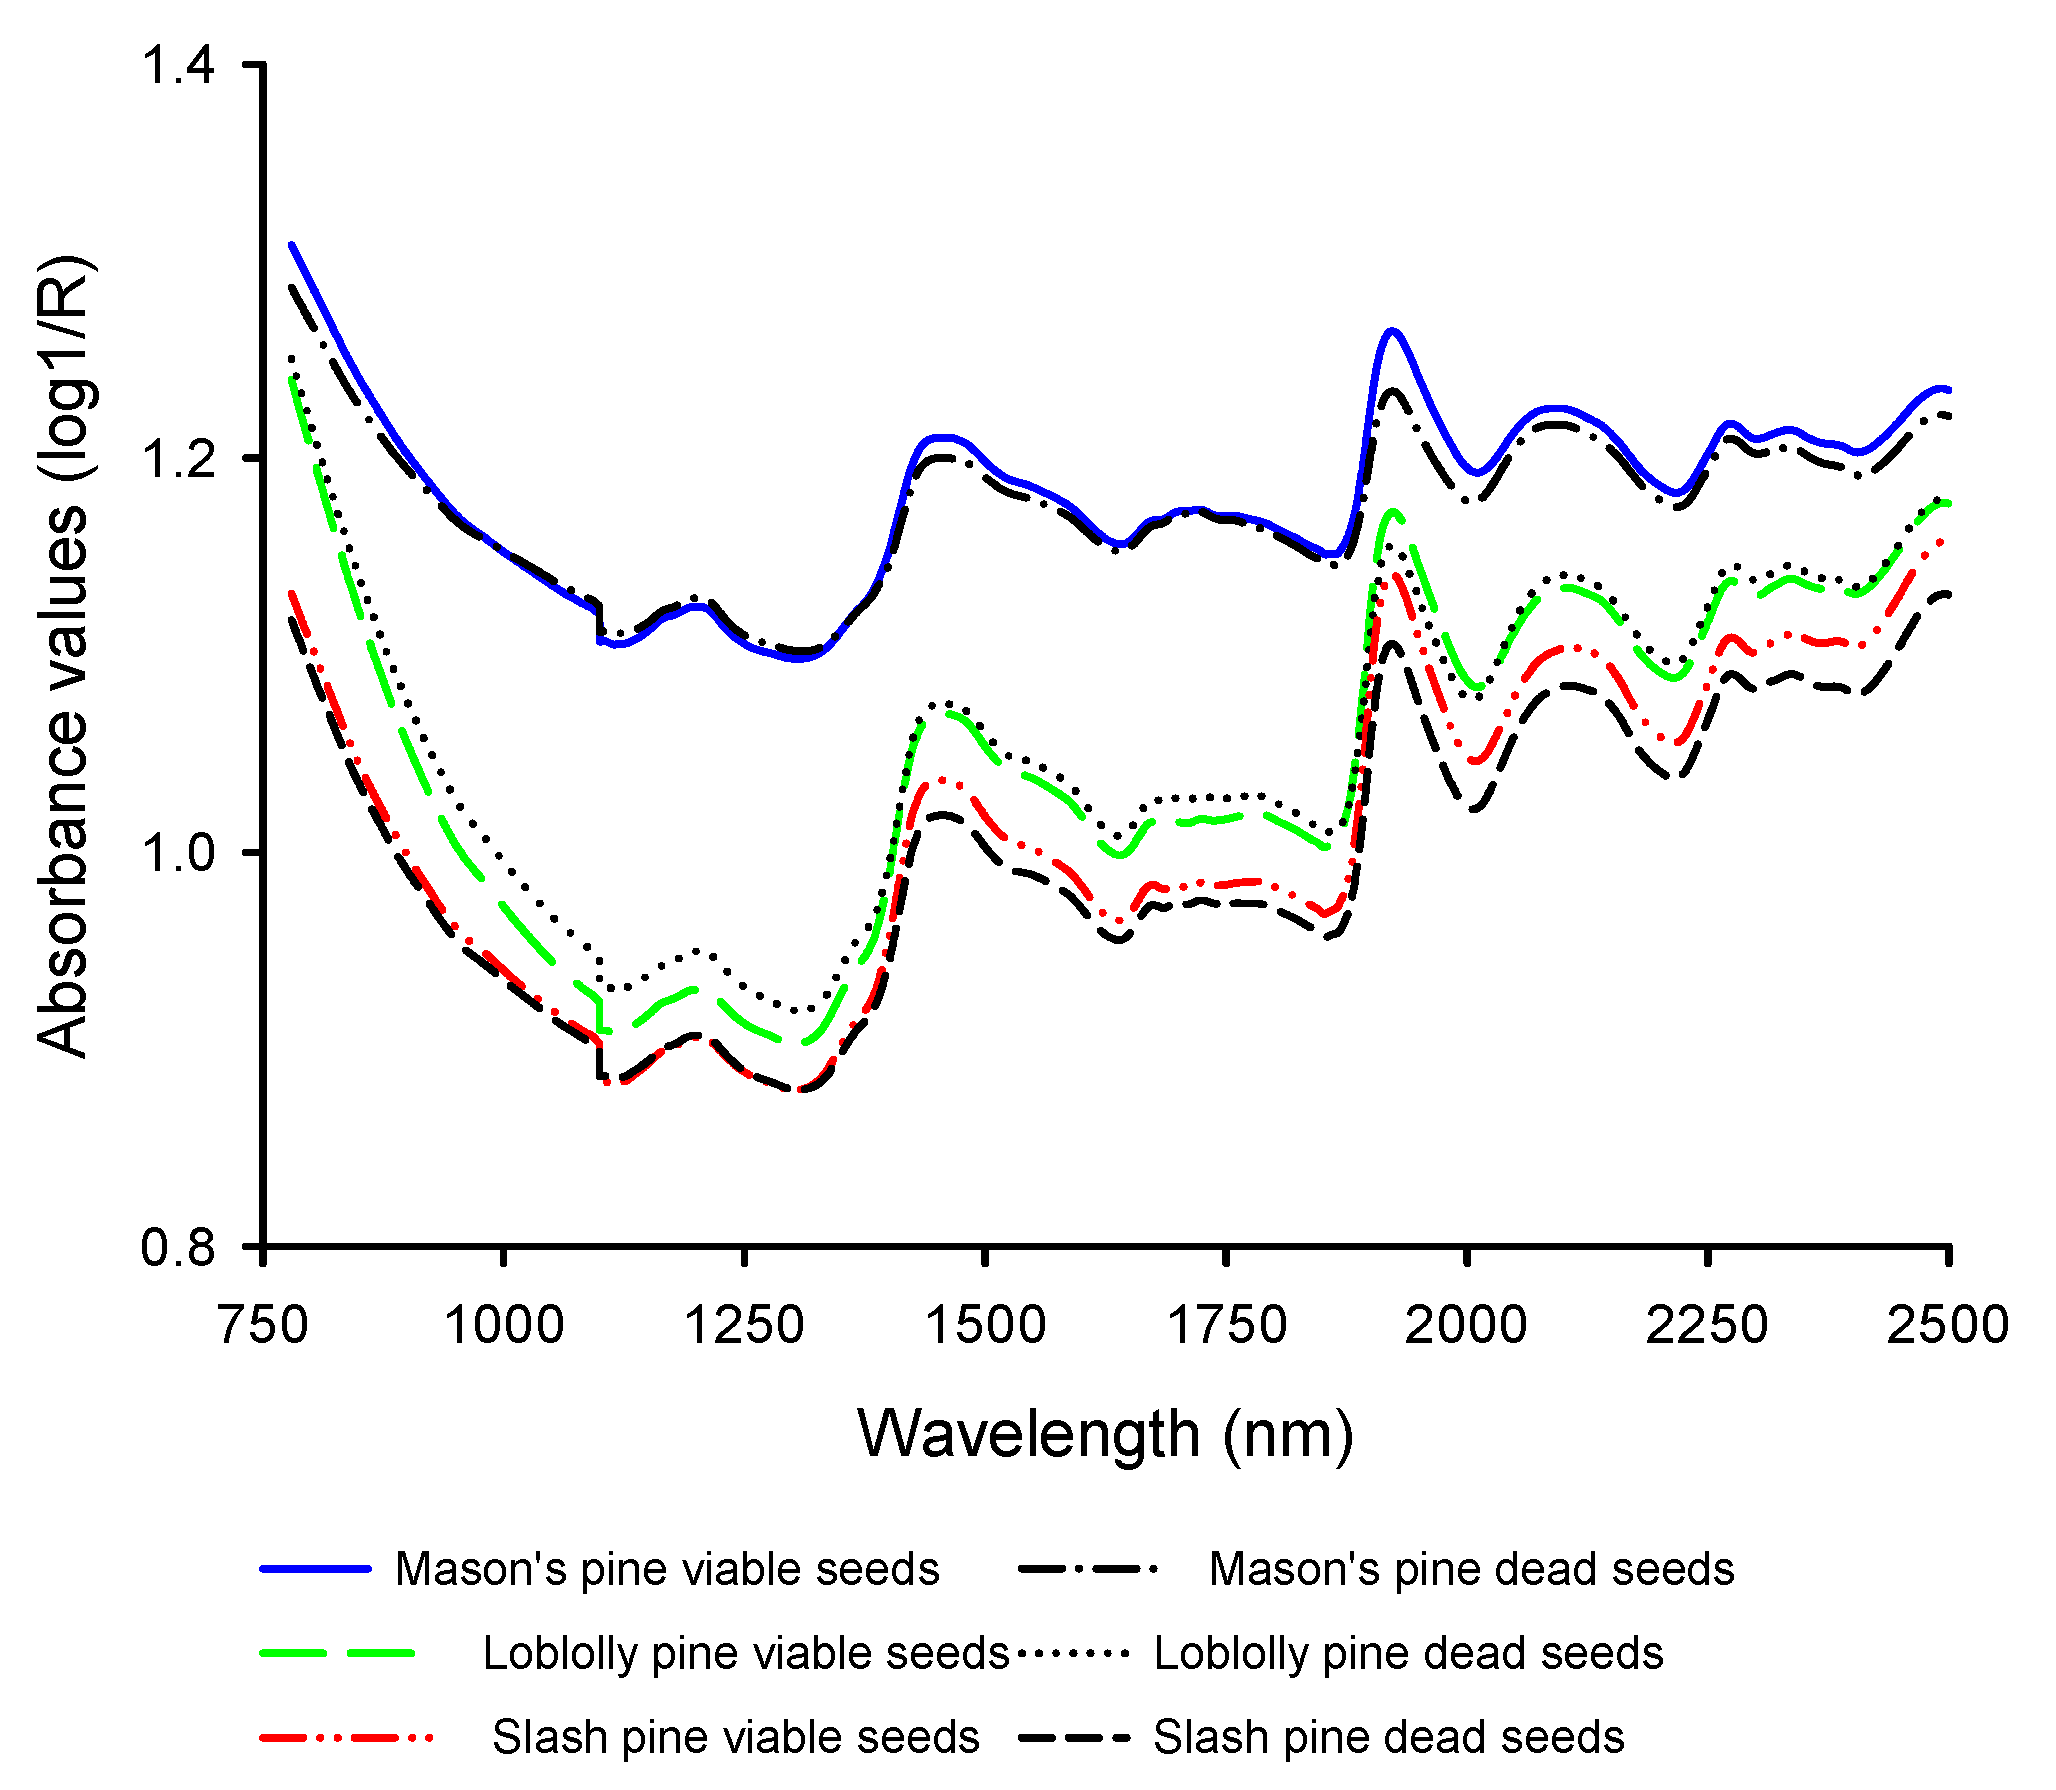
3.1. Mean Absorbance Values and Model Overview

The spectral profile of viable and dead-filled seeds of Mason’s pine, loblolly pine and slash pine were similar with absorption maxima appearing at 1450 nm and 1936 nm (Figure 1). The mean absorbance values were slightly larger for viable than dead-filled seeds of Mason’s pine and slash pine almost across the entire NIR region whereas the absorbance values of viable seeds were larger than dead-filled seeds of loblolly pine in the 1850–1940 nm. Overall, there was ample spectral information that could be used for distinguishing viable from dead-filled seeds of pine species.
The model statistics reveal that the fitted models for discriminating viable and dead-filled seeds of each pine species and all species combined had 1 predictive and 5–12 Y-orthogonal components (Table 2; e.g., A = 1 + 9 for Mason’s pine). The explained predictive spectral variation (R2XP) accounted for 2.6%, 2.4% and 2.1% of the total explained variation for Mason’s pine, loblolly pine and slash pine, respectively, whereas the explained orthogonal spectral variation that had no correlation with the classes (R2Xo) and constituted about 97% of the total spectral variation (Table 2). The explained predictive spectral variation explained 94%, 90% and 91% of the variation between viable and dead-filled seeds classes (R2Y) of Mason’s pine, loblolly pine and slash pine, respectively with 86%–92% predictive ability (Q2cv) based on cross validation. For the combined species model, the predictive spectral variation (R2XP = 0.3%), the explained variation between viable and dead-filled seeds classes (R2Y = 80%) and the predictive power based on cross-validation (Q2cv = 80%) were slightly lower than the individual species models. Similarly, the model fitted on truncated spectra (1870–1950 nm) of all species together and had nearly the same explained class variance and prediction power, but slightly higher explained spectral variance than the model fitted on full NIR spectral region.
The score plots of the fitted models disclosed symmetrical grouping of viable and dead-filled seeds of pine species (Figure 2; X-axis), while the orthogonal scores depicted within species variation (Y-axis) for calibration data sets. The model fitted on data from all species combined and also resulted in nearly symmetrical separation of viable and dead-filled seeds. There were few samples that appeared outside the 95% confidence ellipse according to Hotelling’s T2 test. However, these samples were moderate outliers, thus, they were kept in the final calibration data set. The loading plots for the predictive component show that the absorption band in 1894–1948 nm with absorption maxima appearing at 1930 nm were mainly responsible for separating viable and dead-filled seeds of pine species (Figure 3a). The orthogonal loading plot (Figure 3b) showed several small peaks across the entire NIR region, except that of loblolly pine, that was attributed to systematic spectral noise.

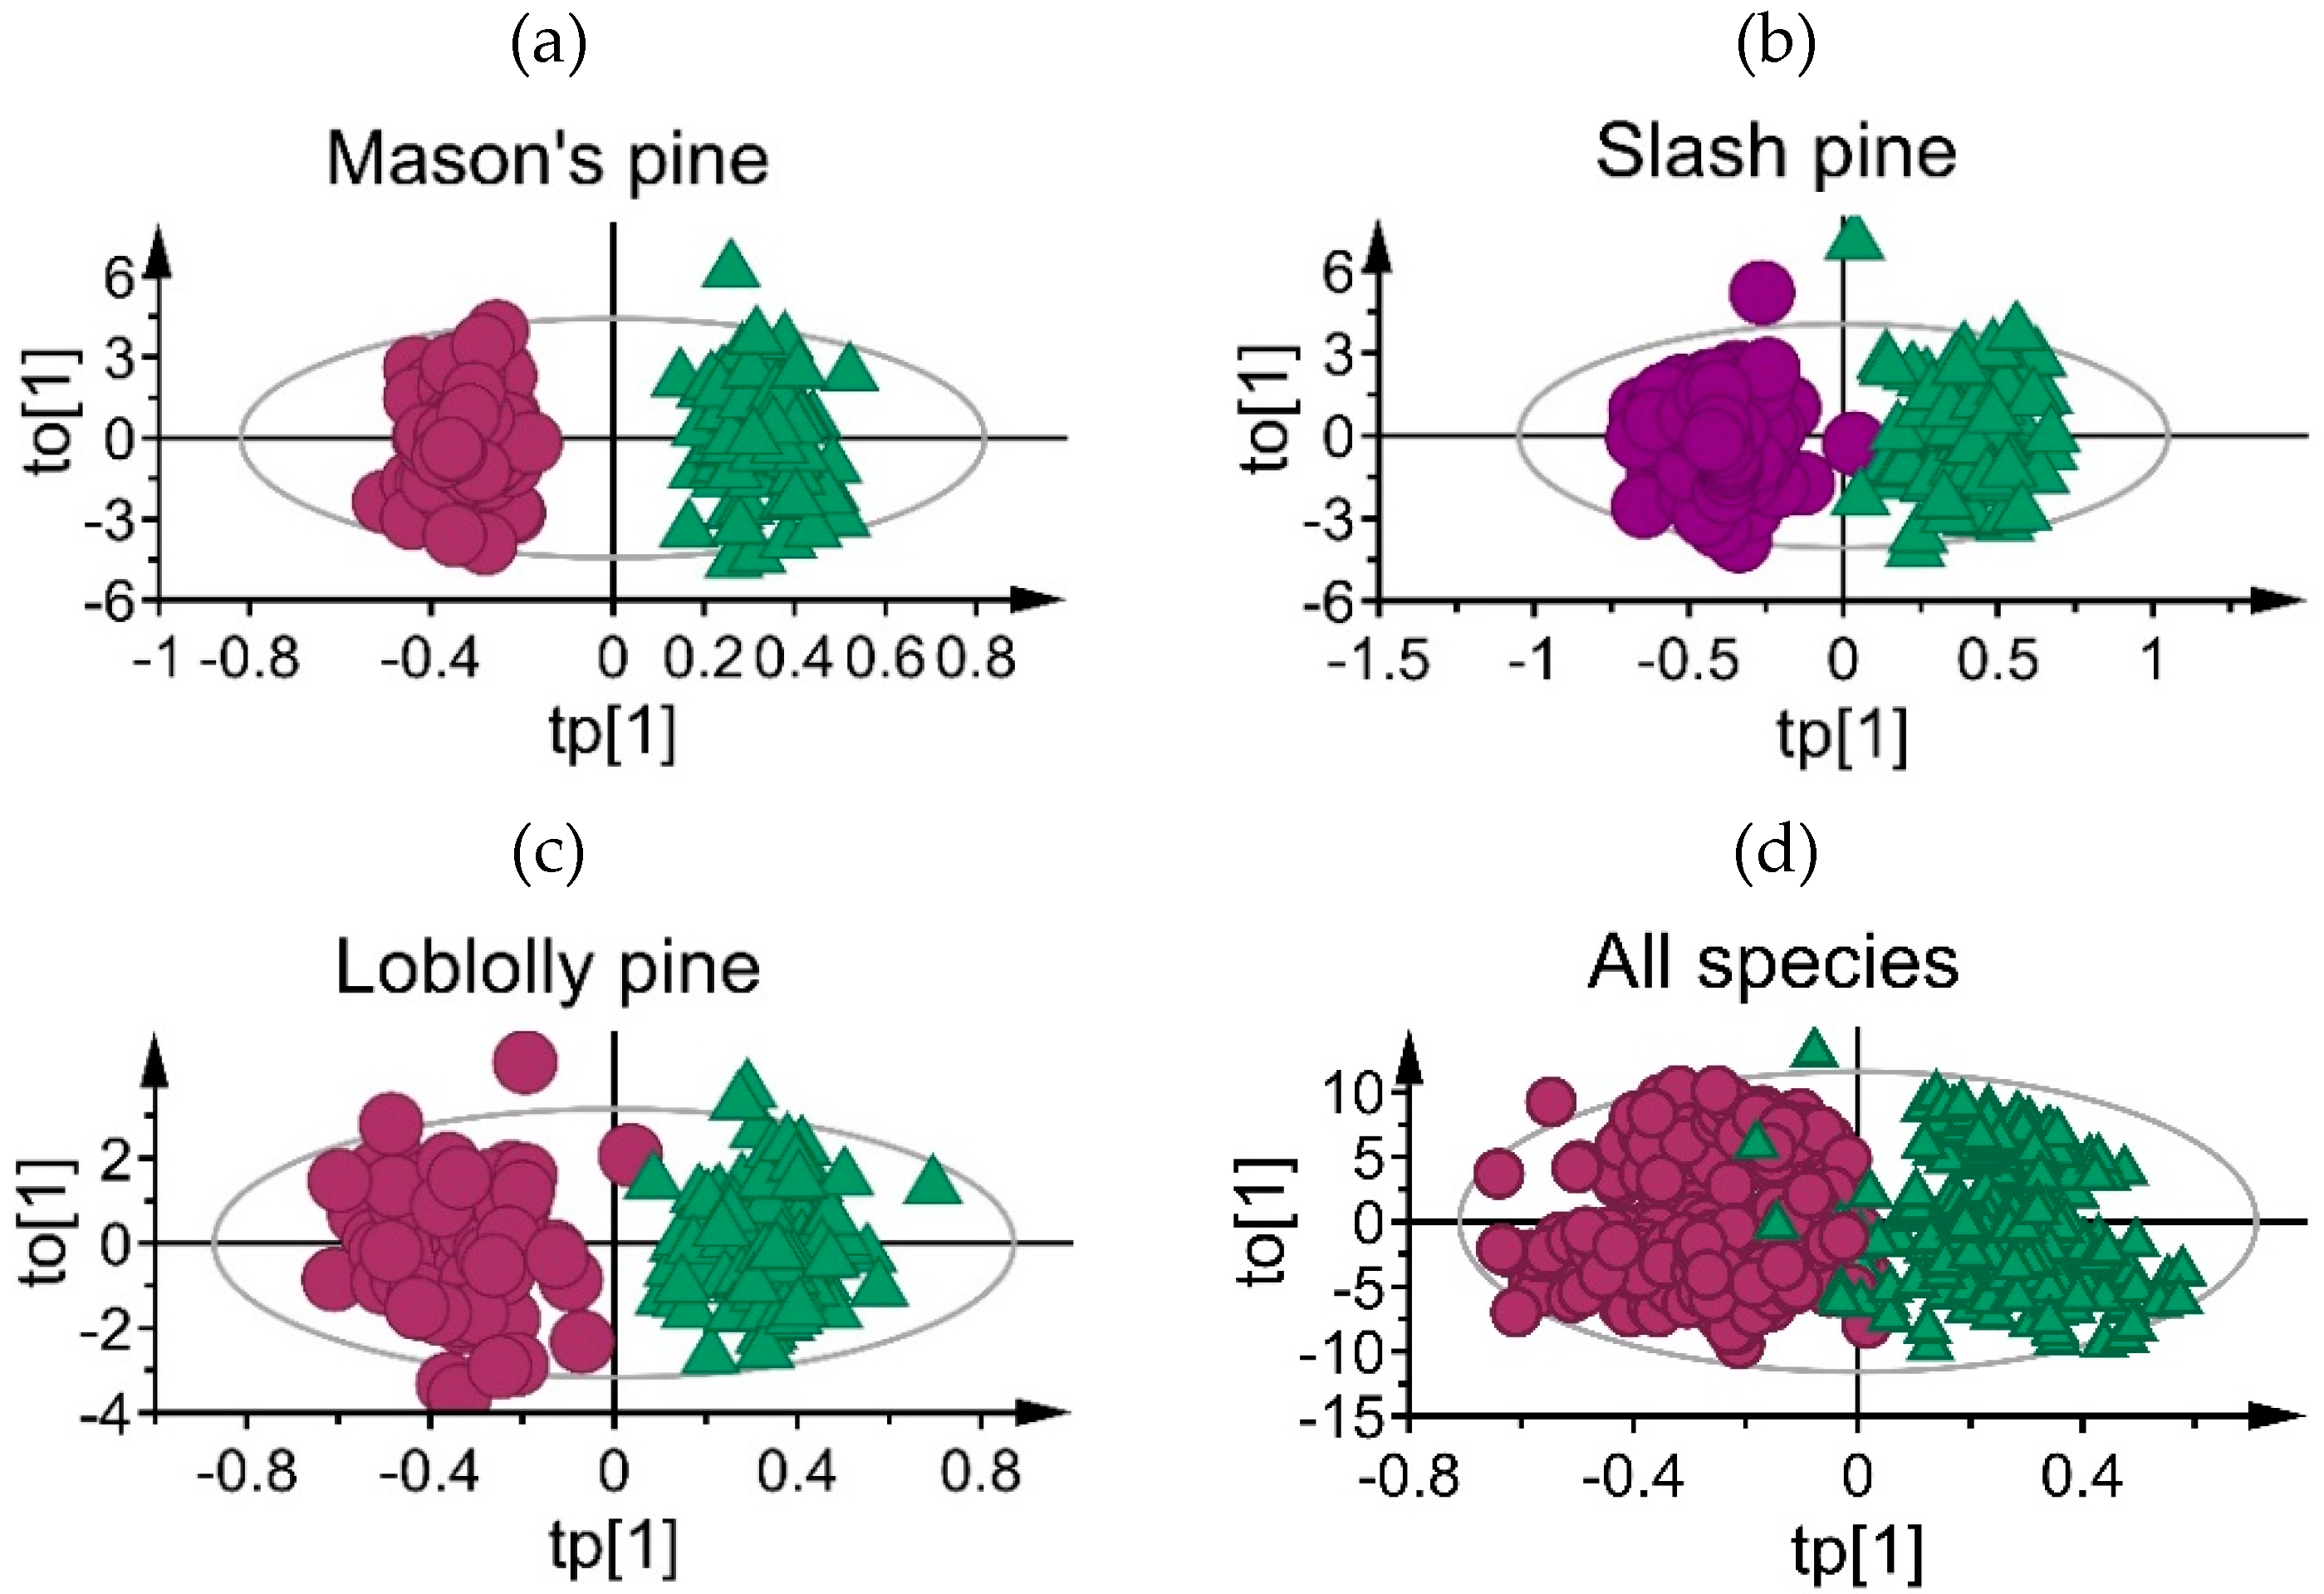
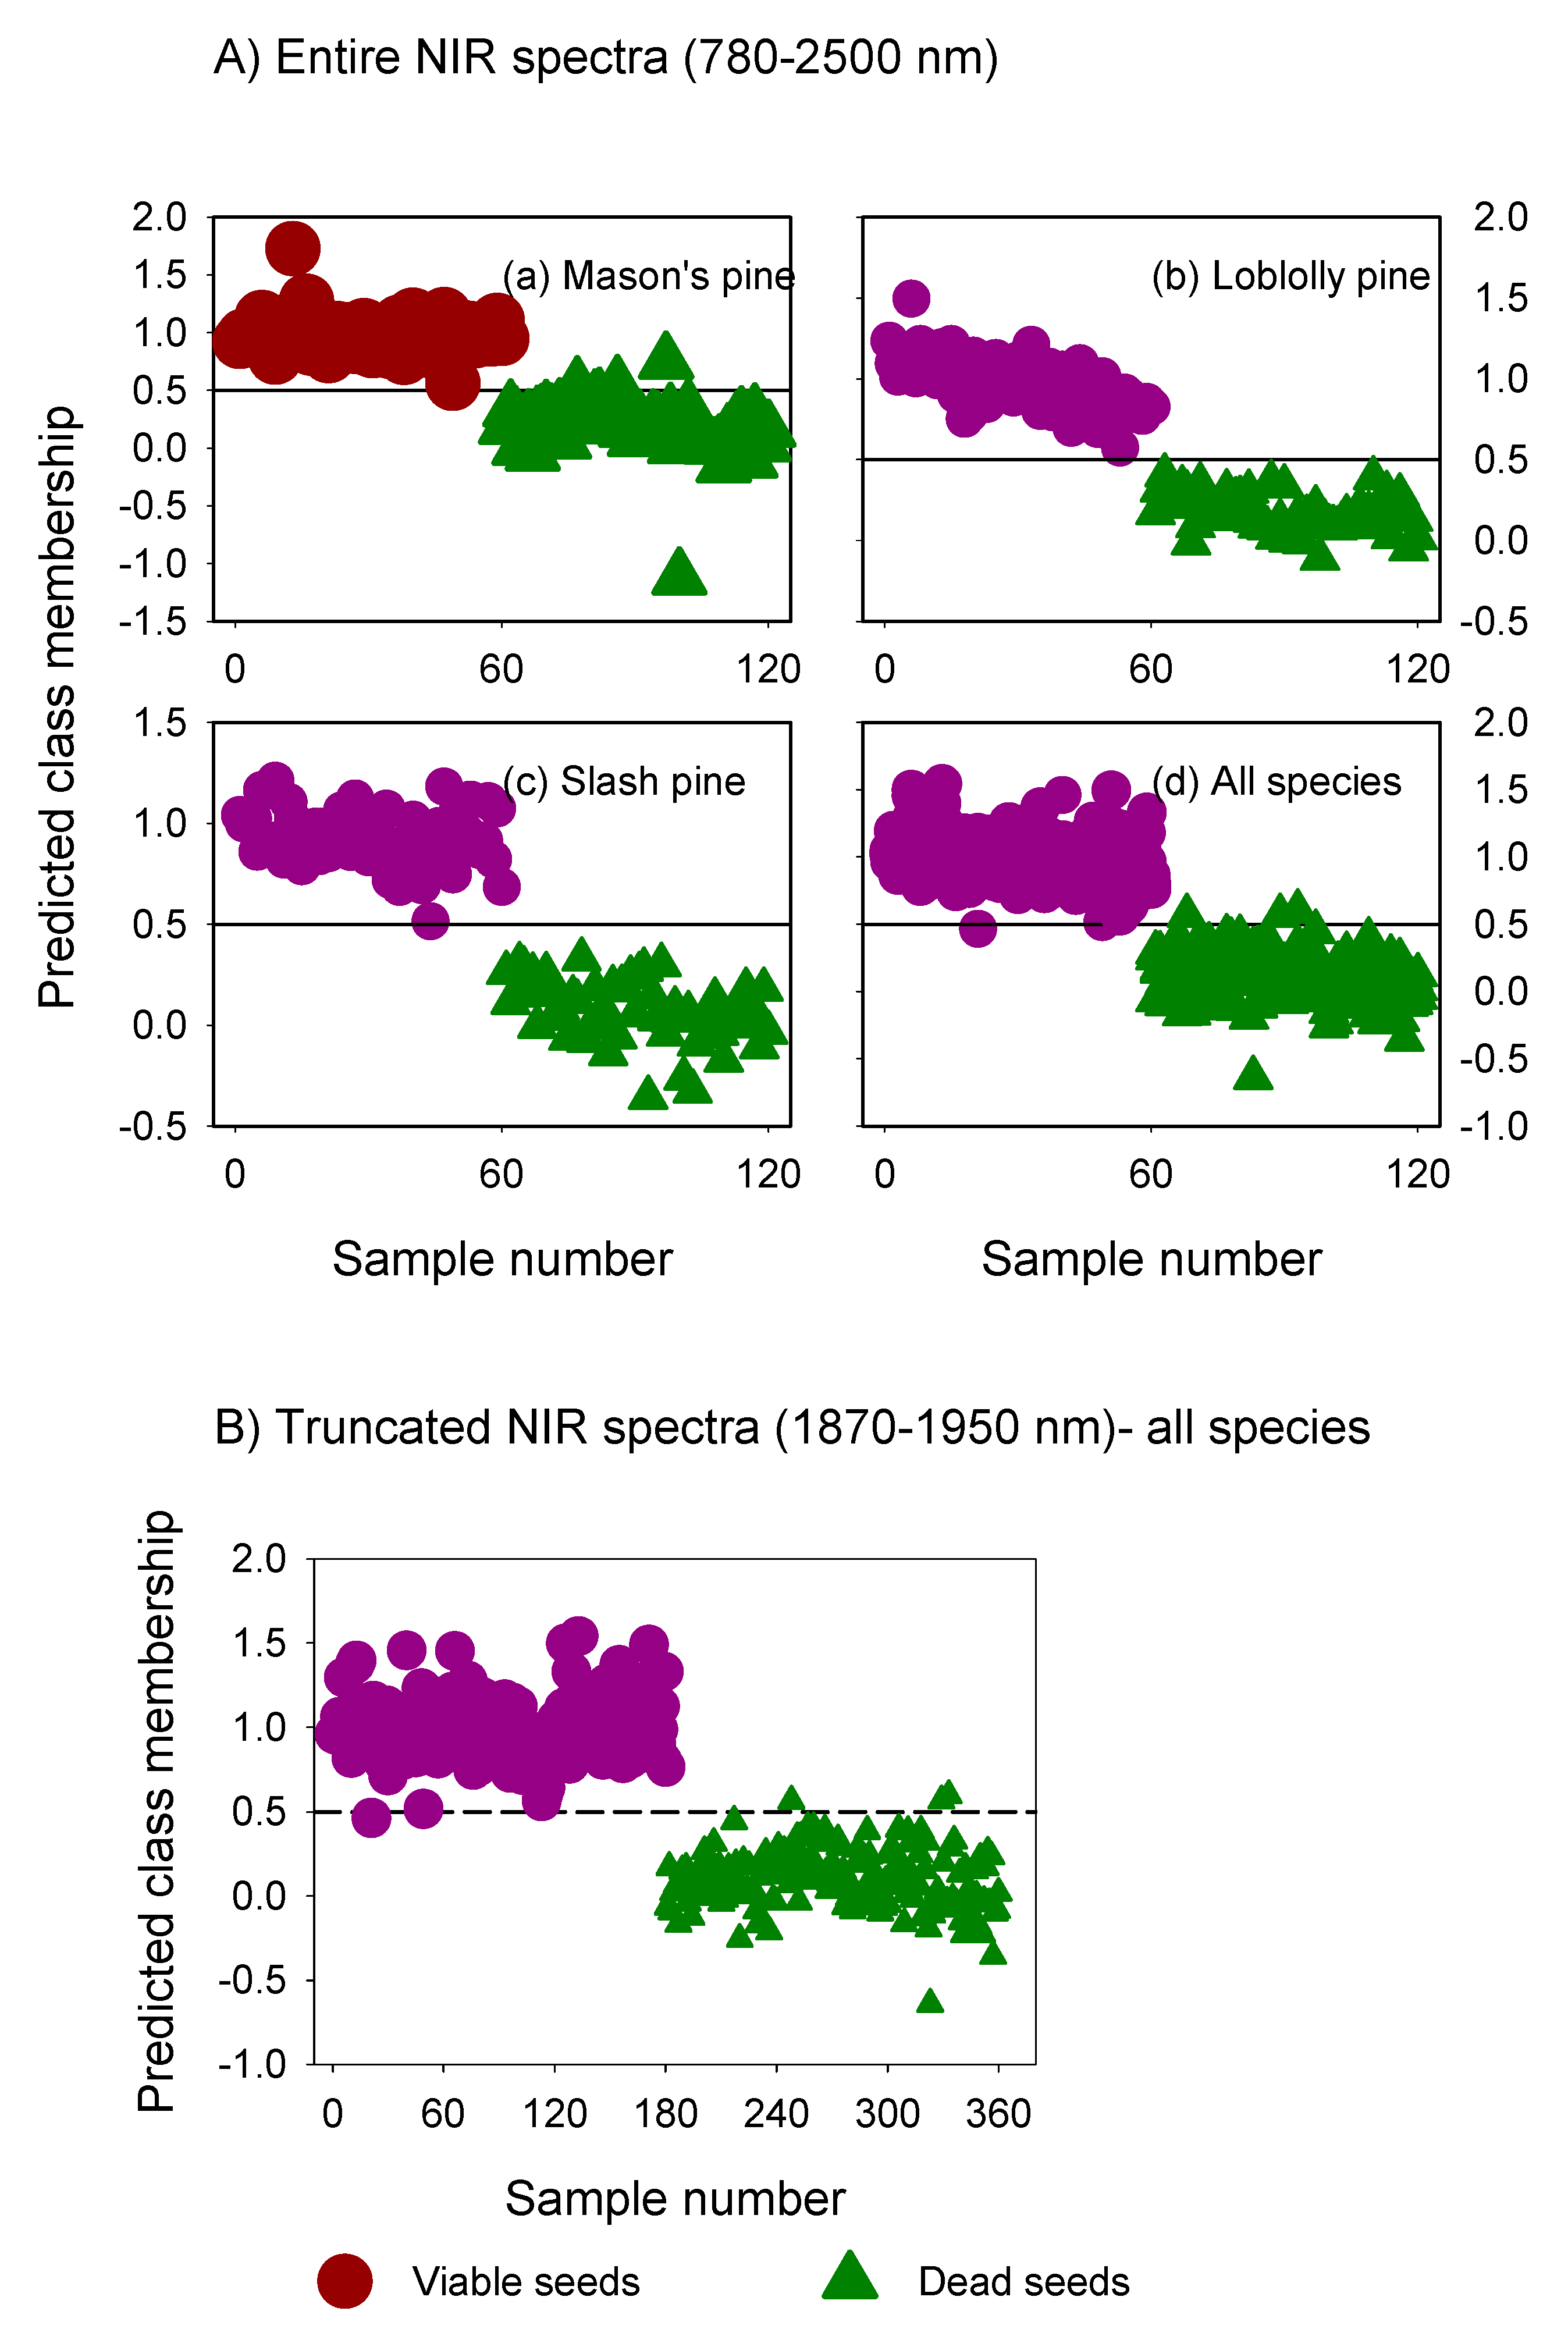
3.2. Classification Performance of Fitted Models

The individual species models completely recognized viable and dead-filled seeds in the validation set whereas the all species model misclassified three viable and two dead-filled seeds (Figure 4). The ability of the models fitted on full NIR spectra to assign viable and dead-filled seeds in the validation set to their respective classes (sensitivity) and their ability to reject seeds of other classes (specificity) were 100% when the model was fitted for each species separately (Table 3). The combined species models fitted on the whole NIR spectral region and truncated spectra had also very high sensitivity (98%–99%) and specificity (98%–99%). The mean classification accuracy was 100% for Mason’s pine, loblolly pine and slash pine, while it was 99% for all species combined together.

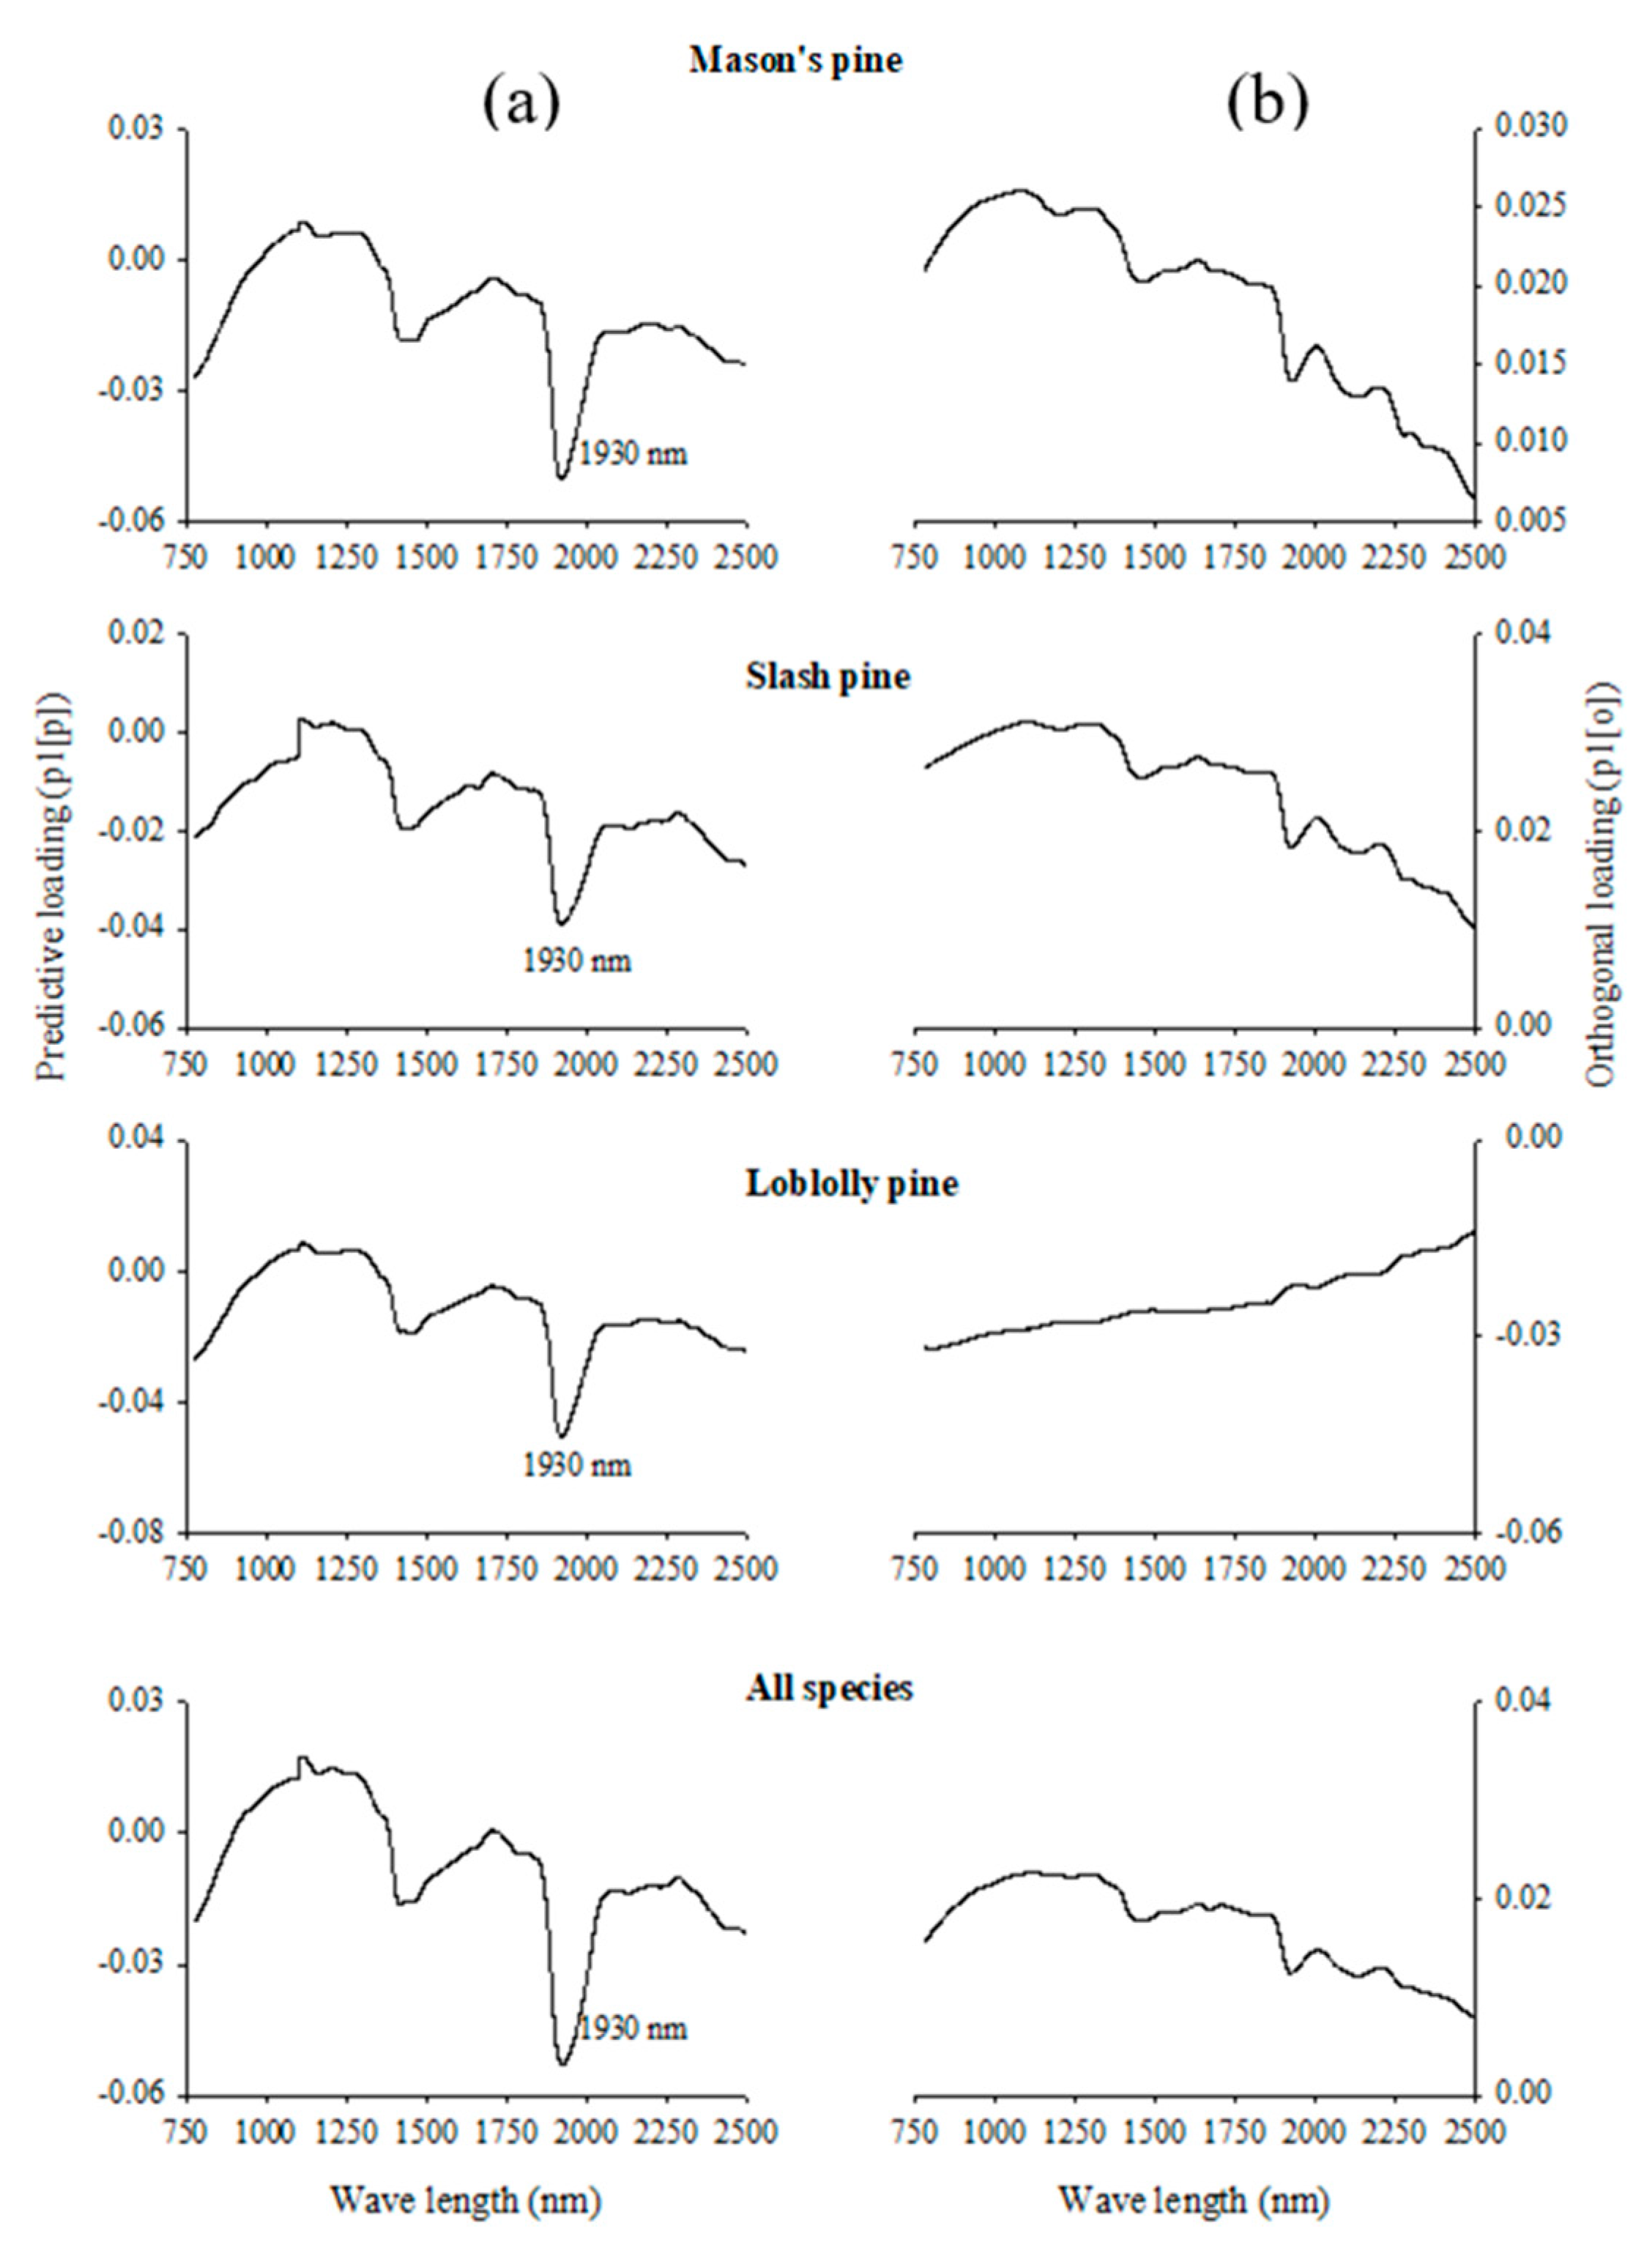
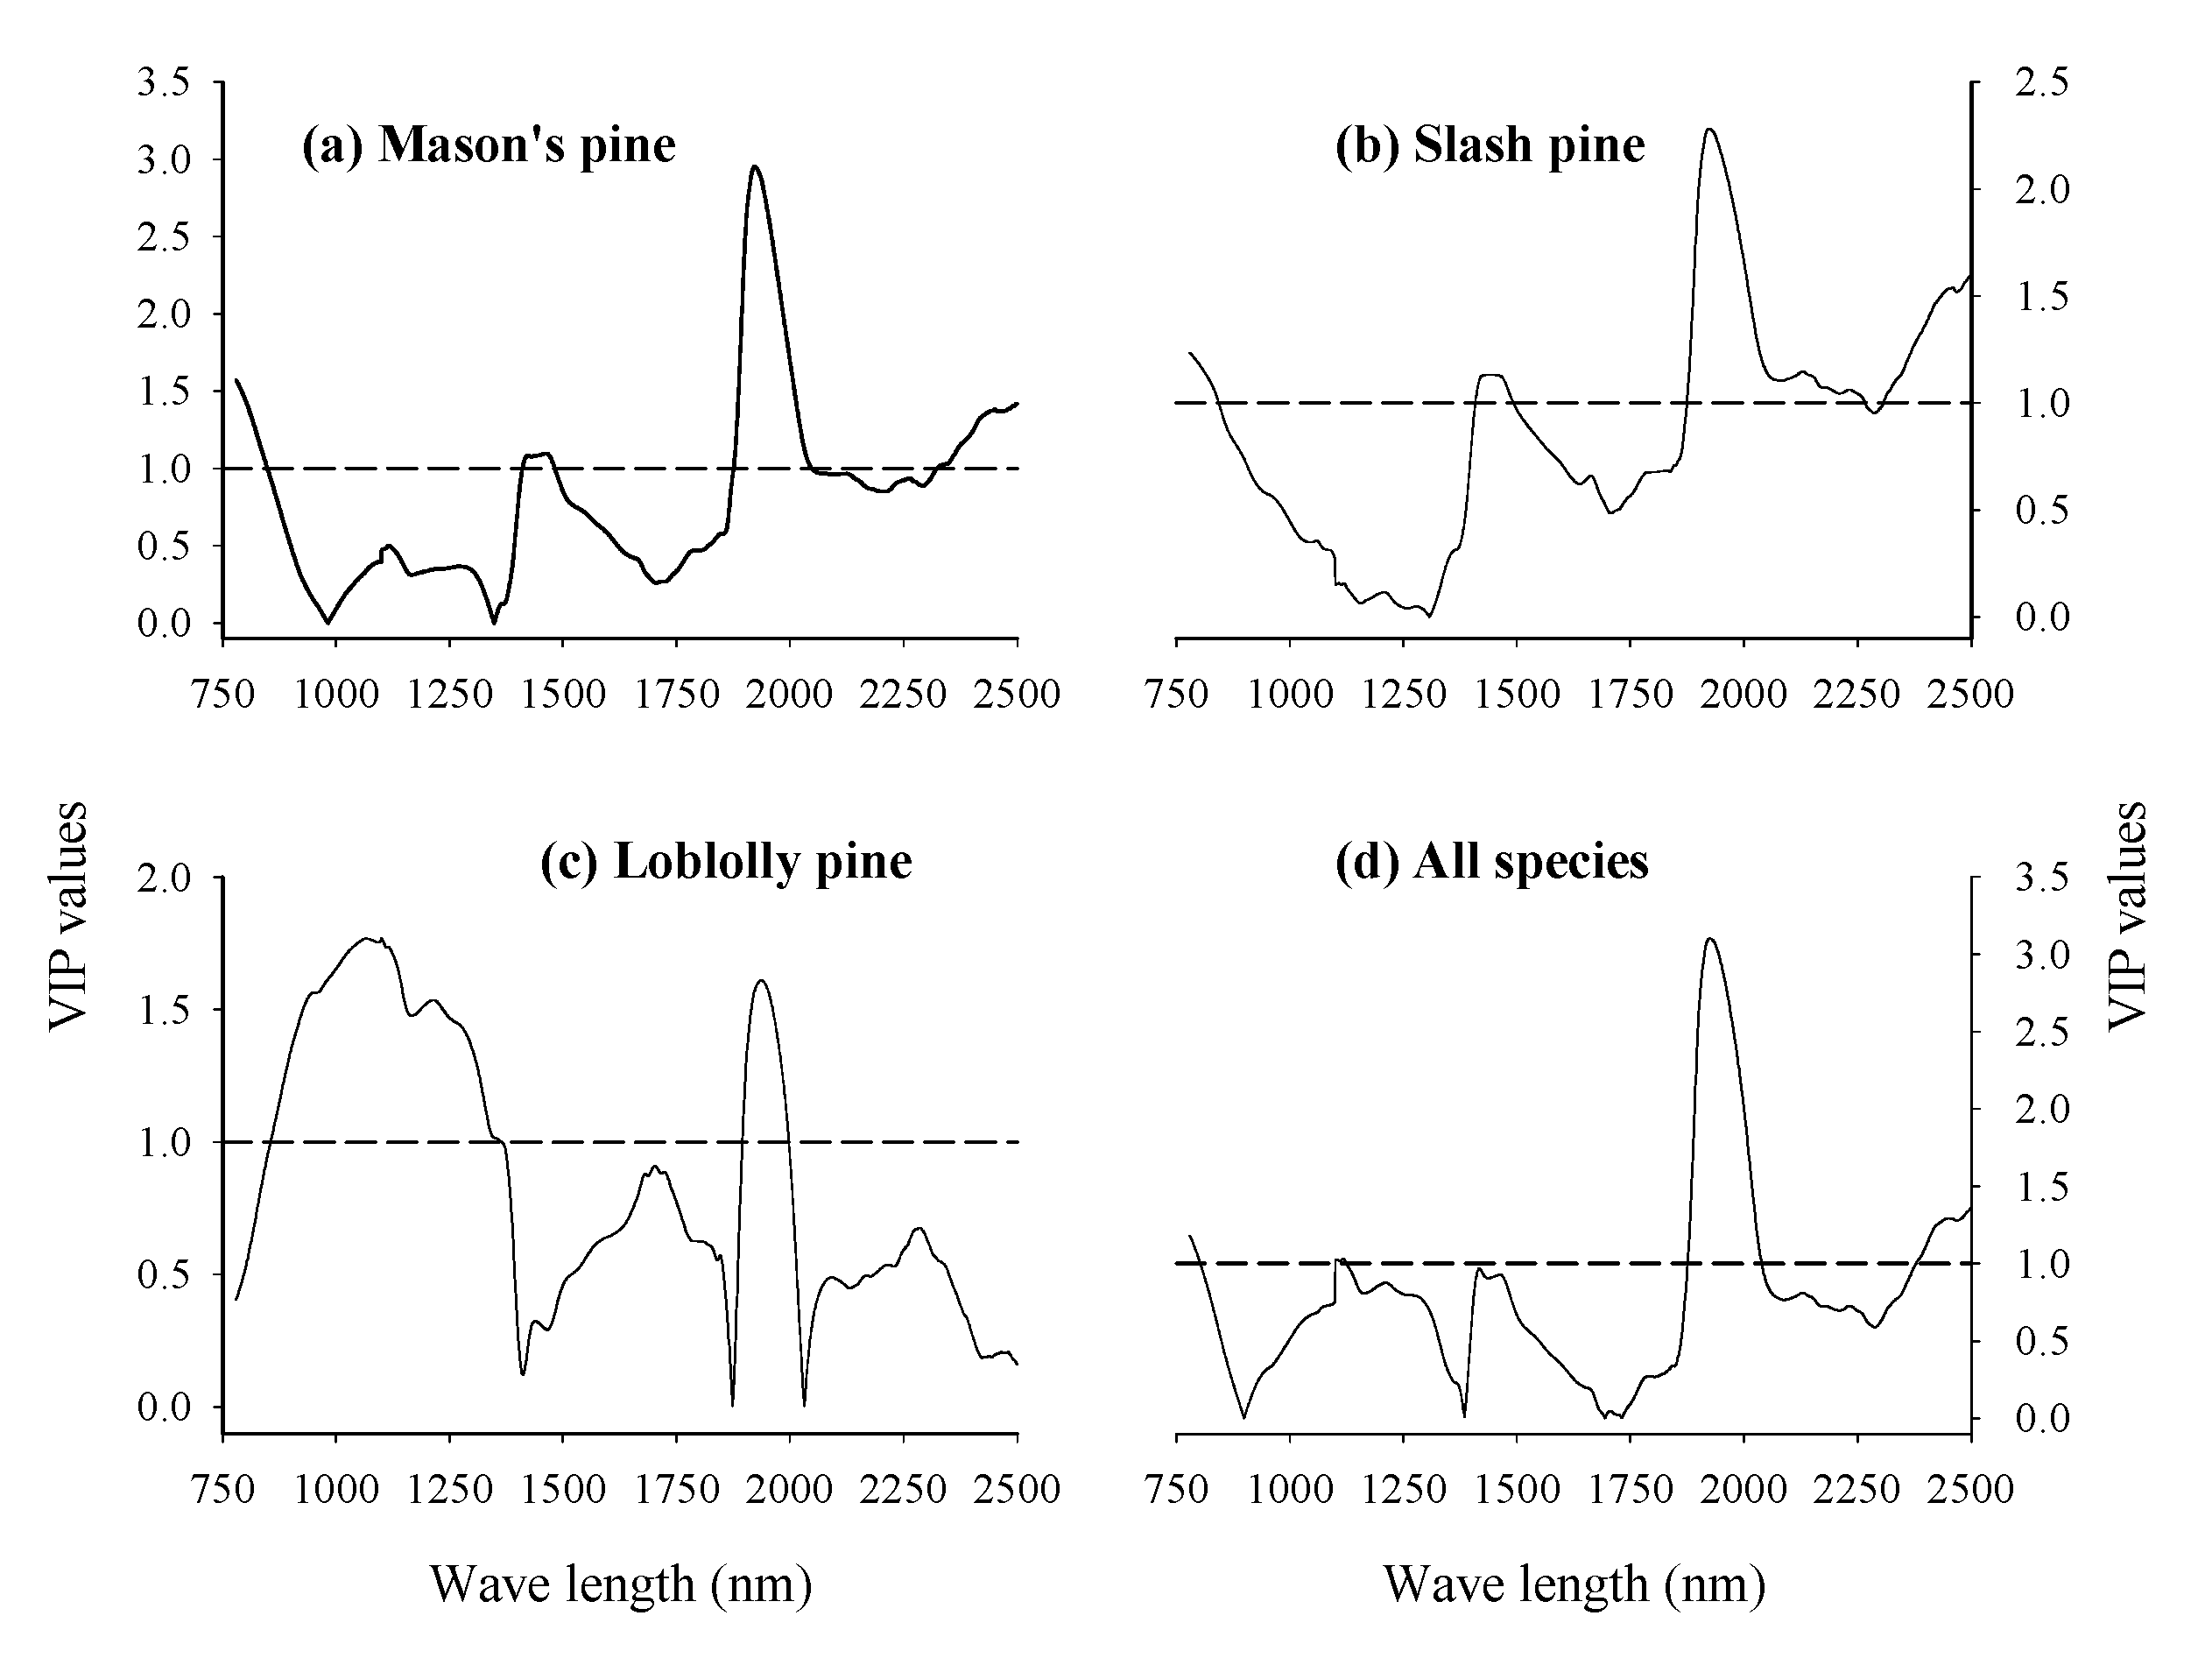
3.3. Absorption Bands Relevant for Discriminating Viable and Dead-Filled Pine Seeds

For all three pine seed lots, the plots of VIP values show that the absorption band in 1870–2000 nm with absorption maxima appeared at 1930 nm and strongly influenced the separation of dead-filled and viable seeds (Figure 5; VIP > 1). For Mason’s pine and slash pine, the absorption band in 1400–1500 nm with absorption maxima occurred at 1460 nm and appeared to be also relevant to discriminate viable and dead-filled seeds (VIP = 0.9), whereas the absorption band in 890–1348 nm with broad peak at 1080 nm was highly relevant for discriminating viable and dead-filled seeds of loblolly pine. Other NIR regions of interest for discriminating viable and dead-filled seeds by combined species model appeared in 1098–1300 nm and 1400–1550 nm with absorption peaks centered at 1118 nm and 1450 nm (VIP = 0.8–1.0).

4. Discussion

The NIR spectra of pine seed lots contain sufficient information with subtle differences in absorbance values, particularly for loblolly pine (Figure 1). This might be due the slight variation in moisture content between viable and dead-filled seeds of loblolly pine compared to the other two pine species (Table 1). However, the computed OPLS-DA models effectively used this subtle spectral variation to considerably explain the class variation with excellent predictive power as multivariate analysis is powerful in extracting this subtle difference in the samples [30]. One significant predictive component was sufficient to condense the large spectral data set by removing 97% of orthogonal spectral variation that had no correlation with class variation (Table 2). This large proportion of orthogonal spectral variation might arise from spectral redundancy as the XDS Rapid Content Analyzer used in this study measured the reflectance at an interval of 0.5 nm. Previous studies have attributed spectral redundancy to large orthogonal variations in the spectra [20,21,31].
Furthermore, the large uncorrelated spectral variation could be attributed to path length differences and light scattering as a result of variations in individual seed size, moisture content and chemical composition [15,18]. This can be further seen from the score plot where dead-filled seeds were slightly more dispersed than viable seeds along the orthogonal component (Figure 2). The corresponding orthogonal loading plot (Figure 3) shows smaller absorption peaks at 1113 nm and 1304 nm for Mason’s pine, slash pine and all species combined that correlate with the dispersion pattern of samples observed in the score plot. The absorption band in the 1100–1400 nm with absorption maxima appeared at 1113 nm and 1312 nm has been ascribed to the binding of two water molecules to the hydroxide ion [12]. Apparently, differences in water content of individual seeds could be the major source of Y-orthogonal spectral variation. For loblolly pine seeds, no major absorption peak was observed, suggesting that the Y-orthogonal spectral variation could be related to the baseline shift.
The computed OPLS-DA models substantially describe the class variation with one significant predictive component to build the model (Table 2). Parsimonious models with few predictive components are often desired as dimensionally complex which is an important aspect in the interpretation of multivariate analysis [32]. For both individual species models and the global model, the sensitivity (the model’s ability to recognize members of a given class) and specificity (the model’s ability to reject non-members of a given class) was superb for validation sets (Table 3). This indicates the robustness of both models and the prospect of NIR spectroscopy as a sorting system for improving seed lot quality by removing the dead-filled seeds of pine species. Compared with the current sorting system (IDS technique) with 10%–15% sorting error, the NIR appears to be superior as the misclassification rate is just 1%. The success of discriminating viable and dead-filled seeds using truncated spectra accentuates the prospect of developing sorting systems using filters or diode arrays, which are less expensive.
For all three pine seed lots, the VIP plot shows that the absorption band in 1900–2000 nm with absorption maxima occurred at 1930 nm and strongly influenced the separation of dead-filled and viable seeds (Figure 5). The 1900–2000 nm region is characterized mainly by O–H stretch and HOH deformation combination and O–H bend second overtone, and pure water has absorption maxima at 1940 nm [10,31]. The shift in absorption maxima in our study could be related to variations in hydrogen bonding and temperature when water is in solute admixture and a solvent [10]. As a whole, this region was found useful to discriminate sound and insect-attacked seeds by NIR spectroscopy based on differences in relative water content [15].
In addition, the absorption band in 1400–1500 nm with a peak at 1450 had appeared to be relevant to discriminate viable and dead-filled seeds of pine species. The region is characterized by O–H and N–H stretch first overtone and C–H combination bands due to absorption by ROH, protein moieties, starch and H2O; and water has absorption maxima at 1450 nm. For loblolly pine seeds, additional absorption bands in 860–1370 nm with absorption maxima appeared at 1074 nm and 1215 nm and had an influence on the discrimination of dead-filled and viable seeds. While the absorption band in 780–1100 nm is attributed to O–H stretching second overtone due to absorption by aliphatic and aromatic hydroxyl groups, the absorption band in 1100–1300 nm region is characterized by a second overtone of C–H stretching vibration due to absorption by methyl and methylene [12,33]. Thus, the difference in relative water content between dead-filled and viable seeds was the basis for discriminating the two seed lot fractions by NIR spectroscopy. It should be noted that after three days of incubation on moist medium and subsequent drying for 6 hours, the dead-filled seeds dried faster than viable-filled seeds that had metabolically fixed the absorbed water (Table 1). This eventually created sufficient relative water content difference between dead-filled and viable seeds for detection by NIR spectroscopy.

5. Conclusions

The results demonstrated that a global calibration model of seed lots of several pine species can be equally effective as individual species model to discriminate viable and dead-filled seeds by NIR spectroscopy, thereby enhancing seed lot quality. Improved seed lot quality, in turn, enables precision sowing in the nursery, and reduces the time, energy and resources needed for replacement planting of empty planting pots or thinning of young seedlings in the case where several seeds are sown per pot. Sowing such high quality seeds, in turn, ensures the production of uniform-sized seedlings in nurseries. Further evaluation of outplanting performance will enable defining target seedlings for planting in a reforestation site, resulting in better survival and growth for outplanted seedlings. The technique is extremely fast as it takes a fraction of a minute to scan a single seed. In addition, it is a simple task to acquire the spectral data, with the possibility for automation of the process. As sorting by NIR spectroscopy is based on a universal phenomenon that dead-filled seeds dry faster than viable seeds, it can be applied to several economically important pine species. The success of classifying viable and dead-filled seeds using truncated spectra sheds light on the prospect of developing less expensive sorting systems using filters and diode arrays. Thus, efforts need to be made to construct an automated sorting system based on NIR technology.

Author Contributions

Conceptualization, M.T., P.W., X.M. and P.C.O; formal analysis, M.T.; funding acquisition, M.T., X.M., P.W. and P.C.O.; investigation, A.D. and R.J.; methodology, M.T.; writing—original draft, M.T. and A.D.; writing—review and editing, M.T., P.W., X.M. and P.C.O.

Funding

This study is financially supported by the Science and Technology Major Project of Fujian Province, China (2018NZ0001-1) and Partner Driven Cooperation project, and the Swedish International Development Agency (AKT-2010-009).

Acknowledgments

We thank Erik Walfridsson at the Forest Research Institute of Sweden in Sävar for valuable discussions on issues related to sorting of tree seeds.

Conflicts of Interest

The authors declare no conflict of interest.

References

  1. Payn, T.; Carnus, J.-M.; Freer-Smith, P.; Kimberley, M.; Kollert, W.; Liu, S.; Orazio, C.; Rodriguez, L.; Silva, L.N.; Wingfield, M.J. Changes in planted forests and future global implications. For. Ecol. Manag. 2015, 352, 57–67. [Google Scholar] [CrossRef] [Green Version]
  2. Del Lungo, A.; Ball, J.; Carle, J. Global Planted Forests Thematic Study: Results and Analysis. Planted Forests and Tree Working Paper 38, FAO, Rome. 2006. Available online: http://www.fao.org/forestry/12139-03441d093f070ea7d7c4e3ec3f306507.pdf (accessed on 20 March 2019).
  3. Winsa, H.; Sahlén, K. Effects of Seed Invigoration and Microsite Preparation on Seedling Emergence and Establishment After Direct Sowing of Pinus sylvestris L. at Different Dates. Scand. J. For. Res. 2001, 16, 422–428. [Google Scholar] [CrossRef]
  4. Landis, T.D. The Target Plant Concept―a history and brief overview. In National Proc: Forest and Conservation Nursery Assoc―2010; Riley, L.E., Haase, D.L., Pinto, J.R., Eds.; Tech cords.; Proc RMRS-P-65; US Dept Agric Forest Serv Rocky Mtn Res Sta: Ft Collins, CO, USA, 2011; pp. 61–66. [Google Scholar]
  5. Dumroese, R.K.; Landis, T.D.; Pinto, J.R.; Haase, D.L.; Wilkinson, K.W.; Davis, A.S. Meeting forest restoration challenges: Using the target plant concept. Reforesta 2016, 1, 37–52. [Google Scholar] [CrossRef]
  6. Slobodník, B.; Gutternberger, H. Ovule, megaspores and female gametophyte formation in Larix decidua Mill. (Pinaceae). Acta Biologica Cracov. 2000, 42, 93–100. [Google Scholar]
  7. Gutterman, Y. Maternal effects on seeds during development. In Seeds: The Ecology of Regeneration in Plant Communities, 2nd ed.; Fenner, M., Ed.; CABI Publishing: Wallingford, UK, 2000; pp. 59–84. [Google Scholar]
  8. Simak, M. A method for the removal of filled-dead seeds from a sample of Pinus contorta. Seed Sci. Technol. 1984, 12, 767–775. [Google Scholar]
  9. Downie, B.; Wang, B.S.P. Upgrading germinability and vigor of jack pine, logdepole pine, and white spruce by the IDS technique. Can. J. For. Res. 1992, 22, 1124–1131. [Google Scholar] [CrossRef]
  10. Sivakumar, V.; Anandalakshmi, R.; Warrier, R.R.; Singh, B.G.; Tigabu, M.; Odén, P.C. Petroleum flotation technique upgrades the germinability of Casuarina equisetifolia seed lots. New For. 2007, 34, 281–291. [Google Scholar] [CrossRef]
  11. Agelet, L.E.; Hurburgh, C.R. Limitations and current applications of Near Infrared Spectroscopy for single seed analysis. Talanta 2014, 121, 288–299. [Google Scholar] [CrossRef] [PubMed]
  12. Workman, J.; Weyer, L. Practical Guide and Spectral Atlas for Interpretive Near- Infrared Spectroscopy, 2nd ed.; CRC Press: Boca Raton, FL, USA, 2012; pp. 1–303. [Google Scholar]
  13. Burns, D.A.; Ciurczak, E.W. Handbook of Near-Infrared Analysis, 2nd ed.; Marcel Dekker Inc.: New York, NY, USA, 2001; pp. 1–803. [Google Scholar]
  14. Tigabu, M.; Odén, P.C. Multivariate classification of sound and insect-infested seeds of a tropical multipurpose tree, Cordia africana, with near infrared reflectance spectroscopy. J. Near Infrared Spectrosc. 2002, 10, 45–51. [Google Scholar] [CrossRef]
  15. Tigabu, M.; Odén, P.C. Near infrared spectroscopy-based method for separation of sound and insect-damaged seeds of Albizia schimperiana, a multipurpose legume. Seed Sci. Technol. 2003, 31, 317–328. [Google Scholar] [CrossRef]
  16. Tigabu, M.; Odén, P.C. Simultaneous detection of filled, empty and insect-infested seeds of three Larix species with single seed near infrared transmittance spectroscopy. New For. 2004, 27, 39–53. [Google Scholar] [CrossRef]
  17. Tigabu, M.; Odén, P.C.; Shen, T.Y. Application of near infrared spectroscopy for the detection of internal insect infestation in Picea abies seed lots. Can. J. For. Res. 2004, 34, 76–84. [Google Scholar] [CrossRef]
  18. Tigabu, M.; Fjellström, J.; Odén, P.C.; Teketay, D. Germination of Juniperus procera seeds in response to stratification and smoke treatments, and detection of insect-damaged seeds with VIS + NIR spectroscopy. New For. 2007, 33, 155–169. [Google Scholar] [CrossRef]
  19. Tigabu, M.; Odén, P.C. Classification of viable and empty seeds of Pinus patula Schiede & Deppe with near-infrared spectroscopy and multivariate analysis. New For. 2003, 25, 163–176. [Google Scholar]
  20. Daneshvar, A.; Tigabu, M.; Karimidoost, A.; Odén, P.C. Single seed near infrared spectroscopy discriminates viable and non-viable seeds of Juniperus polycarpos. Silva Fenn. 2015, 49, 14. [Google Scholar] [CrossRef]
  21. Farhadi, M.; Tigabu, M.; Odén, P.C. Near Infrared Spectroscopy as non-destructive method for sorting viable, petrified and empty seeds of Larix sibirica. Silva Fenn. 2015, 49, 12. [Google Scholar] [CrossRef]
  22. Lestander, T.A.; Odén, P.C. Separation of viable and non-viable filled Scots pine seeds by differentiating between drying rates using single seed near infrared transmittance spectroscopy. Seed Sci. Technol. 2002, 30, 383–392. [Google Scholar]
  23. Trygg, J.; Wold, S. O2-PLS, a two-block (X-Y) latent variable regression (LVR) method with an integral OSC filter. J. Chemom. 2003, 17, 53–64. [Google Scholar] [CrossRef]
  24. Baskin, C.C.; Baskin, J.M. Seeds: Ecology, Biogeography and Evolution of Dormancy and Germination, 2nd ed.; Academic Press: San Diego, CA, USA, 2001; pp. 1–666. [Google Scholar]
  25. Bylesjö, M.; Rantalainen, M.; Cloarec, O.; Nicholson, J.K.; Holmes, E.; Trygg, J. OPLS discriminant analysis: combining the strengths of PLS-DA and SIMCA classification. J. Chemom. 2006, 20, 341–351. [Google Scholar] [CrossRef]
  26. Rinnan, Å.; Van Den Berg, F.; Engelsen, S.B. Review of the most common pre-processing techniques for near-infrared spectra. TrAC-Trends Anal. Chem. 2009, 28, 1201–1222. [Google Scholar] [CrossRef]
  27. Ballabio, D.; Consonni, V. Classification tools in chemistry. Part 1: linear models. PLS-DA. Anal. Methods 2013, 5, 3790–3798. [Google Scholar] [CrossRef]
  28. Galindo-Prieto, B.; Eriksson, L.; Trygg, J. Variable influence on projection (VIP) for OPLS models and its applicability in multivariate time series analysis. Chemom. Intell. Lab. Syst. 2015, 146, 297–304. [Google Scholar] [CrossRef]
  29. Eriksson, L.; Johansson, E.; Kettaneh-Wold, N.; Trygg, J.; Wikström, C.; Wold, S. Multi- and Megavariate data analysis: Basic Principles and Applications, 2nd ed.; Umetrics Academy: Umeå, Sweden, 2006; pp. 63–101. [Google Scholar]
  30. Næs, T.; Isaksson, T.; Fearn, T.; Davies, T. A User Friendly Guide to Multivariate Calibration and Classification; NIR Publications: Chichester, UK, 2002; pp. 1–344. [Google Scholar]
  31. Tigabu, M.; Farhadi, M.; Stener, L.-G.; Odén, P.C. Visible + Near Infrared Spectroscopy as taxonomic tool for identifying birch species. Silva Fenn. 2018, 52, 13. [Google Scholar] [CrossRef]
  32. Pinto, R.C.; Trygg, J.; Gottfries, J. Advantages of orthogonal inspection in chemometrics. J. Chemom. 2012, 26, 231–235. [Google Scholar] [CrossRef]
  33. Shenk, J.S.; Workman, J.J.; Westerhaus, M.O. Application of NIR spectroscopy to agricultural products. In Handbook of Near-Infrared Spectroscopy, 2nd ed.; Burns, D.A., Ciurczak, E.W., Eds.; Marcel Dekker Inc.: New York, NY, USA, 2001; pp. 419–474. [Google Scholar]
Figure 1. Average uncorrected near infrared (NIR) spectra of viable and dead-filled seeds of Mason’s pine, loblolly pine and slash pine.
Forests 10 00469 g001
Figure 2. Score plots for the predictive (tp[1]) versus orthogonal (to[1]) components depicting grouping patterns of viable (pink dots) and dead-filled (green triangles) seeds of Mason’s pine (a), slash pine (b), loblolly pine (c) and all species combined (d).
Forests 10 00469 g002
Figure 3. Loading plots for the predictive component (P1[p]; (a)) and the first orthogonal component (P1[o]; (b)) showing absorption bands correlating to seed classes and those that are not correlated to class discrimination, respectively.
Forests 10 00469 g003
Figure 4. (A) The predicted class membership of viable and dead-filled seeds in the validation sets by discriminant models fitted on single seed NIR spectra of Mason’s pine (a), loblolly pine (b), slash pine (c) and all species combined (d) as well as truncated spectra of all species (B). The horizontal black dashed line is the classification threshold (Ypred > 0.5).
Forests 10 00469 g004
Figure 5. VIP plots depicting absorption bands that were responsible for discriminating viable and dead-filled seeds of Mason’s pine (a), Slash pine (b), loblolly pine (c) and all species combined (d).
Forests 10 00469 g005
Table 1. The relative water content (%) of dead-filled and viable seeds of three pine species after incubation and drying for six hours.
SpeciesViable SeedsDead-Filled Seeds
Mason’s pine13.98.0
Slash pine13.06.2
Loblolly pine8.16.1
Table 2. Summary of model statistics for discriminant models developed to distinguish viable and dead-filled seeds of each pine species separately and all species combined using the entire NIR region (780–2500 nm) and truncated spectra (1870–1950 nm). Where A stands for number of significant predictive (the first values) and orthogonal (the second values) components to build the model; R2Xp is the explained predictive spectral variation; R2Xo = the explained Y-orthogonal variation that has no correlation to class discrimination; R2Y = the class variation explained by the model; and Q2cv = the predictive power of a model based on cross validation.
SpeciesModel Statistics
AR2XpR2XoR2YQ2cv
Mason’s pine1 + 90.0260.9740.9420.923
Loblolly pine1 + 50.0240.9760.9010.864
Slash pine1 +70.0210.9790.9090.879
All species1 + 120.0030.9970.8040.796
All species-truncated spectra1 + 100.020.9800.8110.797
Table 3. Classification performance of models fitted on whole NIR spectral region (780–2500 nm) and truncated NIR spectra (1870–1950 nm) for classifying viable and dead-filled seeds of three pine species in the validation set (n = 60 seeds per class and species). Where Sn, Sp, CA and ER denote class sensitivity, class specificity, classification accuracy and error rate, respectively.
SpeciesClassSnSpCAER
Mason’s pineViable1.01.01.00.0
Dead-filled1.01.01.00.0
Loblolly pineViable1.01.01.00.0
Dead-filled1.01.01.00.0
Slash pineViable1.01.01.00.0
Dead-filled1.01.01.00.0
All speciesViable0.980.990.990.01
Dead-filled0.990.980.990.01
All species: truncated spectraViable0.990.990.990.01
Dead-filled0.980.980.990.01

