Article

Projecting Monterey Pine (Pinus radiata) Populations over Time in the Presence of Various Representations of Pitch Canker Disease, Caused by Fusarium circinatum

by
Gregory J. Reynolds
1,
Thomas R. Gordon
2 and
Neil McRoberts
2,*
1
Forest Health Protection, U.S. Forest Service, 333 Broadway Blvd. SE, Albuquerque, NM 87102, USA
2
Department of Plant Pathology, University of California, One Shields Avenue, Davis, CA 95616, USA
*
Author to whom correspondence should be addressed.
Forests 2019, 10(5), 437; https://doi.org/10.3390/f10050437
Submission received: 29 April 2019 / Revised: 15 May 2019 / Accepted: 16 May 2019 / Published: 21 May 2019
(This article belongs to the Special Issue Integrating Forest Health Patterns in Growth and Yield Models)

Abstract

:
Monterey pine (Pinus radiata D. Don) is native to California and widely planted in Mediterranean climates around the world. Pitch canker, a disease caused by Fusarium circinatum Nirenberg and O’Donnell, is a serious threat to P. radiata in native forests and in plantations. Because of its economic importance worldwide, conservation of P. radiata native populations is a high priority. We developed a demographic matrix projection model to simulate dynamics of naturally occurring P. radiata populations in California in the presence of the disease. Tree demography data for the model were collected from seven sites in a native forest on the Monterey Peninsula. Height and stem diameter were recorded for all trees, which were divided into five size classes based on these data. Transition probabilities were calculated for each size class; cone production, seed release, and seed transition probability were estimated using an iterative search process. In the model, pitch canker influences state-specific fecundity and survival probabilities. Five different approaches to include these effects were compared. Populations were projected over 50 decades from three specified initial population sizes. Elasticity analysis indicated that facilitating survival of all size classes is vital to maintaining the structure of the forest.

1. Introduction

Monterey pine (Pinus radiata D. Don) is one of the most widely grown tree species in the world. It is native to the central coast of California, where its range has shifted over time with climate change [1]. Native populations are currently restricted to three locations on the central coast of California and two Mexican islands off Baja California. Monterey pine has been extensively planted internationally, particularly in Spain, New Zealand, Australia, and Chile, and is grown on over 4.2 million hectares [2]. Because of its importance to worldwide timber production and relatively limited native range, native populations in California are an important source of genetic diversity [3]. Furthermore, the native Monterey pine forest on the Monterey Peninsula is considered to be vital to the local tourism economy for its aesthetic value, so maintaining the current structure of the ecosystem is economically important to local stakeholders, such as restaurant, hotel, and golf course owners.
Monterey pine produces serotinous, closed cones that remain attached to the tree for many years and release seeds sporadically in times of extreme heat or during fire. Seedfall varies from year to year but has been drastically reduced in recent years due to fire suppression [4]. Seeds germinate best in mineral soil free of competition from other vegetation, particularly after a fire, but they are able to establish in less than optimal conditions as well [5]. Although limited reproduction may occur for trees as young as 10 years old, substantial seed crops are not produced until trees reach age 20 or even later in dense stands. Monterey pine is a relatively short-lived species, typically attaining full size in 80 years and generally not living longer than 150 years [6].
One of the most important threats to conservation of Pinus radiata in its native range is the fungal disease pitch canker. It is caused by the ascomycete Fusarium circinatum Nirenberg and O’Donnell. Though its geographic origin is not certain, evidence indicates F. circinatum may have evolved in Mexico or Central America [7]. The disease was first described in the southeastern United States [8] and was most likely accidentally introduced to California on seed from the region [7]; it was first identified as the cause of disease in California on Monterey pine in 1986 [9]. In the native range of P. radiata, branch and trunk infections often are initiated by various insect species that serve as vectors [7]. Infected branches and cone whorls may lead to reduced reproduction, and young seedlings and small saplings with trunk infections may be killed, leading to increased mortality for small size classes.
Systemic acquired resistance (SAR) allows plants to respond to an infection attempt by activating various inducible defense responses, thus becoming more resistant to subsequent infections [10]. Previous exposure to F. circinatum has been shown to induce SAR in P. radiata under controlled conditions, manifesting as reduced lesion lengths on previously exposed trees [11]. This phenomenon appears to be occurring under natural conditions as well, as the severity of the epidemic in California has diminished over time [12,13]. As a consequence, P. radiata seedlings and saplings will be less frequently challenged by the pathogen, which may reduce the impact of SAR and render trees more susceptible to pitch canker. Ultimately this may lead to oscillations in disease severity over time not unlike those observed in populations of predators and their prey, the famous lynx–hare interactions found in data collected by Hudson’s Bay Company, for example [14].
Population projection matrix models were originally designed by Leslie [15] as a means to order organisms into age classes and project their populations over time in a density independent manner. Matrices are constructed with transition parameters calculated for each age class based on the probability for an individual of a given age to progress to the next age class in a predefined time step. Population vectors can be multiplied by these matrices and iterated over many time steps to project population dynamics into the future. The technique was modified by Lefkovitch [16] to allow for grouping organisms into size classes, making population projection matrix models more suitable for simulating dynamics of longer-lived organisms, such as forest trees. Caswell [17] further refined the concept for applications in ecology and developed methodology for sensitivity analyses and other statistical inference methods. Projection matrices have been recently applied to forestry studies of conifers in the Sierra Nevada [18] and European beech in Spain [19]. However, no existing studies that we are aware of have incorporated forest pathogens into a projection matrix model for host trees.
The primary purpose of this study was to develop a demographic matrix model to project P. radiata populations into the future under various representations of pitch canker disease dynamics. A brief report on the concept has been published [20].

2. Materials and Methods

2.1. Study Areas

The study was conducted across seven sites within the Del Monte Forest, a native Pinus radiata forest on California’s Monterey Peninsula. One plot was established per site, and each plot was 5 m in diameter (Table 1). Plot centers were located by blindly tossing a hammer into the general area where the plot was to be located. Sites were located in unmanaged stands with natural regeneration present. Mixed-age stands as well as some more advanced stand stages were included. Exact ages of individual trees were not confirmed, because nearly continuous growth of P. radiata on the Monterey Peninsula makes it extremely difficult to accurately read cores from increment borers. Elevations ranged from 24 m to 162 m above sea level. Soil types were dominated by Narlon loamy fine sand, Santa Lucia channery clay loam, and Tangair fine sand. Pinus radiata was the dominant tree species in all plots. Understory species included coast live oak (Quercus agrifolia Née), woollyleaf manzanita (Arctostaphylos tomentosa (Pursh) Lindl.), California huckleberry (Vaccinium ovatum Pursh), poison oak (Toxicodendron diversilobum (Torr. and A.Gray) Greene), bush monkey-flower (Mimulus aurantiacus Curtis), California blackberry (Rubus ursinus Cham. and Schltdl.), creeping snowberry (Symphoricarpos mollis Nutt.), and various grass species. GPS coordinates of the plot centers were recorded.

2.2. Demographic Survey

Demographic data were collected from 20 September 2011 to 26 October 2011. Plots were divided into quadrants to facilitate accurate data collection. Within each plot, every P. radiata specimen across all sizes and ages was identified and measured, including first-year seedlings and dead snags. For each tree, trunk diameter was measured to the nearest 0.5 cm using calipers for smaller size classes or diameter tape for larger diameter trees. Diameter at breast height (dbh) was measured whenever possible; diameters for shorter trees were measured at around half of their total height. Total height was measured in meters using a tape measure for shorter trees and an inclinometer for larger saplings and mature trees. Additionally, total number of branch whorls and incidence of pitch canker were recorded for each tree.

2.3. Projection Matrix Assumptions

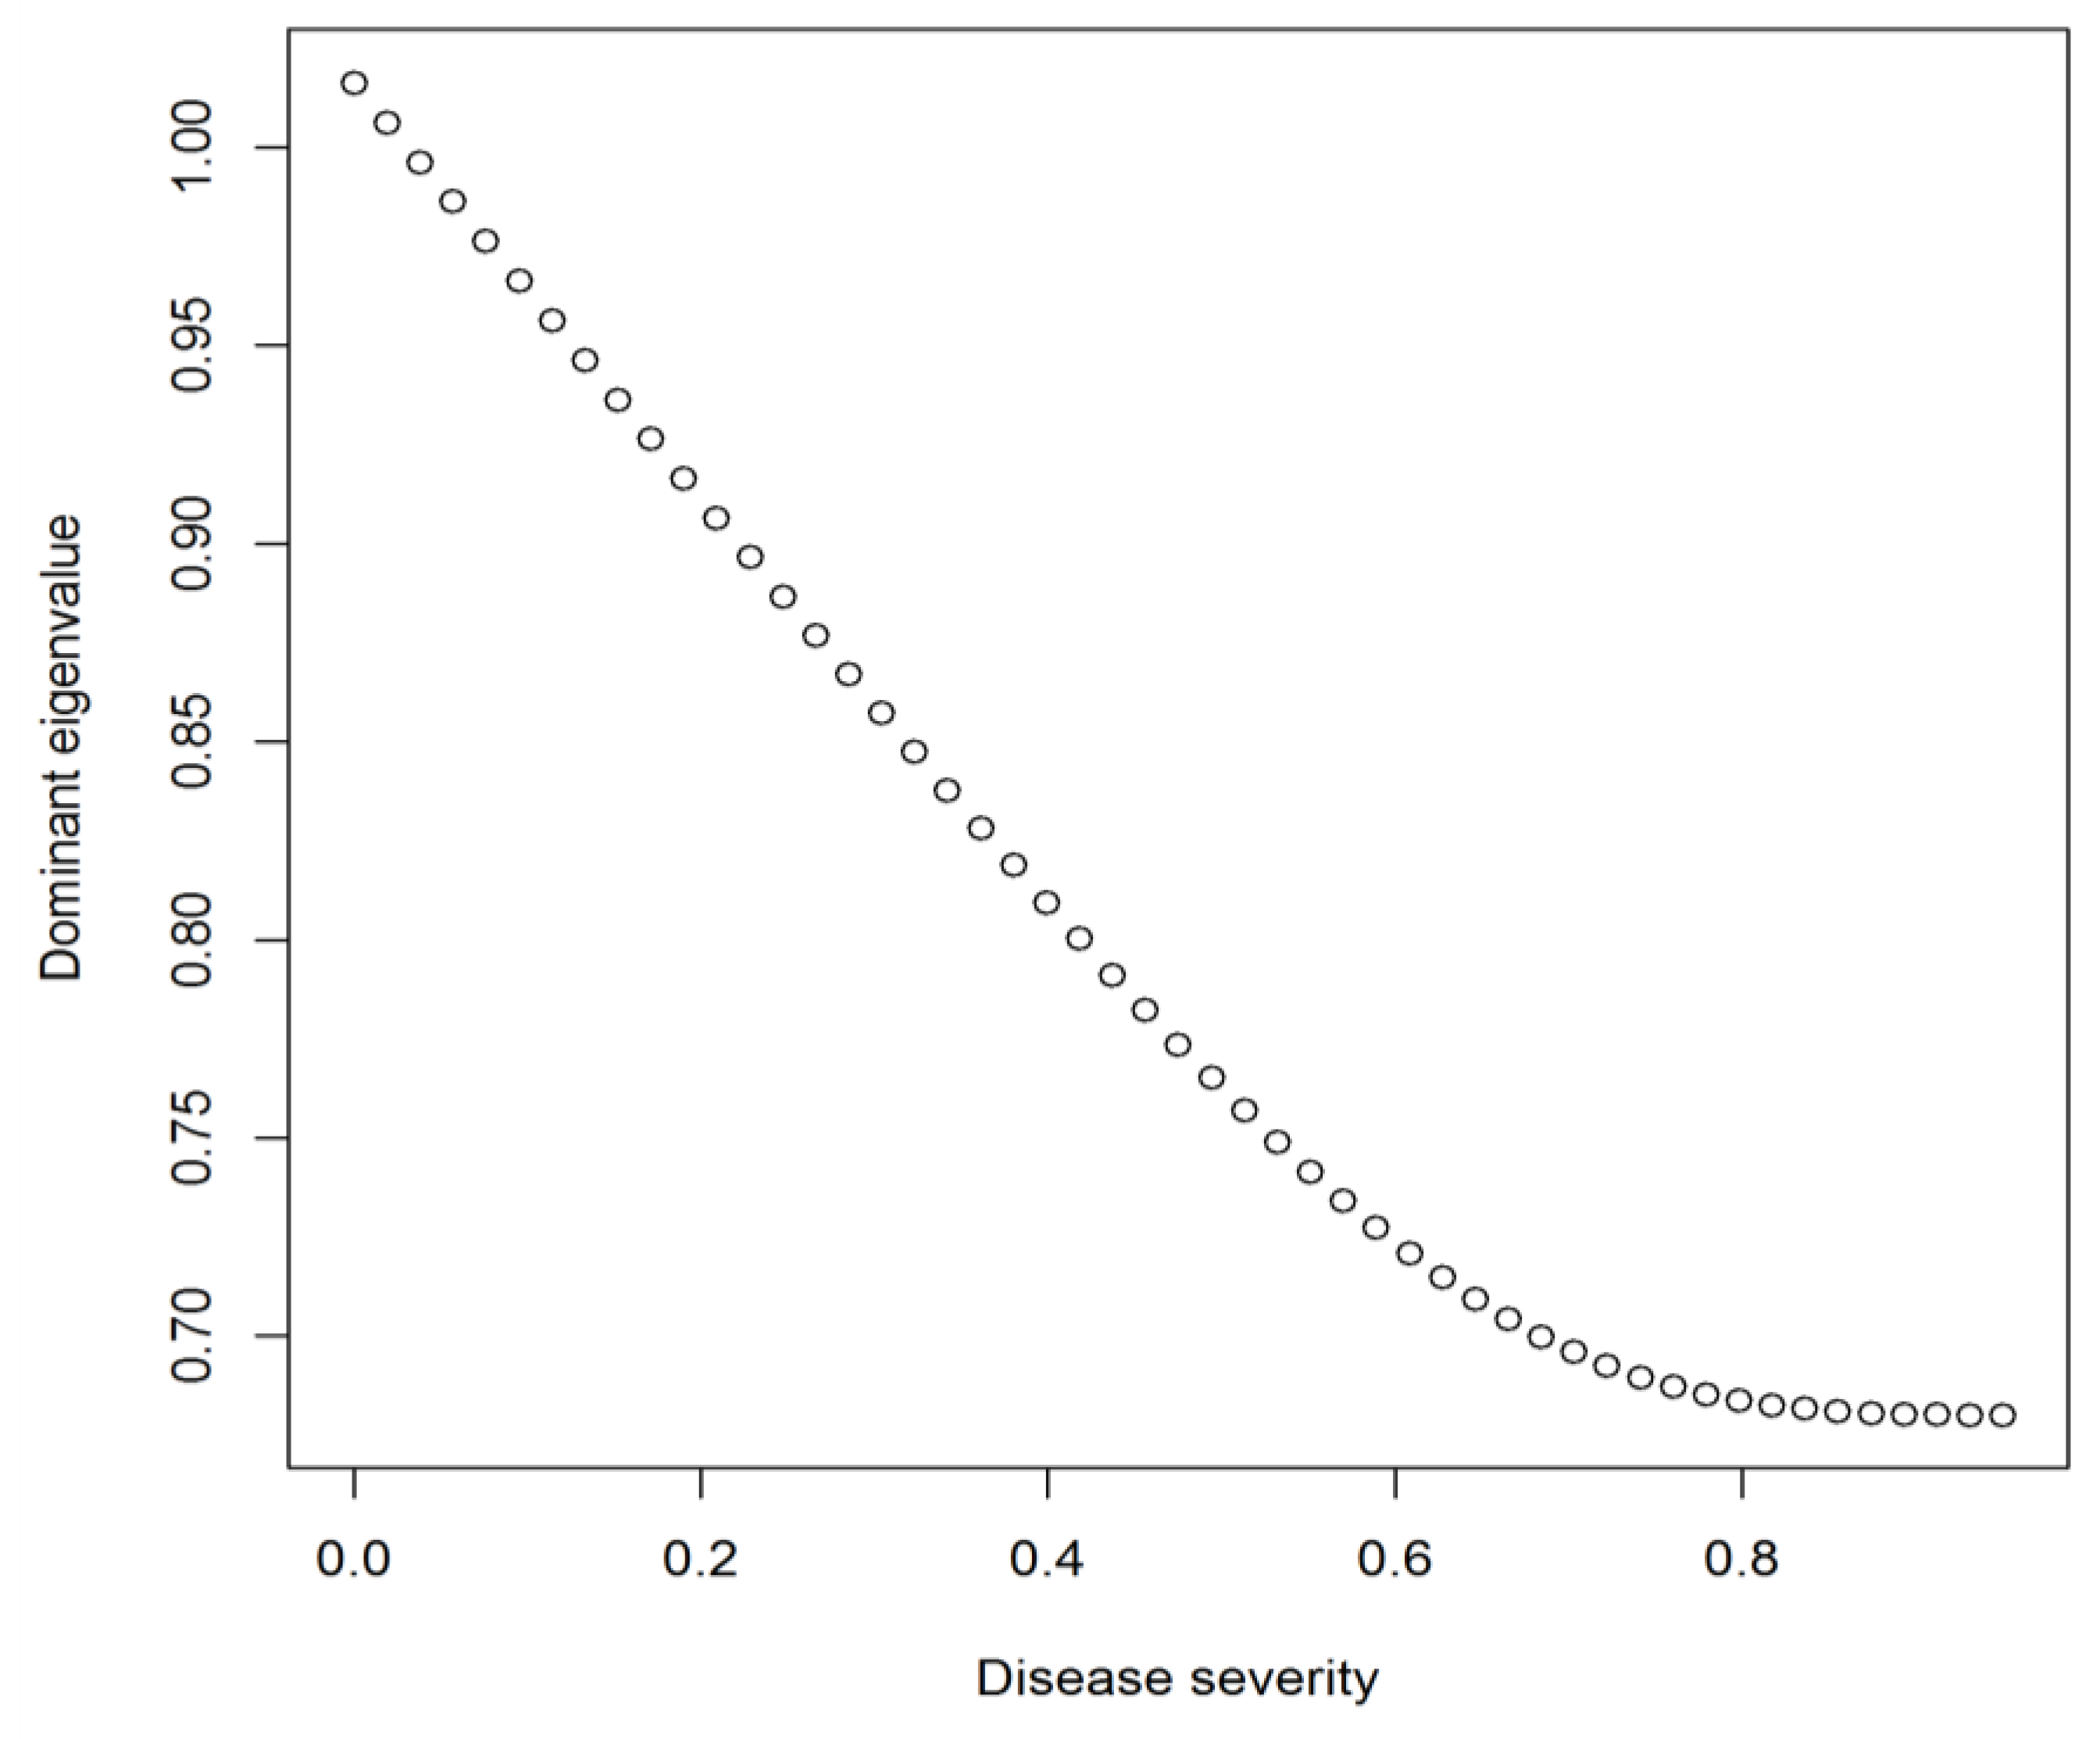
Our model was built under an assumption of density independence, with disease affecting all individuals equally regardless of population size. Dominant eigenvalues are variables that can be calculated from a projection matrix that reflect the overall population growth trend. It was assumed in the model that the Monterey pine population is currently at equilibrium and that the dominant eigenvalue should be equal to one. It was also assumed that the current pitch canker disease state in our plots was at equilibrium.

2.4. Projection Matrix Development

Height and stem diameter for each tree were plotted against each other, and classes were chosen based on how these data clustered together. The collected data were divided into five size classes based primarily on trunk diameter: seedlings; small, medium, and large saplings; and mature trees. These size classes were combined with estimates for cone production and seed release to generate parameters for a projection matrix. Estimates for reproductive parameters were based on our assumption that the Monterey pine population is currently at equilibrium. Using this assumption and parameter values that could be estimated directly from demographic data, we estimated cone and seed production parameters using an iterative search process in which the objective function was to find parameter values that generated a dominant eigenvalue for the projection matrix equal to one. The basic structure of the tree population projection matrix is shown in Table 2. The proportional changes in numbers of individuals present in adjacent size classes were used to calculate transition probabilities. Mature tree survival was calculated based on the maximum lifespan of Monterey pine [6].

2.5. Modeling Pitch Canker

Pitch canker severity was modeled as the proportion, p, of infected susceptible tissue in each time step. We assume that the impact of pitch canker is directly related to its severity, so stage-specific transition probabilities and fecundities are multiplied by (1 − p) to obtain their values taking account of the effect of disease. Note that for all values 0 < p ≤ 1, the effect of disease is to decrease stage-specific survival and fecundity. All reproductively active size classes were affected by pitch canker disease because of proportionally similar branch whorl mortality between these classes regardless of tree size. Transition probabilities for seeds, seedlings, and small and medium saplings were also affected by pitch canker in the matrix because seeds and smaller size classes suffer significant mortality due to the disease. Larger size classes are unlikely to be killed outright by pitch canker and are thus unmodified by disease in the matrix.
We examined 5 different mechanisms for generating the time series, pt, for pitch canker severity over time: (1) no pitch canker, pt = 0; (2) constant pitch canker severity, pt = p; (3) pitch canker severity randomly selected at each time point from a beta distribution, B(α,β), with mean, µp = α/(α + β); (4) oscillating pitch canker severity based on an autoregressive model, pt = a + bpt + cpt-1 + dpt-2; and (5) oscillating pitch canker severity based on a hypothesized feedback mechanism. The feedback mechanism operates by induced resistance in the host with a single time step lag:
p t = p t 1 r × ( 1 p t 1 ) S A R t 1 × p t 1
S A R t = S A R r e d × S A R t 1 + E x p r m a x × p t 1 p 0.5 + p t 1
where disease severity in the current time step, pt, is defined as a function of the level of disease in the previous time step, pt−1; the associated SAR level, SARt−1; and the intrinsic rate of increase in disease severity, r. Similarly, the SAR response in the current time step, SARt, is defined as a function of the disease severity in the previous time step, pt−1, the associated SAR level, SARt−1; the rate of resistance reduction in the absence of new infections, SARred; a theoretical maximum level of SAR expression, Exprmax; and the level of disease required for SAR induction at half of the theoretical maximum, p0.5. At present only partial information is available to estimate the various parameters in this feedback model, so we proceed heuristically based on our knowledge of the pathosystem with the aim of establishing a biologically plausible baseline model with potential for future improvement, as suggested by Turchin [21].
The first three pitch canker simulations represent null hypotheses, with assumptions of disease either being eliminated entirely, remaining constant indefinitely, or severity fluctuating randomly over time. The oscillation models represent our hypothesis about the influences of SAR on the dynamics of disease and tree population demography in the system. Parameters were assigned for the oscillating models heuristically based on our knowledge of the disease system. In the autoregressive model, “a” was set equal to 0.03; “b”, “c”, and “d” were set at −0.0005, 0.00025, and −0.0001, respectively, plus a stochastic element derived from a normal distribution with mean 0 and standard deviation 0.1. In the feedback model, p0.5 was set equal to 0.1, Exprmax was set equal to 0.5, r was set equal to 0.8 plus a stochastic element derived from a normal distribution with mean 0 and standard deviation 0.1, and SARred was set equal to 0.9.

2.6. Numerical Simulation

The model was written and simulated as a discrete time, first-order Markov process using the R statistical programming language [
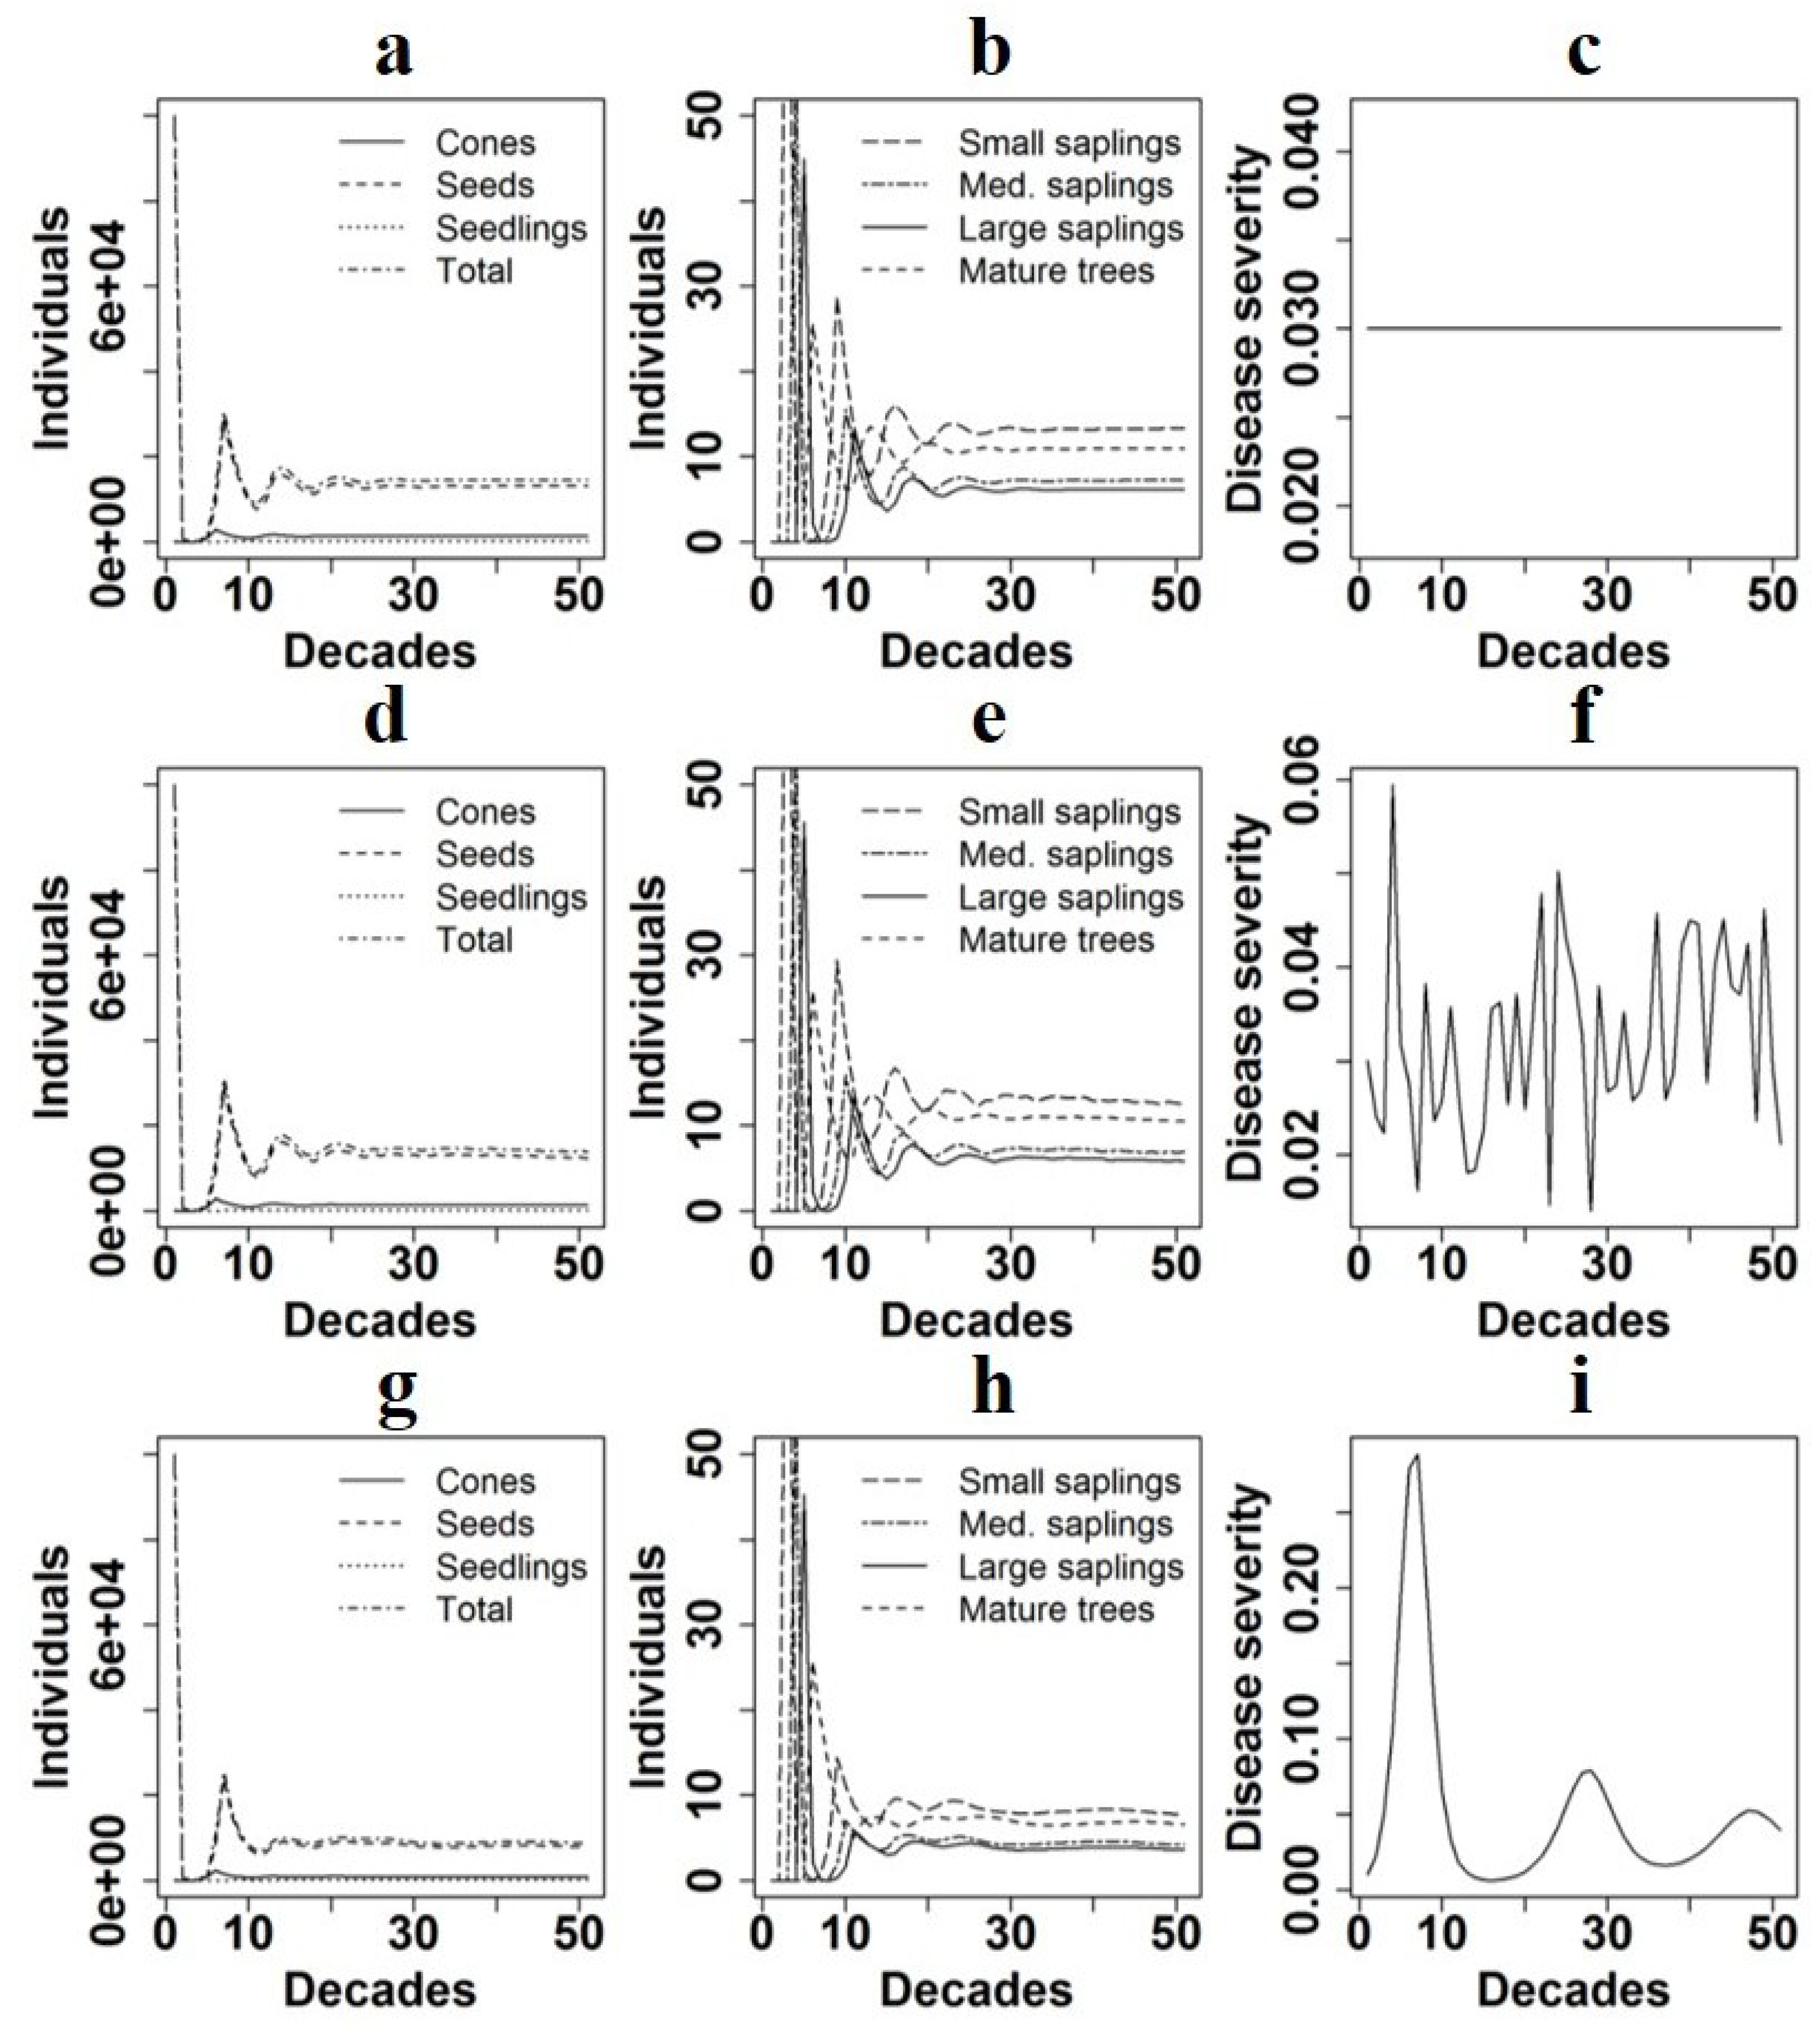
22]. The model uses a time step corresponding to one decade and starting population vectors representing (1) the stable stage distribution, (2) a new plantation, and (3) a stand clearing fire. The stable stage distribution was calculated from the initial matrix and includes populations of all size classes; the new plantation was represented by seedlings alone, and the stand clearing fire was represented by seeds alone.
Simulations were conducted to project each of the three starting population vectors over time in the presence of each of the five pitch canker model types. For each combination of starting population vector and pitch canker model type, the model was run for 50 time steps (decades). At each time point, populations for all size classes and the total population were recorded along with disease severity. Dominant eigenvalues, stable stage distributions, and reproductive values were calculated and stored at each time point. These values were also calculated for the full range of theoretically possible disease levels (0:1 in intervals of 0.02) to determine how these demographic variables vary with disease severity. The simulation was run 100 times for disease models with stochastic elements (specifically, the oscillating auto-regressive and SAR feedback models and the randomly fluctuating model with disease severity drawn from a beta distribution). Model runs were stored as separate files and combined for analysis after completion of each set of 100 runs. An elasticity analysis [17] was calculated for the projection matrix in the absence of disease, but not under the other disease scenarios.

3. Results

3.1. Demographic Survey

A summary of the collected demographic data is shown in Table 3. Trees were divided into five size classes based primarily on stem diameter, representing seedlings; small, medium, and large saplings; and mature trees. Numbers of trees per plot ranged from 54 in Indian Village East to 220 in Don Lane South (Table 1). Proportions of trees of each size class to the overall population at each site varied between sites; for example, large saplings and mature trees accounted for 24% of trees in Indian Village East, compared to only 2.7% in Don Lane South. Numbers per each size class across all plots ranged from 30 mature trees to 694 seedlings. Average diameter for each class ranged from 0.5 cm for seedlings to 34.58 cm for mature trees. Average heights ranged from 0.18 m for seedlings to 17.96 m for mature trees. Pitch canker incidence across all plots was 1.44% for seedlings, 2.8% for small saplings, 6.8% for medium saplings, 8% for large saplings, and 3.3% for mature trees.

3.2. Projection Matrix Model

The completed matrix projection model is shown in Table 4. Mature trees, as well as medium and large saplings, are assumed to have the potential to remain in their size class for more than one time step. Individuals from all other size classes either transition to the next stage in a given time step or die. The probability for mature trees to survive to the next time step was defined as 0.68, allowing for a small percentage of individuals to survive through 15 total time steps (0.6810 = 0.02), corresponding to the maximum P. radiata lifespan of 150 years [6]. Probabilities for medium and large saplings to remain in their size class through the next time step were estimated as 0.017 and 0.03 respectively, the small probabilities effectively ensuring these classes will either transition to the next size or die within two time steps.

3.3. Pitch Canker Models

Disease in the constant model was set equal to 0.03; this reflects the current average disease state observed in our plots across all size classes and was also used as an average value over time to heuristically develop parameters for the other disease models. Under the parameters for a, b, and c utilized, the autoregressive model oscillated between 0.01 and 0.05 from time step to time step. The feedback mechanism-based oscillation model resulted in a spike in disease severity early in the simulation before settling into oscillations around the 0.03 average. A subsample of the disease models is shown in Figure 1C.

3.4. Simulation Results

Sample projections for three parameter value combinations are shown in Figure 1. Summary statistics for all parameter value combinations are shown in Table 5. In general, the dominant eigenvalue, which corresponds to the population growth rate, was unaffected by the initial population vector and lower in models that had higher disease on average. Final population sizes depended on both the initial population vector and the disease model. The stable stage distribution starting population vector always resulted in the largest final populations, while the new plantation starting population vector always resulted in final populations greater than that observed for the stand clearing fire starting population vector. Simulations using the new plantation as a starting population vector reached the stable stage distribution at the 25th decade, while simulations using a stand clearing fire for a starting population vector reached the stable stage distribution at the 26th decade.
The time taken for initial transient dynamics to damp out was also influenced by both the initial population vector and the disease model. Stabilization occurred earliest in the models utilizing the stable stage distribution as a starting population vector, occurring in 20–27 generations, depending on the disease model used (data not shown). The generation where stabilization occurred was later in models with constant disease than in models with no disease present. Models using the stand clearing fire starting population vector stabilized earlier (25–31 generations) than models using the new plantation starting population vector (30–39 generations). No stabilization occurred with the oscillating models or beta distribution model.
The dominant eigenvalue, or population growth rate, was around 1 when disease severity was 0.03, the assumed equilibrium state for the forest. The relationship between disease severity and dominant eigenvalue is shown in Figure 2. The dominant eigenvalue is 1.016 if disease is removed from the simulation entirely (represented by the “no disease” simulation) and declines to a plateau at 0.68 at high disease levels (>0.8 disease severity). The stable stage distribution for the projection matrix when no disease is present is 9.1% for cones, 90.0% for seeds, 0.6% for seedlings, 0.09% for small saplings, 0.05% for medium saplings, 0.04% for large saplings, and 0.074% for mature trees. The stable stage distribution was always dominated by seeds, regardless of disease severity, but proportions of the other classes varied slightly with disease. Differences from the equilibrium disease level were greatest at high disease severity (i.e., above 0.8), at which point the stable stage distribution was 6.4% for cones, 93.1% for seeds, 0.2% for seedlings, 0.009% for small saplings, 0.001% for medium saplings, 0.002% for large saplings, and 0.285% for mature trees.
Reproductive values were scaled so that the lowest value, always associated with seeds, was equal to 1. Reproductive values when no disease was present were 10 for cones, 1 for seeds, 145 for seedlings, 958 for small saplings, 1749 for medium saplings, 1917 for large saplings, and 2194 for mature trees. Reproductive values increased dramatically with increasing disease severity for seedlings and larger size classes; large saplings and mature trees become more separated from the other size classes as disease severity increases (Figure 3).
Elasticity analysis for the projection matrix is shown in Table 6. This analysis multiplies a sensitivity matrix for the model by the projection matrix itself so that impossible transitions (i.e., mature trees transitioning to small saplings) are equal to zero. The highest value was associated with survival of mature trees (0.1558); seed release and seedling and small sapling transition probabilities were equally important with values of 0.129, while medium sapling transition probability was slightly below this value at 0.128. The fecundity associated with mature trees was the most important reproductive parameter, but fecundities for all classes were less important than the transition probabilities.

4. Discussion

Population projections depended primarily on the average level of disease over the duration of the simulation. At average disease levels near the baseline severity we observed in the field plots, populations tended to remain relatively constant over time (Figure 1). Significant increases in populations were projected when disease is dropped entirely out of the simulation (Table 5). However, because of other disease problems that may affect the population in similar ways (i.e., Diplodia canker or gall rust), we expect that complete elimination of the impact of disease from the system is not possible [23]. Infection attempts by these other pathogens, as well as by fungal endophytes, may also influence the induction of SAR in Monterey pine. These factors constitute the background against which we are examining the effects of pitch canker. Population decline was suggested by the model even with slight increases in disease severity (Figure 2). Although this sensitivity to changes in disease severity is likely an artifact of our assumptions about baseline disease levels in the model, the impact of changes in disease severity on the rates of population and structural change are nonetheless important to any discussion of disease. The changing climate may lead to increased moisture stress for the trees, and severe outbreaks of pitch canker have been associated with droughts in the past [24]. Pitch canker is itself affected by climate, but the California central coast is projected to remain a suitable habitat under climate change projections [25]. Thus, climate change may influence how pitch canker affects the structure of the Monterey pine forest.
Starting population vectors influenced both final population sizes and generation of stabilization in Monterey pine population dynamics. When the model was run using the stable stage distribution as a starting vector, populations understandably reached a constant state more rapidly because classes were already ordered in a stable state. Stabilization occurred more slowly for models run with new plantation or stand clearing fire starting population vectors, likely because no reproduction occurred for the first two to three generations in these models. When disease is incorporated, our model uses the assumption that disease is present from the start of population projections; however, in the case of stand clearing fires and new plantations established in disease-free soil, pitch canker may not necessarily begin infecting in the first time step. Final population sizes were also lower in models utilizing the stand clearing fire and new plantation starting population vectors, again likely because reproductively active size classes were not present for the first several time steps.
One assumption built into the model not previously discussed is that disease has only negative effects on Monterey pine fitness. Experimental work on the costs associated with SAR in P. radiata indicated that there can actually be a growth benefit to low levels of disease and resistance induction [26]. It is currently unknown if this fitness benefit translates to increased reproduction, but it is certainly possible, and this could help offset the reproductive cost that was built into our model. Long term measurement of cone production rates in infected trees and uninfected trees could help to shed light on this topic and improve the predictive value of our model.
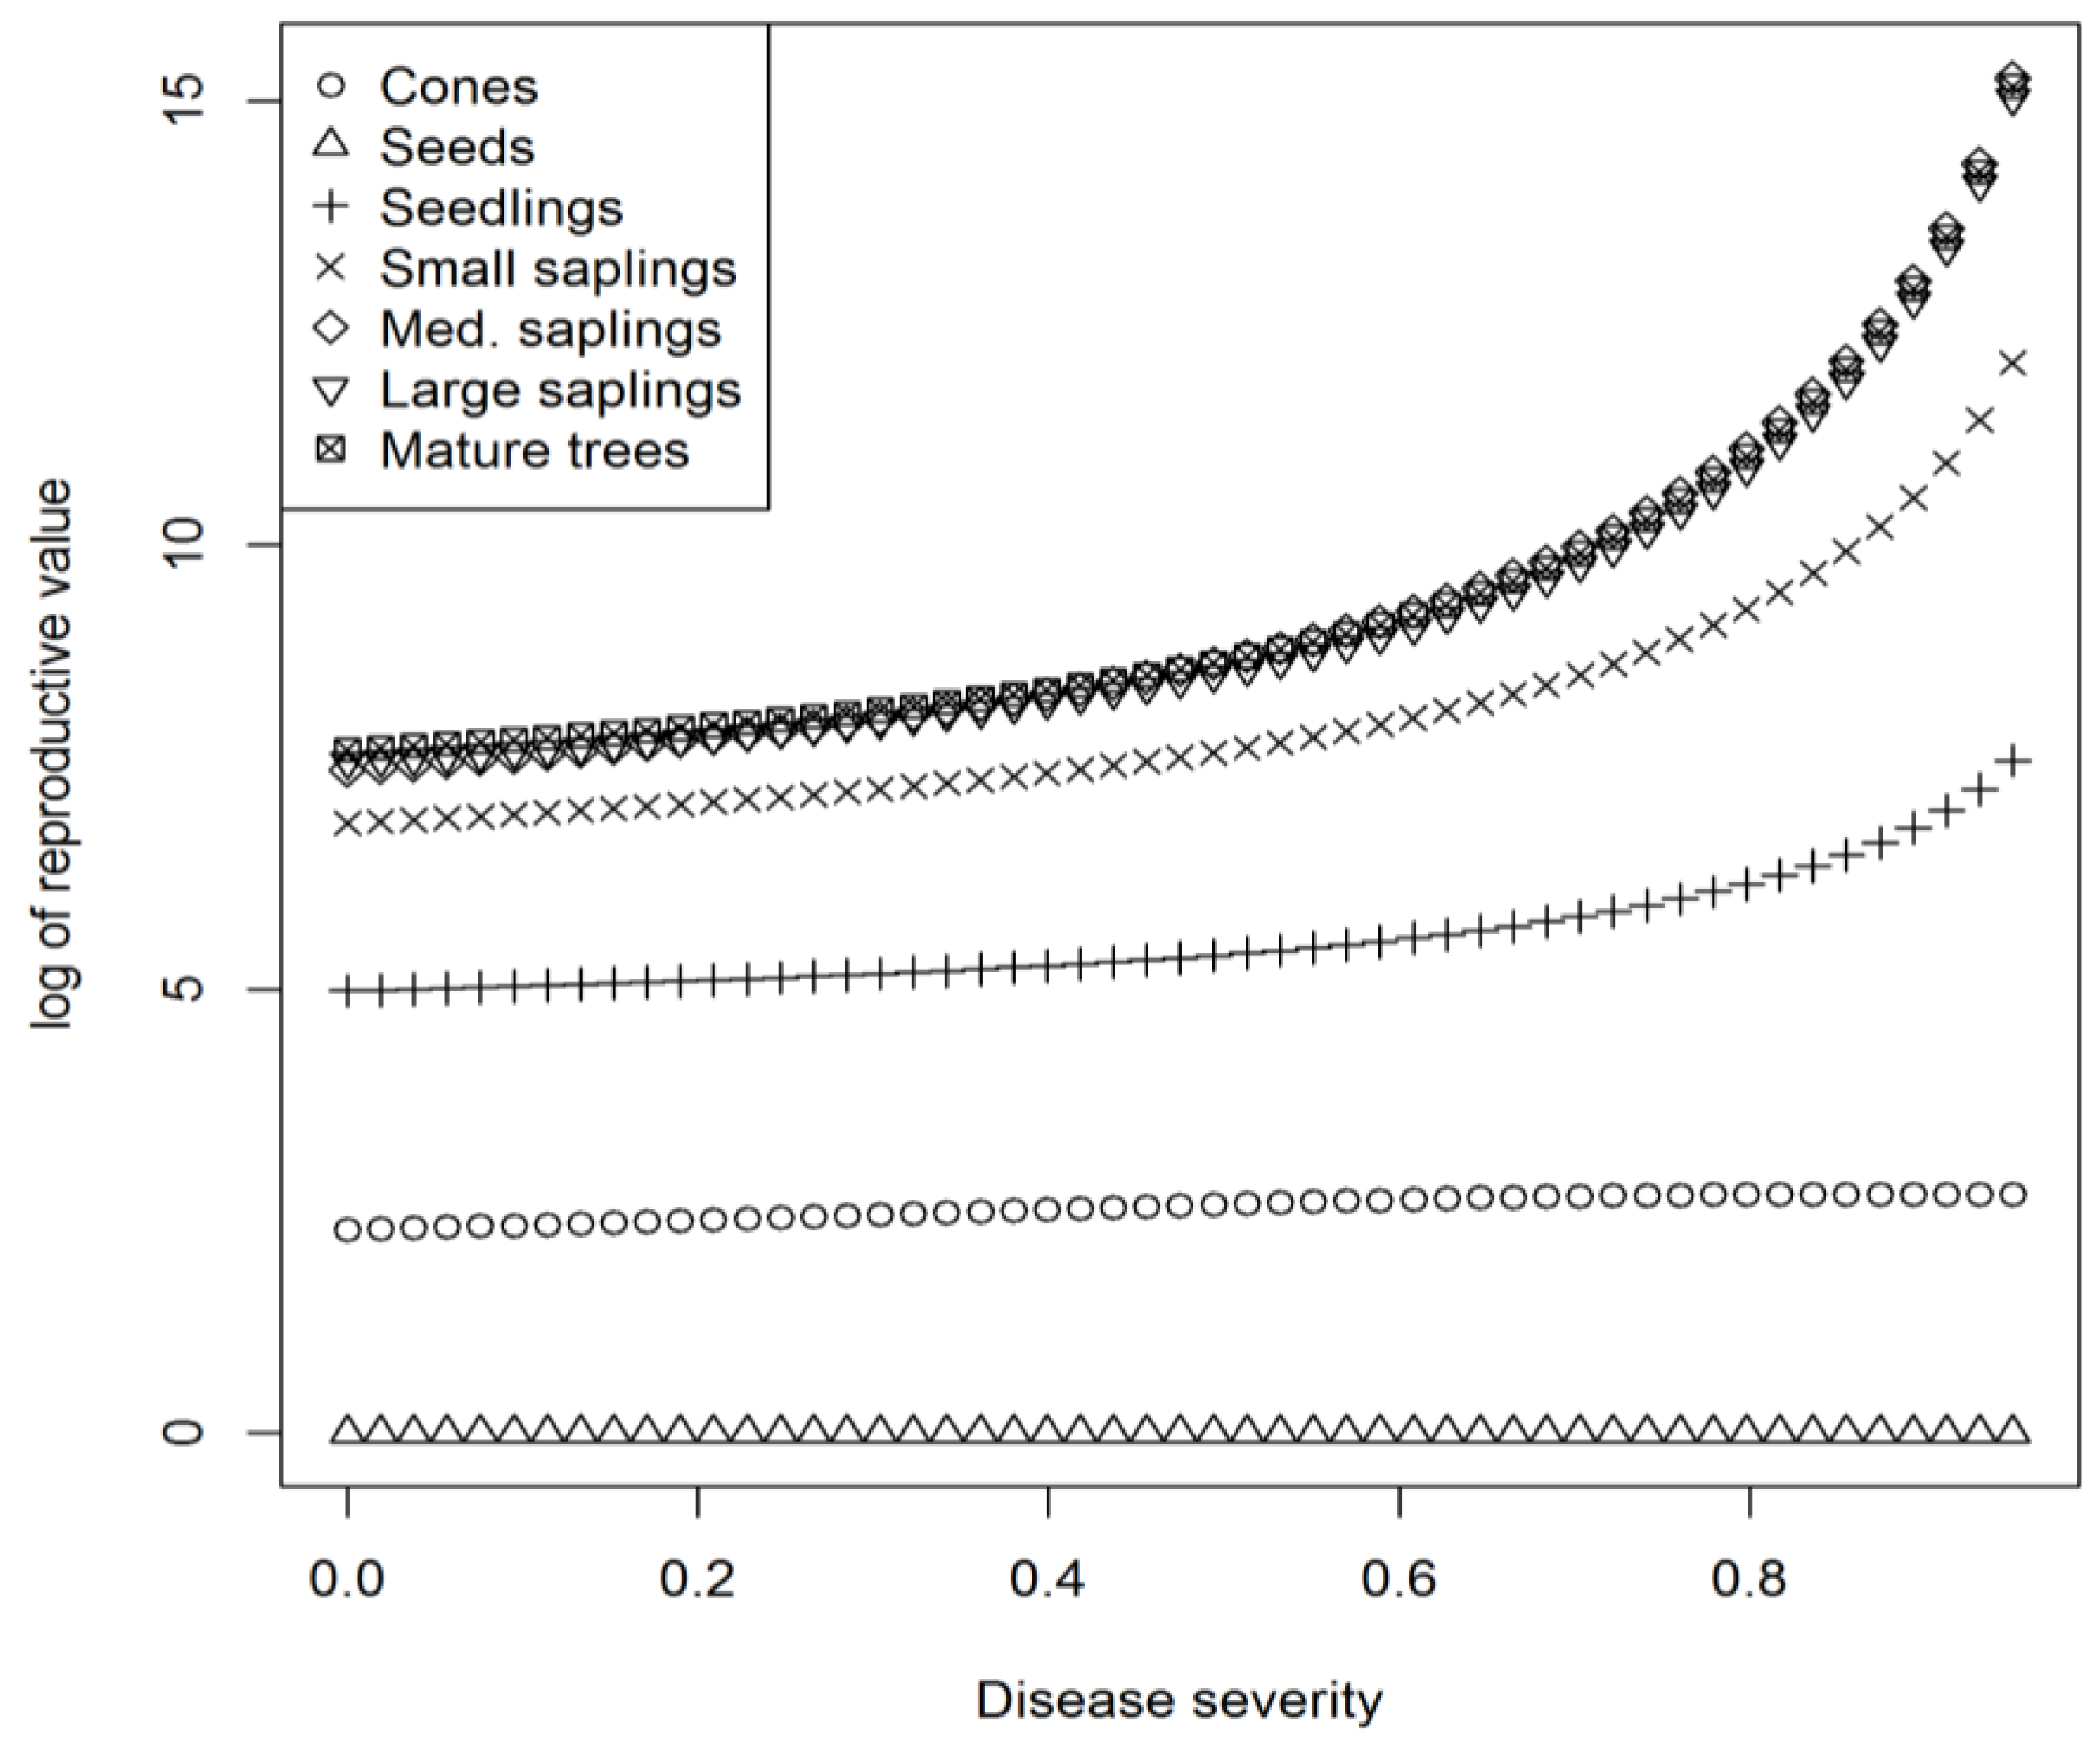
Reproductive values were highest for medium and large saplings and mature trees at all levels of disease severity, and these classes become increasingly important compared with the smaller classes as disease severity increases (Figure 3). This is because mortality increases with disease severity in the smaller size classes, leading to the reproductively active size classes contributing more proportionally to the overall population over time. A notable result is that as disease severity increases the proportion of the population present as seeds increases. This occurs because large individuals are not killed and continue to reproduce, adding to the seed bank while smaller size classes arising from seeds that do germinate are killed. If we kept projecting further into the future and maintained a high disease pressure eventually only seeds would remain. This emphasizes the ecological role seeds can play in disease escape, but also suggests a conservation activity of merit during periods of relatively high disease pressure. At such times, seed collection and preservation actions would be of value in helping to overcome the extra mortality induced in smaller tree class sizes and the decline in fecundity in larger trees. It may also be possible to raise trees from collected seed in isolation from the disease and plant them back into gaps once they were large enough to not be killed by the disease, though this method would be expensive. We know from the difference in estimated seed production and seedling numbers that attrition rates in the seed population are high. Helping to reduce those rates when the seed population represents a large fraction of the total population would be potentially valuable.
Starting population vectors were designed to reflect three possible situations: stable stage distribution (i.e., current state of the forest), stand clearing fire, and new plantation. Long-term validation of the model could be achieved by tracking demographics in the stands where data were acquired to represent the stable stage distribution vector. While stand clearing fires are currently rare due to fire suppression, they can nonetheless occasionally occur. The Huckleberry Hill fire in 1987 cleared a large portion of forest that is currently in early stages of recovery. Continued monitoring of this regenerating stand would be useful for validating the model under the assumptions embodied in the stand clearing fire vector. Alternatively, a controlled burn could be carried out in a portion of native forest to allow for tracking populations from time step 0. Finally, an experimental, off-site (to avoid any potential soil seedbank) plantation could be established to track demographics in a new plantation. Pinus radiata growth in plantations has been previously modeled, though this work assumed human management would be taking place while ours projects populations under the assumption that management is not occurring [27,28].
While we would expect the model to be similar for other native populations of Monterey pine, it is possible that different dynamics may be occurring in Año Nuevo, Cambria, or the Mexican island populations, and management recommendations for these sites may differ from those on the Monterey Peninsula [29]. To extend and improve our results, similar demographic data could be collected from these populations to determine if the model remains valid or would need to be modified.
Elasticity analysis of the projection matrix in the absence of disease showed that survival of mature trees from one time step to the next was the most important component of the life history (Table 6); this indicates that facilitating survival of these specimens over time is the most important factor in maintaining the native P. radiata population in its current state. However, seed release and transition probabilities for seeds, seedlings, and small saplings were nearly equally important (Sensitivity = 0.13 for these stages, 0.16 for mature tree survival). This indicates that to truly maintain the forest as a healthy ecosystem, all size classes are important. Thus, the current structure of the forest should be maintained, and future land development should leave trees of all size classes rather than mature trees alone as is typically done if a natural forest structure is desired. Particularly in situations where all size classes are not present, as with the stand clearing fire and new plantation starting population vectors, management steps may be taken to help maintain and even improve forest structure. Thinning treatments and fertilization may allow for speeding up the progression of the forest structure and potentially even allow seedlings to jump size classes with more rapid growth. Care should be taken in applying fertilizer, however, as high nitrogen fertilization levels have been associated with increased pitch canker severity [30].
Because of the observed reduction in pitch canker disease severity over time in native forest [13] and the idea that regeneration of naïve pines will eventually allow the epidemic to increase in severity again, we hypothesized that the effects of SAR will lead to oscillations in disease severity over time. However, because of the time scale of the model and the fact that pitch canker has only been known to occur in California for about thirty years (three time steps in our model), whether the disease will actually behave in this manner is unknown. Because the long-term dynamics of pitch canker in this system are largely unknown, we used the models as scenario analyses that reflect various competing hypotheses for the potential long term dynamics and potential impact of disease. Pitch canker incidence in the SE US has been shown to occur sporadically followed by periods of disease recovery [24]. In general, the various disease models tested resulted in similar population dynamics if long-term average disease levels were similar (Table 5). Because of the long time scale, periods of higher disease severity in the autoregressive oscillating model were offset by periods of low disease intensity. The SAR feedback model did result in smaller final populations, but this was most likely because of an associated period of high disease pressure early in the life history of the model that drastically reduced early population sizes in this scenario compared with the other disease models. Oscillating disease models also led to more variation in population sizes even after the “stabilizing” generation had been reached, though this tended to be minor once the stable stage distribution occurred. Long term study of disease dynamics on the Monterey Peninsula should be continued into the future to better develop data for validating our model.

5. Conclusions

Elasticity analysis indicated that survival of mature trees was the most important factor in our Monterey pine population matrix projection model. Survival of smaller size classes was almost equally important, however, emphasizing the need to maintain a diversity of age and size classes in Monterey pine stands to promote healthy populations in the future.

Author Contributions

Conceptualization, G.J.R., T.R.G., and N.M.; methodology, G.J.R., T.R.G., and N.M.; software, G.J.R. and N.M.; validation, G.J.R., T.R.G., and N.M.; formal analysis, G.J.R., T.R.G., and N.M.; investigation, G.J.R., T.R.G., and N.M.; resources, T.R.G. and N.M.; data curation, G.J.R., T.R.G., and N.M.; writing—original draft preparation, G.J.R., T.R.G., and N.M.; writing—review and editing, G.J.R., T.R.G., and N.M.; visualization, G.J.R., T.R.G., and N.M.; supervision, T.R.G. and N.M.; project administration, T.R.G. and N.M.; funding acquisition, T.R.G. and N.M.

Funding

This research was funded by the U.S. Forest Service, grant number 12-DG-11052021-235.

Acknowledgments

We would like to acknowledge the U.S. Forest Service, Pebble Beach Company, and University of California—Davis, College of Agricultural and Environmental Sciences for funding and other support of this research. We also thank Steven Heisey and Christina Islas for assisting with data collection and Carole Hom for assistance with development of the matrix model.

Conflicts of Interest

The authors declare no conflict of interest.

References

  1. Jones and Stokes Associates. Final. Monterey Pine Forest Ecological Assessment: Historical Distribution, Ecology, and Current Status of Monterey Pine. Available online: http://www.co.monterey.ca.us/planning/major/Pebble%20Beach%20Company/Pebble_Beach_DEIR_Nov_2011/Pebble_Beach_DEIR_Admin_Records_Nov_2011/Jones_Stokes/JS_1994_MPF_Eco_Assess.pdf (accessed on 17 August 2018).
  2. Rogers, D.L.; Vargas Hernández, J.J.; Matheson, A.C.; Guerra Santos, J.J. The Mexican Island Populations of Pinus radiata: An International Expedition and Ongoing Collaboration for Genetic Conservation. Available online: http://www.fao.org/docrep/005/y4341e/y4341e07.htm#P947_91075/ (accessed on 17 August 2018).
  3. Rogers, D.L. In situ genetic conservation of a naturally restricted and commercially widespread species, Pinus radiata. For. Ecol. Manag. 2004, 197, 311–322. [Google Scholar] [CrossRef]
  4. Stuart, J.D.; Sawyyer, J.O. Trees and Shrubs of California; University of California Press: Berkeley, CA, USA, 2001; pp. 89–90. ISBN 0520221109. [Google Scholar]
  5. Vogl, R.J.; Armstrong, W.P.; White, K.L.; Cole, K.L. The closed-cone pines and cypresses. In Terrestrial Vegetation of California, 3rd ed.; Barbour, M.G., Major, J., Eds.; John Wiley: New York, NY, USA, 1977; pp. 295–358. ISBN 0520249550. [Google Scholar]
  6. Sudworth, G.B. Forest Trees of the Pacific Slope; USDA Forest Service: Washington, DC, USA, 1908; pp. 1–455. ISBN 0486217523.
  7. Gordon, T.R.; Storer, A.J.; Wood, D.L. The pitch canker epidemic in California. Plant Dis. 2001, 85, 1128–1139. [Google Scholar] [CrossRef] [PubMed]
  8. Hepting, G.H.; Roth, E.R. Pitch canker, a new disease of some southern pines. J. For. 1946, 44, 724–744. [Google Scholar]
  9. McCain, A.H.; Koehler, C.S.; Tjosvold, S.A. Pitch canker threatens California pines. Calif. Agric. 1987, 41, 22–23. [Google Scholar]
  10. Walters, D.; Walsh, D.; Newton, A.; Lyon, G. Induced resistance for plant disease control: maximizing the efficacy of resistance elicitors. Phytopathology 2005, 95, 1368–1373. [Google Scholar] [CrossRef] [PubMed]
  11. Bonello, P.; Gordon, T.R.; Storer, A.J. Systemic induced resistance in Monterey pine. For. Pathol. 2001, 31, 99–106. [Google Scholar] [CrossRef]
  12. Storer, A.J.; Wood, D.L.; Gordon, T.R. The epidemiology of pitch canker in California. For. Sci. 2002, 48, 694–700. [Google Scholar]
  13. Gordon, T.R.; Kirkpatrick, S.C.; Aegerter, B.J.; Fisher, A.J.; Storer, A.J.; Wood, D.L. Evidence for the occurrence of induced resistance to pitch canker, caused by Gibberella circinata (anamorph Fusarium circinatum), in populations of Pinus radiata. For. Pathol. 2011, 41, 227–232. [Google Scholar] [CrossRef]
  14. Leigh, E.G. The ecological role of Volterra’s equations. In Some Mathematical Problems in Biology; Gerstenhaber, M., Ed.; American Mathematical Society: Providence, RI, USA, 1968; pp. 1–61. ISBN 0821811517. [Google Scholar]
  15. Leslie, P.H. On the use of matrices in certain population mathematics. Biometrika 1945, 33, 183–212. [Google Scholar] [CrossRef] [PubMed]
  16. Lefkovitch, L.P. The study of population growth in organisms grouped by stages. Biometrics 1965, 21, 1–8. [Google Scholar] [CrossRef]
  17. Caswell, H. Matrix Population Models: Construction, Analysis, and Interpretation, 2nd ed.; Woods Hole Oceanographic Institution: Woods Hole, MA, USA, 2006; pp. 1–722. ISBN 087893121X. [Google Scholar]
  18. Van Mantgem, P.J.; Stephenson, N.T. The accuracy of matrix population model projections for coniferous trees in the Sierra Nevada, California. J. Ecol. 2005, 93, 737–747. [Google Scholar] [CrossRef] [Green Version]
  19. López, I.; Ortuño, S.F.; Martín, A.J.; Fullana, C. Estimating the sustainable harvesting and the stable diameter distribution of European beech with projection matrix models. Ann. For. Sci. 2007, 64, 593–599. [Google Scholar] [CrossRef]
  20. Reynolds, G.R.; McRoberts, N.; Gordon, T.R. Projecting Monterey pine populations over time in the presence of pitch canker disease. (Abstr.). Phytopathology 2012, 102, S4–99. [Google Scholar]
  21. Turchin, P. Complex Population Dynamics: A Theoretical/Empirical Synthesis; Princeton University Press: Princeton, NJ, USA, 2003; pp. 1–472. ISBN 0691090211. [Google Scholar]
  22. R Core Team. R: A Language and Environment for Statistical Computing; R Foundation for Statistical Computing: Vienna, Austria, 2013. [Google Scholar]
  23. Offord, H.R. Diseases of Monterey Pine in Native Stands of California and in Plantations of Western North America; Pacific SW Forest & Range Experiment Station: Berkeley, CA, USA, 1964; pp. 1–37. [Google Scholar]
  24. Dwinell, L.D.; Barrows-Broaddus, J.B.; Kuhlman, E.G. Pitch canker: A disease complex of southern pines. Plant Dis. 1985, 69, 270–276. [Google Scholar] [CrossRef]
  25. Watt, M.S.; Ganley, R.J.; Kriticos, D.J.; Manning, L.K. Dothistroma needle blight and pitch canker: the current and future potential distribution of two important diseases of Pinus species. Can. J. Forest Res. 2011, 41, 412–424. [Google Scholar] [CrossRef]
  26. Reynolds, G.J.; Gordon, T.R.; McRoberts, N. Quantifying the impacts of systemic acquired resistance to pitch canker on Monterey pine growth rate and hyperspectral reflectance. Forests 2016, 7, 20. [Google Scholar] [CrossRef]
  27. Garcia, O. New class of growth models for even-aged stands: Pinus radiata in Golden Downs Forest. N. Z. J. For. Sci. 1984, 14, 65–88. [Google Scholar]
  28. Goulding, C.J. Development of growth models for Pinus radiata in New Zealand – experience with management and process models. For. Ecol. Manag. 1994, 69, 331–343. [Google Scholar] [CrossRef]
  29. Ferchaw, V.A.L.; Goldsworthy, E.; Pinkerton, J.; Yun, D.I.; Lund, U.J.; Mark, W.; Valkonen, S.; Piirto, D.D. Management strategies for pitch canker infected Ano Nuevo stands of Monterey pine. For. Ecol. Manag. 2013, 308, 101–115. [Google Scholar] [CrossRef]
  30. Fisher, R.F.; Garbett, W.S.; Underhill, E.M. Effects of fertilization on healthy and pitch canker-infected pines. South. J. Appl. For. 1981, 5, 77–79. [Google Scholar]
Figure 1. Example demographic projections for Monterey pine in the presence of pitch canker disease using a matrix population model. The initial population vector was representative of a stand clearing fire and consisted of seeds alone. Graphs show populations for smaller size classes and total population over time (a,d,g), populations of the larger size classes over time at a smaller scale to show more detail (b,e,h), and level of pitch canker severity over time as a proportion of infected susceptible tissue (c,f,i). Disease was modeled in these example projections either as constant (a,b,c), fluctuating over time according to a predefined beta distribution (d,e,f), or oscillating over time according to a feedback mechanism due to systemic acquired resistance (g,h,i).
Forests 10 00437 g001
Figure 2. Dominant eigenvalues from a demographic matrix projection model of Monterey pine populations plotted against hypothetical disease severity levels for pitch canker where disease severity is defined as the proportion of infected susceptible tissue.
Forests 10 00437 g002
Figure 3. Reproductive values for each size class from a demographic matrix projection model of Monterey pine populations plotted against hypothetical disease severity levels for pitch canker where disease severity is defined as the proportion of infected susceptible tissue.
Forests 10 00437 g003
Table 1. Summary of site names, locations, soil types and numbers of Pinus radiata individuals (n) for seven sites in a native P. radiata forest where demographic data were obtained.
Site NameGPS CoordinatesSoil Typen
Don Lane N.N36.570° W121.928°Narlon loamy fine sand182
Don Lane S.N36.569° W121.928°Narlon loamy fine sand220
Indian Village E.N36.588° W121.923°Tangair fine sand54
Indian Village W.N36.588° W121.925°Tangair fine sand175
Lower Fire Rd. 21N36.576° W121.920°Santa Lucia channery clay loam133
Upper Fire Rd. 21N36.577° W121.920°Santa Lucia channery clay loam119
SpyglassN36.580° W121.958°Narlon loamy fine sand57
Table 2. Matrix projection model for Pinus radiata with seven classes: cones (C); seeds (S); seedlings (1); small (2), medium (3), and large saplings (4); and mature trees (5). Pitch canker disease (p) is represented as a proportion of infected susceptible tissue and affects mortality in smaller size classes and fecundities by killing branch whorls; it may be constant over time or oscillate according to different disease models. Values for transition probabilities between size classes (Pi,j) and fecundities (fj) were derived from data acquired from a native P. radiata forest on the Monterey Peninsula in California.
CS12345
C000f2 × (1 − p)f3 × (1 − p)f4 × (1 − p)f5 × (1 − p)
SR000000
10P1,S × (1 − p)00000
200P2,1 × (1 − p)0000
3000P3,2 × (1 − p)P3,300
40000P4,3 × (1 − p)P4,40
500000P5,4P5,5
Table 3. Summary of 2011 Monterey pine forest demographic study where survival rates are calculated as the proportion of the next largest size class to the current one; data were collected from seven unmanaged plots in a native Pinus radiata forest on the Monterey peninsula with 5 m radius.
Size. ClassNumber of TreesSurvival RateAverage Diameter (cm)Standard ErrorAverage Height (m)Standard Error
16940.1540.50.000.180.01
21070.5511.00.000.750.04
3590.8471.50.001.320.08
4500.6002.60.123.110.23
5300.68*34.63.1817.961.04
* Estimated based on maximum lifespan of Monterey pine [6].
Table 4. Projection matrix with transition probability values calculated from Monterey pine demographic data and estimates for cone production and seed release/germination included with classes corresponding to cones (C), seeds (S), seedlings (1), small saplings (2), medium saplings (3), large saplings (4), and mature trees (5). Some parameters are affected by pitch canker disease (p) and are thus multiplied by (1 − p).
CS12345
C0001 × (1 − p)16 × (1 − p)65 × (1 − p)75 × (1 − p)
S10000000
100.007 × (1 − p)00000
2000.154 × (1 − p)0000
30000.551 × (1 − p)0.01700
400000.83 × (1 − p)0.030
5000000.570.68
Table 5. Summary statistics for 100 runs of a demographic matrix projection model for three Pinus radiata starting population vectors projected over 50 decades in the presence of various representations of pitch canker disease.
PopulationDiseaseAverageEigenvalueFinal totalPopulation
Vector zModelEigenvalueSEPopulationSE
SSDNone1.016301987100
Constant (0.03)1.00060919740
Beta0.99930.000586144310.1
Autoregressive1.00080.000592771319.9
SAR feedback0.99140.0008597611779.4
SCFNone1.01630322450
Constant (0.03)1.00060145600
Beta0.99930.00051363053.3
Autoregressive1.00080.00051483850.0
SAR feedback0.99140.000810500270.4
NPNone1.01630468200
Constant (0.03)1.00060214570
Beta0.99930.00052010274.4
Autoregressive1.00080.00052166374.4
SAR feedback0.99140.000813947406.5
z where SSD represents the stable stage distribution, SCF represents a stand clearing fire (seeds alone), and NP represents a new plantation (seedlings alone).
Table 6. Elasticity analysis for a Monterey pine matrix projection model in the absence of pitch canker disease with classes corresponding to cones (C), seeds (S), seedlings (1), small saplings (2), medium saplings (3), large saplings (4), and mature trees (5).
CS12345
C0000.00130.01150.03940.0770
S0.1293000000
100.129300000
2000.12930000
30000.12800.002200
400000.11640.00350
5000000.07700.1558

