Carbon and Nitrogen Responses in Litterfall and Litter Decomposition in Red Pine (Pinus densiflora S. et Z.) Stands Disturbed by Pine Wilt Disease


Abstract
:1. Introduction
2. Materials and Methods
2.1. Study Site and Experimental Design
2.2. Litterfall
2.3. Decomposition of Needles and Branches
2.4. Soil Property
2.5. Data Analysis
3. Results
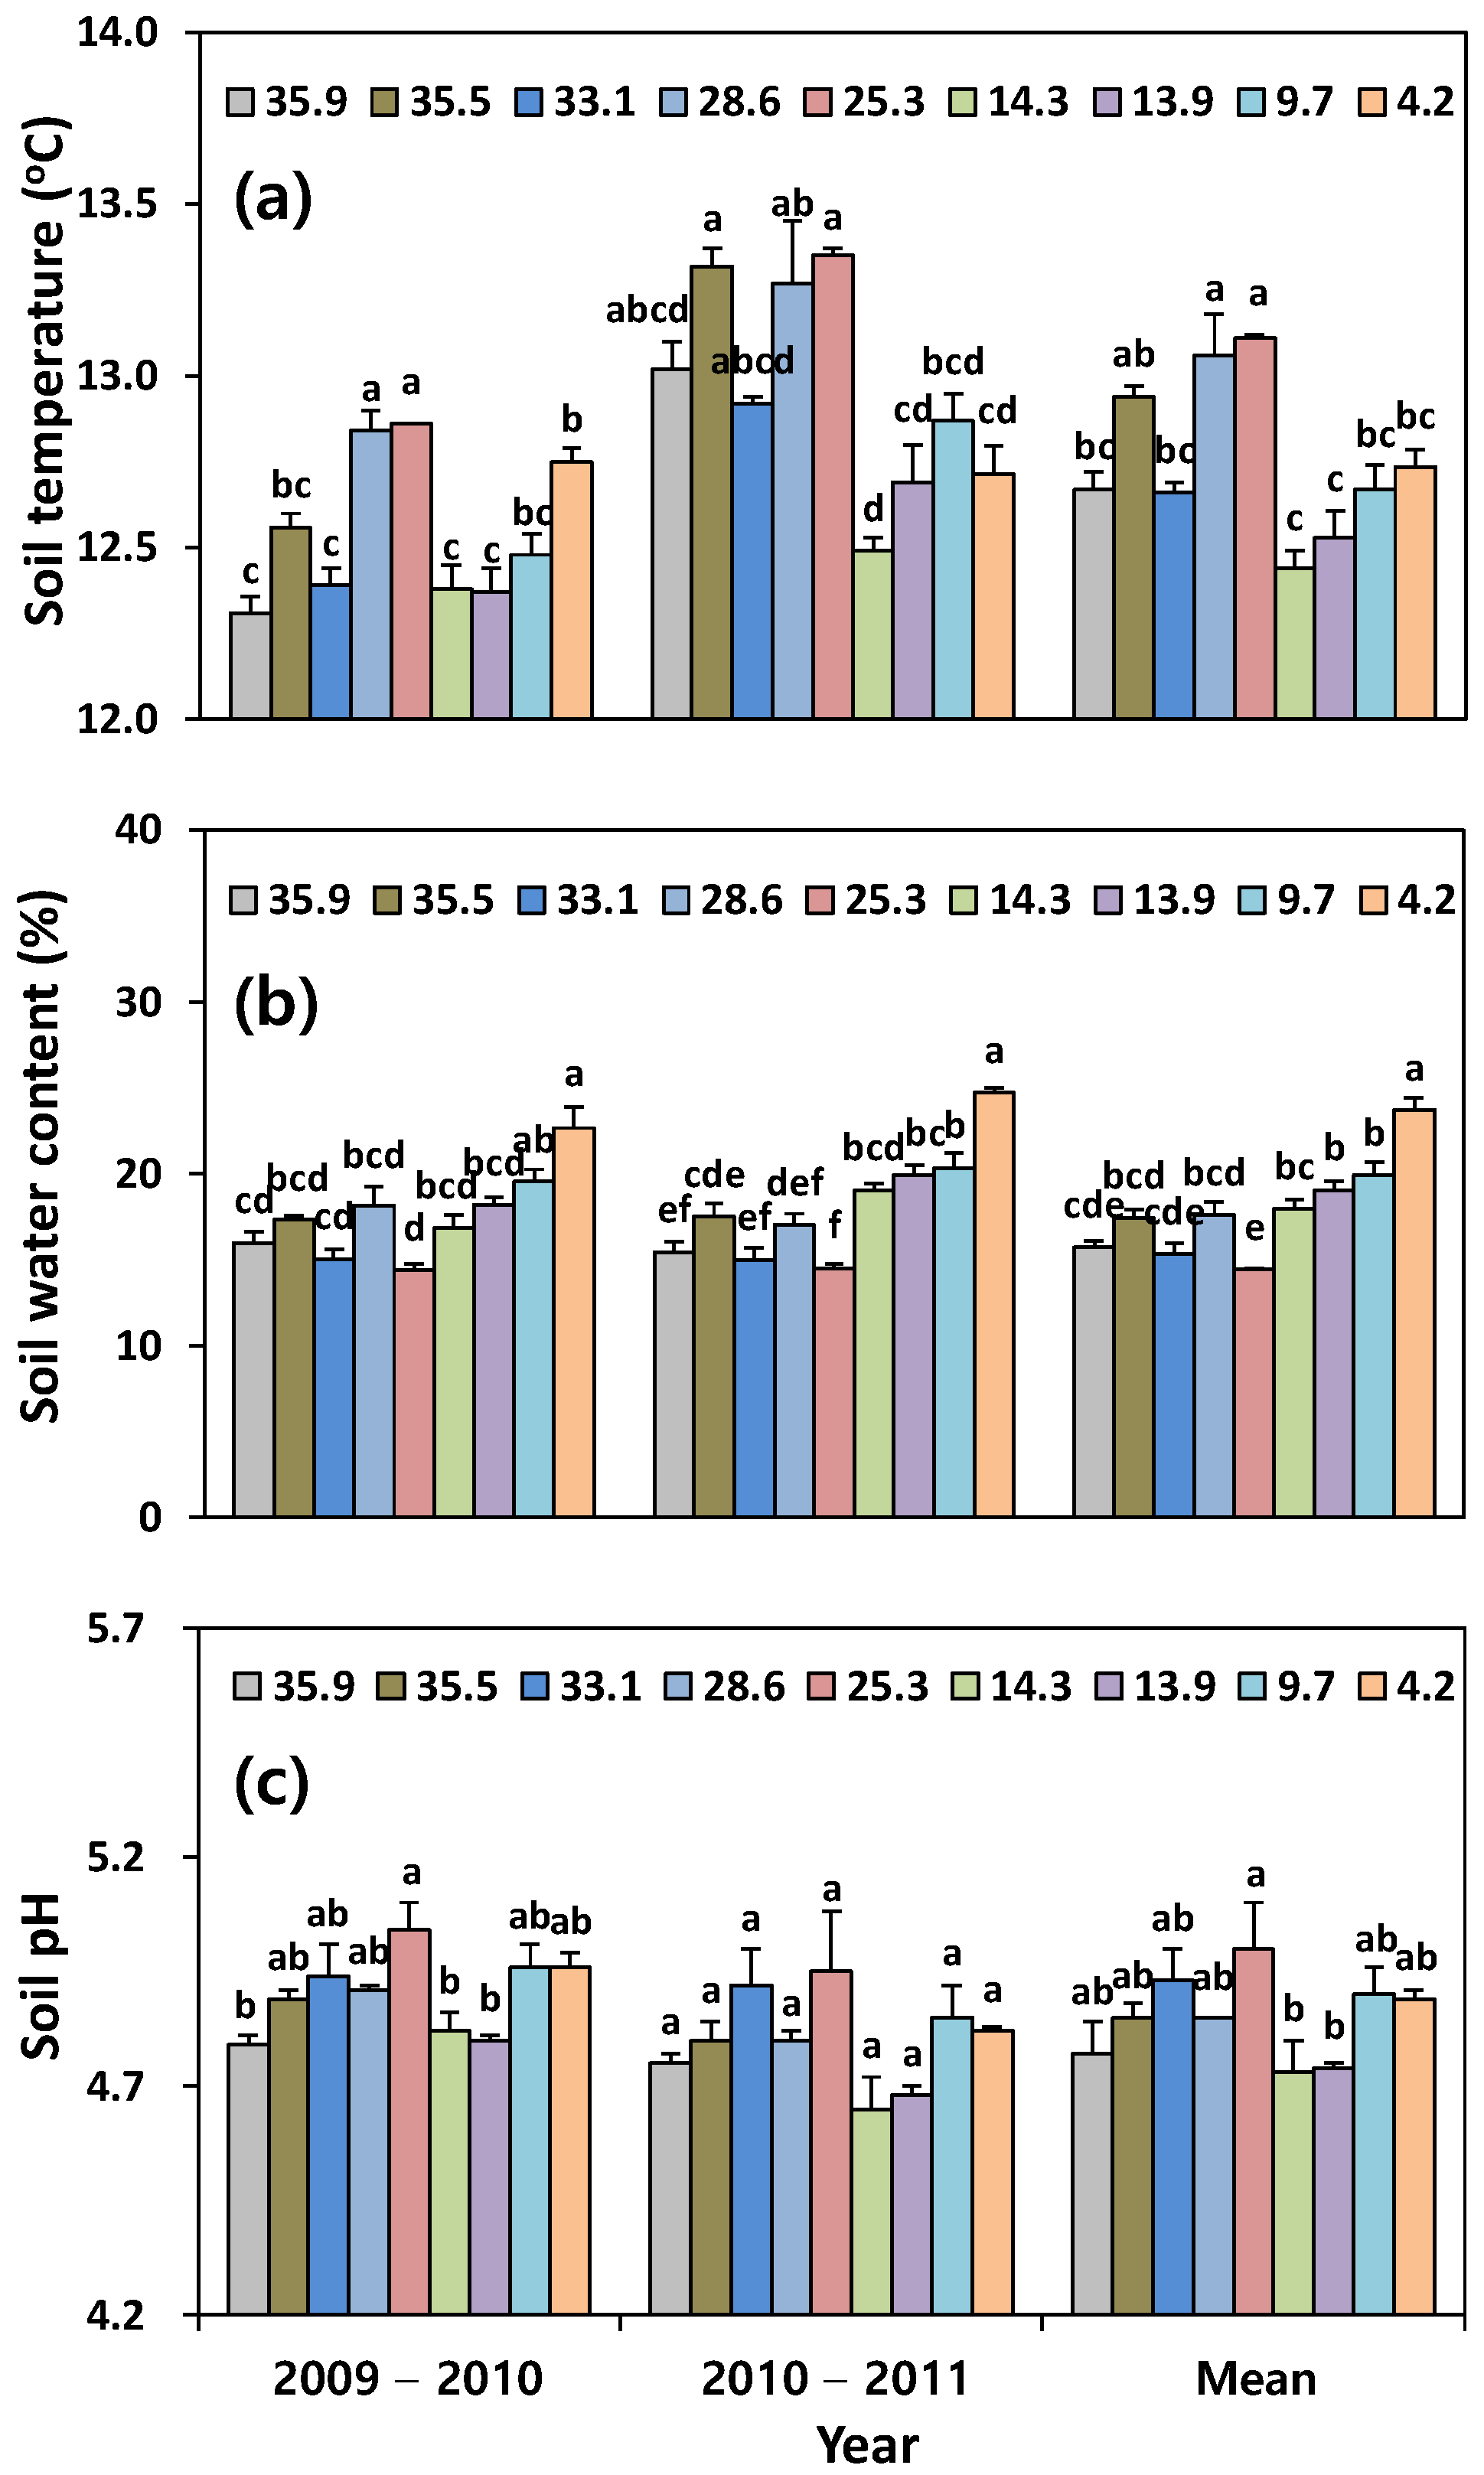
3.1. Soil Property
3.2. Carbon and Nitrogen Responses of Litterfall
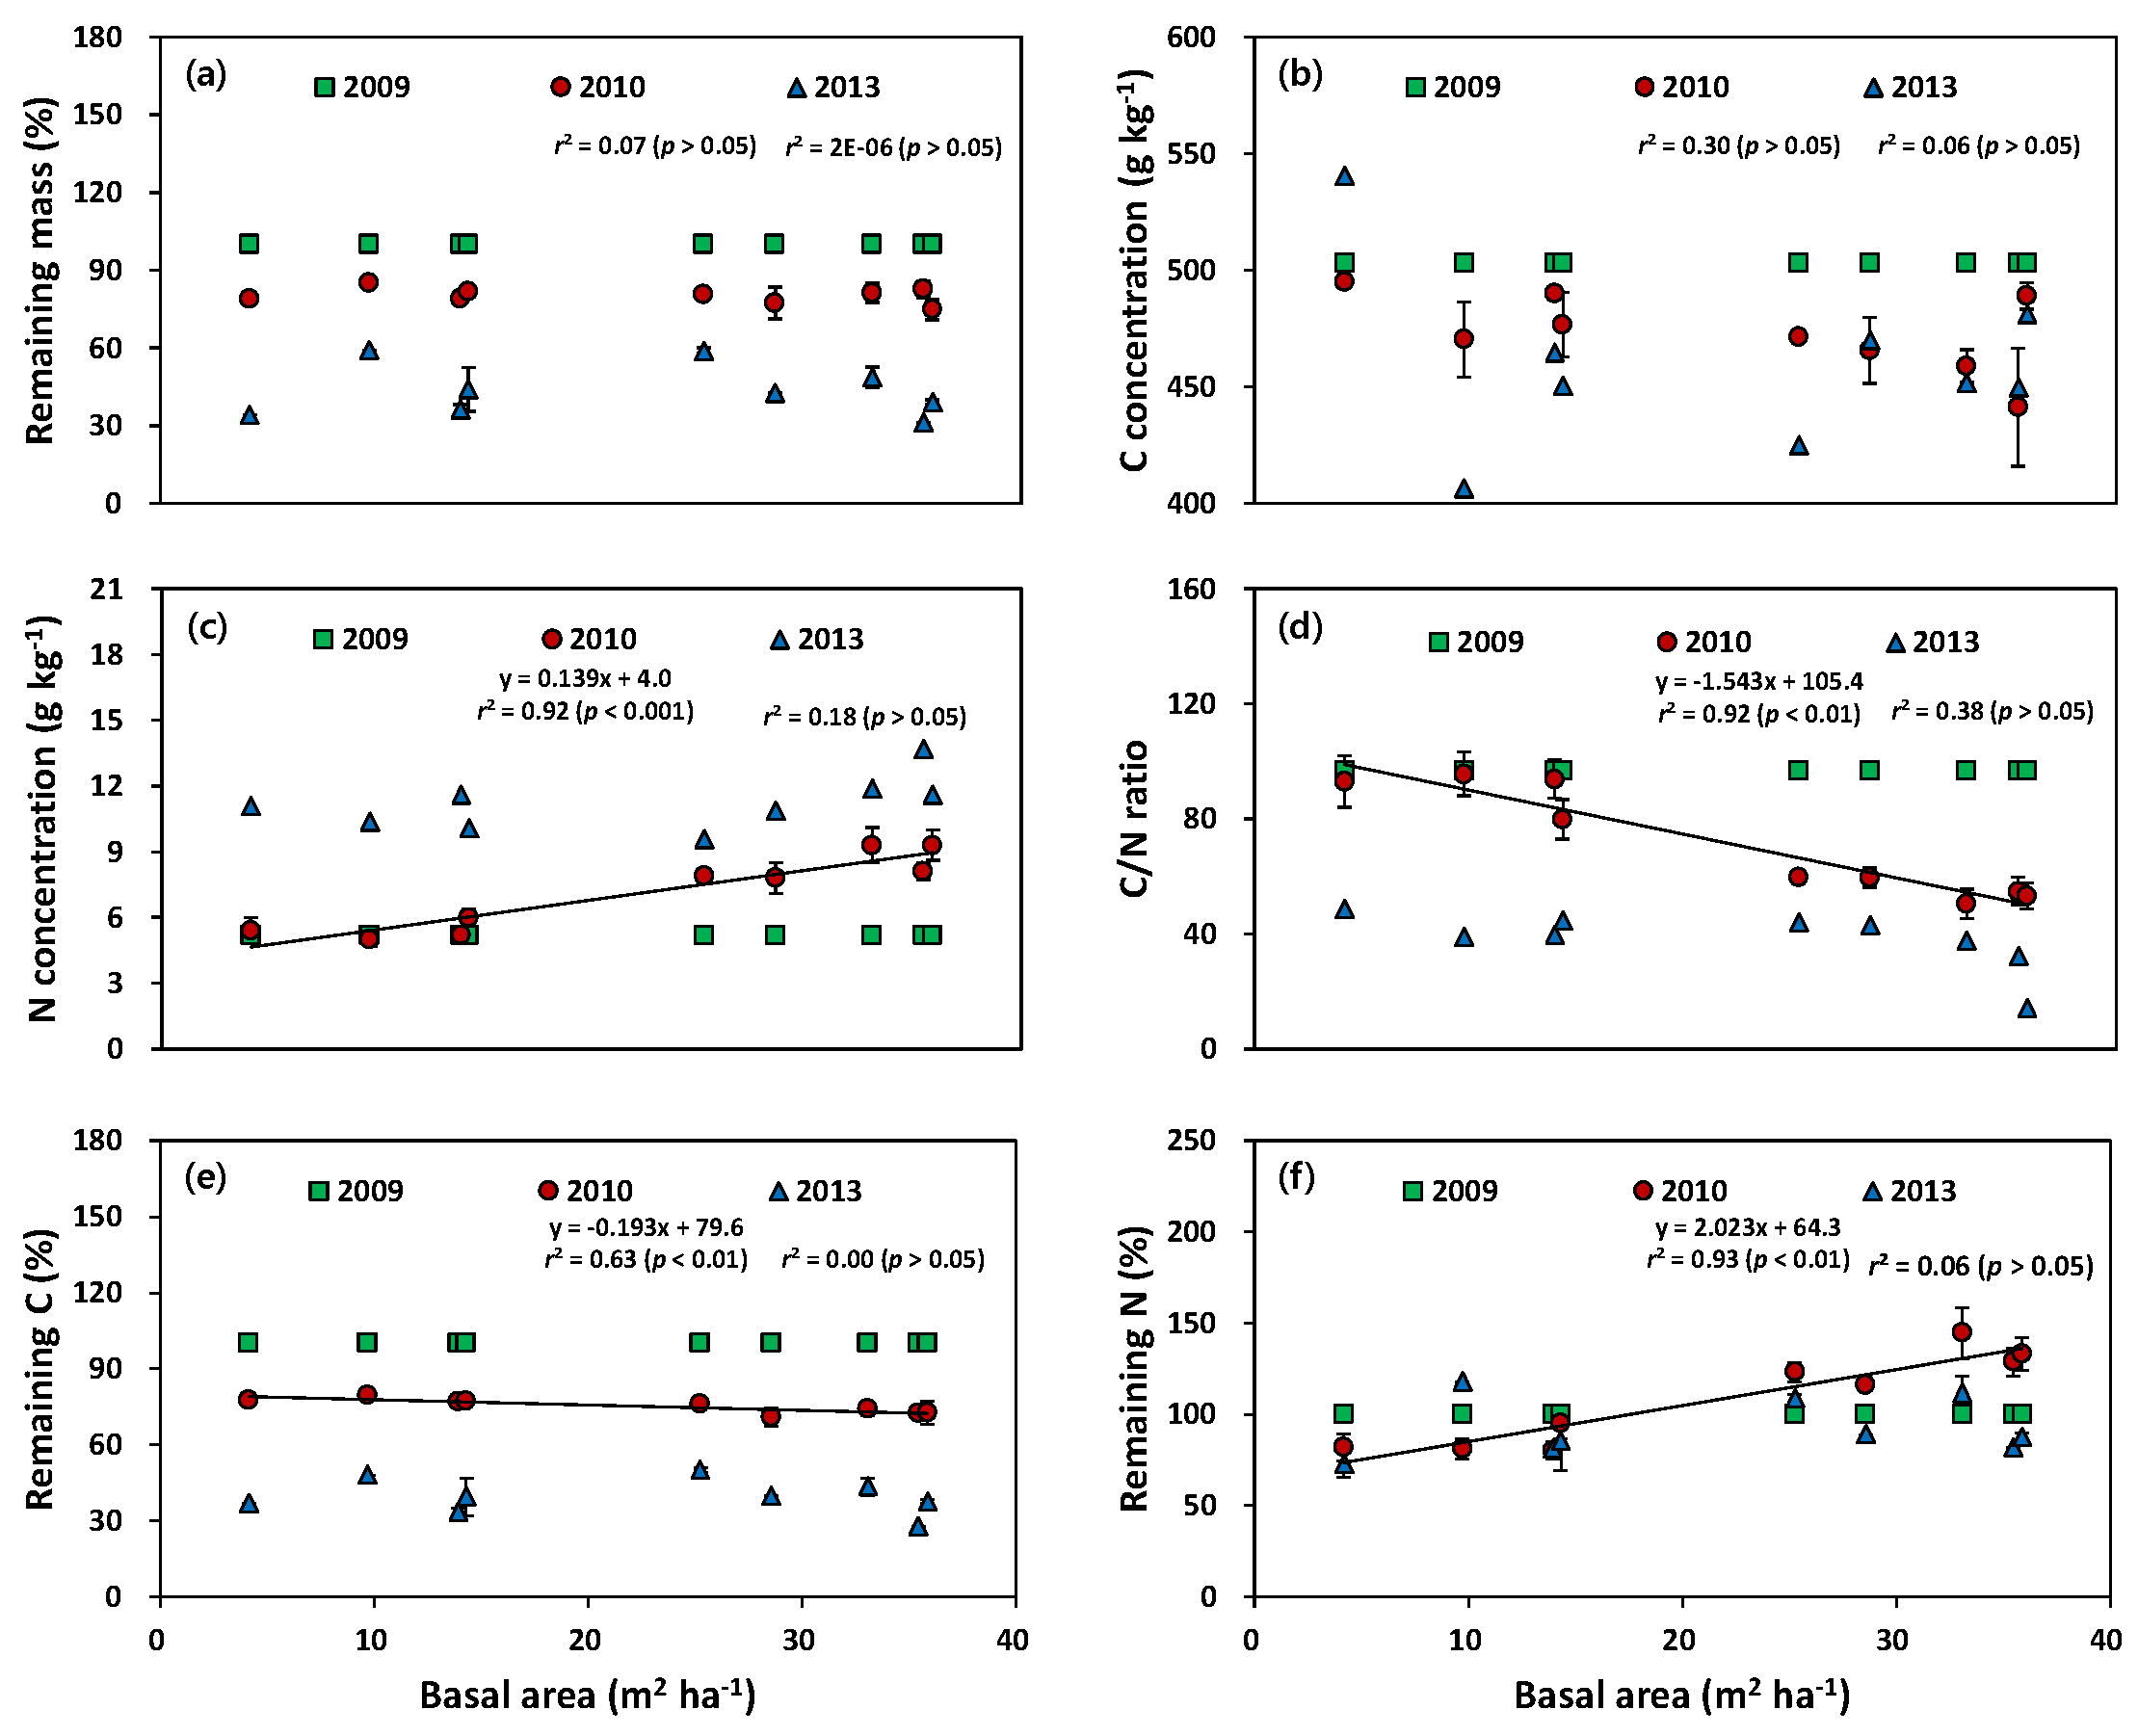
3.3. Weight Loss and Carbon and Nitrogen Status during Decomposition Processes
4. Discussion
4.1. Carbon and Nitrogen Inputs through Litterfall
4.2. Decomposition Rates of Needle Litter and Branches
4.3. Carbon and Nitrogen Responses during Decomposition Processes of Needle Litter and Branches
5. Conclusions
Author Contributions
Funding
Acknowledgments
Conflicts of Interest
References
- Berg, B.; Laskowski, R. Litter decomposition; A guide to carbon and nutrient turnover. Adv. Ecol. Res. 2006, 38, 20–71. [Google Scholar]
- Morehouse, K.; Johns, T.; Kaye, J.; Kaye, M. Carbon and nitrogen cycling immediately following bark beetle outbreaks in southwestern ponderosa pine forests. For. Ecol. Manag. 2008, 255, 2698–2708. [Google Scholar] [CrossRef]
- Hicke, J.A.; Allen, D.C.; Desai, A.R.; Dietze, M.C.; Hall, R.J.; Hogg, E.H.; Kashian, D.M.; More, D.; Raffa, K.F.; Sturrock, R.N.; et al. Effects of biotic disturbances on forest carbon cycling in the United States and Canada. Glob. Chang. Biol. 2012, 18, 7–34. [Google Scholar] [CrossRef]
- Gao, R.; Shi, J.; Huang, R.; Wang, Z.; Luo, Y. Effects of pine wilt disease invasion on soil properties and Masson pine forest communities in the three Gorges reservoir region, China. Ecol. Evol. 2015, 5, 1702–1716. [Google Scholar] [CrossRef] [PubMed]
- Kim, C.; Jeong, J.; Cho, H.S.; Lee, K.S.; Park, N.C. Carbon and nitrogen status in litterfall of a red pine stand with varying degrees of damage from pine wilt disease. J. Ecol. Field Biol. 2011, 34, 215–222. [Google Scholar] [CrossRef] [Green Version]
- Bates, J.D.; Svejcar, T.S.; Miller, R.F. Litter decomposition in cut and uncut western junifer woodlands. J. Arid Environ. 2007, 70, 223–236. [Google Scholar] [CrossRef]
- Kim, C.; Sharik, T.L.; Jurgensen, M.F. Canopy cover effects on mass loss, and nitrogen and phosphorus dynamics from decomposing litter in oak and pine stands in northern Lower Michigan. For. Ecol. Manag. 1996, 80, 13–20. [Google Scholar] [CrossRef]
- Kim, C.; Son, Y.; Lee, W.K.; Jeong, J.; Noh, N. Influences of forest tending works on carbon distribution and cycling in a Pinus densiflora S. et Z. stand in Korea. For. Ecol. Manag. 2009, 257, 1420–1426. [Google Scholar] [CrossRef]
- Lado-Monserrat, L.; Lidón, A.; Bautista, I. Erratum to: Litterfall, litter decomposition and associated nutrient fluxes in Pinus halepensis: influence of tree removal intensity in a Mediterranean forest. Eur. J. Forest Res. 2016, 135, 203214. [Google Scholar] [CrossRef]
- Pérez, G.; Díer, J.J.; Ibeas, F.; Pajares, J.A. Assessing pine wilt disease risk under a climate change scenario in northwestern Spain. In Managing Forest Ecosystem: The Challenge of Climate Change; Bravo, F., LeMay, V., Jandl, R., Gadow, K., Eds.; Springer: New York, NY, USA, 2009; pp. 269–282. [Google Scholar] [CrossRef]
- Ikegami, M.; Jenkins, T.A.R. Estimate global risks of a forest disease under current and future climate using species distribution model and simple thermal model-pine wilt disease as a model case. For. Ecol. Manag. 2018, 409, 343–352. [Google Scholar] [CrossRef]
- Jeong, J.; Kim, C.; Lee, K.S.; Bolan, N.; Naidu, R. Carbon storage and soil CO2 efflux rats at varying degrees of damage from pine wit disease in red pine stands. Sci. Total Environ. 2013, 465, 273–278. [Google Scholar] [CrossRef] [PubMed]
- Mabuhay, J.A.; Nakagoshi, N. Response of soil microbial communities to changes in a forest ecosystem brought about by pine wilt disease. Landscape Ecol. Eng. 2012, 8, 189–196. [Google Scholar] [CrossRef]
- Kwon, T.S.; Shin, J.H.; Lim, J.H.; Kim, Y.K.; Lee, E.J. Management of pine wilt disease in Korea through preventative silvicultural control. For. Ecol. Manag. 2011, 261, 562–569. [Google Scholar] [CrossRef]
- Kim, C.; Jang, K.-S.; Kim, J.-B.; Byun, J.-K.; Lee, C.-H.; Jeon, K.-S. Relationship between soil properties and incidence of pine wilt disease at stand level. Landscape Ecol. Eng. 2010, 6, 119–124. [Google Scholar] [CrossRef]
- Jeon, K.S.; Kim, C.S.; Park, N.C.; Hur, T.C.; Hong, S.C. Effects on control of pine wilt disease (Bursaphelenchus xylophilus) by thinning methods in red pine (Pinus densiflora) forest. J. Korean For. Soc. 2011, 100, 165–171. [Google Scholar]
- Hurlbert, S.H. Pseudoreplication and the design of ecological field experiments. Ecol. Monogr. 1984, 54, 187–211. [Google Scholar] [CrossRef]
- Kalra, Y.P.; Maynard, D.G. Methods Manual for Forest Soil and Plant Analysis; Northwest Region, Information Report. NOR-X-319; Northern Forestry Centre: Edmonton, AB, Canada, 1991; p. 115. [Google Scholar]
- SAS Institute Inc. SAS/STAT Statistical Software; Version 9.1; SAS Publishing: Cary, NC, USA, 2003. [Google Scholar]
- Kim, C. Basal area effects on a short-term nutrient status of litter fall and needle litter decomposition in a Pinus densiflora stands. J. Ecol. Environ. 2016, 39, 51–60. [Google Scholar] [CrossRef]
- Bueis, T.; Bravo, F.; Pando, V.; Turrión, M.B. Local basal area affects needle litterfall, nutrient concentration, and nutrient release during decomposition in Pinus halepensis Mill. plantations in Spain. Ann. For. Sci. 2018, 75, 21. [Google Scholar] [CrossRef]
- Hansen, K.; Vesterdal, L.; Schmidt, I.K.; Gundersen, P.; Sevel, L.; Bastrup-Birk, A.; Pedersen, L.B.; Bille-Hansen, J. Litterfall and nutrient return in five tree species in a common garden experiment. For. Ecol. Manag. 2009, 257, 2133–2144. [Google Scholar] [CrossRef]
- Livesley, S.J.; Ossola, A.; Threlfall, C.G.; Hahs, A.K.; Williams, N.S.G. Soil carbon and carbon/nitrogen ratio change under tree canopy, tall grass, and turf grass areas of urban green space. J. Environ. Qual. 2015, 545, 215–223. [Google Scholar] [CrossRef]
- Peri, P.L.; Gargalione, V.; Pastur, G.M.; Lencinas, M.V. Carbon accumulation along a stand development sequence of Nothofagus Antarctica forests across a gradient in site quality in Southern Patagonia. For. Ecol. Manag. 2010, 260, 229–237. [Google Scholar] [CrossRef]
- Lorenz, K.; Lal, R. Carbon Sequestration in Forest Ecosystems; Springer: New York, NY, USA, 2010; pp. 103–158. [Google Scholar]
- Ge, P.; Da, L.J.; Wang, W.B.; Xu, X.N. Seasonal dynamics of dissolved organic carbon, nitrogen and other nutrients in soil of Pinus massoniana stands after pine wilt disease disturbance. J. Soil Sci. Plant Nutri. 2014, 14, 75–87. [Google Scholar] [CrossRef]
- Blanco, J.A.; Imbert, J.B.; Castillo, F.J. Thinning affects Pinus sylvestris needle decomposition rates and chemistry differently depending on site conditions. Biogeochemistry 2011, 106, 397–414. [Google Scholar] [CrossRef]
- Holden, S.R.; Treseder, K.K. A meta-analysis of soil microbial biomass responses to forest disturbances. Front. Microbiol. 2013, 4, 163. [Google Scholar] [CrossRef] [PubMed]
- Witkamp, M. Decomposition of leaf litter in relation to environment, microflora, and microbial respiration. Ecology 1966, 47, 194–201. [Google Scholar] [CrossRef]
- Angst, Š.; Cajthaml, T.; Angst, G.; Šimàckovà, H.; Brus, J.; Frouz, J. Retention of dead standing plant biomass (marcescence) increases subsequent litter decomposition in the soil organic layer. Plant Soil 2017, 418, 571–579. [Google Scholar] [CrossRef]


| Disturbance Intensity | Basal Area (m2 ha−1) | Tree Density (tree ha−1) | Mean DBH (cm) | Mean Height (m) |
|---|---|---|---|---|
Slight | 35.9 | 2100 | 14.08 (6.0–21.5) * | 9.57 (7.40–10.66) |
| 35.5 | 1800 | 15.40 (9.5–21.0) | 9.66 (8.30–10.35) | |
| 33.1 | 2500 | 12.60 (8.0–18.9) | 10.74 (9.21–11.87) | |
| 28.6 | 1300 | 16.36 (11.0–23.0) | 10.30 (9.06–11.36) | |
| 25.3 | 1500 | 14.22 (8.1–19.3) | 10.82 (10.36–11.32) | |
| 14.3 | 1100 | 12.56 (9.7–17.0) | 8.42 (7.36–9.52) | |
| 13.9 | 800 | 14.54 (11.2–21.6) | 8.14 (7.28–9.19) | |
| 9.7 | 500 | 15.36 (10.8–19.9) | 8.25 (6.84–9.88) | |
| Severe | 4.2 | 300 | 13.23 (12.0–14.4) | 7.36 (5.93–8.66) |
| Basal Area (m2 ha−1) | Bulk Density (g cm−3) | Coarse Fragment (g g−1) | Organic C (g kg−1) | Total N (g kg−1) | C/N Ratio | Available P (mg kg−1) | Exchangeable (cmolc kg−1) | ||
|---|---|---|---|---|---|---|---|---|---|
| K+ | Ca2+ | Mg2+ | |||||||
| 35.9 | 1.15 (0.03)abc | 0.58 (0.02)a | 31.6 (7.5)a | 1.7 (0.4)a | 19.4 (1.0)b | 2.4 (0.2)abc | 0.12 (0.01)a | 3.32 (0.25)a | 1.93 (0.15)a |
| 35.5 | 1.12 (0.04)abc | 0.42 (0.01)a | 26.9 (3.6)a | 1.4 (0.2)a | 19.9 (1.4)b | 2.8 (0.8)ab | 0.16 (0.01)a | 3.83 (0.20)a | 1.60 (0.24)ab |
| 33.1 | 1.29 (0.05)ab | 0.42 (0.01)a | 24.5 (5.3)a | 1.3 (0.3)a | 19.1 (1.2)b | 1.8 (0.3)bcd | 0.14 (0.02)a | 3.03 (0.17)ab | 1.21 (0.10)b |
| 28.6 | 1.11 (0.03)abc | 0.45 (0.03)a | 32.7 (9.2)a | 1.7 (0.4)a | 18.7 (0.6)b | 3.9 (0.8)a | 0.16 (0.01)a | 4.02 (0.20)a | 1.62 (0.13)ab |
| 25.3 | 1.32 (0.05)a | 0.46 (0.05)a | 14.4 (3.6)a | 0.7 (0.2)a | 20.6 (1.3)b | 1.6 (0.2)bcd | 0.13 (0.02)a | 2.95 (0.23)ab | 1.48 (0.05)ab |
| 14.3 | 1.03 (0.05)bc | 0.48 (0.04)a | 21.8 (5.1)a | 0.8 (0.2)a | 34.3 (6.7)a | 0.7 (0.2)cd | 0.10 (0.02)a | 1.10 (0.16)c | 0.58 (0.02)c |
| 13.9 | 1.03 (0.04)bc | 0.40 (0.09)a | 33.7 (7.6)a | 1.3 (0.3)a | 25.8 (1.1)ab | 0.9 (0.1)cd | 0.09 (0.02)a | 1.17 (0.19)c | 0.52 (0.09)c |
| 9.7 | 1.08 (0.03)abc | 0.55 (0.04)a | 32.2 (7.4)a | 1.3 (0.3)a | 24.5 (2.1)ab | 0.8 (0.1)cd | 0.29 (0.12)a | 1.63 (0.18)bc | 0.63 (0.03)c |
| 4.2 | 1.00 (0.06)c | 0.47 (0.06)a | 27.0 (6.4)a | 1.3 (0.3)a | 22.0 (0.7)b | 1.0 (0.1)bcd | 0.17 (0.02)a | 2.60 (0.83)abc | 0.63 (0.05)c |
© 2019 by the authors. Licensee MDPI, Basel, Switzerland. This article is an open access article distributed under the terms and conditions of the Creative Commons Attribution (CC BY) license (http://creativecommons.org/licenses/by/4.0/).
Share and Cite
Kim, C.; Kim, S.; Baek, G.; Yang, A.-R. Carbon and Nitrogen Responses in Litterfall and Litter Decomposition in Red Pine (Pinus densiflora S. et Z.) Stands Disturbed by Pine Wilt Disease. Forests 2019, 10, 244. https://doi.org/10.3390/f10030244
Kim C, Kim S, Baek G, Yang A-R. Carbon and Nitrogen Responses in Litterfall and Litter Decomposition in Red Pine (Pinus densiflora S. et Z.) Stands Disturbed by Pine Wilt Disease. Forests. 2019; 10(3):244. https://doi.org/10.3390/f10030244
Chicago/Turabian StyleKim, Choonsig, Seongjun Kim, Gyeongwon Baek, and A-Ram Yang. 2019. "Carbon and Nitrogen Responses in Litterfall and Litter Decomposition in Red Pine (Pinus densiflora S. et Z.) Stands Disturbed by Pine Wilt Disease" Forests 10, no. 3: 244. https://doi.org/10.3390/f10030244