Effective Molecular Identification of Ectomycorrhizal Fungi: Revisiting DNA Isolation Methods


Institute of Dendrology, Polish Academy of Sciences, Parkowa 5, 62-035 Kórnik, Poland
*
Author to whom correspondence should be addressed.
Forests 2019, 10(3), 218; https://doi.org/10.3390/f10030218
Submission received: 25 January 2019
/
Revised: 15 February 2019
/
Accepted: 25 February 2019
/
Published: 1 March 2019
(This article belongs to the Special Issue Ecto- and Endomycorrhizal Relationships in Forest Trees)
Abstract
:A better understanding of ectomycorrhizal symbiosis leads to numerous advancements in forest management and environmental protection. The morphological identification of the ectomycorrhizae often proves to be misleading. For this reason, in order to study the ectomycorrhizal fungi communities, a number of molecular methods that require the isolation of nucleic acids are being used. However, ectomycorrhizal root tips, low mass heterogenic material rich in inhibitors, are a recalcitrant substrate in DNA isolation. It is common for published studies to include some number of unidentified root tips in their results, in spite of diverse isolation protocols being available to researchers. This study aims to analyze the relationship between the collected fungal material and later isolation results, and to propose a DNA isolation protocol specifically optimized for ectomycorrhizal root tips. It was found that the taxonomic position can be used to predict the potential isolation efficiency, with Ascomycota being generally more difficult from which to isolate DNA. After a number of cell lysis and lysate purification methods were evaluated, the joined approach of mechanical and chemical lysis, followed by silica column purification, was found to provide the best results, even with recalcitrant material.
1. Introduction
Ectomycorrhizal (ECM) fungi, involved in obligatory symbiosis with a number of major tree families, are invaluable to most forest ecosystems [1,2,3]. Major tree families of the temperate and boreal climate, such as Pinaceae, Fagaceae, or Betulaceae, provide their ECM fungal partners with photosynthesis products in exchange for access to nutrients in an inorganic form [2,4]. Moreover, ECM symbiosis improves tree tolerance to biotic and abiotic stress [5,6]. Continuous research of this interaction provides insight into forest ecology, enhancing nature protection and forestry [6].
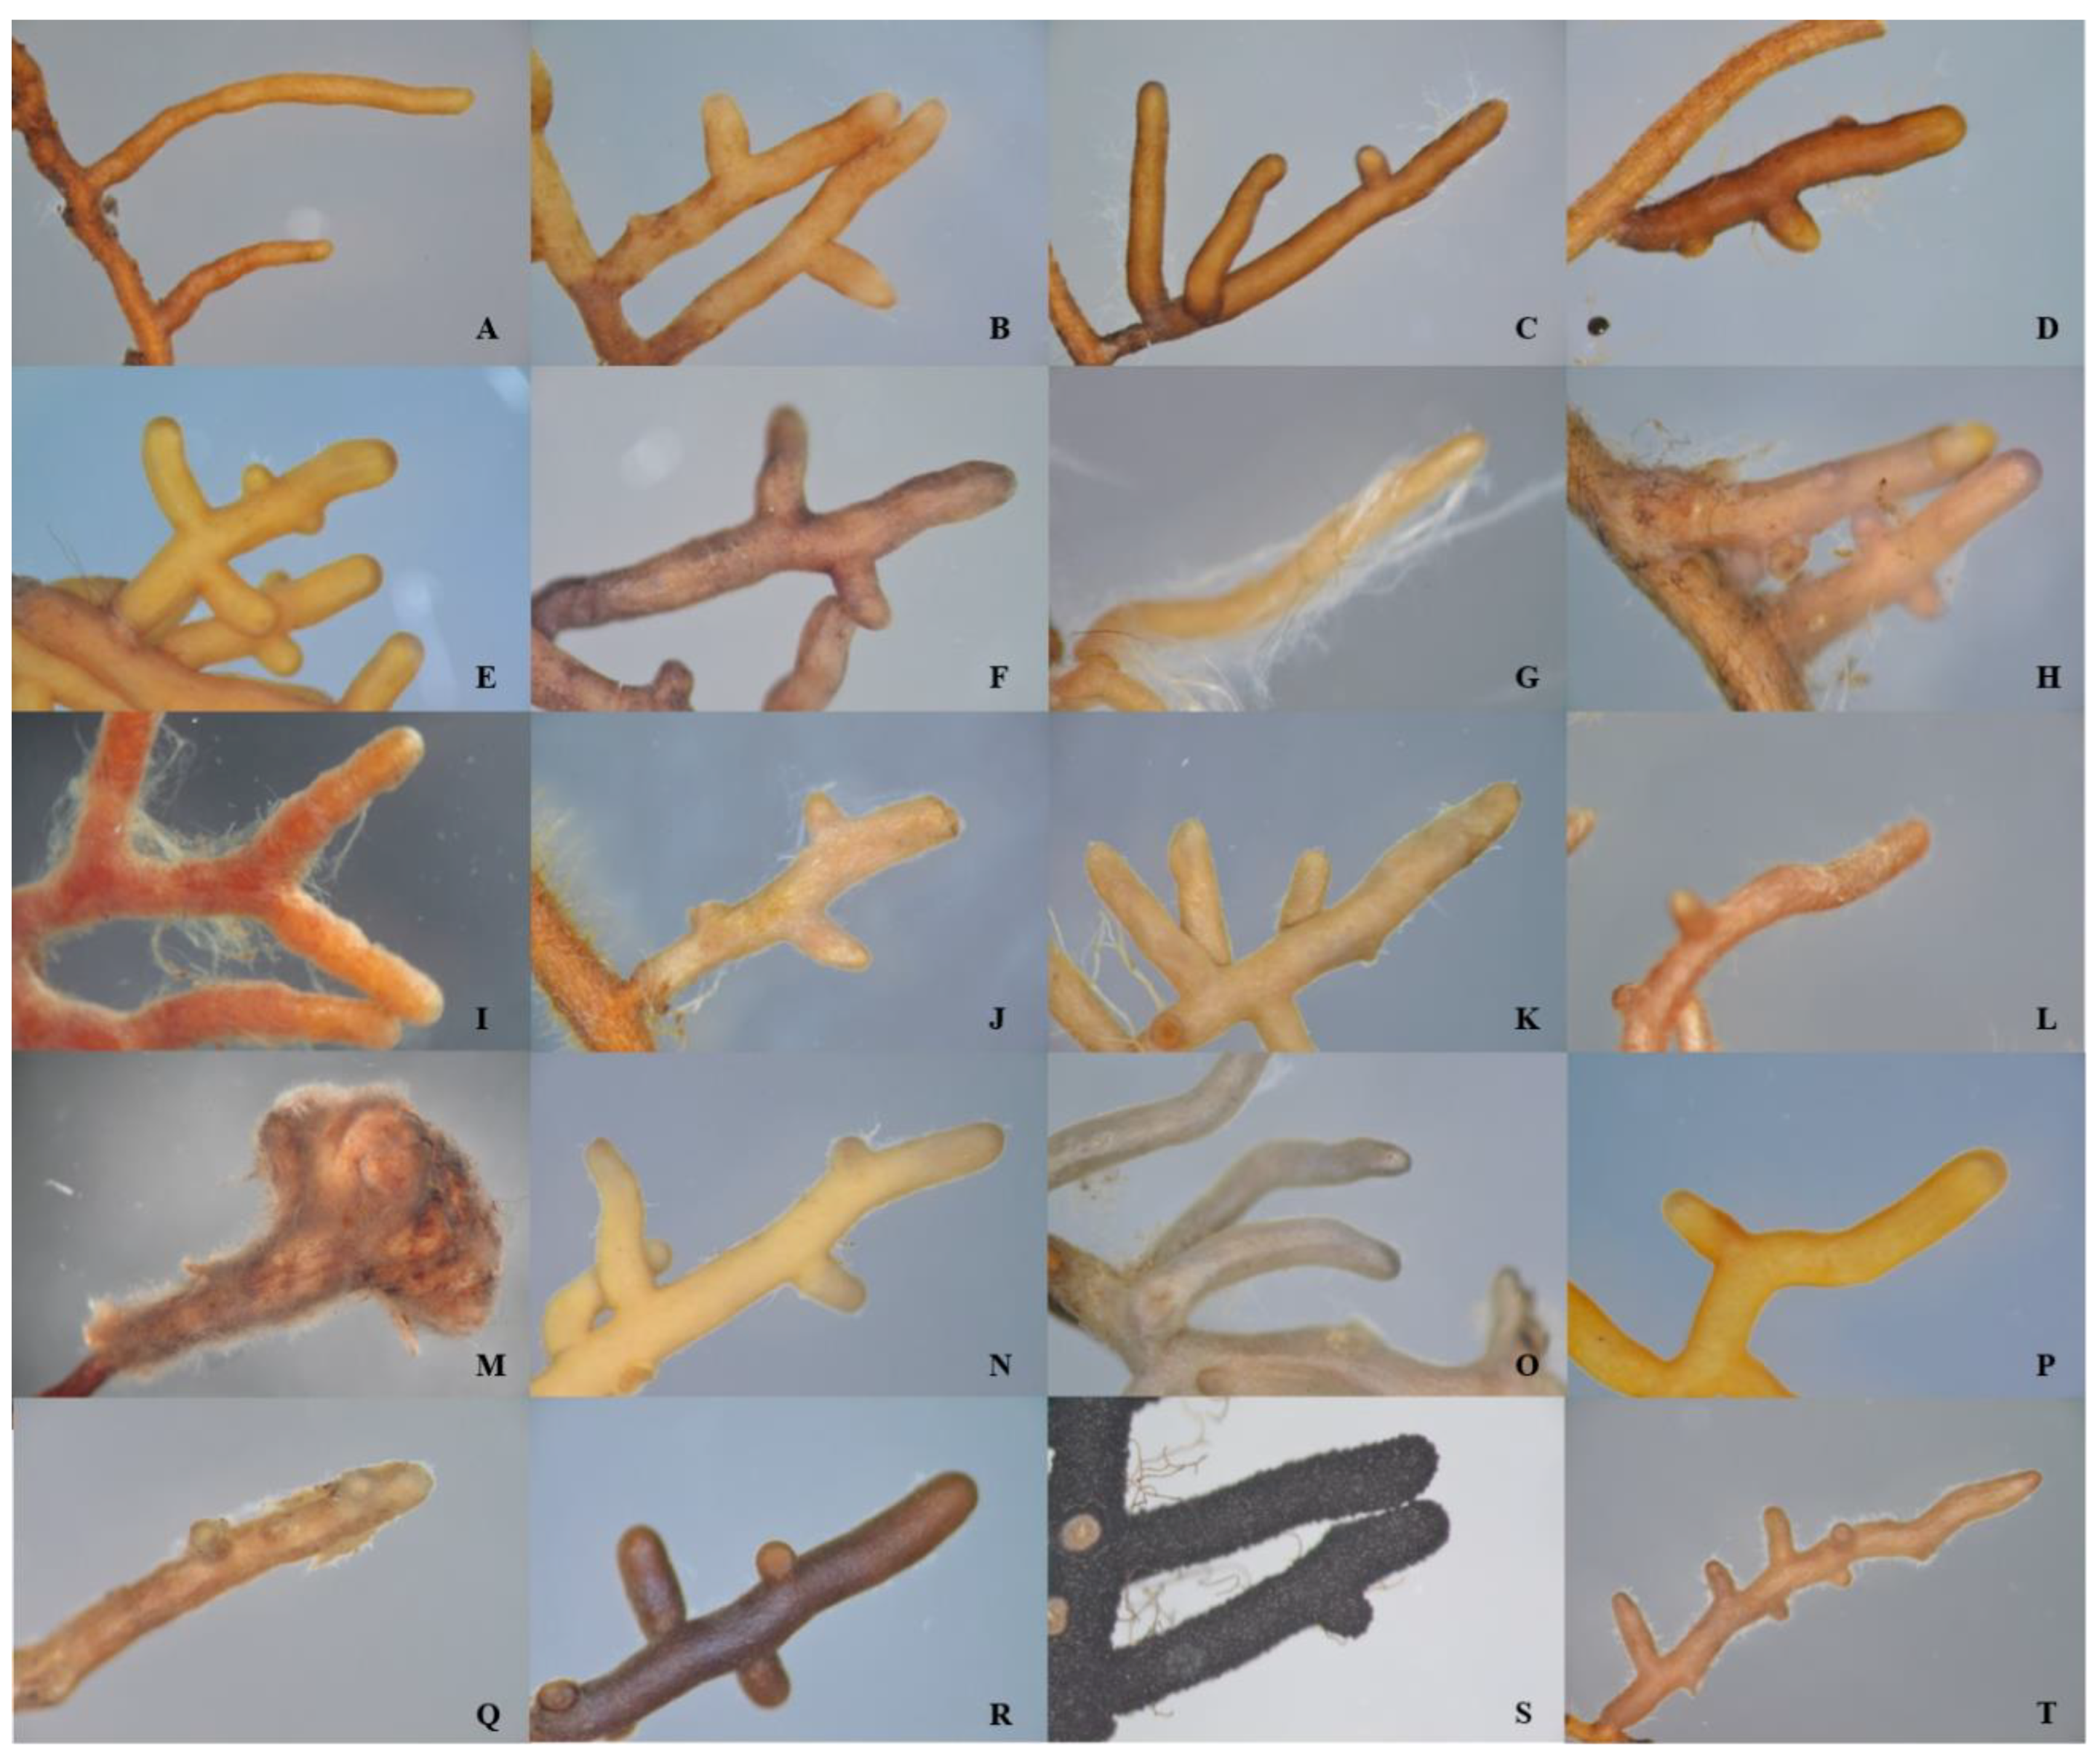
The complexity of ECM symbiosis is partially due to the great variety of ECM fungi. At this time 18 fungal orders, five belonging to Ascomycota and 12 belonging to Basidiomycota, as well as one Zygomycota, are known to contain ECM species [3,7,8]. Such phylogenetic diversity explains numerous differences in both the structure and functionality of those organisms. The size and shape of the ECM mantle covering a root tip may vary from, barely distinguishable from a naked root like Elaphomyces muricatus Fr., to a full and rounded example like Tuber puberulum Berk. & Broome; its surface can be smooth like Lactarius aurantiacus (Pers.) Grey, hirsute like Cortinarius torvus (Fr.) Fr. or coarse like Tomentella sp. 1 (Figure 1). On the biochemical level, ECM fungi vary greatly across the taxa in the type and amount of produced secondary metabolites, including melanin among others [9].
Molecular research based on DNA isolation is one of the most often used approaches in studying ECM fungi. While many techniques for nucleic acid isolation have been devised and described, for their ease of use, applicability and reliability, variants of chloroform extraction and silica surface adsorption are predominantly used. This classical extraction approach, dividing proteins and nucleic acids into organic and aqueous phases respectively, has been in use for over 80 years [10,11], receiving countless modifications. The silica adsorption approach [12], while not as popular in its original form, became the basis of many popular commercial DNA isolation kits, the use of which reduces the time per experiment greatly, thus increasing overall work efficiency.
Due to the distinctive features of fungi, isolating their DNA poses a number of difficulties. Fungal cell lysis necessitates rupturing the sturdy chitin cell wall. This usually requires an additional preparation step, as most common isolation methods are primarily optimized for animal tissue. While chemical and enzymatic methods for wall breakage are available, the most common approach consists of mechanical disruption, e.g., grinding (with a pestle or bead mill) or sonication [13,14,15]. After successful lysis, the resulting mixture may contain secondary metabolites, e.g., polysaccharides, polyphenols, and melanin. Those are known to interfere with DNA and inhibit downstream applications, like the PCR reaction [16]; to prevent that, an extra purification step is often used. Isolating nucleic acids from ECM root tips poses even more obstacles. Their small mass is often orders of magnitude smaller that the recommended sample mass for protocols [13,14,15]. Additionally, they contain not only fungal cells, but also plant tissue of the ECM tree partner, in the form of the root itself.
This paper aims to compare cell lysis and DNA isolation methods in terms of efficiency. We hypothesize that:
- Approaches to isolating DNA from ECM root tips differ significantly in general efficiency.
- The efficiency of certain DNA isolation methods depends on the properties of a specific fungal sample.
We think that verifying those hypotheses and proposing an optimized DNA isolation protocol is going to increase the rate of progress for mycological and ecological research. Devising a straightforward and codified DNA isolation approach, optimized for ectomycorrhizae, would benefit the researchers working with them, easing the workload and leading to more reliable and comparable results.
2. Materials and Methods
2.1. Materials
To evaluate the effectiveness of the selected DNA isolation approaches, each method was tested with a set of 20 pre-identified ECM root tips, each belonging to a different fungal taxon (Table 1). The research material was obtained from roots collected in Lithuania (Čepkelių Marsh) and Poland (Białowieża Forest; Puszcza Drawska Forest; Puszcza Zielonka Forest, Czerniejewo Forest District) (Table S1) and stored at −80 °C. For each morpho-type respectively, the root tips originated from a single, uniform ECM cluster—a part of a fine root covered in continuous, homogenic mycorrhizal mycelium. The morphology of the mycorrhizae was assessed under a dissecting microscope (NIKON SMZ1000, Tokyo, Japan). The mycorrhizae were then divided into distinct morphotypes, following the rules proposed by Agerer [17,18]. The color of the ectomycorrhizae was evaluated by comparing them to color charts in the hue-saturation-value (HSV) color coordinates system. Each of the ECM clusters was photographed. The root tips were prepared by cutting off 18 equal-size apical fragments from the cluster under a dissecting microscope. To standardize the sample pool, the fragments of all morphotypes were cut to an equal length (3 mm). Each of the prepared 3 mm ectomycorrhizal root tips were individually weighed, and for each taxon, an average fresh mass per root tip was calculated. The mean fresh mass was compared between the samples using an analysis of variance with Tukey’s test. For each isolation, a single root tip was used.
The chosen fungi were selected to represent a wide range of ectomycorrhizal (ECM) fungal diversity. Fungi in the study sample represent Ascomycota (four families in two orders) and Basidiomycota (11 families in six orders) (Table 1). Also, a broad range of morphological forms (Figure 1) is represented.
2.2. Cell Lysis and Lysate Purification
For cell lysis, six approaches were used. They consisted of routinely using mechanical cell wall disruption, a chemical lysis process based on a commercially available reagent set (Extract-N-Amp™ Plant PCR Kit, Sigma, St. Louis, MO, USA) used in laboratory practice [19,20] and enzymatic lysis [14]. Joint methods of mechanical cell disruption and chemical lysis, as well as mechanical cell disruption and enzymatic lysis, were also tested. Additionally, as a point of reference, samples that had not lysed were prepared. The lysis approaches were assigned with roman numerals: I—no lysis; II—mechanical cell disruption; III—chemical lysis; IV—enzymatic lysis; V—combined mechanical and chemical lysis; VI—combined mechanical and enzymatic lysis.
Three approaches to purifying DNA from the cell lysate were evaluated. The classical approach of chloroform extraction [15] and silica surface adsorption, using silica columns from a commercially available DNA isolation kit (GeneMATRIX Plant and Fungi DNA Purification Kit, EURx, Gdansk, Poland) were used to isolate material from the cell lysates. Additionally, as a point of reference, the samples that were not purified were prepared and used for additional assessment and comparison. The purification approaches were assigned with capital letters: A—no purification; B—silica columns purification; C—purification by chloroform extraction.
All of the detailed protocols are presented in the Supplementary Materials (Supplementary protocols).
2.3. Isolation Assessment
The final isolation products were used as a matrix for a PCR reaction (Taq PCR Core Kit, Qiagen, Hilden, Germany). The internal transcribed spacer regions (ITS) 1 and 2, as well as the nuclear ribosomal DNA 5.8S region, were amplified using primers ITS1F and ITS4 [21,22]. PCR was performed using T100 Thermal Cycler (BIO-RAD, Foster City, CA, USA). The PCR protocol details are listed in Table S2. All of the samples were assessed by electrophoresis (1.5% agarose gel, 30 min, 135 V) and grouped according to the species. The gels were pre-dyed with Gel View (Novazym, Poznan, Poland). After electrophoresis, the gels were photographed under UV light (λ = 312 nm) using an Uvitec Gel Documentation System, model D56. The selected samples that had produced visible bands were sent for DNA sequencing to the Laboratory of Molecular Biology at Adam Mickiewicz University.
2.4. Statistical Analysis
A non-parametric Kruskal–Wallis test, followed by a multiple-comparison procedure (p < 0.05), was used to examine the significance of differences between the tested methods of lysis and DNA purification, as well as the differences in efficiency of DNA isolation from Ascomycota and Basidiomycota ectomycorrhizae. A nonparametric Spearman rank-correlation analysis was used to analyze associations between the morphological traits (root tip mass and color) and the number of successful amplifications. Prior to the analyses, the data were log+1 transformed. Statistical analyses were performed using Statistica 9.0 (StatSoft, Tulsa, OK, USA) software.
3. Results
3.1. ECM Root Tip Mass and Morphology
For each fungal species, an average ECM root tip fresh mass was calculated. The lowest fresh mass tips belonged to Elaphomyces muricatus Fr. and the highest fresh mass to Suillus variegatus (Sw.) Richon & Roze. Suillus variegatus (Sw.) Richon & Roze ECM root tips were heavier from all of the other root tips, weighing more than double the second heaviest species, Imleria badia (Fr.) Vizzini, and more than ten times the lightest E. muricatus. The coloration of studied ectomycorrhizae was similar, with all morphotypes having the hue angle between 0°–45° (Table 2).
3.2. PCR Results and DNA Sequencing
Among the PCR products of isolated DNA amplification, 69 samples produced visible bands during electrophoresis and were sent for DNA sequencing. The only approach used to produce a visible band for each fungal species was mechanical and a chemical lysis accompanied by silica columns purification (Figure S1). However, the product of amplifying the Elaphomyces muricatus DNA isolate, prepared in this protocol, could not be successfully sequenced. Out of the 69 samples sent for sequencing, 66 produced identifiable non-heterogenic chromatograms as results (Table S3). Of the three samples left unidentified, two were prepared using the mechanical and chemical lysis with chloroform extraction purification, and one was prepared using mechanical and chemical lysis, with silica columns purification. The lysis method and purification method, that resulted in the most successful amplifications, were the mechanical and chemical lysis (V; 37 successful isolations), and silica columns purification (B; 44 successful isolations), respectively. As expected, the control methods produced the fewest successful amplification products (no lysis (I; 2 successful isolations) and no purification (A; 4 successful isolations)) in their categories respectively (Table 3).
3.3. Statistical Analysis
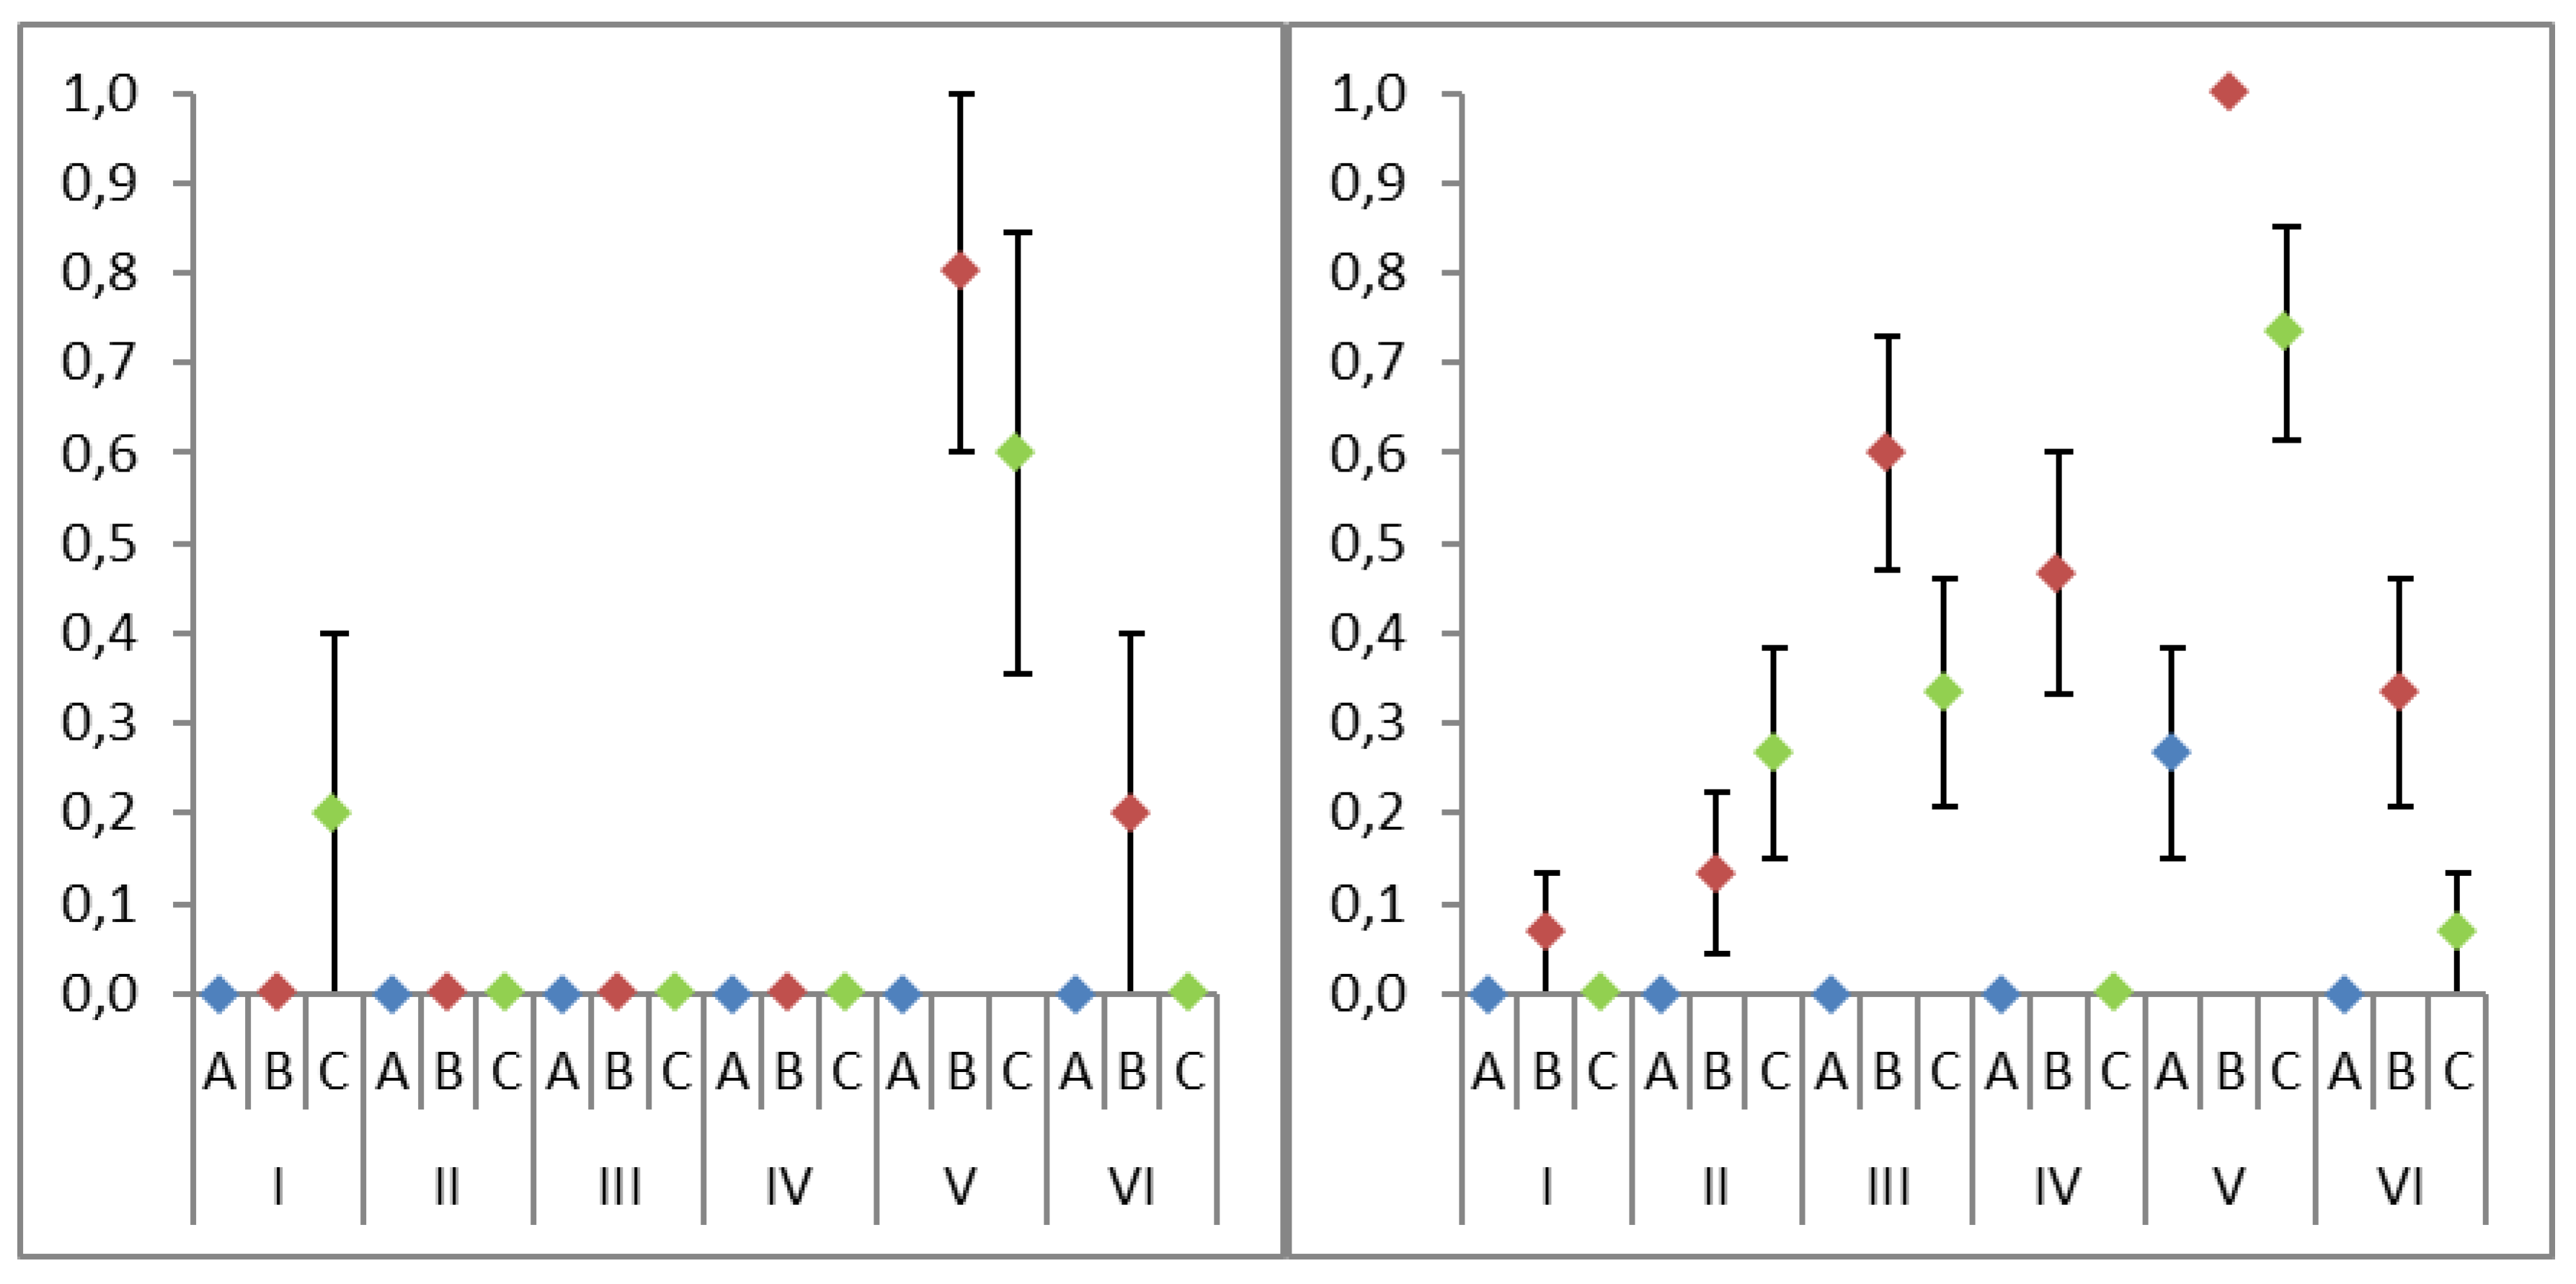
The Kruskal–Wallis test showed statistically significant differences between the tested lysis methods (χ2 = 84.0, p = 0.000) and purification methods (χ2 = 41.3, p = 0.000). Out of the two, the lysis protocol was found to have a stronger effect on the isolation success rate. A significant difference was also found between the success rates of Ascomycota and Basidiomycota ectomycorrhizal DNA isolation (χ2 = 7.8, p < 0.005), with Basidiomycota having a higher success rate for the general isolation (Figure 2).
The nonparametric Spearman rank-correlation analysis indicated that the mass of the ectomycorrhizal root tip, used for isolation did not have a significant effect on the DNA isolation success rate (p > 0.05). Out of the color parameters, saturation was found to have a significantly negative effect on the isolation success rate.
4. Discussion
4.1. The Efficiency of the DNA Isolation Approaches
The study indicates the importance of mechanical cell wall disruption in molecular applications. Material grinding (II) resulted in more successful isolations than the control, with no lysis protocol (I), and grinding and applying the chemical lysis (V), were more efficient than the chemical lysis on its own (III). Mechanical disruption, that is not followed by any other treatment, may result in the secondary metabolites of the cell intercalating and damaging DNA, due to mechanical stress [23], thereby leading to less successful isolations compared to the combined lysis approaches. This coincides with reports in the literature [14], indicating that the highest fungal DNA isolation success rates occur when an initial mechanical disruption is followed by chemical or enzymatic treatment. Plant [23] and fungi [14] grinding is often a necessary step to sufficiently break-down the cell wall, it can be difficult to develop high-throughput applications. For those reasons, further research and development of alternative cell wall disruption techniques would be advised.
Grinding, followed by an enzymatic treatment (VI), was less efficient compared to enzymatic treatment on its own (IV). Moreover, half of the species, where DNA isolation was successful when just the enzymatic treatment was used, did not produce any visible products when the additional grinding step was applied. We conclude this might have been caused by the enzyme being inhibited by the secondary metabolites that were released during the grinding process, alongside the longer incubation time, allowing these substances to react with and degrade the DNA. Although other cell lysis enzyme-based reagents, e.g., zymolyase, are available, they were shown not to differ in efficiency from protease in cell lysis applications [14].
From the compared DNA purification methods, silica adsorption (B) was by far the most efficient. DNA adsorption to silica surface is thought to be caused by two co-occurring mechanisms: van der Waals attractions between the phosphate groups of DNA and silanol groups present on the surface of silica crystals, and hydrophobic attractions between other parts of silica crystal surface and the nucleobases [24]. In normal circumstances, water molecules solvate both the DNA and silica, preventing them from coming close enough for the interactions to occur. To prevent that, chaotropic conditions are applied [24]. This specific interaction allows the removal of both polar and non-polar contaminants from the lysate, as opposed to extraction (C), where the contaminants are discriminated based on their polarity.
Although it is a common laboratory practice [19,25] to use large fragments of clusters or multiple mycorrhizae for isolation in our approach, from each fungal species we were able to extract DNA of quality sufficient for downstream applications from just a single root tip. Since most DNA isolation protocols advise using the material of mass at orders of magnitude higher than the mass of any single mycorrhizae [14,15], proportional downscaling is often impractical. A protocol optimized for use with a single mycorrhiza allows for more potential isolations from the same amount of collected material. Moreover, it leads to increased certainty in the results, as the probability of using morphologically similar mycorrhizae of different fungal species in one isolation is excluded.
4.2. Fungal Diversity as a Factor in DNA Isolation
There is a relationship between the fungi taxonomic status and its observed isolation efficiency. While the taxa of Basidiomycota present a wide range in terms of the DNA isolation ease, the Ascomycota are in general more difficult. Moreover, two of the PCR products (E. muricatus, Pachyploeus sp.) were of a quality insufficient for successful sequencing. Some tendencies for the isolation efficiency within individual orders, like Thelephorales or Boletales, were observed, but due to insufficient sampling on lower taxonomic levels, definitive conclusions should not be drawn.
Our study found the color saturation of ectomycorrhizae, rather than its hue or value, is a predictor of DNA isolation success. While the color hue and value may potentially result from the presence of distinct pigments that could interfere with DNA isolation and downstream reactions [16], e.g., specific subtypes of melanin [9] or thelephoric acid [26], they might not necessarily showcase the amount of the pigments present in the sample. However, changes in the color saturation within the same hue angle are often caused by a different concentration of pigments producing such hue; as such, it is sometimes possible to use it to approximate the pigment concentration in an analyzed material [27]. The mycorrhizae mass did not seem to impact the final isolation results. Further studies focusing on the mycorrhizal physiology, as opposed to morphology, might be highly informative.
5. Conclusions
Differences in the DNA isolation ease were observed between Ascomycota and Basidiomycota. No apparent connection was observed between the mycorrhizae morphology and isolation results. The best approach to DNA isolation from ectomycorrhizae was found to be a combination of mechanical and chemical lysis followed by purification based on silica surface adsorption.
Supplementary Materials
The following are available online at https://www.mdpi.com/1999-4907/10/3/218/s1, Table S1: Overview of geographical origin of used fungal material, including the information about vegetative cover, Table S2: Used PCR protocol, Table S3: Results of sequencing the PCR amplification products of the prepared ectomycorrhizal DNA isolates. The “Used sample” column refers to the sample used, with the first letter referring to the used morphotype, and roman numeral and second letter to the isolation and purification method used respectively. The red color marks samples from which sequencing was unsuccessful. The yellow color marks samples from which DNA of contaminating yeast was isolated. Reference sequences and species hypotheses were assigned in reference to the UNITE database. Figure S1: Electrophoresis results: the columns were loaded with: (L) DNA ladder (peqGOLD 50 bp DNA-Ladder, PEQLAB); and (IA–VIC) PCR products prepared using respective isolation method product as a reaction matrix; the gels (A–T) were prepared with samples from respective fungal taxa, as assigned in the Table 1. Supplementary protocols: Detailed protocols for procedures evaluated in the study.
Author Contributions
Conceptualization, D.J.; methodology, D.J. and T.L.; Formal Analysis, R.W. and L.K.; investigation, D.J. and R.W.; resources, T.L. and M.R.; writing—original draft preparation, D.J.; writing—review and editing, D.J. and M.R.; visualization, D.J. and R.W.; supervision, M.R. and T.L.; funding acquisition, T.L.
Funding
This study was partially supported by the Institute of Dendrology, Polish Academy of Sciences, Kórnik, Poland, by the General Directorate of State Forests, Warsaw, Poland (grant number OR.271.3.17.2017) and the National Science Center, Poland (grant number 2014/13/B/NZ9/01992).
Conflicts of Interest
The authors declare no conflict of interest.
References
- Brundrett, M.C. Mycorrhizal associations and other means of nutrition of vascular plants: Understanding the global diversity of host plants by resolving conflicting information and developing reliable means of diagnosis. Plant Soil 2009, 320, 37–77. [Google Scholar] [CrossRef]
- Wang, B.; Qiu, Y.-L. Phylogenetic distribution and evolution of mycorrhizas in land plants. Mycorrhiza 2006, 16, 299–363. [Google Scholar] [CrossRef] [PubMed]
- Wurzburger, N.; Brookshire, E.N.J.; McCormack, M.L.; Lankau, R.A. Mycorrhizal fungi as drivers and modulators of terrestrial ecosystem processes. New Phytol. 2017, 213, 996–999. [Google Scholar] [CrossRef] [PubMed] [Green Version]
- Read, D.J.; Perez-Moreno, J. Mycorrhizas and nutrient cycling in ecosystems—A journey towards relevance? New Phytol. 2003, 157, 475–492. [Google Scholar] [CrossRef]
- Wu, Q.S. Arbuscular Mycorrhizas and Stress Tolerance of Plants; Wu, Q.-S., Ed.; Springer: Singapore, 2017; ISBN 978-981-10-4114-3. [Google Scholar]
- Boroujeni, D.S.; Hemmatinezhad, B. Review of Application and Importance of Ectomycorrhiza Fungi and their Role in the Stability of Ecosystems. Biosci. Biotechnol. Res. Asia 2015, 12, 153–158. [Google Scholar] [CrossRef]
- Tedersoo, L.; May, T.W.; Smith, M.E. Ectomycorrhizal lifestyle in fungi: Global diversity, distribution, and evolution of phylogenetic lineages. Mycorrhiza 2010, 20, 217–263. [Google Scholar] [CrossRef] [PubMed]
- Tedersoo, L.; Mett, M.; Ishida, T.A.; Bahram, M. Phylogenetic relationships among host plants explain differences in fungal species richness and community composition in ectomycorrhizal symbiosis. New Phytol. 2013, 199, 822–831. [Google Scholar] [CrossRef] [PubMed] [Green Version]
- Fernandez, C.W.; Langley, J.A.; Chapman, S.; McCormack, M.L.; Koide, R.T. The decomposition of ectomycorrhizal fungal necromass. Soil Biol. Biochem. 2016, 93, 38–49. [Google Scholar] [CrossRef] [Green Version]
- Sevag, M.G. A new physical de-proteination method for representation of biologically effective substances-isolation of carbohydrates in chicken-protein and pneumococci. Biochem. Z. 1934, 273, 419–429. [Google Scholar]
- Sevag, M.G.; Lackman, D.B.; Smolens, J. The Isolation of the Components of Streptococcal Nucleoproteins in serologically Active Form. J. Biol. Chem. 1938, 124, 425–436. [Google Scholar]
- Boom, R.; Sol, C.J.A.; Salimans, M.M.M.; Jansen, C.L.; Wertheim-Van Dillen, P.M.E.; Van Der Noordaa, J. Rapid and simple method for purification of nucleic acids. J. Clin. Microbiol. 1990, 28, 495–503. [Google Scholar] [PubMed]
- Manian, S.; Sreenivasaprasad, S.; Mills, P.R. DNA extraction method for PCR in mycorrhizal fungi. Lett. Appl. Microbiol. 2001, 33, 307–310. [Google Scholar] [CrossRef] [PubMed] [Green Version]
- Karakousis, A.; Tan, L.; Ellis, D.; Alexiou, H.; Wormald, P.J. An assessment of the efficiency of fungal DNA extraction methods for maximizing the detection of medically important fungi using PCR. J. Microbiol. Methods 2006, 65, 38–48. [Google Scholar] [CrossRef] [PubMed]
- Rezadoost, M.H.; Kordrostami, M.; Kumleh, H.H. An efficient protocol for isolation of inhibitor-free nucleic acids even from recalcitrant plants. 3 Biotech 2016, 6, 61. [Google Scholar] [CrossRef] [PubMed]
- Schrader, C.; Schielke, A.; Ellerbroek, L.; Johne, R. PCR inhibitors-occurrence, properties and removal. J. Appl. Microbiol. 2012, 113, 1014–1026. [Google Scholar] [CrossRef] [PubMed]
- Agerer, R. Studies on Ectomycorrhizae. II. Introducing remarks on characterization and identification. Mycotaxon 1986, 26, 473–492. [Google Scholar]
- Agerer, R. Colour Atlas of Ectomycorrhizae, 15th ed.; Agerer, R., Ed.; Einhorn-Verlag: Schwäbisch Gmünd, Germany, 2012; ISBN 3-921703-77-8. [Google Scholar]
- Dickie, I.A.; Richardson, S.J.; Wiser, S.K. Ectomycorrhizal fungal communities and soil chemistry in harvested and unharvested temperate Nothofagus rainforests. Can. J. For. Res. 2009, 39, 1069–1079. [Google Scholar] [CrossRef]
- Richard, F.; Roy, M.; Shahin, O.; Sthultz, C.; Duchemin, M.; Joffre, R.; Selosse, M.-A. Ectomycorrhizal communities in a Mediterranean forest ecosystem dominated by Quercus ilex: Seasonal dynamics and response to drought in the surface organic horizon. Ann. For. Sci. 2011, 68, 57–68. [Google Scholar] [CrossRef]
- White, T.; Bruns, T.D.; Lee, S.; Taylor, J. Amplification and Direct Sequencing of Fungal Ribosomal RNA Genes for Phylogenetics. PCR Protocols 1990, 18, 315–322. [Google Scholar]
- Gardes, M.; Bruns, T.D. ITS primers with enhanced specificity for basidiomycetes—Application to the identification of mycorrhizae and rusts. Mol. Ecol. 1993, 2, 113–118. [Google Scholar] [CrossRef] [PubMed]
- Varma, A.; Padh, H.; Shrivastava, N. Plant genomic DNA isolation: An art or a science. Biotechnol. J. 2007, 2, 386–392. [Google Scholar] [CrossRef] [PubMed]
- Shi, B.; Shin, Y.K.; Hassanali, A.A.; Singer, S.J. DNA Binding to the Silica Surface. J. Phys. Chem. B 2015, 119, 11030–11040. [Google Scholar] [CrossRef] [PubMed]
- Wang, L.; Katzensteiner, K.; Schume, H.; Van Loo, M.; Godbold, D.L. Potassium fertilization affects the distribution of fine roots but does not change ectomycorrhizal community structure. Ann. For. Sci. 2016, 73, 691–702. [Google Scholar] [CrossRef] [Green Version]
- Bresinsky, A.; Rennschmid, A. Pigmentmerkmale, Organisationsstufen und systematische Gruppen bei Hoheren Pilzen. Ber. Dtsch. Bot. Ges. 1971, 84, 313–329. [Google Scholar]
- Vega Gutierrez, S.M.; Van Court, R.C.; Stone, D.W.; Konkler, M.J.; Groth, E.N.; Robinson, S.C. Relationship between Molarity and Color in the Crystal (‘Dramada’) Produced by Scytalidium cuboideum, in Two Solvents. Molecules 2018, 23, 2581. [Google Scholar] [CrossRef] [PubMed]
Figure 1.
The photographed ectomycorrhizae of taxa used in the study. (A) Elaphomyces muricatus Fr.; (B) Pachyphloeus sp.; (C) Genea hispidula Berk. ex Tul. & C. Tul.; (D) Humaria hemisphaerica (F.H. Wigg.) Fuckel; (E) Tuber puberulum Berk. & Broome; (F) Amanita rubescens Pers.; (G) Cortinarius torvus (Fr.) Fr.; (H) Laccaria amethystina Cooke; (I) Piloderma sphaerosporum Jülich; (J) Imleria badia (Fr.) Vizzini; (K) Xerocomellus cisalpinus (Simonini, H. Ladurner & Peintner) Klofac; (L) Paxillus involutus (Batsch) Fr.; (M) Suillus variegatus (Sw.) Richon & Roze; (N) Craterellus cornucopioides (L.) Pers.; (O) Clavulina coralloides (L.) J. Schröt; (P) Lactarius aurantiacus (Pers.) Grey; (Q) Russula nigricans Fr.; (R) Tomentella sp.1; (S) Tomentella sp.2; (T) Tomentella terrestris (Berk. & Broome) M.J. Larsen.

Figure 2.
The average DNA isolation success rate of compared lysis (I–VI) and purification methods (A–C). The vertical bars represent standard error (SE).
Figure 2.
The average DNA isolation success rate of compared lysis (I–VI) and purification methods (A–C). The vertical bars represent standard error (SE).


Table 1.
Fungal taxa used for the study. Letters in the first column (A–T) were assigned to the taxa for further reference.
Table 1.
Fungal taxa used for the study. Letters in the first column (A–T) were assigned to the taxa for further reference.
| Species | Family | Order | Division | |
|---|---|---|---|---|
| A | Elaphomyces muricatus | Elaphomycetaceae | Eurotiales | Ascomycota |
| B | Pachyphloeus sp. | Pezizaceae | Pezizales | Ascomycota |
| C | Genea hispidula | Pyronemataceae | Pezizales | Ascomycota |
| D | Humaria hemisphaerica | Pyronemataceae | Pezizales | Ascomycota |
| E | Tuber puberulum | Tuberaceae | Pezizales | Ascomycota |
| F | Amanita rubescens | Amanitaceae | Agaricales | Basidiomycota |
| G | Cortinarius torvus | Cortinariaceae | Agaricales | Basidiomycota |
| H | Laccaria amethystina | Hydnangiaceae | Agaricales | Basidiomycota |
| I | Piloderma sphaerosporum | Atheliaceae | Atheliales | Basidiomycota |
| J | Imleria badia | Boletaceae | Boletales | Basidiomycota |
| K | Xerocomellus cisalpinus | Boletaceae | Boletales | Basidiomycota |
| L | Paxillus involutus | Paxillaceae | Boletales | Basidiomycota |
| M | Suillus variegatus | Suillaceae | Boletales | Basidiomycota |
| N | Craterellus cornucopioides | Cantharellaceae | Cantharellales | Basidiomycota |
| O | Clavulina coralloides | Clavulinaceae | Cantharellales | Basidiomycota |
| P | Lactarius aurantiacus | Russulaceae | Russulales | Basidiomycota |
| Q | Russula nigricans | Russulaceae | Russulales | Basidiomycota |
| R | Tomentella sp.1 | Thelephoraceae | Thelephorales | Basidiomycota |
| S | Tomentella sp.2 | Thelephoraceae | Thelephorales | Basidiomycota |
| T | Tomentella terrestris | Thelephoraceae | Thelephorales | Basidiomycota |
Table 2.
Morphological traits of the studied ectomycorrhizal root tips: average fresh mass of the ectomycorrhizal root tip and color hue-saturation-value (HSV) coordinates. The letters (A–T) represent respective taxa as described in the Table 1.
Table 2.
Morphological traits of the studied ectomycorrhizal root tips: average fresh mass of the ectomycorrhizal root tip and color hue-saturation-value (HSV) coordinates. The letters (A–T) represent respective taxa as described in the Table 1.
| Species | Mass ± SD (g × 10−5) | Color | ||||
|---|---|---|---|---|---|---|
| Hue (°) | Saturation (%) | Value (%) | ||||
| A | Elaphomyces muricatus | 0.833 ± | 0.111 f * | 30 | 60 | 80 |
| B | Pachyphloeus sp. | 1.333 ± | 0.043 ef | 30 | 55 | 75 |
| C | Genea hispidula | 1.417 ± | 0.283 e | 30 | 65 | 65 |
| D | Humaria hemisphaerica | 1.944 ± | 0.053 de | 25 | 70 | 65 |
| E | Tuber puberulum | 1.028 ± | 0.086 f | 45 | 70 | 95 |
| F | Amanita rubescens | 2.056 ± | 0.411 de | 15 | 40 | 75 |
| G | Cortinarius torvus | 0.861 ± | 0.084 f | 40 | 40 | 80 |
| H | Laccaria amethystina | 1.694 ± | 0.261 de | 25 | 40 | 80 |
| I | Piloderma sphaerosporum | 3.472 ± | 1.157 c | 20 | 70 | 85 |
| J | Imleria badia | 4.500 ± | 0.811 b | 30 | 35 | 85 |
| K | Xerocomellus cisalpinus | 2.806 ± | 0.401 d | 30 | 35 | 80 |
| L | Paxillus involutus | 0.972 ± | 0.210 ef | 25 | 50 | 75 |
| M | Suillus variegatus | 9.556 ± | 2.415 a | 20 | 55 | 70 |
| N | Craterellus cornucopioides | 2.556 ± | 0.333 de | 40 | 40 | 85 |
| O | Clavulina coralloides | 1.389 ± | 0.231 e | 30 | 15 | 60 |
| P | Lactarius aurantiacus | 1.500 ± | 0.134 de | 45 | 75 | 95 |
| Q | Russula nigricans | 2.667 ± | 0.064 de | 25 | 50 | 75 |
| R | Tomentella sp.1 | 2.528 ± | 0.139 de | 0 | 25 | 45 |
| S | Tomentella sp.2 | 3.528 ± | 0.044 c | 0 | 5 | 30 |
| T | Tomentella terrestris | 1.444 ± | 0.076 e | 20 | 40 | 70 |
* different letters indicate significant differences between species at p < 0.05 (Tukey’s test).
Table 3.
The number of successful transcribed spacer regions (ITS) amplifications of isolates prepares with specific lysis and purification protocols, based on the DNA sequencing of the final reaction product. The total number (100%) of samples was 20, which included 5 Ascomycota and 15 Basidiomycota samples.
| Lysis | Purification | Number of Successful Ascomycota Amplifications | Number of Successful Basidiomycota Amplifications | Total Number of Successful Amplifications |
|---|---|---|---|---|
| I | A | 0 (0%) | 0 (0%) | 0 (0%) |
| B | 0 (0%) | 1 (7%) | 1 (5%) | |
| C | 1 (20%) | 0 (0%) | 1 (5%) | |
| II | A | 0 (0%) | 0 (0%) | 0 (0%) |
| B | 0 (0%) | 2 (13%) | 2 (10%) | |
| C | 0 (0%) | 4 (27%) | 4 (20%) | |
| III | A | 0 (0%) | 0 (0%) | 0 (0%) |
| B | 0 (0%) | 9 (60%) | 9 (45%) | |
| C | 0 (0%) | 5 (33%) | 5 (25%) | |
| IV | A | 0 (0%) | 0 (0%) | 0 (0%) |
| B | 0 (0%) * | 7 (47%) | 7 (35%) * | |
| C | 0 (0%) | 0 (0%) | 0 (0%) | |
| V | A | 0 (0%) | 4 (27%) | 4 (20%) |
| B | 4 (80%) * | 15 (100%) | 19 (95%) * | |
| C | 3 (60%) * | 11 (73%) * | 14 (70%) * | |
| VI | A | 0 (0%) | 0 (0%) | 0 (0%) |
| B | 1 (20%) | 5 (33%) | 6 (30%) | |
| C | 0 (0%) | 1 (7%) | 1 (5%) |
* the marked values indicate, that additional samples produced visible bands in electrophoresis, however could not be successfully sequenced.
© 2019 by the authors. Licensee MDPI, Basel, Switzerland. This article is an open access article distributed under the terms and conditions of the Creative Commons Attribution (CC BY) license (http://creativecommons.org/licenses/by/4.0/).
Share and Cite
MDPI and ACS Style
Janowski, D.; Wilgan, R.; Leski, T.; Karliński, L.; Rudawska, M. Effective Molecular Identification of Ectomycorrhizal Fungi: Revisiting DNA Isolation Methods. Forests 2019, 10, 218. https://doi.org/10.3390/f10030218
AMA Style
Janowski D, Wilgan R, Leski T, Karliński L, Rudawska M. Effective Molecular Identification of Ectomycorrhizal Fungi: Revisiting DNA Isolation Methods. Forests. 2019; 10(3):218. https://doi.org/10.3390/f10030218
Chicago/Turabian StyleJanowski, Daniel, Robin Wilgan, Tomasz Leski, Leszek Karliński, and Maria Rudawska. 2019. "Effective Molecular Identification of Ectomycorrhizal Fungi: Revisiting DNA Isolation Methods" Forests 10, no. 3: 218. https://doi.org/10.3390/f10030218
Note that from the first issue of 2016, this journal uses article numbers instead of page numbers. See further details here.