Climate Response of Douglas Fir Reveals Recently Increased Sensitivity to Drought Stress in Central Europe


Department of Forest Ecology, Forestry and Game Management Research Institute, Strnady 136, 252 02 Jíloviště, Czech Republic
*
Author to whom correspondence should be addressed.
Forests 2019, 10(2), 97; https://doi.org/10.3390/f10020097
Submission received: 27 December 2018
/
Revised: 22 January 2019
/
Accepted: 22 January 2019
/
Published: 25 January 2019
(This article belongs to the Section Forest Ecology and Management)
Abstract
:Research Highlights: In Central Europe, Douglas fir became more responsive to summer drought in recent years. Background and Objectives: Until now, Douglas fir has been considered a tree species resistant to drought. However, how Douglas fir will be able to cope with the increasing frequency and intensity of summer heat waves remains a question. The long-term variability in the climate response of Douglas fir in Central European conditions has not been fully explored. The aim of the study was to identify climatic factors controlling the stem radial growth of Douglas fir and Norway spruce, and to examine the temporal changes in tree responses to key climatic variables related to drought stress. Materials and Methods: We analysed the pattern of the climate–growth relationship of Douglas fir and Norway spruce, growing in mixed stands distributed between 260 and 600 m above sea level, which corresponds with the altitudinal zone of intensive spruce dieback in the Czech Republic. Nine-site tree-ring-width chronologies were developed for each tree species. Pointer year analysis and correlation analysis in combination with principal component analysis were used to identify climatic factors limiting their growth. Moving correlation function was computed to assess temporal changes of the climate–growth relationship. Results: In the entire 1961–2015 period, growth of both species was positively related to summer precipitation. The response to temperature differed between species. While spruce was negatively affected by the temperatures in summer months, the increments of Douglas fir were positively correlated with the temperatures in February and March. However, moving correlation analysis revealed recently increasing sensitivity to summer temperatures also for Douglas fir. Higher responsiveness of Douglas fir to drought was also revealed by the increasing frequency of negative pointer years in the 2003–2015 period. Conclusions: The recommendations of Douglas fir as a suitable alternative tree species for declining spruce stands at lower altitudes must be regarded with caution.
1. Introduction
Douglas fir (Pseudotsuga menziesii [Mirb.] Franco) is an important introduced tree species in Europe. In contrast to the inland variety Pseudotsuga menziesii var. glauca, the coastal variety Pseudotsuga menziesii var. menziesii was found to be suitable for European forests [1,2]. High growth rates [3,4,5], good wood quality [6], resistance against fungal pathogens and low numbers of pests and diseases [7] are factors that have contributed to the current widespread distribution of Douglas fir in European forests [8]. This tree’s value in the coming years is likely to increase further [9,10]. In Central Europe, the foresters are interested in Douglas fir as a tree species that, due to its higher resilience to water deficit, could partially replace spruce in the lower altitudes and; thereby, mitigate economic and production losses caused by an extensive decline of spruce stands [11,12,13].
Douglas fir is more resistant to drought than spruce [14,15] and is sometimes called "dry spruce” (Trockenfichte). This is because of its massive root system [16], abundant leaf waxes and effective stomatal control mechanism [17], and its high resistance to cavitation [18]. However, studies of Douglas fir within its natural range (north-western United States) have shown that a reduction in water availability limits its growth more than the temperature or the length of the growing season [19]. In addition, a study by Sergent et al. [20] from two regions of France recently revealed a significant growth reduction and dieback of Douglas fir trees due to soil moisture deficit after an extremely dry summer in 2003.
Trnka et al. [21] monitored the occurrence of drought in Central Europe in the 1961–2014 period. The highest increase in drought episodes was recently recorded in the continental region at altitudes from 200–600 metres above sea level (m a.s.l.). Climate change projections suggest that hot and dry waves will become even more frequent and intense in Europe in the future [22,23]. These climatic phenomena; therefore, appear to be potentially damaging to Douglas fir growth. However, the long-term variability in climate sensitivity of Douglas fir in Central European conditions has not been fully explored.
For this study, we analysed the pattern of the climate–growth relationship of Douglas fir and Norway spruce, growing in mixed stands distributed between 260 and 600 m a.s.l., which corresponds with the altitudinal zone of intensive spruce dieback in recent years. The aim of the study was to identify climatic factors controlling the stem radial growth of both tree species, and to examine the temporal changes in tree response to key climatic variables related to drought stress. We hypothesized that not only spruce, but also Douglas fir, are more affected by summer droughts with the increasing frequency and intensity of drought episodes in recent years. The results of this study may be useful in management decisions related to an alternative tree species composition for declining spruce stands at lower altitudes.
2. Materials and Methods
2.1. Study Sites and Data Collection
Our study was performed in the Opočno, Písek and Prostějov regions of the Czech Republic (Figure 1), where Douglas fir was introduced in the forest stands at the turn of the 19th and 20th centuries. Unfortunately, the majority of mature Douglas fir stands in the Czech Republic, as well as those in much of Europe, are of unknown origin, and their provenance can only be determined roughly according to the scarce data on the import of seeds [24]. Because we do not have any information about the origin of the stands included in this study, the effect of provenance on growth performance cannot be evaluated. In each region, three mixed stands, composed of Douglas fir (Pseudotsuga menziesii (Mirbel) Franco) and Norway spruce (Picea abies (L.) Karst.), were selected at sites with typical conditions. While poor, acidic sites prevail at Opočno, nutrient-medium or nutrient-rich sites are more common at Písek and Prostějov (Table 1). All stands are located between 260–600 m a.s.l. The lower sites at Opočno and Písek belong to the colline and upper-colline vegetation belt [25]. The sites are characterized by mean annual temperatures of 9.1 °C and 8.1 °C and total annual precipitations of 605 and 572 mm, respectively. Prostějov sites are located in the submontane belt with a mean annual temperature of 6.7 °C and a sum of annual precipitation of 651 mm. Climatic data were obtained from the representative meteorological stations in given regions: Hradec Králové (Opočno region, 278 m a.s.l.), Vráž (Písek region, 433 m a.s.l.) and Protivanov (Prostějov region, 670 m a.s.l.) (Figure 1). Mean monthly temperatures and mean monthly precipitation sums are depicted in climate diagrams of individual meteorological stations (Figure 2). All climatic characteristics were calculated for the recent climatic normal for the period 1981–2010.
Increment cores were taken during 2016 and 2017. At least 20 dominant or co-dominant trees per tree species were selected at each stand; thus, we obtained two tree sets for each site. Two cores per tree were taken at breast height (1.3 m above ground). To avoid compression wood, core sampling was performed along the contour line.
2.2. Data Processing and Chronology Development
Tree-ring widths (TRWs) were measured to an accuracy of 0.01 mm, using the VIAS TimeTable measuring stage, and were subsequently visually cross-dated and statistically verified using the PAST 4 [27] and COFECHA programmes [28,29]. The anomalies in tree-ring formation, such as partly and completely missing rings, were detected during this stage [30]. The basic statistics of raw TRW series, such as the proportion of missing rings, the average correlation with master chronology, mean sensitivity (a measure of the annual variability in tree rings), mean (a statistic referring to the signal strength throughout the chronology) and the first-order autocorrelation in the series (a measure of the association between growth in the previous year and that in the current year) were then computed (Table 1). The raw TRW data are provided in data file: Supplementary data file: S1_Tree-ring data.
Individual TRW series were detrended using standard dendrochronological methods [30]. A cubic smoothing spline, with a 50% frequency cut-off at 78 years, was fitted to each series to preserve high frequency (inter-annual) variations for climate–growth analysis [31]. The spline length corresponds to the mean segment length of all tree sets. The remaining autocorrelation was eliminated by autoregressive modelling in ARSTAN software [32]. The resulting residual chronologies were aggregated in site-species-level chronologies by calculating the bi-weight robust means. Mean sensitivity and expressed population signal (EPS) were derived for each chronology (Table 1). EPS quantifies the degree to which a particular sample chronology portrays the hypothetically perfect chronology, which may in turn be regarded as the potential climate signal [33].
Hierarchical cluster analysis (Ward`s method, Euclidean distances) was used to reveal the similarity in growth pattern among residual chronologies for the common period of 1961–2015. In addition, the principal component analysis (PCA) [34] was applied to the same data matrix to assess the common signal captured in the main components of variance. Higher common variance indicates a greater climatic influence on tree growth [35].
2.3. Growth–Climate Relationship
The climatic data for the growth–climate response analysis were obtained from representative meteorological stations located in the same region as the sample sites (Figure 1). Mean monthly temperatures and monthly precipitation sums were available at all stations for the period of 1961–2015. Pointer year analysis and correlation analysis in combination with PCA were used to study the climate–growth relationship. Pointer year analysis identifies climatic factors causing acute stress to trees; the correlation analysis reveals those factors that have a long-term impact on growth. PCA was applied to uncover patterns in growth response dependent on the tree species and region.
Pointer years were evaluated for each tree set truncated at a minimum sample replication of 15 trees. For each tree, the negative event years were defined as extremely narrow rings for which TRW reduction was 40% or greater, compared with the average value of TRW in the previous four years [36]. A negative pointer year occurred when an event year was identified for at least 30% of trees within the set. The occurrence of pointer years was evaluated for the period common to all sets of trees (i.e., 1961–2015). The differences in the frequencies of pointer years were tested by two-way ANOVA, using “tree species” and “region” as the independent variables. The strength of negative pointer years was determined on a species–region basis following the hierarchy of clusters at the final level of branching of the dendrogram. The values of relative growth change (RGC), expressed as the ratio of TRW to the mean TRW of previous four years, were calculated for every single tree ring in the period 1961–2015. In each region the mean annual RGC values were computed for a given tree species. After z-transformation of RGC series, the strength of growth changes was evaluated using the following thresholds: z = −1 for a weak, z = −1.28 for a strong and z = −1.645 for an extreme negative pointer year, corresponding to the lower 16%, 10% and 5% quantile, respectively, of the standard normal distribution [37].
Long-term growth–climate relationships were evaluated for each tree set using a simple correlation analysis (Pearson`s correlation coefficient) in the period 1961–2015. Monthly climatic variables entered the analysis in sequence from April of the previous year to August of the current year (i.e., the observation year for growth parameters). With the exception of monthly data, we also selected seasonal values (mean temperature, February–March and June–August; sum of precipitation, April–August and June–August) to determine correlation with TRW indices.
PCA was performed to elucidate the structure and the linkages in the correlation matrices that resulted from previous analysis. The PCA was run separately for the matrix of growth–temperature and growth–precipitation correlations, respectively. The significant principal components were selected in accordance with Kaiser’s rule (i.e., an eigenvalue > 1) [38].
Due to ongoing climate change, the growth–climate relationship may be variable. To assess temporal stability, we computed the moving correlations [35]. The method is based on progressively shifting the period of a fixed number of years across time to compute the correlation coefficients. In this study, we chose a window of 25 years, which corresponds to approximately half of the period length for which climatic data was available. Standardized TRWs were gradually correlated to selected seasonal climatic values, such as the mean temperatures and the sum of precipitation during the peak growing season (June–August), starting with the 1962–1986 period.
3. Results
3.1. TRW Chronologies
The mean TRWs of Douglas fir exceeded those of spruce at all sites investigated (Table 1). The ages of Douglas fir and Norway spruce were comparable at all sites; therefore, it was possible to compare production of both tree species for the given site conditions. Missing rings occurred infrequently in the series of both species. For Douglas fir, the failure in ring formation was identified in the 1952–1957 and 1976–1979 periods; for spruce it was later, during the early- to mid-1990s and then from 2010–2015. Higher values of mean sensitivity for spruce at Opočno and Písek indicated a higher year-to-year variability at these sites. On the other hand, in the Prostějov region, the mean sensitivities of spruce and Douglas fir were similar. The signal strength throughout the chronology, as expressed by the high values of rbar statistic, points to the climatic control of Douglas fir and spruce growth. High first order autocorrelation suggests that the growth of both tree species in the current year was strongly influenced by conditions in the preceding year. All tree sets had EPS values above 0.85. TRW chronologies of Douglas fir and spruce showed synchronous year-to-year fluctuations within the given region, as well as between different regions; however, the variability of spruce TRWs were higher than those of Douglas fir (Figure 3).
At the final level of branching, cluster analysis assorted the chronologies according to their affiliation to the tree species and region (Figure 4). The only exception was the PI3-Df set, which was clustered with Douglas fir from Prostějov. Nevertheless, four larger groups can be distinguished within the hierarchical tree: (1) most of the Douglas-fir sets, (2) spruce from Prostějov, (3) spruce from Opočno and (4) spruce and two sets of Douglas fir from Písek. It is interesting that the Douglas-fir chronologies showed closer linkages across different regions than those of spruce.
The PCA revealed that TRW chronologies were relatively similar. The common signal captured in the first PCA axis (PC1) was 56% (Figure 5a). The second PCA axis (PC2) divided chronologies into two groups according to the tree species. The first two principal components accounted for 68% of the total variability in the data. PCA loadings on axis three were differentiated mainly by region (Figure 5b); however, the contribution of that axis to the description of the overall variance in the data was small (9%).
3.2. Growth–Climate Relationship
By the end of the 1970s, the occurrence of negative pointer years for Douglas fir and spruce was comparable (Figure 6a). Since the 1980s, the frequency of negative pointer years increased for spruce sets. However, after 2003, an increase in the occurrence of pointer years is evident also for Douglas fir. Negative pointer years common to more than 50% of spruce sets were identified in 1962, 1992, 1993, 2003, 2004 and 2015; for Douglas fir they were identified only in 1976. In the entire period 1961–2015, spruce showed a higher frequency of pointer years than Douglas fir in all regions investigated. The highest frequency was recorded in the Písek region, both for spruce and Douglas fir. At Písek and Opočno, the difference in the frequency of pointer years between Douglas fir and spruce was significant. The evaluation of pointer year strength revealed increased extremity of growth changes for spruce after 1992, with the most prominent shift in the Prostějov region (Figure 6b).
The results of correlation analysis showed that there were differences between Douglas fir and spruce in their response to temperatures. While the increments of Douglas fir were positively related to the temperatures in February and March of the current year, spruce was most affected by the temperatures during the peak growing season (June–August). Both Douglas fir and spruce responded negatively to high temperatures in September of the previous year (Figure 7a). Both tree species had a positive relationship to the precipitation in July and to the rainfall totals in the summer months of June–August (Figure 7b). At the Opočno and Písek sites, the precipitation in the entire vegetation season (April–August) also significantly affected the growth.
The PCA biplots clearly showed the pattern of the climate–growth relationships of Douglas fir and spruce in different regions (Figure 8). PCA revealed a strong common signal in the temperature–growth relationship (Figure 8a). All TRW chronologies were scattered in quadrants I and IV, indicating their positive correlations with the first PCA axis, which explained 79% of the total variability. The second PCA axis divided chronologies into two groups according to the tree species. PCA confirmed the limitations of spruce growth by summer temperatures, while Douglas fir growth was related more to temperatures in February and March. No differences in temperature response were detected among the regions. Different patterns were observed for the precipitation–growth relationship (Figure 8b). The common signal in the precipitation–growth relationship was slightly weaker when compared to that of temperature. PC1 accounted for 69% of the total variability. The plot of PC1 against PC2 revealed two distinct clusters of TRW chronologies, reflecting regional differences. TRW chronologies from Písek were clearly separated from those from Opočno and Prostějov. The growth of both tree species at all sites was positively related to the summer rainfalls; however, for trees at the Opočno and Prostějov sites, the limitation by precipitation amounts in March of the current year and the previous December was also obvious.
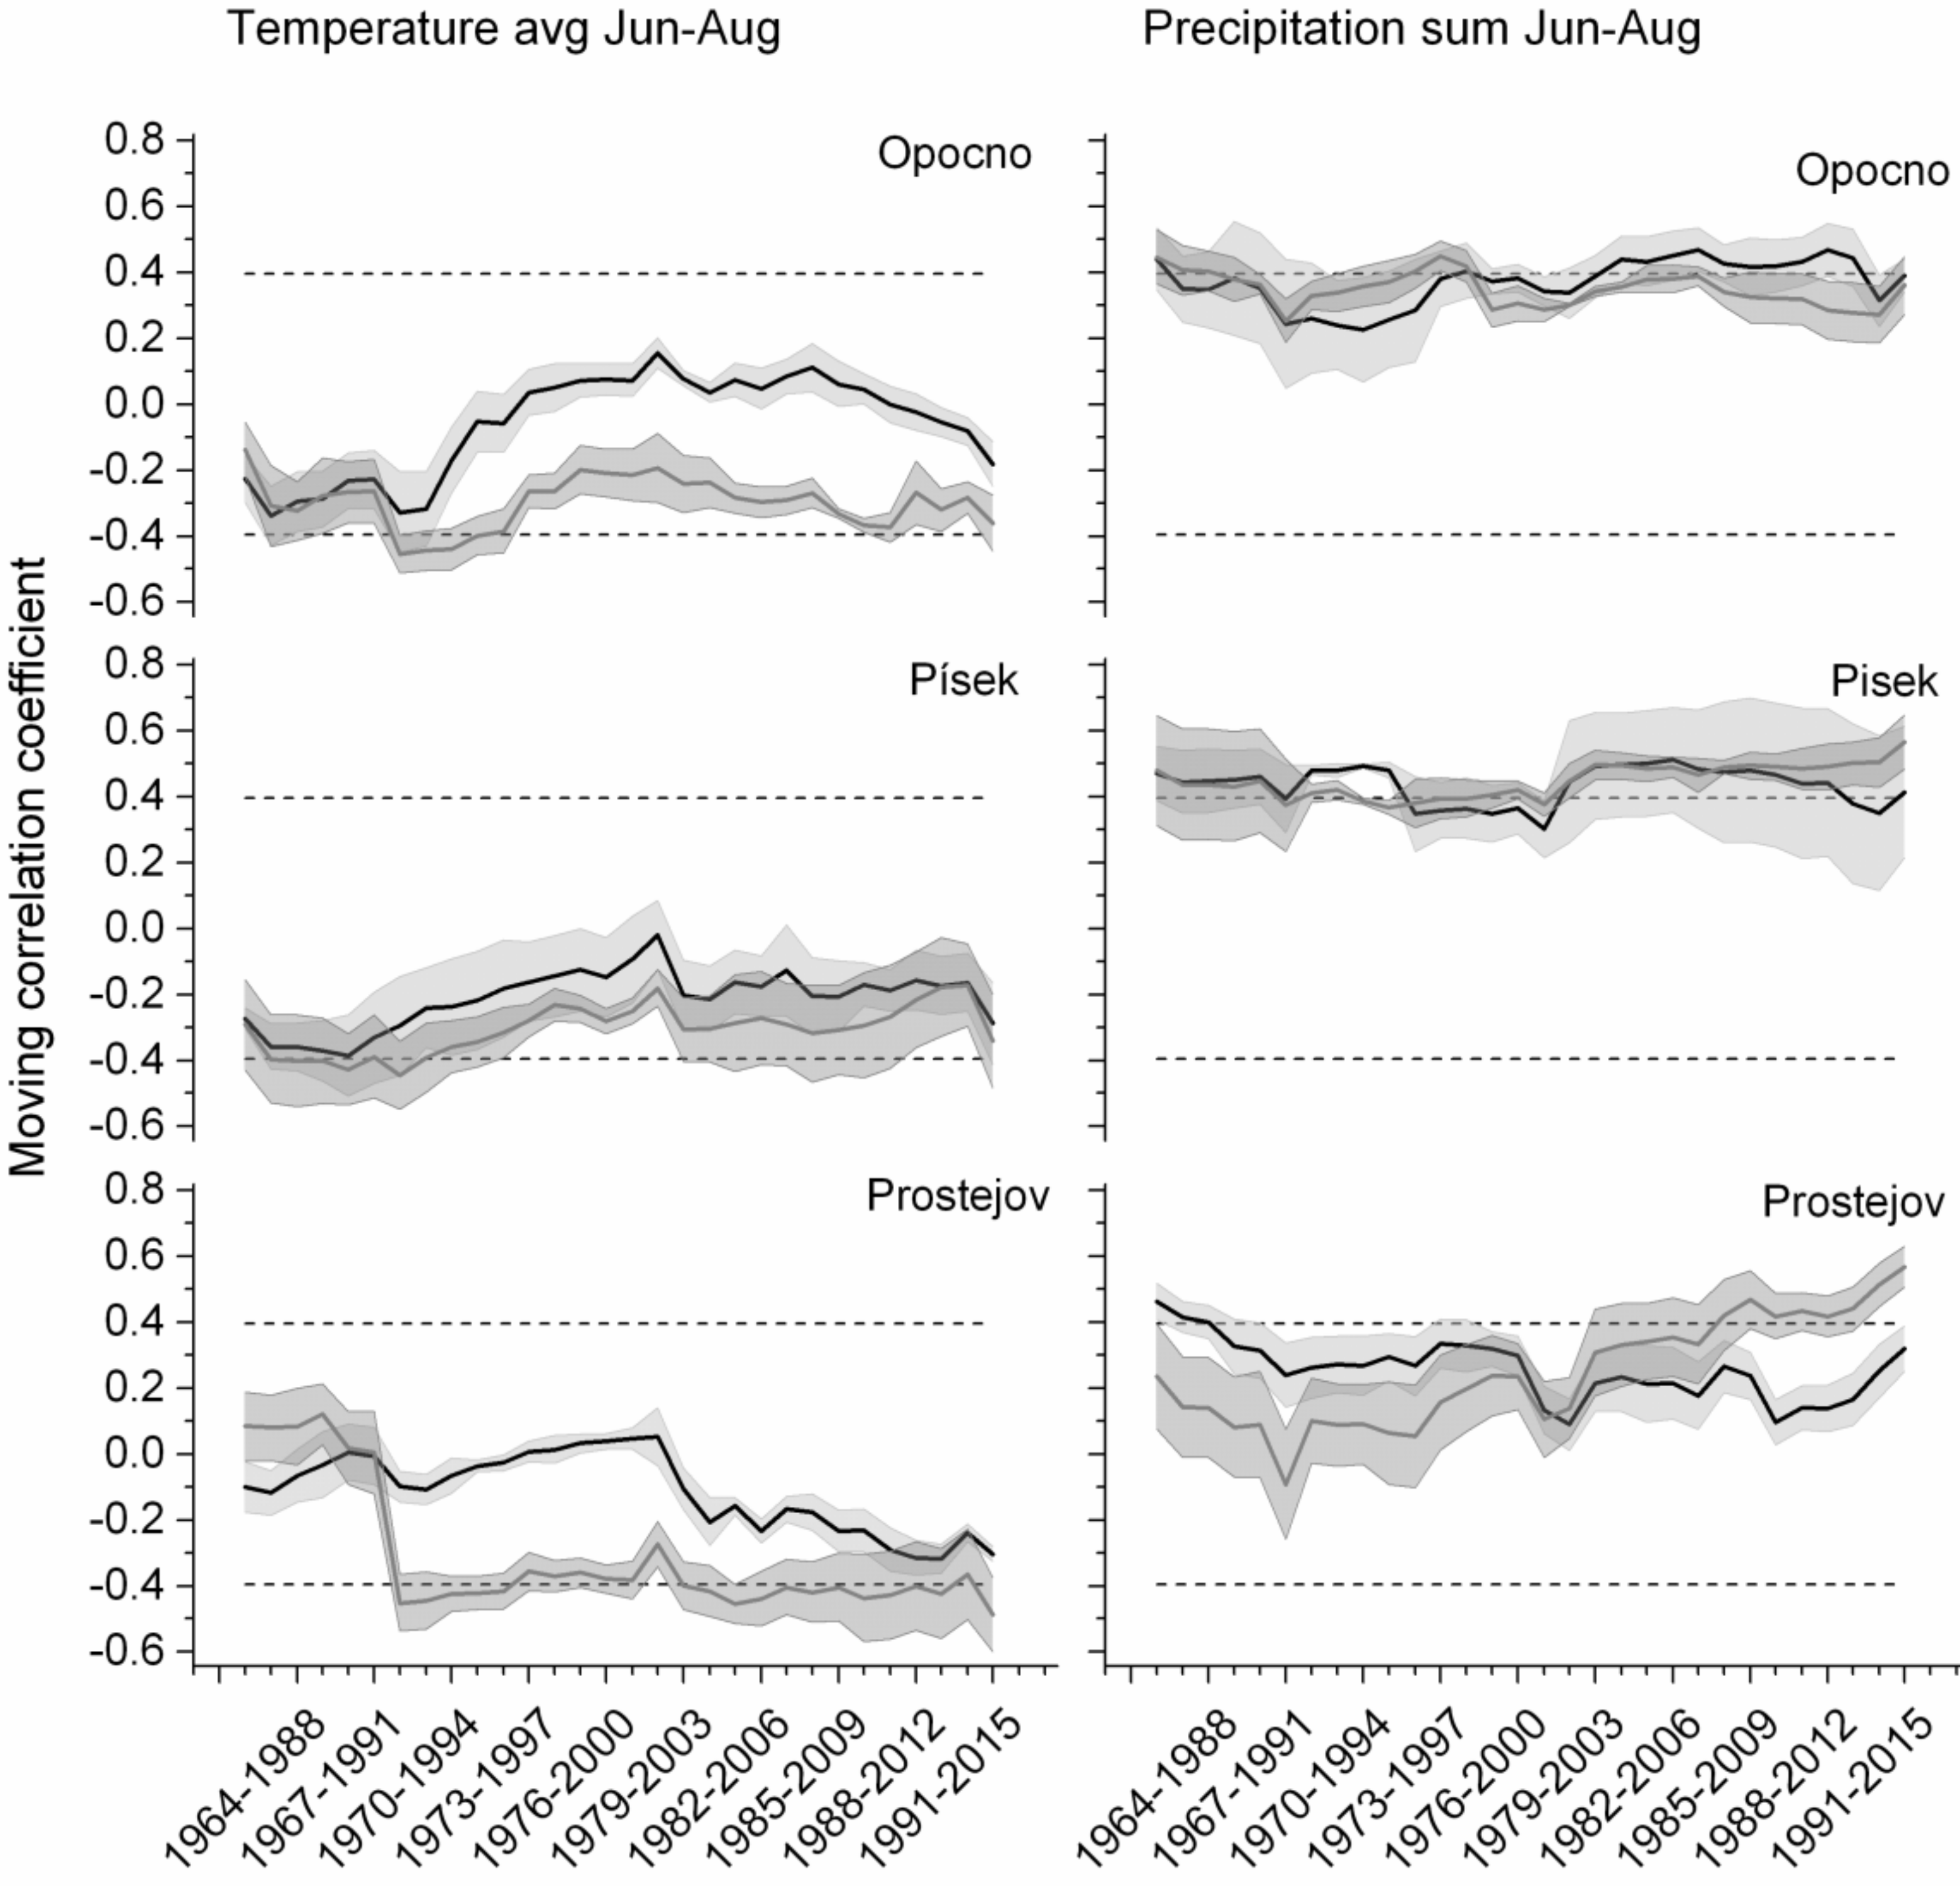
The temporal stability of the climate–growth relationship was studied using moving correlations. Except for the relations with summer temperatures and summer rainfalls (Figure 9), all statistically significant relationships proved to be stable over time for both tree species. At the Opočno sites, spruce was significantly and constantly affected by summer temperatures (negative correlation) as well as summer precipitation (positive correlation). Douglas fir seemed to be less responsive to summer temperatures, although, starting with the period 1984–2008, the negative effect of temperatures began to increase (the value of correlation coefficient steadily decreased). Similarly, to spruce, the Douglas fir was significantly affected by summer rainfalls in all time intervals. At the Písek sites, the situation was analogous to that of Opočno. Both species had a significant positive relationship to June–August precipitation. The effect of summer temperatures was negative; however, for Douglas fir the relationship was not significant in the majority of the studied periods. Interesting results were obtained for Prostějov. In the first three time intervals, summer temperatures did not have a significant effect on spruce growth. However, starting from 1968–1992, high summer temperatures became a factor that significantly reduced the growth of spruce in this region. The negative impact of summer temperatures on Douglas fir growth was evident only after the 1980–2004 period. Temporal changes were recorded also in the relationship of spruce increments and summer rainfalls. Since the period of 1968–1992, the values of correlation coefficients had a steady upward trend and, since the period of 1984–2008, they are statistically significant. Douglas fir growth was also positively correlated with summer precipitation totals, but the correlation coefficients did not reach significant values in most time intervals; however, since the 1986–2010 period, a steady increase of correlation coefficients was observed.
4. Discussion
Our study reveals greater similarities in the growth pattern of Douglas-fir chronologies across the different regions than those of spruce. Probably due to its broad ecological amplitude [39], Douglas fir is better able to cope with varying site conditions. At the same time, Douglas fir exhibited lower year-to-year variability of TRW indices when compared to spruce at sites with altitudes up to 500 m a.s.l. This means that Douglas fir is less sensitive to climatic conditions than spruce, which is growing out of its ecological optimum at these sites [40]. However, all tree sets show EPS values above 0.85, indicating a strong climate signal in their TRW chronologies [33].
For Douglas fir, the failures in ring formation were detected in the 1952–1957 and 1976–1979 time periods. The first period coincides with a heavy winter frost in the mid 1950´s, mainly in 1954 and 1956. In February 1956, persistent and severe cold was observed over the entire European continent [41,42]. The year 1976 was known to be a dry year in Europe [43], but because Douglas fir did not exhibit any failure in ring formation in other dry years, it is likely that the reason was rather heavy late frost during May of that year [44]. Detected missing rings in 1979 can be attributed to the sharp temperature break and strong frost at the turn of 1978 and 1979 [45]. On the other hand, spruce growth failed during the hot and dry periods in the first half of the 1990s [46] and after 2010, when there was an extreme drought, namely in 2015 [47].
These findings correspond to the results of the pointer year analysis. The growth minimum common to most Douglas fir sets was identified only in 1976. Here the cause was probably the late frost, to which the Douglas fir is sensitive [48,49]. The common negative pointer years for spruce were identified in 1962, 1992, 1993, 2003, 2004 and 2015. The analysis of climate data from nearby meteorological stations confirms that these years were extremely dry and, except in 1962, hot. Douglas fir was probably able to cope with the water deficit better than spruce. A higher resistance to drought of Douglas fir was proved earlier by Eilmann and Rigling [14] or Nadezhdina et al. [15]. However, after 2003, an increase in the occurrence of pointer years is evident also for Douglas fir. This is in line with the findings of Sergent et al. [20], who observed an extensive dieback of Douglas fir after 2003 in France. The acute drought stress of 2003 had consequences not only on diameter growth but more pronounced effect was observed when studying tree height [50].
To explore the long-term climate–growth relationship, the correlation analysis and PCA were preferable to response function analysis, because the climatic data were only available for a 55-year period (1961–2015). In order to provide a sufficient number of degrees of freedom, the length of the period studied should be twice as long as the number of predictors, which was 34 in this study.
PCA confirmed that the growth–temperature relationship was species-specific. In contrast, the tree response to precipitation differed according to region. The Písek sites, which received the lowest rainfalls, exhibit a different pattern than sites at Opočno and Prostějov. The regional differences in precipitation sums and their annual distribution are probably the cause for differentiating the tree responses.
In our study, Douglas fir growth is stimulated mainly by high temperatures in February and March of the current year, which points to Douglas fir‘s preference for mild winters [51]. In severe winters with deep-frozen soil, winter desiccation threatens Douglas fir trees [49,52]. Both Douglas fir and spruce growth reacted negatively to high temperatures in September of the previous year. Warmer autumn temperatures can delay cold hardening and increase cold injury [53]. Mainly high temperatures and lack of precipitation during the summer limited spruce growth in all three regions investigated. Sensitivity of spruce to summer drought was recently reported in Central Europe for altitudes up to 600 m a.s.l. [54]. Although Douglas fir had a neutral relationship to summer temperatures, the lack of precipitation had a significant negative impact on growth. Similarly, Littell et al. [19] concluded that reduced water availability limits the growth of Douglas fir more than the temperature or the length of the growing season does. However, the results of moving correlation showed an increasing sensitivity of Douglas fir to the summer temperatures in the Prostějov and Opočno regions since 2004 and 2008, respectively.
Pretel et al. [55] analysed changes in basic meteorological parameters for the entirety of the Czech Republic. Despite the significant year-to-year differences, the average annual temperatures in the last fifty years showed an increase of 0.3 °C for every 10 years. The rate of temperature increase is faster in summer (0.4 °C) and slower in autumn (0.1 °C). On the other hand, the number of ice and arctic days has decreased. Rainfall totals show significant variability over the year (monthly sums), but minimal changes in annual sums. Trnka et al. [21] concluded that the increase in drought at the end of the 20th and the beginning of the 21st century is not due to a lack of precipitation, but rather due to increased evaporation. In addition, the increase in air temperature does not have as significant of an effect upon drought conditions as does the decrease in air humidity or increase in sunlight. Climatic models predict a rise in temperature in Central Europe of approximately 2 to 4 °C by the end of the 21st century [56,57]. The same authors expect changes in rainfall totals in Central Europe, ranging from −15% to +5%.
Due to predicted mild winters in the future, the damage of Douglas fir stands by frost is not an acute threat, although local damage by early and late frosts is possible. The potential risk for Douglas fir growing in Central Europe is rather an increasing water deficit. Chakraborty et al. [2] predict decreasing growth performance of Douglas fir at low (up to 500 m a.s.l.) and middle (500–1000 m a.s.l.) elevations, but increasing growth performance on high elevation sites in Austria and Bavaria. Resistance to drought can be significantly influenced by the choice of a suitable provenance [58,59,60]. The study of Kleinschmit [61] showed that fast-growing provenances are more vulnerable to climatic extremes. Therefore, high yielding provenances from the coastal areas of North America may not be the most promising for future use in Central European conditions [1]. The assessment of ongoing provenance trials in the Czech Republic documented better production for lower yielding provenances on the plots with harsher climatic conditions [24]. Aspects of resistance to drought and other climatic extremes should be preferred to high yield when selecting appropriate provenances.
5. Conclusions
In the past, Douglas fir exhibited vulnerability to the frost events, while spruce growth was impaired mainly by summer drought. This trend has substantially changed in recent years when Douglas fir became more sensitive to drought stress. After 2003, Douglas fir responded by abrupt growth decrease in dry years in a manner similar to spruce, and its sensitivity to summer temperatures have increased steadily. Hence, the resistance to drought should be seriously considered when selecting suitable provenances for cultivation in Central European conditions. The recommendations of Douglas fir as a suitable alternative tree species for lower altitudes must be regarded with caution.
Supplementary Materials
The raw tree-ring width data are available online at https://www.mdpi.com/1999-4907/10/2/97/s1, Data file S1: S1_Tree-ring data.
Author Contributions
Conceptualization, Monika Vejpustková and Tomáš Čihák; data curation, Tomáš Čihák; formal analysis, Monika Vejpustková and Tomáš Čihák; methodology, Monika Vejpustková and Tomáš Čihák; writing—original draft, Monika Vejpustková; writing—review and editing, Tomáš Čihák.
Funding
This research was funded by the National Agency for Agricultural Research, grant number QJ1520299 and by the Ministry of Agriculture of the Czech Republic, institutional support MZE-RO0118.
Acknowledgments
We thank the anonymous reviewers for their careful reading of our manuscript and their helpful comments and suggestions.
Conflicts of Interest
The authors declare no conflict of interest. The funders had no role in the design of the study; in the collection, analyses, or interpretation of data; in the writing of the manuscript, or in the decision to publish the results.
References
- Isaac-Renton, M.G.; Roberts, D.R.; Hamann, A.; Spiecker, H. Douglas-fir plantations in Europe: A retrospective test of assisted migration to address climate change. Glob. Chang. Biol. 2014, 20, 2607–2617. [Google Scholar] [CrossRef] [PubMed]
- Chakraborty, D.; Wang, T.; Andre, K.; Konnert, M.; Lexer, M.J.; Matulla, C.; Schueler, S. Selecting Populations for non-analogous climate conditions using universal response functions: The case of Douglas-fir in Central Europe. PLoS ONE 2015, 10, e0136357. [Google Scholar] [CrossRef] [PubMed]
- Vinš, B.; Šika, A. Srovnání růstové reakce douglasky a smrku na stanovištní faktory v podmínkách ČSR [Comparison of the growth response of Douglas fir and Norway spruce to the site factors in the conditions of the Czech Republic]. Práce VÚLHM 1981, 58, 7–33. [Google Scholar]
- Podrázský, V.; Čermák, R.; Zahradník, D.; Kouba, J. Production of Douglas fir in the Czech Republic based on national forest inventory data. J. For. Sci. 2013, 59, 398–404. [Google Scholar] [CrossRef]
- Remeš, J.; Zeidler, A. Production potential and wood quality of Douglas fir from selected sites in the Czech Republic. Wood Res. 2014, 59, 509–520. [Google Scholar]
- Zeidler, A.; Borůvka, V.; Schönfelder, O. Comparison of wood quality of douglas fir and spruce from afforested agricultural land and permanent forest land in the Czech Republic. Forests 2018, 9, 13. [Google Scholar] [CrossRef]
- Burns, R.M.; Honkala, B.H. (Eds.) Silvics of North America: Volume 1 Conifers; Agriculture Handbook 654; U.S. Department of Agriculture, Forest Service: Washington, DC, USA, 1990; pp. 527–540.
- Brus, D.; Hengeveld, G.; Walvoort, D.; Goedhart, P.; Heidema, A.; Nabuurs, G.; Gunia, K. Statistical mapping of tree species over Europe. Eur. J. For. Res. 2011, 131, 145–157. [Google Scholar] [CrossRef]
- Kubeček, J.; Štefančík, I.; Podrázský, V.; Longauer, R. Výsledky výzkumu douglasky tisolisté (Pseudotsuga menziesii/Mirb./Franco) v České republice a na Slovensku—Přehled [Results of the research of Douglas-fir in the Czech Republic and Slovakia—A review]. Lesnícky Časopis For. J. 2014, 60, 116–124. [Google Scholar] [CrossRef]
- Schmid, M.; Pautasso, M.; Holdenrieder, O. Ecological consequences of Douglas fir (Pseudotsuga menziesii) cultivation in Europe. Eur. J. For. Res. 2014, 133, 13–29. [Google Scholar] [CrossRef]
- Hanewinkel, M.; Cullmann, D.A.; Schelhaas, M.J.; Nabuurs, G.J.; Zimmermann, N.E. Climate change may cause severe loss in the economic value of European forest land. Nat. Clim. Chang. 2013, 3, 203–207. [Google Scholar] [CrossRef]
- Šrámek, V.; Novotný, R.; Fadrhonsová, V. Chřadnutí smrkových porostů a stav lesních půd v oblasti severní Moravy a Slezska (PLO 29 a 39) [Decay of Norway spruce stands and quality of forest soils in the region of Northern Moravia and Silesia]. Zprávy Lesnického Výzkumu 2015, 60, 147–153. [Google Scholar]
- Cienciala, E.; Tumajer, J.; Zatloukal, V.; Beranová, J.; Holá, Š.; Hůnová, I.; Russ, R. Recent spruce decline with biotic pathogen infestation as a result of interacting climate, deposition and soil variables. Eur. J. For. Res. 2017, 136, 307–317. [Google Scholar] [CrossRef]
- Eilmann, B.; Rigling, A. Tree-growth analyses to estimate tree species` drought tolerance. Tree Physiol. 2012, 32, 178–187. [Google Scholar] [CrossRef] [PubMed]
- Nadezhdina, N.; Urban, J.; Čermák, J.; Nadezhdin, V.; Kantor, P. Comparative study of long-term water uptake of Norway spruce and Douglas-fir in Moravian upland. J. Hydrol. Hydromech. 2014, 62, 1–7. [Google Scholar] [CrossRef]
- Mauer, O.; Palátová, E. Root system development in Douglas fir (Pseudotsuga menziesii/Mirb./Franco) on fertile sites. J. For. Sci. 2012, 58, 400–409. [Google Scholar] [CrossRef]
- Lassoie, J.P.; Salo, D.J. Physiological response of large Douglas fir to natural and induced soil water deficits. Can. J. For. Res. 1981, 11, 139–144. [Google Scholar] [CrossRef]
- Pinol, J.; Sala, A. Ecological implications of xylem cavitation for several Pinaceae in the Pacific Northern USA. Funct. Ecol. 2000, 14, 538–545. [Google Scholar] [CrossRef] [Green Version]
- Littell, J.S.; Peterson, D.L.; Tjoelker, M. Douglas-fir growth in mountain ecosystems: Water limits tree growth from stand to region. Ecol. Monogr. 2008, 78, 349–368. [Google Scholar] [CrossRef]
- Sergent, A.S.; Rozenberg, P.; Breda, N. Douglas-fir is vulnerable to exceptional and recurrent drought episodes and recovers less well on less fertile sites. Ann. For. Sci. 2014, 71, 697–708. [Google Scholar] [CrossRef]
- Trnka, M.; Balek, J.; Zahradníček, P.; Eitzinger, J.; Formayer, H.; Turňa, M.; Nejedlík, P.; Semerádová, D.; Hlavinka, R.; Brázdil, R. Drought trends over part of Central Europe between 1961 and 2014. Clim. Res. 2016, 70, 143–160. [Google Scholar] [CrossRef] [Green Version]
- Schär, C.; Vidale, P.L.; Lüthi, D.; Frei, C.; Häberli, C.; Liniger, M.A.; Appenzeller, C. The role of increasing temperature variability in European summer heatwaves. Nature 2004, 427, 332–336. [Google Scholar] [CrossRef] [PubMed]
- Giorgi, F.; Coppola, E. European climate-change oscillation (ECO). Geophys. Res. Lett. 2007, 34, L21703. [Google Scholar] [CrossRef]
- Beran, F. Douglaska tisolistá v ČR—Biologie, genetika, provenienční výzkum [Douglas fir in the Czech Republic/biology, genetics, provenance studies]. In Pěstební Postupy Při Zavádění Douglasky do Porostních Směsí v Podmínkách ČR [Silvicultural Approaches for Introduction of Douglas-Fir into the Forest Mixed Stands in Conditions of the Czech Republic]; Slodičák, M., Novák, J., Eds.; Lesnická Práce: Kostelec nad Černými Lesy, Czech Republic, 2014; pp. 22–47. [Google Scholar]
- Chytrý, M. Current vegetation of the Czech Republic. In Flora and Vegetation of the Czech Republic; Chytrý, M., Danihelka, J., Kaplan, Z., Pyšek, P., Eds.; Springer International Publishing AG: Cham, Switzerland, 2017; pp. 229–337. [Google Scholar]
- Viewegh, J.; Kusbach, A.; Mikeska, M. Czech forest ecosystem classification. J. For. Sci. 2003, 49, 74–82. [Google Scholar] [CrossRef]
- Knibbe, B. PAST 4—Personal Analysis Systém for Tree Ring Research, Version 4. Instruction Manual; SCIEM/Bernhard Knibbe: Vienna, Austria, 2004. [Google Scholar]
- Holmes, R. Computer-assisted quality control in tree-ring dating and measurement. Tree-Ring Bull. 1983, 39, 77–82. [Google Scholar]
- Grissino-Mayer, H.D. Evaluating crossdating accuracy: A manual and tutorial for the computer program COFECHA. Tree-Ring Res. 2001, 57, 205–221. [Google Scholar]
- Cook, E.R.; Kairiukstis, L.A. Methods of Dendrochronology: Applications in the Environmental Science; Kluwer Academic Publishers: Dordrecht, The Netherlands; Boston, MA, USA; London, UK, 1990. [Google Scholar]
- Cook, E.R.; Peters, K. The smoothing spline: A new approach to standardizingforest interior tree-ring width series for dendroclimatic studies. Tree-Ring Bull. 198, 41, 45–53. [Google Scholar]
- Cook, E.R.; Krusic, P.J. ARSTAN v. 41d: A Tree-Ring Standardization Program Based on Detrending and Autoregressive Time Series Modeling, with Interactive Graphics; Tree-Ring Laboratory, Lamont-Doherty Earth Observatoryof Columbia University: Palisades, NY, USA, 2005. [Google Scholar]
- Wigley, T.M.L.; Briffa, K.R.; Jones, P.D. On the average value of correlated time series, with applications in dendroclimatology and hydrometeorology. J. Clim. Appl. Meteorol. 1984. 23, 201–213. [CrossRef]
- Jolliffe, I.T. Principal Component Analysis, 2nd ed.; Springer-Verlag: New York, NY, USA, 2002. [Google Scholar]
- Fritts, H.C. Tree Rings and Climate; Academic Press: London, UK, 1976. [Google Scholar]
- Schweingruber, F.H.; Eckstein, D.; Serre-Bachet, F.; Bräker, O.U. Identification, presentation and interpretation of event years and pointer years in dendrochronology. Dendrochronologia 1990, 8, 8–38. [Google Scholar]
- Jetschke, G.; van der Maaten, E.; van der Maaten-Theunissen, M. Towards the extremes: A critical analysis of pointer year detection methods. Dendrochronologia 2019, 53, 55–62. [Google Scholar] [CrossRef]
- Kaiser, H.F. On Cliff’s formula, the Kaiser–Guttman rule, and the number of factors. Percept. Motor Skills 1992, 74, 595–598. [Google Scholar] [CrossRef]
- Gugger, P.F.; Gonzalez-Rodriguez, A.; Rodriguez-Correa, H.; Sugita, S.; Cavender-Bares, J. Southward pleistocene migration of Douglas-fir into Mexico: Phylogeography, ecological niche modeling, and conservation of ‘rear edge’populations. New Phytol. 2011, 189, 1185–1199. [Google Scholar] [CrossRef] [PubMed]
- Plíva, K. Trvale Udržitelné Obhospodařování Lesů Podle Souborů Lesních Typů [Sustainable Forest Management According to Forest Types]; Ústav pro hospodářskou úpravu lesů: Brandýs nad Labem, Czech Republic, 2000. [Google Scholar]
- Andrews, J.F. The weather and circulation of February 1956. Mon. Weather Rev. 1956, 84, 66–74. [Google Scholar] [CrossRef]
- Lebourgeois, F. Climatic signal in annual growth variation of silver fir (Abies alba Mill.) and spruce (Picea abies Karst.) from the French Permanent Plot Network (RENECOFOR). Ann. For. Sci. 2007, 64, 333–343. [Google Scholar] [CrossRef]
- Blinka, P. Klimatologické hodnocení sucha a suchých období na území ČR v letech 1876–2003 [Climatological assessment of drought and dry periods in the Czech Republic in 1876–2003]. In Proceedings of the “Extrémy počasí a podnebí” [Extremes of weather and climate], Brno, Czech Republic, 11 March 2004. [Google Scholar]
- Potop, V.; Türkott, L. Rizika výskytu pozdních jarních mrazů a prvních podzimních mrazů při pěstování cukrové řepy ve středních Čechách [The risks of late spring frosts and early autumn frosts in sugar beet growing in Central Bohemia]. Listy Cukrovarnické a Řepařské 2013, 129, 283–291. [Google Scholar]
- Kroupová, M. Dendroecological study of spruce growth in regions under long-term air pollution load. J. For. Sci. 2002, 48, 536–548. [Google Scholar]
- Brázdil, R.; Trnka, M.; Dobrovolný, P.; Chromá, K.; Hlavinka, P.; Žalud, Z. Variability of droughts in the Czech Republic, 1881–2006. Theor. Appl. Climatol. 2009, 97, 297–315. [Google Scholar] [CrossRef]
- Ionita, M.; Tallaksen, L.M.; Kingston, D.G.; Stagge, J.H.; Laaha, G.; Van Lanen, H.A.J.; Scholz, P.; Chelcea, S.M.; Haslinger, K. The European 2015 drought from a climatological perspective. Hydrol. Earth Syst. Sci. 2017, 21, 1397–1419. [Google Scholar] [CrossRef] [Green Version]
- O’Neill, G.A.; Adams, W.T.; Aitken, S.N. Quantitative genetics of spring and fall cold hardiness in seedlings from two Oregon populations of coastal Douglas-fir. For. Ecol. Manag. 2001, 149, 305–318. [Google Scholar] [CrossRef]
- Malmqvist, C.; Wallertz, K.; Johansson, U. Survival, early growth and impact of damage by late-spring frost and winter desiccation on Douglas-fir seedlings in southern Sweden. New For. 2018, 49, 723–736. [Google Scholar] [CrossRef] [Green Version]
- Rais, A.; van de Kuilen, J.-W.G.; Pretzsch, H. 2014. Growth reaction patterns of tree height, diameter, and volume of Douglas-fir (Pseudotsuga menziesii [Mirb.] Franco) under acute drought stress in Southern Germany. Eur. J. For. Res. 2014, 133, 1043–1056. [Google Scholar] [CrossRef]
- Fischer, S.; Neuwirth, B. Klimasensitivität der Douglasie in Eifel und Kellerwald [Climate sensitivity of Douglas-fir in Eifel and Kellerwald]. Allg. Forst Jagdztg. 2012, 183, 23–33. [Google Scholar]
- Hofman, J. Pěstování Douglasky [Plantation of Douglas fir], 1st ed.; Státní zemědělské nakladatelství: Praha, Czech Republic, 1964. [Google Scholar]
- Bansal, S.; St. Clair, J.B.; Harrington, C.A.; Gould, P.J. Impact of climate change on cold hardiness of Douglas-fir (Pseudotsuga menziesii): Environmental and genetic considerations. Glob. Chang. Biol. 2015, 21, 3814–3826. [Google Scholar] [CrossRef] [PubMed]
- Tumajer, J.; Altman, J.; Štěpánek, P.; Treml, V.; Doležal, J.; Cienciala, E. Increasing moisture limitation of Norway spruce in Central Europe revealed by forward modelling of tree growth in tree-ring network. Agric. For. Meteorol. 2017, 247, 56–64. [Google Scholar] [CrossRef]
- Pretel, J. Zpřesnění Dosavadních Odhadů Dopadů Klimatické Změny V Sektorech Vodního Hospodářství, Zemědělství A Lesnictví A Návrhy Adaptačních Opatření [Clarification of Existing Estimates of Impacts of Climate Change in the Water, Agriculture And Forestry Sectors and Proposals for Adaptation Measures], Technical Summary of Project Results 2007–2011. 2011. Available online: http://portal.chmi.cz/files/portal/docs/meteo/ok/klimazmena/files/vav_TECHNICKE_SHRNUTI_2011.pdf (accessed on 30 August 2018).
- Hlásny, T.; Mátyás, C.; Seidl, R.; Kulla, L.; Merganičová, K.; Trombik, J.; Dobor, L.; Barcza, Z.; Konôpka, B. Climate change increases the drought risk in Central European forests: What are the options for adaptation? Lesnícky Časopis For. J. 2014, 60, 5–18. [Google Scholar] [CrossRef] [Green Version]
- Štěpánek, P.; Zahradníček, P.; Farda, A.; Skalák, P.; Trnka, M.; Meitner, J.; Rajdl, K. Projection of drought-inducing climate conditions in the Czech Republic according to Euro-CORDEX models. Clim. Res. 2016, 70, 179–193. [Google Scholar] [CrossRef] [Green Version]
- Leites, L.P.; Robinson, A.P.; Rehfeldt, G.E.; Marshall, J.D.; Crookston, N.L. Height-growth response to climatic changes differs among populations of Douglas-fir: A novel analysis of historic data. Ecol. Appl. 2012, 22, 154–165. [Google Scholar] [CrossRef] [PubMed]
- Eilmann, B.; de Vries, S.M.G.; den Ouden, J.; Mohren, G.M.J.; Sauren, P.; Sass-Klaassen, U. Origin matters! Difference in drought tolerance and productivity of coastal Douglas-fir (Pseudotsuga menziesii (Mirb.)) provenances. For. Ecol. Manag. 2013, 302, 133–143. [Google Scholar] [CrossRef]
- Bansal, S.; Harrington, C.A. ; St. Clair, J.B. Tolerance to multiple climate stressors: A case study of Douglas-fir drought and cold hardiness. Ecol. Evol. 2016, 6, 2074–2083. [Google Scholar] [CrossRef] [PubMed]
- Kleinschmit, J. Mit der Douglasie in die Zukunft. Ökologische und ökonomische Bilanz: Genetik. Forst und Holz 2000, 55, 713–715. [Google Scholar]
Figure 1.
Location of sample regions (circles) and meteorological stations (triangles) against the background of a shaded relief image of the Czech Republic.
Figure 1.
Location of sample regions (circles) and meteorological stations (triangles) against the background of a shaded relief image of the Czech Republic.
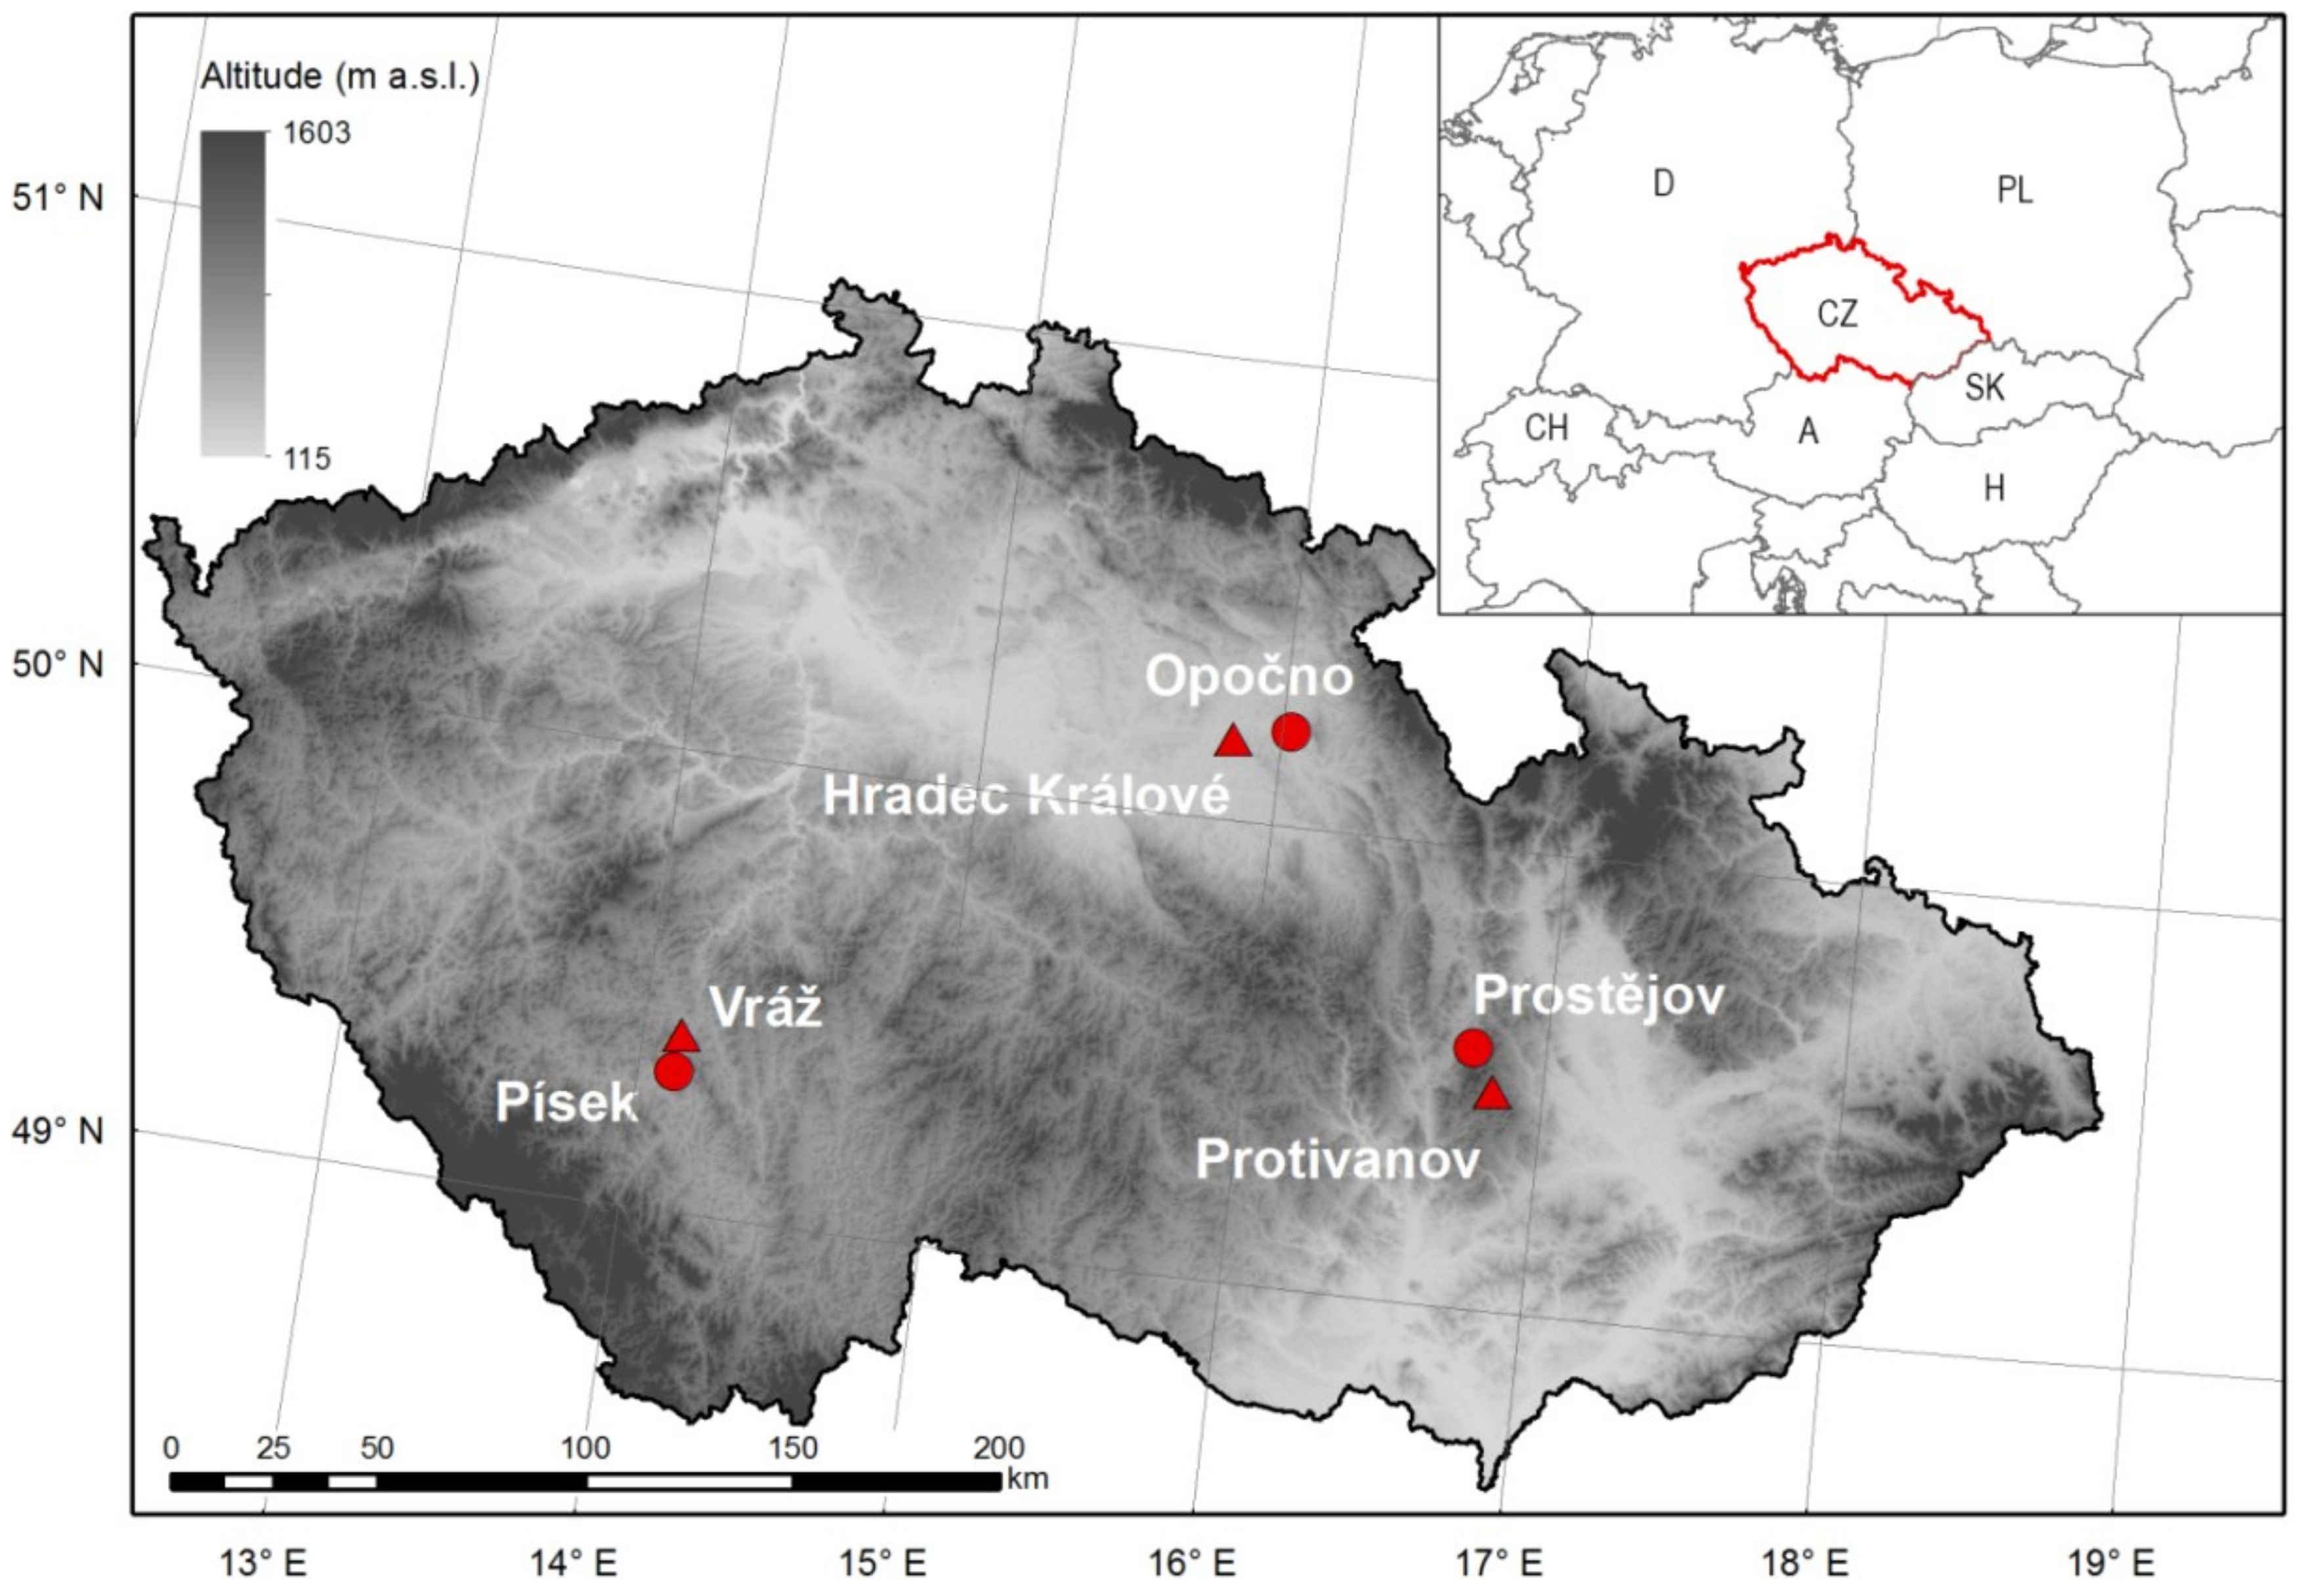
Figure 2.
Climate diagrams for meteorological stations: (a) Hradec Králové; (b) Vráž; and (c) Protivanov.
Figure 2.
Climate diagrams for meteorological stations: (a) Hradec Králové; (b) Vráž; and (c) Protivanov.

Figure 3.
Mean residual chronologies of particular tree sets (a) and their box plots (b). All box plots are based on data covering a common period of 1961–2015. Douglas fir is shown in black, spruce in grey.
Figure 3.
Mean residual chronologies of particular tree sets (a) and their box plots (b). All box plots are based on data covering a common period of 1961–2015. Douglas fir is shown in black, spruce in grey.

Figure 4.
Dendrogram of a hierarchical cluster analysis (Ward’s method, Euclidean distances) of residual chronologies for the common period of 1961–2015.
Figure 4.
Dendrogram of a hierarchical cluster analysis (Ward’s method, Euclidean distances) of residual chronologies for the common period of 1961–2015.
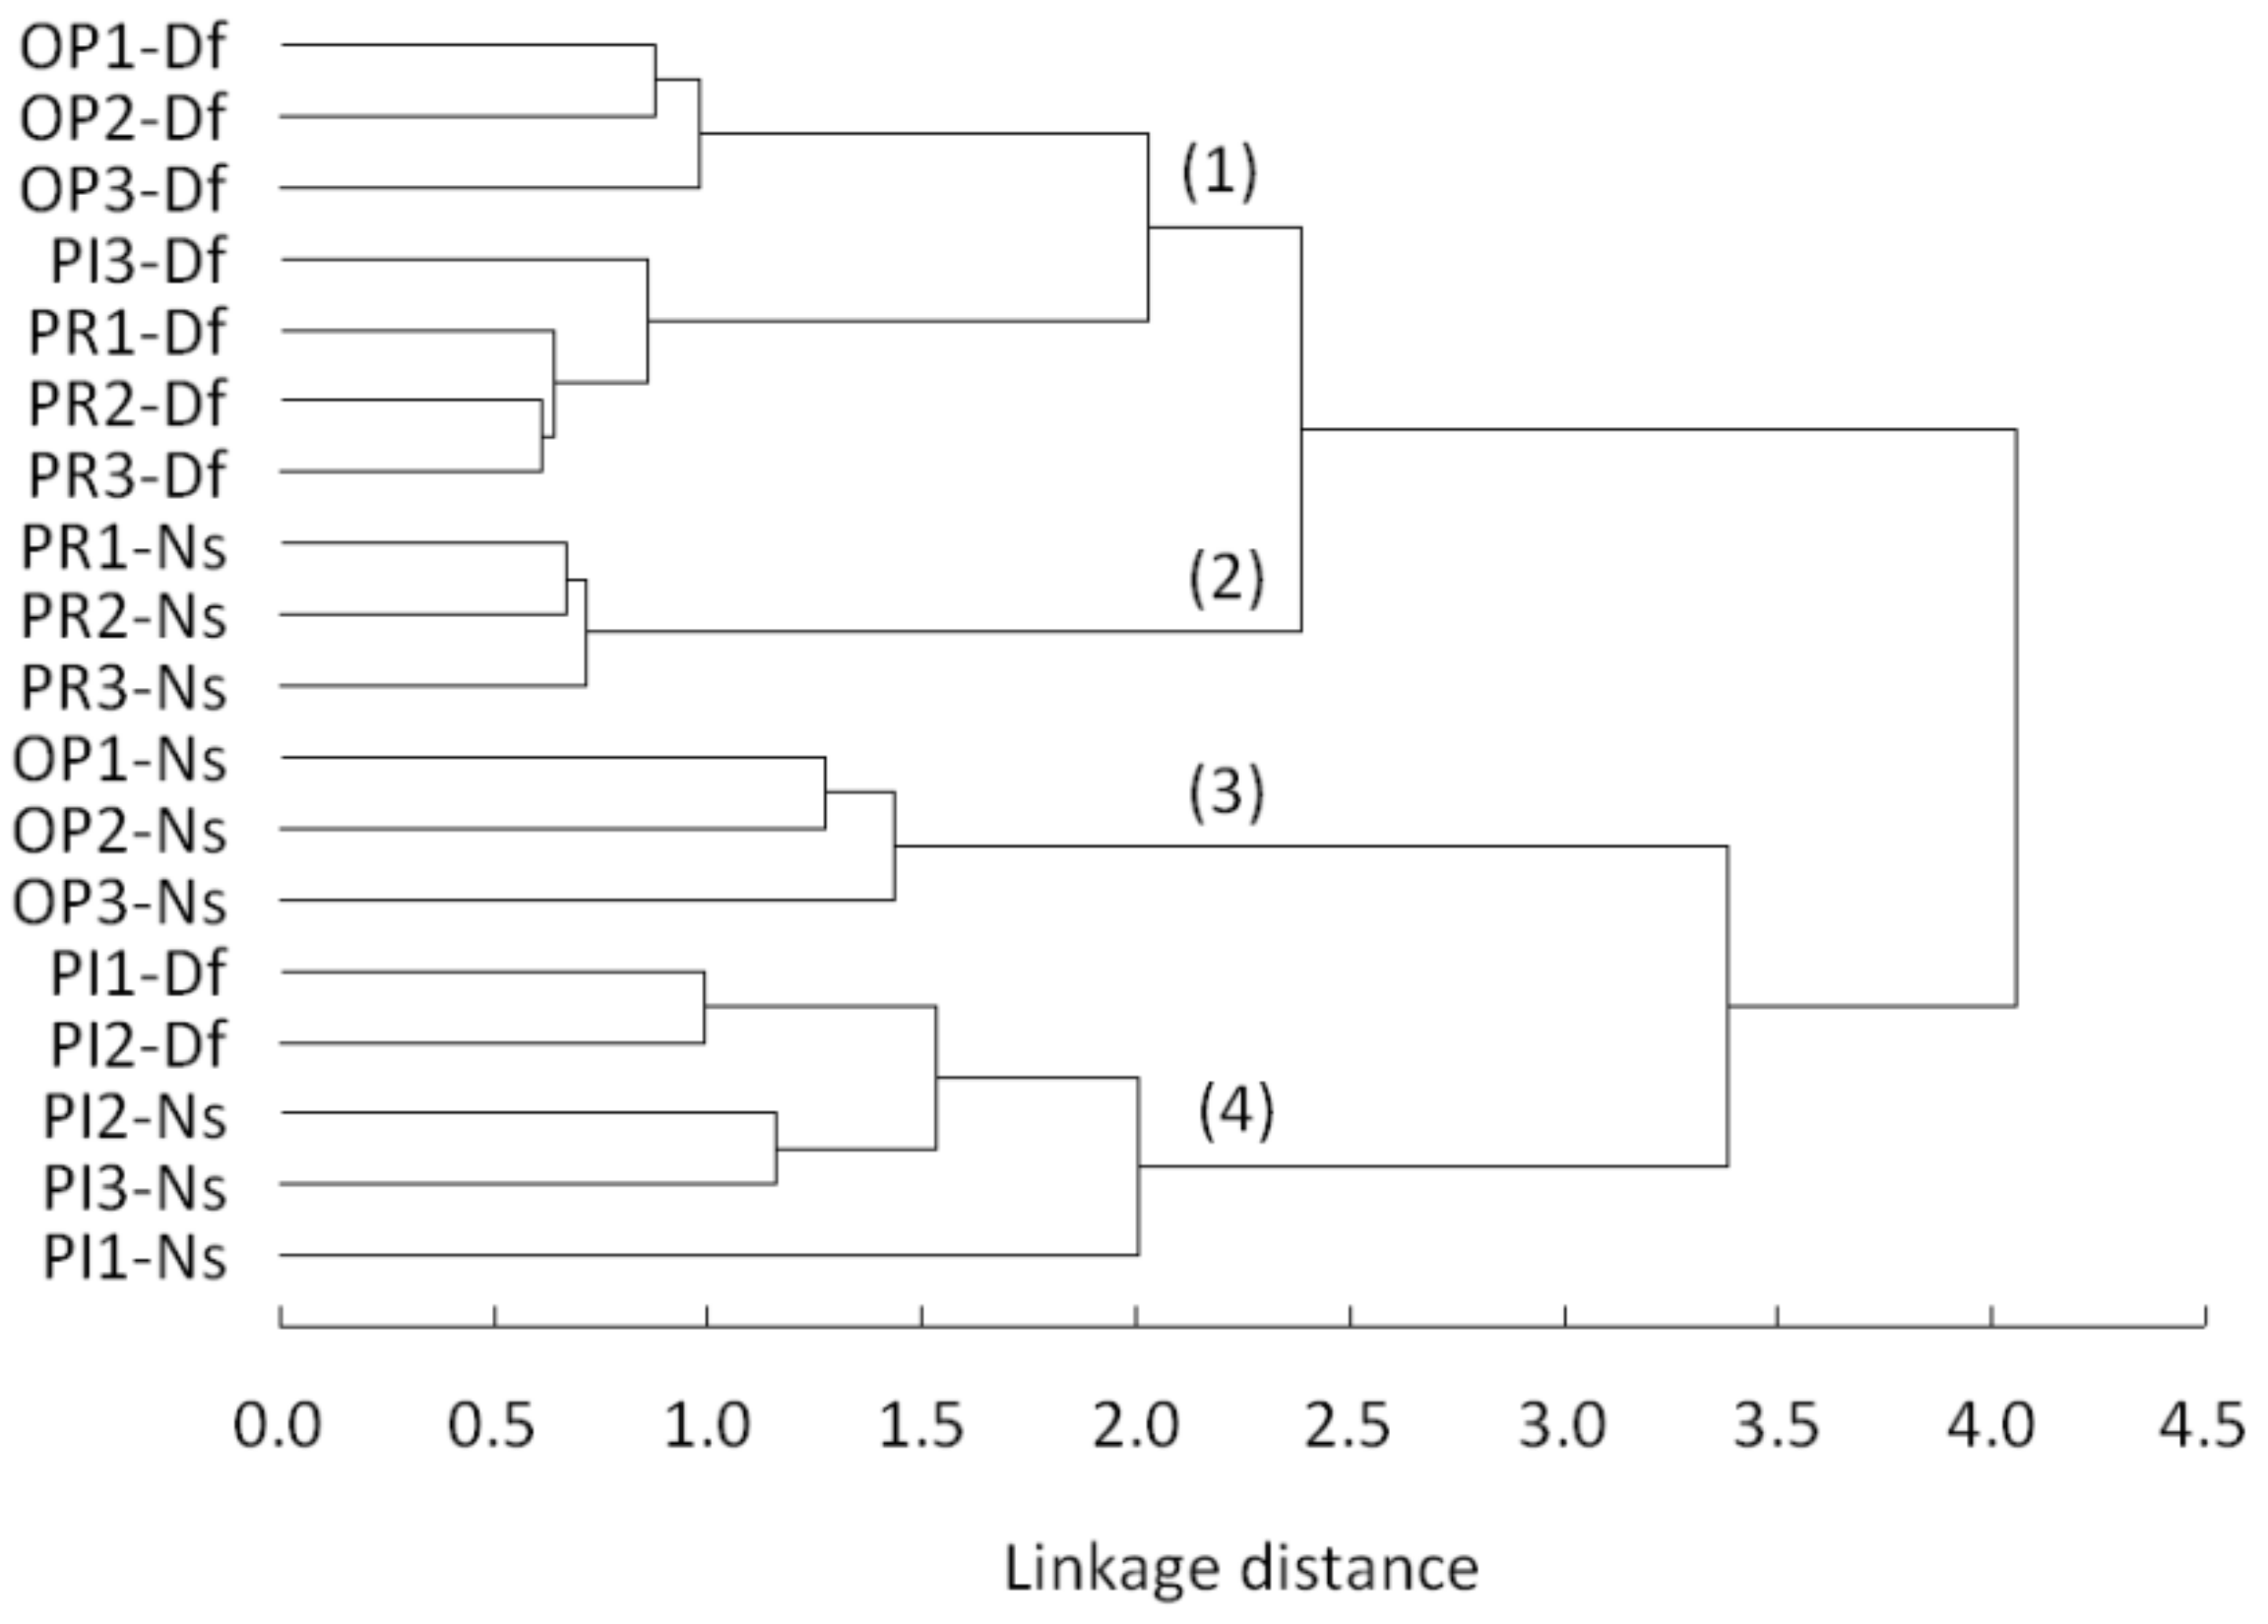
Figure 5.
Principal component analysis (PCA) loading plots of residual chronologies for common period 1961–2015: (a) the first principal component (PC1) against the second principal component (PC2); (b) PC2 against the third principal component (PC3). Percentage indicates the proportion of explained variance by given principal component.

Figure 6.
Frequency of negative pointer years for Douglas fir and Norway spruce sets in the period 1961–2015, evaluated for all regions together (a); strength of pointer years evaluated for individual regions and tree species (b). The size of symbols corresponds to the strength of relative growth change: weak (small triangle), strong (medium triangle) and extreme growth change (large triangle).
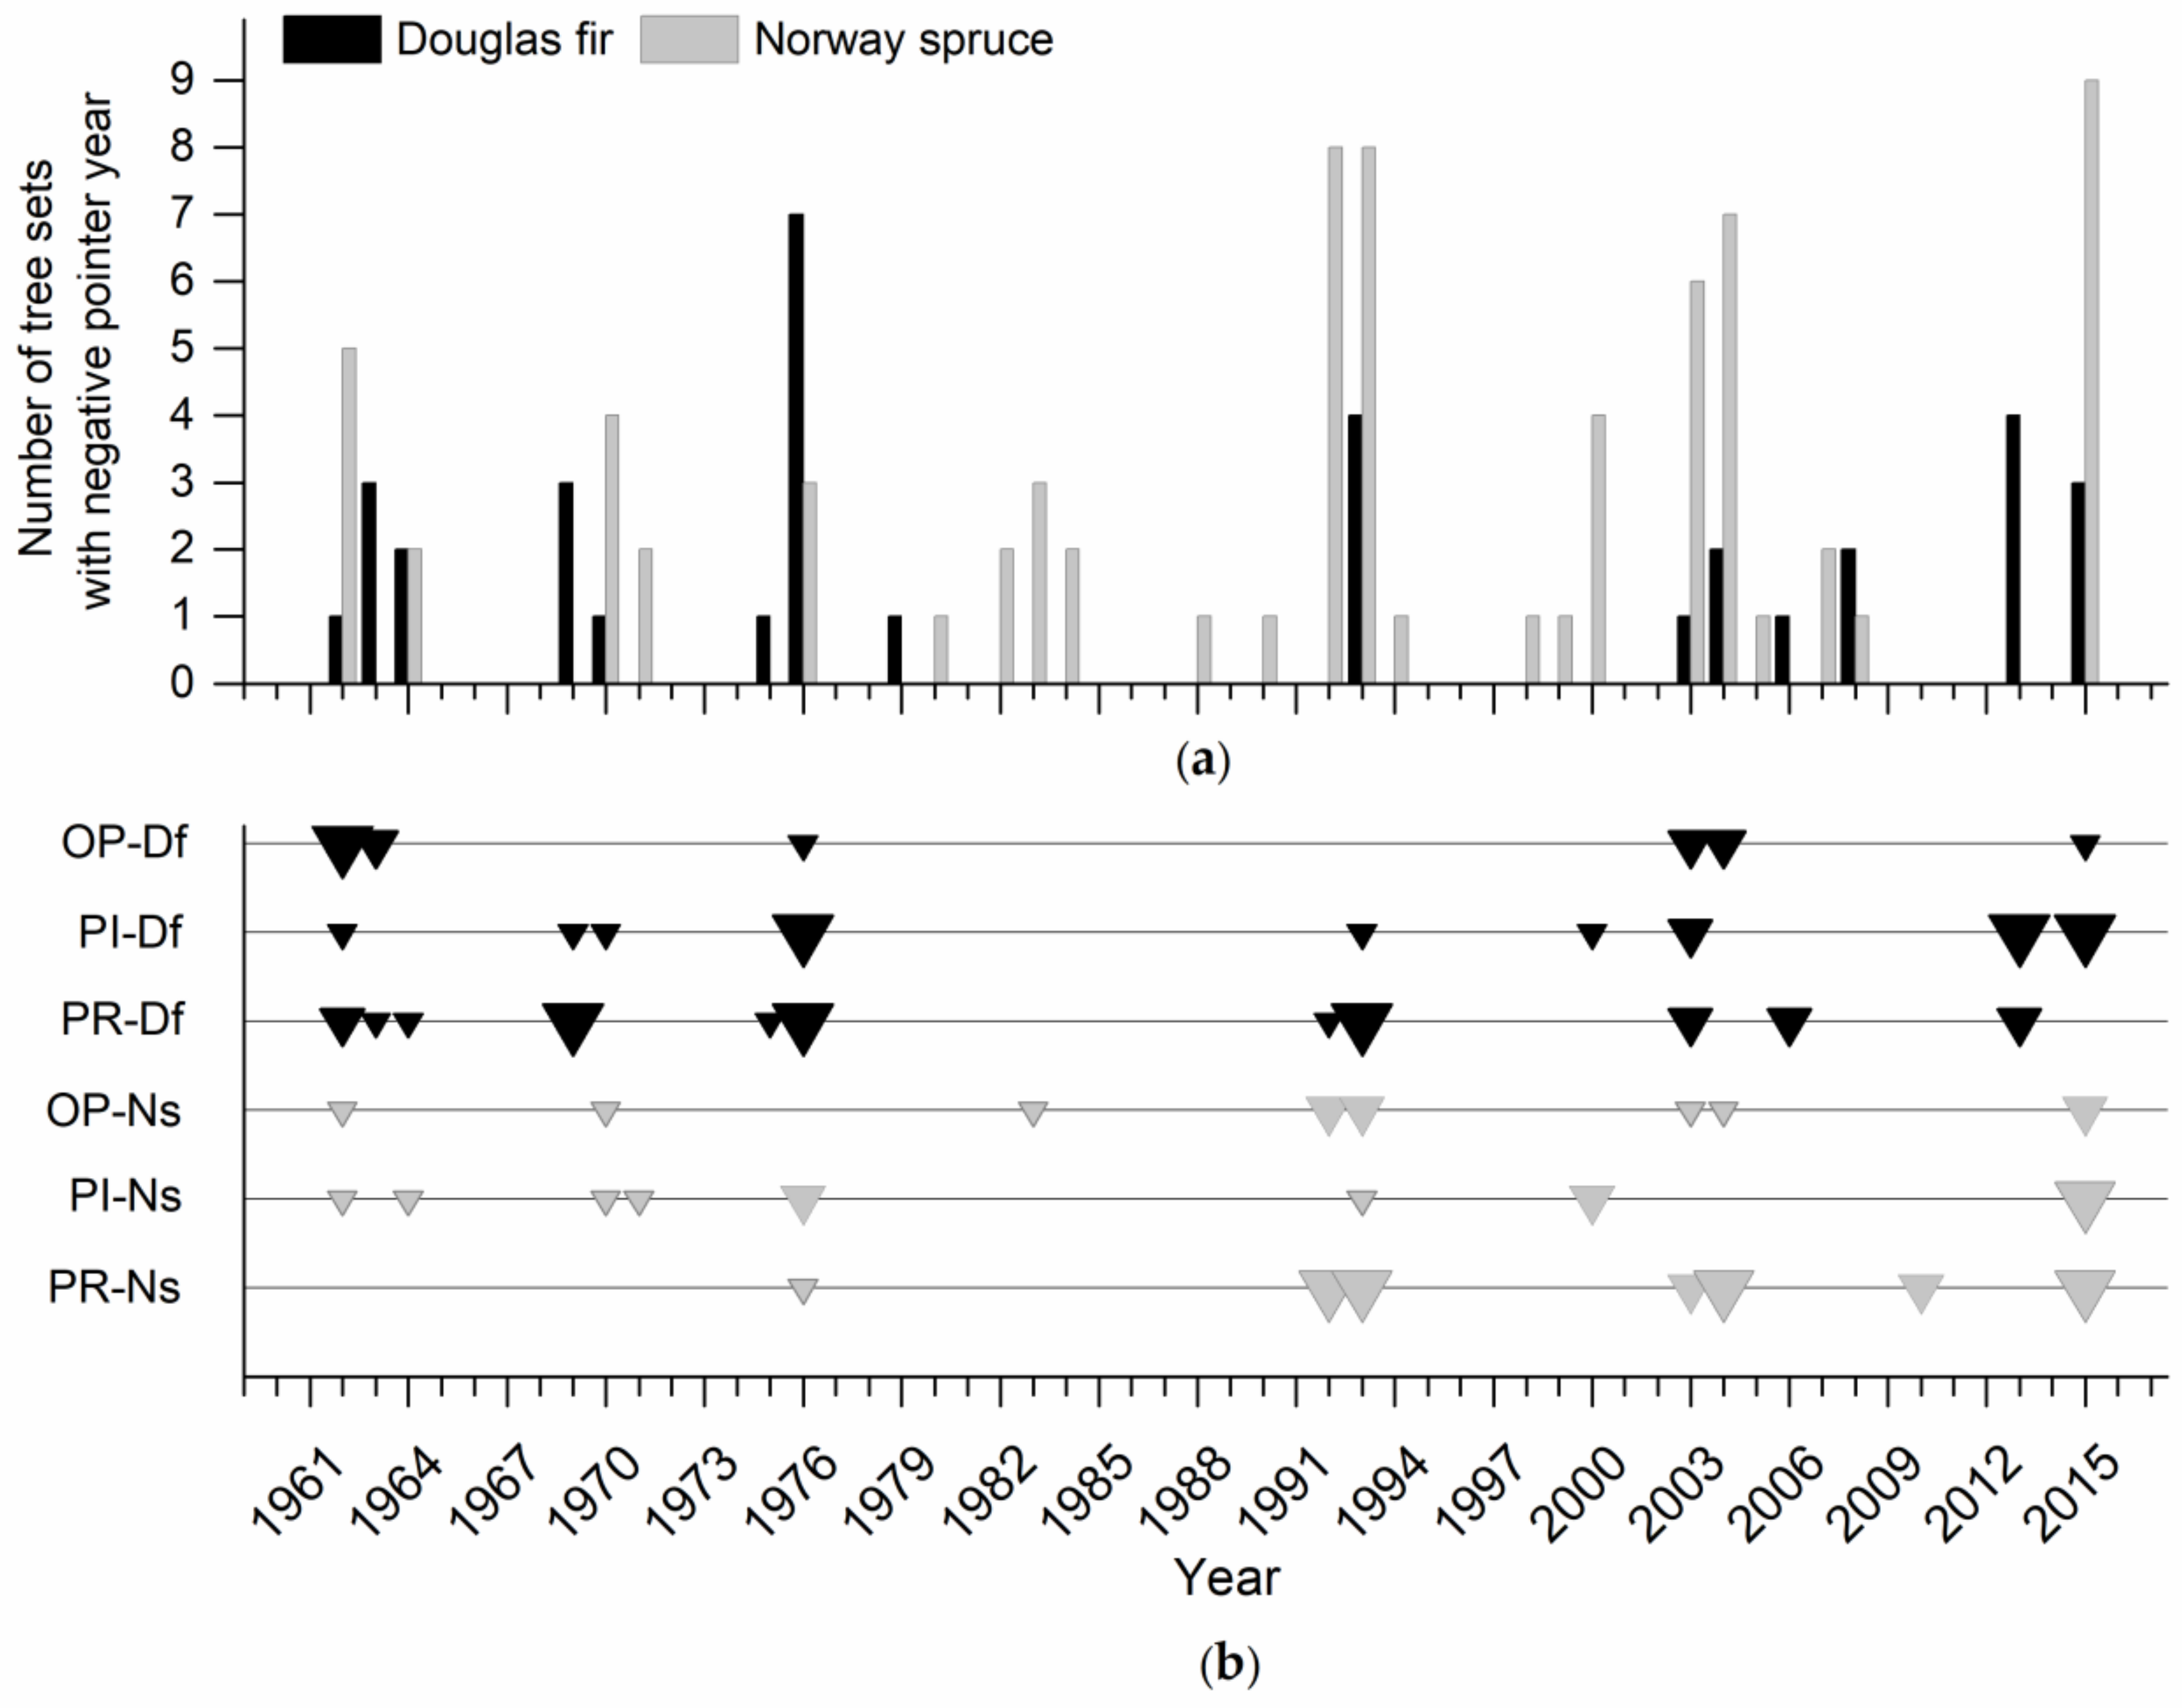
Figure 7.
Pearson correlations between growth and (a) average temperature; and (b) precipitation sums, in given months (lowercase letter “p” denotes months of previous year) in the 1961–2015 period. Average values (columns) and standard error (whiskers) are depicted for all sites and are grouped according to tree species and region. Dashed lines mark a critical value of Pearson‘s correlation coefficient (p = 0.05).

Figure 8.
PCA biplots based on correlation matrices representing (a) temperature–growth and (b) precipitation–growth relationships. Vectors depict tree-ring-width chronologies and the points’ monthly and seasonal climatic variables. Percentage indicates the proportion of explained variance by given principal component.

Figure 9.
25-year moving correlations of tree-ring chronologies and mean monthly temperatures in the summer months (June–August), and precipitation sums in June–August. Mean values of correlation coefficients are depicted by solid lines (Douglas fir in black, Norway spruce in grey) with their standard deviations (grey area). Dashed lines mark a critical value of Pearson‘s correlation coefficient (p = 0.05).

Table 1.
Basic characteristics of sample sites and statistical parameters of respective tree-ring chronologies.
Table 1.
Basic characteristics of sample sites and statistical parameters of respective tree-ring chronologies.
| Site Characteristics | Raw Measurements | Residual Chronology | ||||||||||||
|---|---|---|---|---|---|---|---|---|---|---|---|---|---|---|
| Region | Tree Set (Site 1, Tree Species 2) | Altitude (m a.s.l.) | Forest Type 3 | Site Index 4 | No of Trees/Series | Mean/Max Segment Length (year) | Mean TRW 5 (mm) | Proportion of Missing Rings (%) | Series Intercorrel. vs. Mean | Mean rbar | Mean Sensitivity | 1st Order Autocorrel. | Mean Sensitivity | EPS 6 |
| Opočno | OP1-Df | 350 | 3I | 34 | 20/40 | 46/55 | 3.66 | 0 | 0.577 | 0.492 | 0.216 | 0.636 | 0.164 | 0.96 |
| OP1-Ns | 350 | 3I | 26 | 19/38 | 70/77 | 2.25 | 0 | 0.711 | 0.577 | 0.308 | 0.688 | 0.270 | 0.96 | |
| OP2-Df | 350 | 3K | 30 | 20/40 | 64/78 | 3.43 | 0 | 0.641 | 0.359 | 0.222 | 0.669 | 0.196 | 0.97 | |
| OP2-Ns | 350 | 3K | 28 | 20/40 | 77/83 | 2.13 | 0 | 0.662 | 0.542 | 0.251 | 0.720 | 0.210 | 0.97 | |
| OP3-Df | 260 | 1M | 28 | 17/34 | 110/119 | 2.27 | 0.16 | 0.732 | 0.445 | 0.284 | 0.692 | 0.265 | 0.96 | |
| OP3-Ns | 260 | 1M | 24 | 20/40 | 119/128 | 1.44 | 0 | 0.729 | 0.510 | 0.326 | 0.658 | 0.296 | 0.98 | |
| Písek | PI1-Df | 479 | 3K | 34 | 20/40 | 70/81 | 2.24 | 0.04 | 0.629 | 0.544 | 0.303 | 0.627 | 0.226 | 0.96 |
| PI1-Ns | 479 | 3K | 26 | 18/36 | 84/103 | 2.04 | 0.15 | 0.714 | 0.386 | 0.399 | 0.536 | 0.339 | 0.97 | |
| PI2-Df | 410 | 3S | 36 | 19/38 | 62/69 | 2.93 | 0 | 0.702 | 0.548 | 0.290 | 0.656 | 0.208 | 0.96 | |
| PI2-Ns | 410 | 3S | 28 | 20/40 | 64/68 | 2.59 | 0 | 0.711 | 0.581 | 0.348 | 0.692 | 0.311 | 0.97 | |
| PI3-Df | 525 | 4B | 34 | 20/40 | 73/80 | 3.16 | 0 | 0.459 | 0.329 | 0.259 | 0.664 | 0.174 | 0.91 | |
| PI3-Ns | 525 | 4B | 30 | 19/38 | 64/77 | 2.83 | 0.08 | 0.559 | 0.306 | 0.298 | 0.646 | 0.263 | 0.92 | |
| Prostějov | PR1-Df | 600 | 5K | 34 | 20/40 | 76/79 | 2.53 | 0.23 | 0.619 | 0.489 | 0.240 | 0.710 | 0.193 | 0.95 |
| PR1-Ns | 600 | 5K | 30 | 20/40 | 78/83 | 2.22 | 0 | 0.698 | 0.510 | 0.217 | 0.716 | 0.183 | 0.97 | |
| PR2-Df | 560 | 5B | 32 | 20/40 | 95/108 | 2.09 | 0.03 | 0.710 | 0.646 | 0.230 | 0.752 | 0.206 | 0.97 | |
| PR2-Ns | 560 | 5B | 28 | 20/40 | 91/98 | 1.84 | 0 | 0.729 | 0.504 | 0.221 | 0.660 | 0.201 | 0.97 | |
| PR3-Df | 540 | 5K | 36 | 19/38 | 78/83 | 2.43 | 0 | 0.616 | 0.570 | 0.264 | 0.711 | 0.199 | 0.95 | |
| PR3-Ns | 540 | 5K | 28 | 20/40 | 83/90 | 1.99 | 0.15 | 0.704 | 0.701 | 0.240 | 0.784 | 0.210 | 0.97 | |
1 Site: OP1–OP3: sites no. 1–3 in Opočno region; PI1–PI3: sites no. 1–3 in Písek region; PR1–PR3: sites no. 1–3 in Prostějov region. 2 Tree species: Df—Douglas fir; Ns—Norway spruce. 3 Forest type [26]: 3I—compacted-acid Oak and Beech; 3K—acidic Oak and Beech; 1M—nutrient-very poor Pine and Oak; 3S—nutrient-medium Oak and Beech; 4B—nutrient-rich Beech; 5K—acidic Fir and Beech; 5B—nutrient-rich Fir and Beech. 4 Site index: Expressed as a mean stand height at the age of 100 years. 5 TRW: Tree-ring width. 6 EPS: Expressed population signal.
© 2019 by the authors. Licensee MDPI, Basel, Switzerland. This article is an open access article distributed under the terms and conditions of the Creative Commons Attribution (CC BY) license (http://creativecommons.org/licenses/by/4.0/).
Share and Cite
MDPI and ACS Style
Vejpustková, M.; Čihák, T. Climate Response of Douglas Fir Reveals Recently Increased Sensitivity to Drought Stress in Central Europe. Forests 2019, 10, 97. https://doi.org/10.3390/f10020097
AMA Style
Vejpustková M, Čihák T. Climate Response of Douglas Fir Reveals Recently Increased Sensitivity to Drought Stress in Central Europe. Forests. 2019; 10(2):97. https://doi.org/10.3390/f10020097
Chicago/Turabian StyleVejpustková, Monika, and Tomáš Čihák. 2019. "Climate Response of Douglas Fir Reveals Recently Increased Sensitivity to Drought Stress in Central Europe" Forests 10, no. 2: 97. https://doi.org/10.3390/f10020097
Note that from the first issue of 2016, this journal uses article numbers instead of page numbers. See further details here.