Comparing Non-Destructive Methods to Estimate Volume of Three Tree Taxa in Beijing, China


1
Precision Forestry Key Laboratory of Beijing, Beijing Forestry University, Beijing 100083, China
2
Ministry of Education Key Laboratory for Silviculture and Conservation, Beijing Forestry University, Beijing 100083, China
3
School of Nature Conservation, Beijing Forestry University, Beijing 100083, China
*
Author to whom correspondence should be addressed.
Forests 2019, 10(2), 92; https://doi.org/10.3390/f10020092
Submission received: 10 November 2018
/
Revised: 20 January 2019
/
Accepted: 23 January 2019
/
Published: 24 January 2019
(This article belongs to the Section Forest Ecology and Management)
Abstract
:Establishing the tree volume table is an important aspect of forest inventory for managing the forest ecosystem. The traditional volume models used to build tree volume tables are time consuming and expensive, demanding huge labor and material resources. Aiming at the improvement of the current destructive, costly and time-consuming volume model, we propose a new non-destructive, low-cost and efficient method for calculating the tree volume model with high precision by using the electronic theodolite. For testing and comparing the accuracy of our model with the traditional model, we collected data of three main tree taxa including Platycladus orientalis (L.) Franco, Larix principis-rupprechtii Mayr and Populus spp. L. from different districts and counties of Beijing, China. We collected a total of 1750 tree samples (250 Platycladus orientalis, 300 Larix principis-rupprechtii, and 1200 Populus spp.) to establish our models; 721 pieces of accurate data (94 Platycladus orientalis, 149 Larix principis-rupprechtii, and 478 Populus spp.) were used as test samples, to evaluate the accuracy of the newly established volume models of three tree species (group). After that, the established volume models (unary/binary models) were compared and analyzed with the corresponding ministerial models for applicability and accuracy. The results showed that the difference between the data observed by the new method and the measurement data of parsing trees was not significant. The total relative error (TRE) and the mean system error (MSE) of the newly established unary/binary volume models were all within ±3%, satisfying the accuracy standard specified by the technical indicators. Compared with the ministerial models applied to the same data, our models’ performance and accuracy were higher (close to the field measurements). Our results also showed that the accuracy of ministerial models was lower than the required standards. It is a promising methodology to use the electronic theodolite non-destructive observation method to establish tree volume tables in the future, especially in areas where cutting is prohibited or restricted and there is a lack of tree volume tables. In addition, this method has also shown a great potential of applicability in forest ecology and environmental protection.

1. Introduction
Forest resources inventory plays an important supporting role in understanding the status quo of forests, changing laws, formulating forestry management plans, promoting the development of a green national economy and improving the establishment of a healthy ecological environment [1,2]. Ideally, the forest resource inventory requires the data of each individual tree, however, it is almost impossible to collect measurement data of each tree, especially over a large scale. Moreover, the process would be both time and cost expensive as more human and resources have to be engaged [3,4]. Therefore, establishing volume tables and sampling theory has become important in forestry sciences. The standing tree volume table has become an important forestry basic meter [5]. As the method is efficient and cost effective, it has been widely used in various countries including Germany, Korea, China and many other [6,7,8,9,10]. In China, the standing tree volume usually includes a unary volume table and binary volume table [11]. A unary volume table is based on the regression relationship between the factor of diameter at breast height (DBH) and volume, while binary volume table is based on the DBH and tree height. At present, the volume table used in Beijing (China) is basically established at the beginning of the continuous forest inventory system in China in the late 1970s. However, the method has some limitations at present, as the structure of forest resources in China has been changing. Some old volume tables could have unacceptable bias in the application, and some of the tree species have no applicable volume table [12,13]. In addition, according to national regulations, the preparation of the volume table should be re-examined every 20 years to ensure that the accuracy of the volume table is not affected by climatic conditions and site conditions in different periods. Therefore, updating and compiling new volume tables are of a great significance for forest resource survey work.
The traditional method of compiling the volume table was usually achieved by selecting the sample according to a certain sampling principle, analyzing the selected live tree, and then calculating the volume by the piecewise method [6,14]. However, the method was time-consuming and laborious. Moreover, getting approval of the tree harvesting in the domestic forestry department is very complicated, and it is not even approved in the metropolitan areas. Hence, it is difficult to establish a volume table using the traditional method. With the advancement of science and technology, new measurement methods, such as optical electronic total station [15,16], photogrammetry technology [17,18], three-dimensional laser scanning technology [19,20], unmanned aerial systems [21], and other non-contact measurement methods [22,23], have been introduced in the field of forestry. Although the aforementioned technologies can solve the problem of non-destructive measurement of tree volume, there were few technologies applied in practical practice. The most important causes of this phenomenon are device portability and measurement cost issues. Obviously, the total station is very cumbersome and complicated to operate in forestry surveys [15,16]. As for photogrammetry technology, three-dimensional laser scanning technology and unmanned aerial systems, the hardware of the relevant measuring instruments itself requires high costs and professional training [19,21,24,25,26]. Moreover, the data collected with these methods is complicated to process, especially because point cloud data needs costly software and computers. While the other non-contact measurement methods are comparatively cheaper but their measurement accuracy and data stability are difficult to guarantee [22,23]. Therefore, forestry measurement, especially standing tree volume calculation, needs a new non-destructive, economical, user friendly and highly efficient methodology. In this paper we proposed a method for the non-destructive measurement of standing timber using the electronic theodolite. Three main tree taxa in Beijing [timber product model (unary/binary model) of the group] was researched and constructed, and the new model was compared with the corresponding original model. We applied our method to establish the unary/binary volume model of the three tree taxa of Platycladus orientalis (L.) Franco, Larix principis-rupprechtii Mayr and Populus spp. L. in Beijing. Our method also provides a scientific basis for objectively evaluating the current status of the three-tree species (group) volume models.
2. Materials and Methods
2.1. Data Collection
Field surveys were carried out from February 2013 to December 2015 to collect the data. We selected three main tree taxa of Platycladus orientalis, Larix principis-rupprechtii and Populus spp. in Beijing of China, and a standard tree (trees that can represent the average volume size of a particular diameter classes) was selected as the experimental tree for cutting. The selection range included all districts and counties in Beijing (Figure 1). Based on the Beijing Landscape and Greening Resources Survey (2009) results, we determined the distribution of three tree taxa of Platycladus orientalis, Larix principis-rupprechtii and Populus spp. in Beijing, including their geographical location, topographic conditions and the corresponding number of trees. To ensure the versatility of the models, the sample trees were divided into 10 diameter groups at intervals of 6 cm, 10 cm, 12 cm, 16 cm, 20 cm, 24 cm, 28 cm, 32 cm and 36 cm. Based on the stratified random sampling, sample trees with different sites, different diameter classes and different tree heights were selected as standard trees in different districts and counties of Beijing. During the data collection, a total of 400 standard trees were cut down in all districts and counties of Beijing (Table 1). Then, the height and volume of the selected 2177 trees (a total of 201 Platycladus orientalis, 296 Larix Principis-Rupprechtii trees and 1680 Populus spp. trees) were obtained. The unary/binary volume models of three main tree taxa were established and volume tables were prepared.
2.2. Measuring Principle and Method
The Southern Electronic Theodolite DT-02 (South Surveying & Mapping Instrument Co., Ltd., Guangzhou, China) (Figure 2), having an automatic vertical compensator and system liquid electronic sensor bubble compensator, resolution of 3″, and magnification of 30 times, was used in this study. The instrument weighs 4.8 kg and can work continuously for more than 10 hours. In addition, the instrument needs to be equipped with a robust tripod (South Surveying & Mapping Instrument Co., Ltd., Guangzhou, China) (about 4–5 kg) for observation.
The two-station observation method was used to accurately measure the standing timber [27]. Because the trunk section was not circular or approximate ellipse, the angle between the two observation points and the tree was guaranteed to be 90°. The measurement results take an average of the two observation points. The value makes the measurement result more accurate.
The specific measurement process is:
- At the observation point No. 1, the electronic theodolite station was levelled, and the breast height of the target tree was manually calculated at 1.3 m. The DBH and the corresponding ground diameter D0 (generally the diameter of the trunk around 12 cm from the ground) were measured manually with the DBH diameter tape (Pacific brand, China, nominal precision ±1 mm).
- Then the 1.3-meter zenith distance γ1 and the horizontal angle α1 from the 1.3 m position were observed respectively by using electronic theodolite. The horizontal distance S between the observation instrument and the target tree was calculated by means of the trigonometric function principle.
- The zenith distance γn of the tree height was determined by aiming at the top position of the targeted tree using electronic theodolite. Then the tree trunks above the chest height were divided into n segments (usually 9 segments) according to the difference of zenith distance between the height at breast height and the top of the tree, so that the whole target tree was divided into 10 segments.
- Observing the volume of No. 1 station, the observation sequence was from the breast height position (1.3 m) to the tree top position according to the sectional height (Figure 3). The observation parameters included the zenith distance γ and the horizontal angle α, and the corresponding data were recorded.
- Then, another station around the tree was selected, as point No. 2, and the steps of observation point No. 1 were re-exercised.
The main principle was the non-destructive, automatic and accurate measurement of a standing tree trunk into several sections according to the characteristic shape by using an electronic theodolite. The trunk was segmented based on viewing conditions and trunk deformation, etc. (Figure 4). The average segment length was 0.5–3 m, and the whole trunk was divided into n segments. Regarding the top of the tree trunk as a cone, and the other segments as the truncated cones [28], the trunk volume was calculated from the sum of the volume of the cone (Equation (2)) and the truncated cone (Equation (1)).
The formula for calculating the volume of the truncated cone is:
where () is the volume of the truncated cone, is the circumference, h is the height of the segmented truncated cone, is the cross-section diameter of the top surface of the truncated cone, is the cross-section diameter of the bottom surface of the truncated cone.
The formula for calculating cone volume is:
where is the volume of the cone, hn−1 is the height of the cone (the length of the tree tip), and is the diameter of the bottom section of the cone (the diameter of the lowest section of the cone).
The total volume formula can be expressed as:
where V represents the total volume of the trunk and Vi (i = 1, 2, 3… n) represents the volume of each segment, hi (i = 1, 2, 3… n−1) is the height of each segment, (i = 1, 2, 3… n−1) is the sectional section diameter.
After field observation and data collection, we sorted out and analyzed the existing sample data. First, the sample trees were divided into 10 diameter groups according to the sample interval classification method (which needs to include the minimum and maximum diameter intervals), and the tree height range of each group was calculated. Then, we selected the sample trees based on the DBH change and the tree height-DBH ratio [29]. In each diameter group, three subgroups were formed according to the corresponding large, medium, and small tree height-DBH ratio. A minimum of 30 sample trees were selected for individual subgroup, and more than 150 sample trees data in each diameter group was used in the modeling [30,31].
Although we designed a rigorous observation scheme, using accurate measurement methods, there would inevitably be some errors or abnormal data in the collected sample data. The abnormal data have a great influence on the choice of the model and the precision of the final model, which may lead to the distortion of the objective law. In order to express the volume model more objectively, it was necessary to eliminate the abnormal data that deviates from most of the data distribution rules.
In order to ensure the accuracy of the modeling data and avoid the deviation of sample representativeness caused by excessive rejection of abnormal data, we filtered out abnormal data based on scatterplot inspection, and also all data with values beyond three standard deviations from the mean. Any missing, wrong or mis-measured data were corrected, while the other obvious abnormal data are eliminated from further analysis. During the data cleaning process, a total of 106 groups of abnormal data were excluded, which included 10 groups of Platycladus orientalis, 7 groups of Larix principis-rupprechtii and 89 groups of Populus spp. Finally, 2471 groups of sample data of DBH-ground diameter (D)-tree height (H)-volume (V) were used in further modeling. Among the total, 250 modeling samples were Platycladus orientalis and 94 samples were tested; 300 modeling samples were Larix principis-rupprechtii, and 149 samples were tested; 1200 modeling samples were Populus spp. and 478 samples were tested. The statistical indicators of specific modeling samples are shown in Table 2. After the modeling and processing the data, the unary and binary volume models of Platycladus orientalis, Larix principis-rupprechtii and Populus spp. were fitted by weighted least squares method to obtain the volume model of three tree species (group) [32,33,34].
2.3. Volume Model Evaluation Method
To validate volume models, we chose the following error metrics [35]: the coefficient of determination (R2), the standard error of estimate (SEE), the total relative error (TRE), the mean systematic error (MSE), the mean prediction error (MPE) and the mean percent standard error (MPSE). The corresponding expressions are shown in formulas (4)–(9).
where and are the measured and predicted values of the i-th sample, is the average of all the measured values, n is the total number of samples, p is the number of parameters, and is the t-value at the (n-p) confidence level α for the given number of degrees of freedom (usually taken α = 0.05).
These six indicators are very critical parameters when evaluating the model fitting, among which TRE, MSE, MPE, MPSE are usually expressed in the form of percentages (%). When using inspection samples for testing, it is necessary to calculate the two indicators TRE and MSE. Under normal circumstances, the TRE of the test sample should be less than the average estimated error MPE of the model built. In addition, according to the “Main Technical Regulations for Forestry Professional Surveys” [11], the systematic error of the timber volume table should not exceed ±3%. If both TRE and MSE do not exceed ±3%, the volume model is applicable then.
3. Results
3.1. Three Tree Species (Group) Volume Model Results
For each of the three-tree taxa investigated, two volume models (unary/binary) have been performed, using the weighted least squares method. Therefore, we have obtained new general-purpose unary and binary volume models ((), ()) for three taxa of Platycladus orientalis (L.) Franco, Larix principis-rupprechtii Mayr and Populus spp L. (Table 3).
3.2. New Volume Model Evaluation and Accuracy Analysis
In order to further evaluate the accuracy and applicability of the fitted volume model, the newly established binary/binary volume models of three tree taxa and the corresponding ministerial models were evaluated and analyzed with the analytical tree data obtained as the standard value. For the purpose, six basic evaluation indicators R2, SEE, TRE, MSE, MPE and MPSE were used, and the relevant parameters were summarized (Table 4, Table 5 and Table 6).
After analysis, it is easy to draw the following conclusions:
- The coefficient of determinations of the models in the three evaluation tables are all above 0.95, indicating that the models have a very high explanatory power.
- In the aspect of model checking, TRE of three tree taxa were less than MPE, which was consistent with the law of model checking.
- According to the indices of TRE and MSE, the binary volume model of Populus spp. was superior to the other two species when compared among different tree taxa. Although the trunk types of the three taxa are relatively regular, the Populus spp. modeling samples are significantly more than the other two species, enough data is the premise to ensure the accuracy of modeling.
- Whether the newly established volume model or the ministerial model, binary models were more accurate than unary, which also indicated that the more relevant factors involved in modeling, the more accurate the model fitting, the higher the model accuracy.
- From the accuracy indices of all models, these indicators were all within 3%. According to the “Main Technical Regulations for Forestry Professional Surveys”, if the error of the standing timber table was not more than ±3%, the newly established model was meeting the accuracy requirements.
- The accuracy indices of our newly established models were better than that of the ministerial models.
3.3. Comparative Analysis of New and Old Models
According to relevant regulations, the forest tables are supposed to be updated at least every 20 years. The ministerial volume models (unary/binary model) used in China were established in the 1970s. In order to verify the adaptability of the original ministerial standard model [37,38], the newly established unary volume model was compared with the corresponding ministerial volume model with the sample volume measured on site as the standard value (Figure 5). We found that in the three-tree taxa of unary/binary volume model of the three-tree species (group) Platycladus orientalis, Larix principis-rupprechtii and Populus spp., the newly established volume models and the original ministerial model were consistent with the prediction trend of the sample tree volumes, and both had strong correlation with the standard value of the volume. Compared with the unary model of the two species of Platycladus orientalis and Larix principis-rupprechtii, there was a large deviation between the predicted value of Populus spp. and the standard value. This was because the Populus spp. species involved in the modeling contain Populus tomentosa Carr., Populus canadanensis Moench, and Populus davidiana Dode. It was understandable that such deviations occur in different varieties [39,40]. From the overall trend of the scatter plot, the deviation of the volume prediction was larger as the DBH was larger. However, the predicted value of the newly established unary volume model was always closer to the standard value and had a better prediction effect.
Similarly, comparing the newly established binary volume model with the corresponding ministerial volume model (Figure 6), we found that the trend of change of three tree taxa of Platycladus orientalis, Larix principis-rupprechtii and Populus spp. was consistent. The prediction effect of the new binary volume models was better than that of the unary volume model. We analyzed the binary volume model from DBH and tree height indices and found that in the volume prediction model of three-tree taxa, tree volume had direct relationship with DBH and tree height, and DBH had stronger correlation with tree volume. Tree volume varies regularly with DBH and presents a chaotic trend with tree height. The prediction bias of tree volume increases with the increase of DBH and tree height, but the prediction effect of the new model is better than that of the ministerial model.
In order to further evaluate the adaptability of the original ministerial standard model of the species of Platycladus orientalis, Larix principis-rupprechtii and Populus spp. in Beijing, we estimated the model samples of three tree taxa based on the new established volume model for accuracy evaluation. The data is the basis of comparison, and the two accuracy indices of TRE and MSE were used as evaluation criteria to evaluate and analyze the original volume model (Table 7). The evaluation method conforms to the normative method of model evaluation [11].
TRE and MSE of the six ministerial standard volume models were obviously biased, except for the MSE (−0.62%) of the binary ministerial model of Platycladus orientalis (Table 7). The remaining models have TRE and MSE exceeding the error margin of ±3%, which means that there are large deviations between the unary model of three taxa and the binary model of Larix principis-rupprechtii and Populus spp. The MSE of the binary model of the arborvitae model reflects the systematic nature of the model, and its TRE is also greater than 3%. Therefore, in terms of the overall accuracy of the model, the binary ministerial model of Platycladus orientalis also showed large deviations. Through the adaptive analysis of the six ministerial standard volume models, the original standard models of Platycladus orientalis, Larix principis-rupprechtii and Populus spp. in Beijing have obvious prediction errors, which are not applicable in the Beijing area, and the standing timber volume estimate requires unary/binary volume models of three tree taxa to be reorganized according to the latest standards.
4. Discussion
In recent years, the volume table application has increased due to the current attention to biomass and carbon storage [37,41,42]. Tree volume is an important basis for estimating biomass, carbon storage and other interest factors in forests [43]. In addition to the high precision mentioned in the above experimental results, this study has three significant advantages compared with the existing research results. The first environmentally friendly advantage is that our method is non-destructive. This method changes the traditional methods of cutting down trees, analytic segmentation, and manual measurement [44,45]. The purpose of standing tree volume measurement can be achieved only by using instruments to observe the measured trees without destructive operations. Secondly, this method is cost effective and economical. The analytical work in the traditional method requires a lot of manpower and material resources, and the cost is very high. Later, due to the development of technology, various advanced equipment (spiegel relaskop, total stations, laser scanners, etc.) are continuously introduced into the calculation of tree volume [15,16,19,20,46,47]. Although these technologies perform better than the traditional methods, they are difficult to operate costly and less accurate as compared to electronic theodolites. In addition, the photogrammetry and lidar technology need high-quality expensive digital cameras, three-dimensional laser scanners and softwares (Smart 3D, Pix 4D, Photoscan, Faro scene, Lidar360, Pointscene) [19,20,24,25,26,48]. The third advantage of our method and model is its high efficiency and accuracy. In order to obtain the volume of trees, the traditional analytical work has been laborious, demanding a series of activities including clearing up the surrounding environment disturbance, cutting down the sample trees, removing the branches and leaves, measuring and segmenting the trunk, cutting the trunk disc, drying, analyzing and measuring, which usually takes days or even weeks. Even the advanced measurement methods such as photogrammetry and lidar usually take hours or sometimes days of data processing, especially in point cloud processing, and overall efficiency is low. On the other hand, our method can calculate standing tree volume only by measuring sets of data of trees to be measured with an electronic theodolite. Due to the measurement accuracy of this method being closely related to the trunk shape, in order to eliminate the result error caused by irregular trunk shape this method chooses two vertical positions of the trunk to observe twice, and takes the average value of the two results as the final measurement result. During the period, the total time of the two observations is about 25–30 min, which can save significant time in forestry internal and external industry investigation.
Of course, in practical deployment, this method also has certain limitations. In areas where high-density forests or trees are heavily shielded from each other, the visibility of instrument observations is disturbed, and the accuracy of tree trunk observation and volume measurement is affected. In this case, we can try to solve by adjusting the position of the observation site or the appropriate sparse tree occlusion.
5. Conclusions
This study proposed a non-destructive, efficient and highly precise measurement method for timber volume by using an electronic theodolite. The method was applied to estimate the timber volume of three-tree taxa of Platycladus orientalis, Larix principis-rupprechtii and Populus spp. taxa in comparison with the previously used ministerial models. The precision and accuracy of the new models were meeting the accuracy standards. Moreover, the accuracy indices of ministerial models of Platycladus orientalis, Larix principis-rupprechtii and Populus spp. in Beijing were worse than the accuracy requirement, indicating that they are no longer applicable to the estimation of timber volume in Beijing and needed to be reconstructed.
Presently, the proposed method also has certain limitations. For example, the effectiveness and accuracy of our method might be limited in high-density forests, as the visibility of instrument observations could be disturbed. In further studies this limitation could possibly be addressed by adjusting the position of the observation site or the appropriate sparse tree occlusion. The method is of a non-invasive and non-destructive form that could play a positive role in China’s environmental protection and ecological construction.
Author Contributions
Conceptualization, Z.F. and J.L.; methodology, Z.F.; software, Z.F.; validation, Z.F. and J.L.; formal analysis, J.L.; investigation, Z.F., J.L. and Z.C.; resources, Z.F.; data curation, Z.F.; writing—original draft preparation, J.L.; writing—review and editing, A.M. and T.U.K.; visualization, J.L.; supervision, Z.F.; project administration, Z.F.; funding acquisition, Z.F.
Funding
This research was jointly supported by the National Natural Science Foundation of China (No. U1710123), the Natural Science Foundation of Beijing (Key Program, No.6161001), and the medium long-term project of “Precision Forestry Key Technology and Equipment Research” (No. 2015ZCQ-LX-01).
Acknowledgments
We are grateful to the staff of the Precision Forestry Key Laboratory of Beijing, Beijing Forestry University, and to acknowledge all the people who have contributed to this paper.
Conflicts of Interest
The authors declare no conflict of interest.
References
- Kauppi, P.E.; Sandstrom, V.; Lipponen, A. Forest resources of nations in relation to human well-being. PLoS ONE 2018, 13, e0196248. [Google Scholar] [CrossRef] [PubMed]
- Mingjun, L.; Lifei, Y.; Huanbai, X. The Prediction of Forest Carbon Sequestration Dynamics in Guizhou Province and Relevant Influencing Factors. Pak. J. Bot. 2018, 50, 1159–1170. [Google Scholar]
- Tomppo, E.; Malimbwi, R.; Katila, M.; Makisara, K.; Henttonen, H.M.; Chamuya, N.; Zahabu, E.; Otieno, J. A sampling design for a large area forest inventory: Case Tanzania. Can. J. Forest Res.-Rev. Can. Rech. For. 2014, 44, 931–948. [Google Scholar] [CrossRef]
- Mauro, F.; Monleon, V.J.; Temesgen, H.; Ford, K.R. Analysis of area level and unit level models for small area estimation in forest inventories assisted with LiDAR auxiliary information. PLoS ONE 2017, 12, e189401. [Google Scholar] [CrossRef] [PubMed]
- CAO, Z. Research on Non-Destructive Precision Measurement and Modeling Method of Standing Timber; Beijing Forestry University: Beijing, China, 2015. [Google Scholar]
- Eastaugh, C.S. Relationships between the mean trees by basal area and by volume: Reconciling form factors in the classic Bavarian yield and volume tables for Norway spruce. Eur. J. Forest Res. 2014, 133, 871–877. [Google Scholar] [CrossRef]
- Kim, S.W.; Lee, S.J.; Park, H. Development of Local Stem Volume Table for Pinus densiflora S. et Z. Using Tree Stem Taper Model. Korean J. Agric. Forest Meteorol. 2014, 16, 327–335. [Google Scholar]
- Zeng, W.; Zhang, L.; Chen, X.; Cheng, Z.; Ma, K.; Li, Z. Construction of compatible and additive individual-tree biomass models for Pinus tabulaeformis in China. Can. J. Forest. Res. 2017, 47, 467–475. [Google Scholar] [CrossRef]
- Pohjonen, V. Volume equations and volume tables of Juniperus procera Hocht. ex. Endl. Forest Ecol. Manag. 1991, 2–4, 185–200. [Google Scholar] [CrossRef]
- Lotfalian, M.; Nouri, Z.; Kooch, Y.; Zobeiri, M. Measuring tree height and preparation volume table using an innovative method. Pak. J. Biol. Sci. 2007, 10, 3734–3737. [Google Scholar] [PubMed]
- Ministry of Forestry, C. Major Specifications on Specialized Forestry Surveys; China Forestry Publishing House: Beijing, China, 1990. [Google Scholar]
- Li, H.; Zeng, W. Validation and comparison of two-variable tree volume tables for Larix spp. in different regions of China. Linye Kexue/Sci. Silvae Sin. 2016, 52, 157–162. [Google Scholar]
- Bédard, S.; Duchesne, I.; Guillemette, F.; DeBlois, J. Predicting volume distributions of hardwood sawn products by tree grade in eastern Canada. Forestry 2017, 91, 341–353. [Google Scholar] [CrossRef]
- Netto, S.P.; Pelissari, A.L.; Cysneiros, V.C.; Bonazza, M.; Sanquetta, C.R. Sampling procedures for inventory of commercial volume tree species in Amazon Forest. An. Acad. Bras. Cienc. 2017, 89, 1829–1840. [Google Scholar] [CrossRef] [Green Version]
- Yan, F.; Ullah, M.R.; Gong, Y.; Feng, Z.; Chowdury, Y.; Wu, L. Use of a no prism total station for field measurements in Pinus tabulaeformis Carr. stands in China. Biosyst. Eng. 2012, 113, 259–265. [Google Scholar] [CrossRef]
- Feng, Z.; Yan, F.; Ullah, M.R.; Dang, Y. Developing a Volume Model Using South NTS-372R Total Station without Tree Felling in a Populus canadensis Moench Plantation in Beijing, China. Croat. J. For. Eng. 2017, 38, 141–150. [Google Scholar]
- Berveglieri, A.; Tommaselli, A.; Liang, X.; Honkavaara, E. Photogrammetric measurement of tree stems from vertical fisheye images. Scand. J. Forest Res. 2017, 32, 737–747. [Google Scholar] [CrossRef]
- Mokroš, M.; Výbošťok, J.; Tomaštík, J.; Grznárová, A.; Valent, P.; Slavík, M.; Merganič, J. High Precision Individual Tree Diameter and Perimeter Estimation from Close-Range Photogrammetry. Forests 2018, 9, 696. [Google Scholar] [CrossRef]
- Liang, X.; Hyyppa, J.; Kaartinen, H.; Lehtomaki, M.; Pyorala, J.; Pfeifer, N.; Holopainen, M.; Brolly, G.; Francesco, P.; Hackenberg, J.; et al. International benchmarking of terrestrial laser scanning approaches for forest inventories. ISPRS J. Photogramm. 2018, 144, 137–179. [Google Scholar] [CrossRef]
- Astrup, R.; Ducey, M.J.; Granhus, A.; Ritter, T.; von Lüpke, N. Approaches for estimating stand-level volume using terrestrial laser scanning in a single-scan mode. Can. J. Forest Res. 2014, 44, 666–676. [Google Scholar] [CrossRef]
- Wieser, M.; Mandlburger, G.; Hollaus, M.; Otepka, J.; Glira, P.; Pfeifer, N. A Case Study of UAS Borne Laser Scanning for Measurement of Tree Stem Diameter. Remote Sens. 2017, 9, 1154. [Google Scholar] [CrossRef]
- Clark, N.A.; Wynne, R.H.; Schmoldt, D.L. A review of past research on dendrometers. Forest Sci. 2000, 46, 570–576. [Google Scholar]
- Kalliovirta, J.; Laasasenaho, J.; Kangas, A. Evaluation of the Laser-relascope. Forest Ecol. Manag. 2005, 204, 181–194. [Google Scholar] [CrossRef]
- Mikita, T.; Janata, P.; Surovy, P. Forest Stand Inventory Based on Combined Aerial and Terrestrial Close-Range Photogrammetry. Forests 2016, 7, 165. [Google Scholar] [CrossRef]
- Liu, J.; Feng, Z.; Yang, L.; Mannan, A.; Khan, T.U.; Zhao, Z.; Cheng, Z. Extraction of Sample Plot Parameters from 3D Point Cloud Reconstruction Based on Combined RTK and CCD Continuous Photography. Remote Sens. 2018, 10, 1299. [Google Scholar] [CrossRef]
- Fankhauser, K.E.; Strigul, N.S.; Gatziolis, D. Augmentation of Traditional Forest Inventory and Airborne Laser Scanning with Unmanned Aerial Systems and Photogrammetry for Forest Monitoring. Remote Sens. 2018, 10, 1562. [Google Scholar] [CrossRef]
- Feng, Z.; Cao, Z.; Gao, Y.; Feng, Z.; Feng, Z.; Yu, D.; Qiu, Z.; Liu, J. An accurate measurement method for electronic theodolite standing timber [P]. China Patent ZL 2013 1 0122017.X, 31 May 2017. [Google Scholar]
- Javier Corral-Rivas, J.; Jose Vega-Nieva, D.; Rodriguez-Soalleiro, R.; Antonio Lopez-Sanchez, C.; Wehenkel, C.; Vargas-Larreta, B.; Gabriel Alvarez-Gonzalez, J.; Daria Ruiz-Gonzalez, A. Compatible System for Predicting Total and Merchantable Stem Volume over and under Bark, Branch Volume and Whole-Tree Volume of Pine Species. Forests 2017, 8, 417. [Google Scholar] [CrossRef]
- Vasilescu, M.M.; Teresneu, C.C.; Dinulica, F.; Alexandruborz, S.; Popa, B. A New Stem Volume Equation for Norway Spruce (Picea abies (L.) Karst) Trees in Romania. Balt For. 2017, 23, 626–635. [Google Scholar]
- He, D.; Zeng, W.; Luo, Q. Research on Collection of Sample for Modeling of Commonly Used Two- Way Tree Volume Model. Cent. South Forest Inventory Plan. 2001, 20, 1–9. [Google Scholar]
- Jonsson, T.; Snorrason, A. Single tree aboveground biomass models for native birch in Iceland. Icel. Agric. Sci. 2018, 31, 65–80. [Google Scholar] [CrossRef]
- Zeng, W.; Luo, Q.; He, D. Research on weighting regression and modelling. Sci. Silva Sin. 1999, 35, 5–11. [Google Scholar]
- Pardo-Iguzquiza, E.; Dowd, P.A. Comparison of inference methods for estimating semivariogram model parameters and their uncertainty: The case of small data sets. Comput. Geosci. 2013, 50, 154–164. [Google Scholar] [CrossRef] [Green Version]
- Del Monego, M., Jr.; Ribeiro, P.J.; Ramos, P. Comparing the performance of geostatistical models with additional information from covariates for sewage plume characterization. Environ. Sci. Pollut. Res. 2015, 22, 5850–5863. [Google Scholar] [CrossRef] [PubMed]
- Zeng, W.; Tang, S. Goodness Evaluation and Precision Analysis of Tree Biomass Equations. Sci. Silva Sin. 2011, 47, 106–113. [Google Scholar]
- Agriculture and Forestry Ministry, C. Tree volume tables. In LY 208—77; China Standard Press: Beijing, China, 1978. [Google Scholar]
- Tanhuanpaa, T.; Kankare, V.; Setlala, H.; Yli-Pelkonen, V.; Vastaranta, M.; Niemi, M.T.; Raisio, J.; Holopainen, M. Assessing above-ground biomass of open-grown urban trees: A comparison between existing models and a volume-based approach. Urban For. Urban Green. 2017, 21, 239–246. [Google Scholar] [CrossRef]
- Arias-Rodil, M.; Dieguez-Aranda, U.; Burkhart, H.E. Effects of Measurement Error in Total Tree Height and Upper-Stem Diameter on Stem Volume Prediction. Forest Sci. 2017, 63, 250–260. [Google Scholar] [CrossRef] [Green Version]
- Nabeshima, E.; Kubo, T.; Hiura, T. Variation in tree diameter growth in response to the weather conditions and tree size in deciduous broad-leaved trees. Forest Ecol. Manag. 2010, 259, 1055–1066. [Google Scholar] [CrossRef]
- Rollinson, C.R.; Kaye, M.W.; Canham, C.D. Interspecific variation in growth responses to climate and competition of five eastern tree species. Ecology 2016, 97, 1003–1011. [Google Scholar] [CrossRef]
- Mensah, S.; Veldtman, R.; du Toit, B.; Kakai, R.G.; Seifert, T. Aboveground Biomass and Carbon in a South African Mistbelt Forest and the Relationships with Tree Species Diversity and Forest Structures. Forests 2016, 7, 79. [Google Scholar] [CrossRef]
- Bilous, A.; Myroniuk, V.; Holiaka, D.; Bilous, S.; See, L.; Schepaschenko, D. Mapping growing stock volume and forest live biomass: A case study of the Polissya region of Ukraine. Environ. Res. Lett. 2017, 12, 105001. [Google Scholar] [CrossRef]
- Sisay, K.; Thurnher, C.; Belay, B.; Lindner, G.; Hasenauer, H. Volume and Carbon Estimates for the Forest Area of the Amhara Region in Northwestern Ethiopia. Forests 2017, 8, 122. [Google Scholar] [CrossRef]
- Ong, J.E.; Gong, W.K.; Wong, C.H. Allometry and partitioning of the mangrove, Rhizophora apiculata. For. Ecol. Manag. 2004, 188, 395–408. [Google Scholar] [CrossRef]
- Dauber, E.; Fredericksen, T.S.; Pena-Claros, M. Sustainability of timber harvesting in Bolivian tropical forests. Forest Ecol. Manag. 2005, 214, 294–304. [Google Scholar] [CrossRef]
- Kwak, D.; Lee, W.; Cho, H.; Lee, S.; Son, Y.; Kafatos, M.; Kim, S. Estimating stem volume and biomass of Pinus koraiensis using LiDAR data. J. Plant. Res. 2010, 123, 421–432. [Google Scholar] [CrossRef] [PubMed]
- Pique, M.; Obon, B.; Condes, S.; Saura, S. Comparison of relascope and fixed-radius plots for the estimation of forest stand variables in northeast Spain: An inventory simulation approach. Eur. J. Forest Res. 2011, 130, 851–859. [Google Scholar] [CrossRef]
- Fei, L.; Yan, L.; Chen, C.; Ye, Z.; Zhou, J. OSSIM: An Object-Based Multiview Stereo Algorithm Using SSIM Index Matching Cost. IEEE Trans. Geosci. Remote Sens. 2017, 55, 6937–6949. [Google Scholar] [CrossRef]
Figure 1.
Location map of acquisition point of analytic cut trees and electronic theodolite.
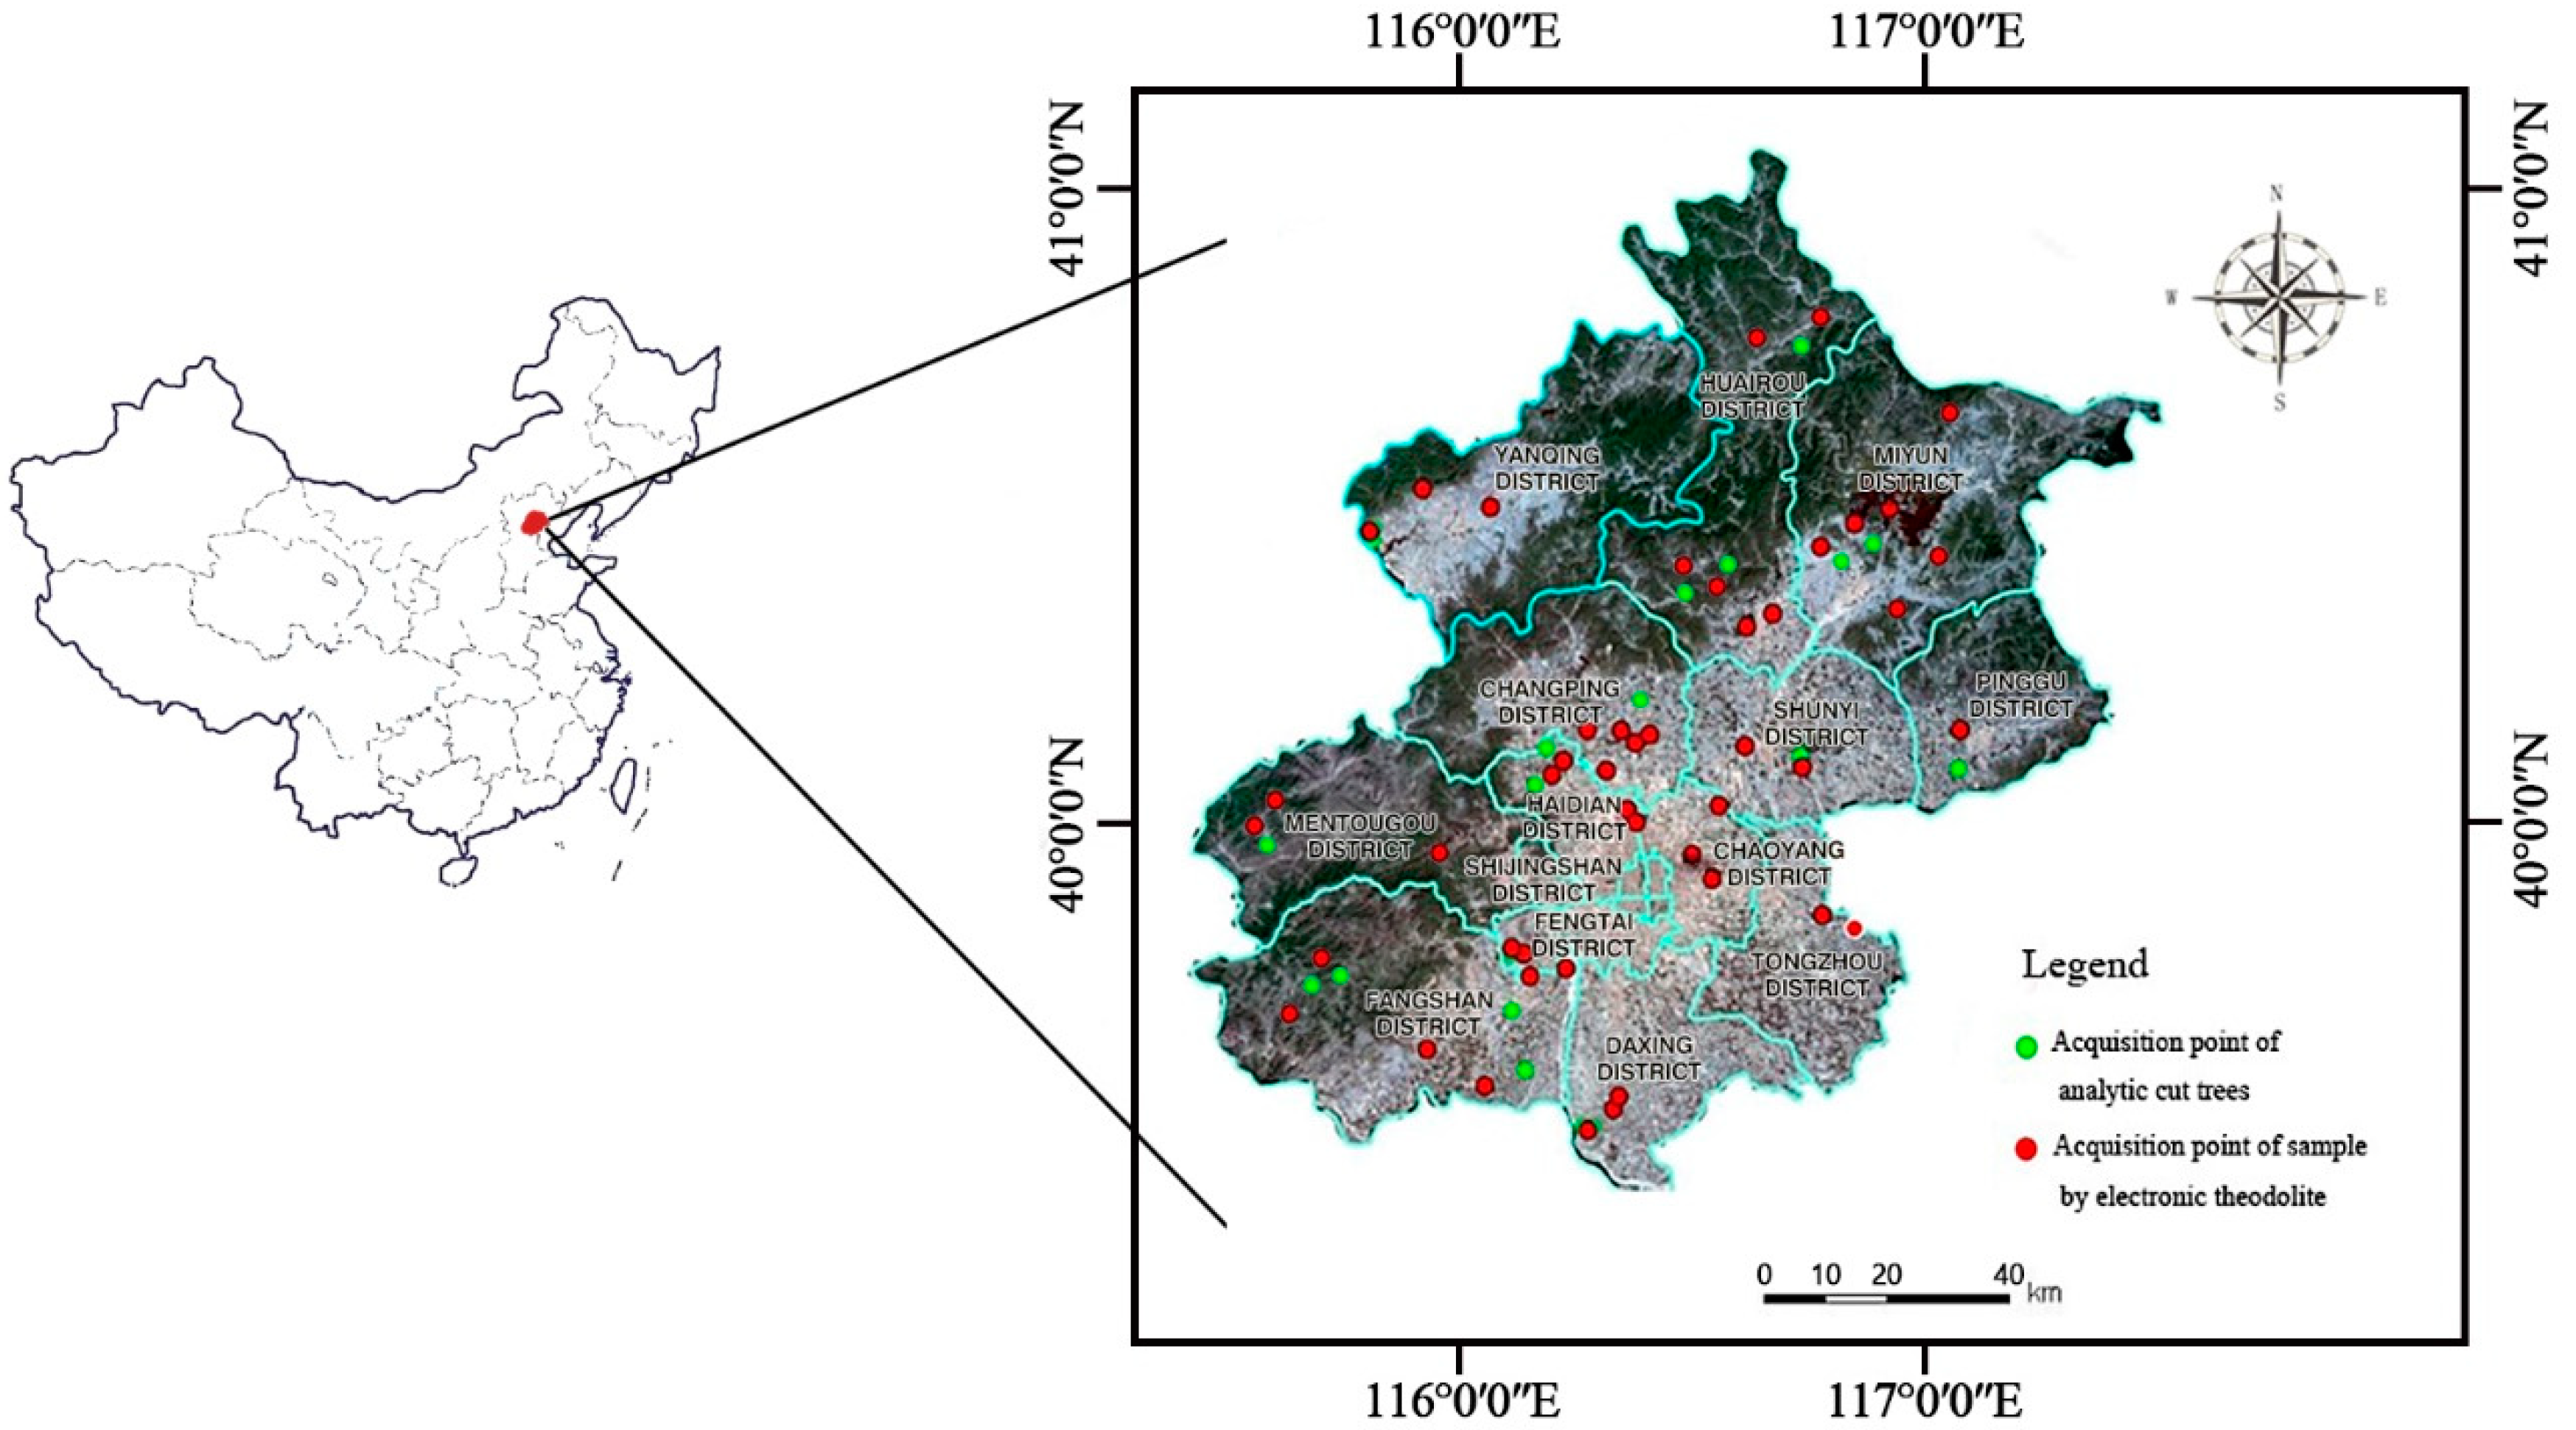
Figure 2.
Experimental instrument—electronic theodolite.

Figure 3.
Principle of stumpage observation for electronic theodolite. H is the height of the tree, is the height of the trunk segment, is the diameter of the trunk segment, is the horizontal angle corresponding to the diameter of the trunk segment, and is the corresponding zenith distance, i = 1,2,3,…, n, where .

Figure 4.
Schematic diagram of the column method. is the diameter of the different cross-section of the trunk, is the height from the ground of the corresponding cross-sectional diameter , i = 0, 1, 2, 3,…, n, where is the trunk diameter (diameter at breast height, DBH) at 1.3 m from the ground, .
Figure 4.
Schematic diagram of the column method. is the diameter of the different cross-section of the trunk, is the height from the ground of the corresponding cross-sectional diameter , i = 0, 1, 2, 3,…, n, where is the trunk diameter (diameter at breast height, DBH) at 1.3 m from the ground, .

Figure 5.
Comparative analysis of differences between new and old unary volume models of three-tree taxa. (a), (b) and (c) respectively represent the scatter plots of the volume value of three tree taxa with the change of DBH, where black is the measured value, red is the predicted value of the new model, and blue is the predicted value of the ministerial model.

Figure 6.
Comparative analysis of differences between new and old binary volume models of three tree taxa. (a), (c) and (e) respectively represent the scatter plot of volume value with the change of DBH in the binary volume models of three species taxa. (b), (d) and (f) respectively represent the scatter plot of volume value with the change of DBH in the binary volume models of three species taxa. Among them, black is the measured value, red is the predicted value of the new model, and blue is the predicted value of the ministerial model.


Table 1.
Sample Size of 3 Tree Taxa.
| Species | Tree Cutting/Tree | Precise Measurement of Electronic Theodolite/Tree | Total/Tree |
|---|---|---|---|
| Platycladus orientalis (L.) Franco | 153 | 201 | 354 |
| Larix principis-rupprechtii Mayr | 160 | 296 | 456 |
| Populus spp. L. | 87 | 1680 | 1767 |
| Total | 400 | 2177 | 2577 |
Table 2.
Parameter statistics of three tree species (group) modeling samples. DBH: diameter at breast height.
Table 2.
Parameter statistics of three tree species (group) modeling samples. DBH: diameter at breast height.
| Species | Statistical Indicators | DBH/cm | Ground Diameter/cm | Tree Height/m | Volume/m3 |
|---|---|---|---|---|---|
| Platycladus Orientalis | Minimum | 5.1 | 6.5 | 3.86 | 0.005884 |
| Maximum | 41.2 | 50.1 | 17.51 | 0.728600 | |
| Average | 16.2 | 19.8 | 9.47 | 0.147165 | |
| Standard deviation | 8.3 | 9.6 | 3.03 | 0.166247 | |
| Larix Principis-Rupprechtii | Minimum | 5.0 | 7.1 | 4.25 | 0.005705 |
| Maximum | 43.5 | 56.2 | 24.10 | 1.293850 | |
| Average | 19.3 | 24.4 | 13.21 | 0.308420 | |
| Standard deviation | 10.2 | 12.3 | 5.23 | 0.335334 | |
| Populus spp. | Minimum | 5.2 | 6.9 | 9.20 | 0.0114 |
| Maximum | 73.1 | 89.5 | 35.10 | 6.1957 | |
| Average | 25.0 | 30.3 | 21.60 | 0.7961 | |
| Standard deviation | 12.9 | 15.1 | 4.60 | 1.0200 |
Table 3.
Summary of the new model and ministerial model of three tree taxa.
| Model | Name | Species | Equation |
|---|---|---|---|
| Newly established model | Unary volume model | Platycladus orientalis | V1 = 0.0001440D2.355 |
| Newly established model | Binary volume model | Platycladus orientalis | V2 = 0.00006378D1.812H1.023 |
| Ministerial standard model 1 | Unary volume model | Platycladus orientalis | V01 = 0.0001380D2.301 |
| Ministerial standard model 1 | Binary volume model | Platycladus orientalis | V02 = 0.00009197D1.863H0.831 |
| Newly established model | Unary volume model | Larix principis-rupprechtii | V1 = 0.0001199D2.509 |
| Newly established model | Binary volume model | Larix principis-rupprechtii | V2 = 0.00006286D1.899H0.937 |
| Ministerial standard model 2 | Unary volume model | Larix principis-rupprechtii | V01 = 0.0000974D2.539 |
| Ministerial standard model 2 | Binary volume model | Larix principis-rupprechtii | V02 = 0.00006777D1.811H0.980 |
| Newly established model | Unary volume model | Populus spp. | V1 = 0.0006781D1.954 |
| Newly established model | Binary volume model | Populus spp. | V2 = 0.00005171D1.947H0.9372 |
| Ministerial standard model 3 | Unary volume model | Populus spp. | V01 = 0.0006572D1.931 |
| Ministerial standard model 3 | Binary volume model | Populus spp. | V02 = 0.00006567D1.941H0.8492 |
1, 2, 3 The standard model (unary/binary model) of the three tree taxa selected here is the standing timber volume table established and promulgated by the Ministry of Agriculture and Forestry of the People’s Republic of China in 1978 [36].
Table 4.
Accuracy analysis and comparison results of new models and ministerial models of Platycladus orientalis. SEE: the standard error of estimate, TRE: the total relative error, MSE: the mean systematic error, MPE: the mean prediction error, MPSE: the mean percent standard error.
Table 4.
Accuracy analysis and comparison results of new models and ministerial models of Platycladus orientalis. SEE: the standard error of estimate, TRE: the total relative error, MSE: the mean systematic error, MPE: the mean prediction error, MPSE: the mean percent standard error.
| Models | R2 | SEE | TRE/% | MSE/% | MPE/% | MPSE/% |
|---|---|---|---|---|---|---|
| Newly established unary volume model | 0.9534 | 0.0358 | 0.75 | 0.39 | 2.93 | 14.03 |
| Newly established binary volume model | 0.9677 | 0.0411 | 1.23 | 0.67 | 3.48 | 15.74 |
| Ministerial standard unary model | 0.9866 | 0.0193 | 0.37 | 0.63 | 1.58 | 6.45 |
| Ministerial standard binary model | 0.9654 | 0.0234 | 1.14 | 0.74 | 1.72 | 9.56 |
Table 5.
Accuracy analysis and comparison results of new models and ministerial models of Larix principis-rupprechtii.
Table 5.
Accuracy analysis and comparison results of new models and ministerial models of Larix principis-rupprechtii.
| Models | R2 | SEE | TRE/% | MSE/% | MPE/% | MPSE/% |
|---|---|---|---|---|---|---|
| Newly established unary volume model | 0.9636 | 0.0641 | −0.59 | 0.00 | 2.35 | 15.96 |
| Newly established binary volume model | 0.9716 | 0.0578 | 1.02 | 0.47 | 2.94 | 13.78 |
| Ministerial standard unary model | 0.9898 | 0.0340 | −0.40 | 0.45 | 1.25 | 6.76 |
| Ministerial standard binary model | 0.9844 | 0.0748 | −0.56 | 0.77 | 2.59 | 7.79 |
Table 6.
Accuracy analysis and comparison results of new models and ministerial models of Populus spp.
Table 6.
Accuracy analysis and comparison results of new models and ministerial models of Populus spp.
| Models | R2 | SEE | TRE/% | MSE/% | MPE/% | MPSE/% |
|---|---|---|---|---|---|---|
| Newly established unary volume model | 0.9874 | 0.1002 | −0.94 | 0.77 | 1.76 | 10.87 |
| Newly established binary volume model | 0.9967 | 0.2014 | 1.08 | 1.95 | 2.06 | 11.28 |
| Ministerial standard unary model | 0.9734 | 0.17 | 0.28 | 0.34 | 1.03 | 9.39 |
| Ministerial standard binary model | 0.9795 | 0.28 | 0.94 | 0.64 | 1.97 | 10.13 |
Table 7.
Results of the conformity test of the volume model.
| Models | TRE/% | MSE (%) | Test Conclusion |
|---|---|---|---|
| Platycladus orientalis unary model (ministerial) | 21.13 | 18.15 | Obviously biased |
| Platycladus orientalis binary model (ministerial) | 3.62 | −0.62 | Lightly biased |
| Larix principis-rupprechtii unary model (ministerial) | 11.78 | 13.96 | Obviously biased |
| Larix principis-rupprechtii binary model (ministerial) | 14.72 | 13.63 | Obviously biased |
| Populus spp. unary model (ministerial) | 7.84 | 7.48 | Obviously biased |
| Populus spp. binary model (ministerial) | 6.84 | 4.97 | Obviously biased |
© 2019 by the authors. Licensee MDPI, Basel, Switzerland. This article is an open access article distributed under the terms and conditions of the Creative Commons Attribution (CC BY) license (http://creativecommons.org/licenses/by/4.0/).
Share and Cite
MDPI and ACS Style
Liu, J.; Feng, Z.; Mannan, A.; Khan, T.U.; Cheng, Z. Comparing Non-Destructive Methods to Estimate Volume of Three Tree Taxa in Beijing, China. Forests 2019, 10, 92. https://doi.org/10.3390/f10020092
AMA Style
Liu J, Feng Z, Mannan A, Khan TU, Cheng Z. Comparing Non-Destructive Methods to Estimate Volume of Three Tree Taxa in Beijing, China. Forests. 2019; 10(2):92. https://doi.org/10.3390/f10020092
Chicago/Turabian StyleLiu, Jincheng, Zhongke Feng, Abdul Mannan, Tauheed Ullah Khan, and Zhuxin Cheng. 2019. "Comparing Non-Destructive Methods to Estimate Volume of Three Tree Taxa in Beijing, China" Forests 10, no. 2: 92. https://doi.org/10.3390/f10020092
Note that from the first issue of 2016, this journal uses article numbers instead of page numbers. See further details here.