Article

Attribution Analysis for Runoff Change on Multiple Scales in a Humid Subtropical Basin Dominated by Forest, East China

1
School of Resources and Environment, University of Electronic Science and Technology of China, Chengdu 611731, China
2
Big Data Research Center, University of Electronic Science and Technology of China, Chengdu 611731, China
3
State Key Laboratory of Hydrology-Water Resources and Hydraulic Engineering, Nanjing Hydraulic Research Institute, Nanjing 210029, China
4
Department of Civil Engineering, Faculty of Engineering, University of Bristol, Bristol BS8 1TR, UK
5
State Key Laboratory of Hydrology-Water Resources and Hydraulic Engineering, College of Hydrology and Water Resources, Hohai University, Nanjing 210098, China
6
School of Computer Science and Engineering, University of Electronic Science and Technology of China, Chengdu 611731, China
*
Author to whom correspondence should be addressed.
Forests 2019, 10(2), 184; https://doi.org/10.3390/f10020184
Submission received: 12 January 2019 / Revised: 15 February 2019 / Accepted: 19 February 2019 / Published: 20 February 2019
(This article belongs to the Special Issue Forest Hydrology and Watershed)

Abstract

:
Attributing runoff change to different drivers is vital in order to better understand how and why runoff varies, and to further support decision makers on water resources planning and management. Most previous works attributed runoff change in the arid or semi-arid areas to climate variability and human activity on an annual scale. However, attribution results may differ greatly according to different climatic zones, decades, temporal scales, and different contributors. This study aims to quantitatively attribute runoff change in a humid subtropical basin (the Qingliu River basin, East China) to climate variability, land-use change, and human activity on multiple scales over different periods by using the Soil and Water Assessment Tool (SWAT) model. The results show that runoff increased during 1960–2012 with an abrupt change occurring in 1984. Annual runoff in the post-change period (1985–2012) increased by 16.05% (38.05 mm) relative to the pre-change period (1960–1984), most of which occurred in the winter and early spring (March). On the annual scale, climate variability, human activity, and land-use change (mainly for forest cover decrease) contributed 95.36%, 4.64%, and 12.23% to runoff increase during 1985–2012, respectively. On the seasonal scale, human activity dominated runoff change (accounting for 72.11%) in the dry season during 1985–2012, while climate variability contributed the most to runoff change in the wet season. On the monthly scale, human activity was the dominant contributor to runoff variation in all of the months except for January, May, July, and August during 1985–2012. Impacts of climate variability and human activity on runoff during 2001–2012 both became stronger than those during 1985–2000, but counteracted each other. The findings should help understandings of runoff behavior in the Qingliu River and provide scientific support for local water resources management.

Graphical Abstract

1. Introduction

Runoff is a key quantitative indicator for water resources availability and river regimes. Its variation may affect water-use patterns (in different sectors such as agriculture, domestic, and industry) and water resources management. Climate variability and human activity are suggested to be two primary driving factors for runoff variation [1]. Climate variability may alter runoff by changing the spatiotemporal distributions of temperature, evaporation, and precipitation [2]. Human activity includes land-use change, water withdraw, and hydraulic engineering operation, which exert impacts on runoff by changing the underlying properties and the runoff generation mechanisms of the basin [3]. Attributing the runoff change to different driving factors could help better understand how and why runoff varies, and could further support decision makers with water resources planning and management.
Numerous methods have been proposed for runoff attribution analysis, which can be broadly classified into three categories: diagrammatizing methods (i.e., Budyko curves [4], Tomer–Schilling framework [5], modified double-mass curves [6,7]), numerical calculation-based methods (e.g., elasticity [8], sensitivity [9]), hydrologic models [3,10], and field data-based methods [11]. Different methods have both advantages and shortcomings. Specifically, the field data-based method is often limited by the availability of long-term observations of paired experimental catchments. The diagrammatizing methods are easy for intuitive understanding, but the introduced parameters for actual evaporation estimation are difficult to be quantified [2]. Numerical calculation-based methods, particularly for hydrological model-based approaches, have been widely adopted in runoff attribution studies due to their consideration of basin hydrological processes. Among the diverse hydrological models, the Soil and Water Assessment Tool (SWAT) has demonstrated its effectiveness. For instance, Marhaento et al. [12] and Anand et al. [13] investigated the impact of land-use change on water balance using the SWAT model. Zuo et al. [14] assessed the effects of land-use and climate changes on runoff on the Loess Plateau of China by using the SWAT model.
There also have been extensive studies that separate the impacts of climate variability and human activity (including urbanization, deforestation) on runoff change across world [1,7,15]. Montenegro and Ragab [16] separated the contributions of climate and land-use changes in Northeast Brazil. Poelmans et al. [17] attributed runoff variation to climate change and human activity in central Belgium. Zhao et al. [18] estimated the effects of vegetation and climate changes on runoff in the paired catchments in Australia, New Zealand, and South Africa. Zhang et al. [19] investigated the attribution of runoff changes for 107 catchments in central and northern China. However, most existing studies more focus on runoff change in the arid and semi-arid areas, which are more likely to face water scarcity.
Nevertheless, rivers in the humid and semi-humid climate regions also suffer frequent and intensive flood and drought events, which result in huge losses in the riverine communities. For example, in the 1998 flood disaster in the Yangtze River, 223 million people were affected, 3004 people died, 15 million became homeless, and 15 million farmers lost their crops. By the end of August 1998, the direct economic damage was estimated at over USD $20 billion [20]. In addition, the effects of climate and human activity on runoff may vary greatly depending on the different geographic locations, climatic zones, decades, temporal scales, and different contributors considered [21,22]. Furthermore, different kinds of human activities exert different impacts on runoff. Land-use change, as one common and key type of human activity, and its impact on runoff is supposed to be quantified separately from that of the whole human activities. Therefore, it would be of great importance to comprehensively study the effects of climate variability, land-use change, and human activity on runoff variation at multiple scales in the river located in the humid and semi-humid areas.
In China, among seven major rivers, five large rivers (Yellow River [10,23], Haihe River [2,24], Huaihe River [25,26], Liao River [21], and Songhua River [27,28]) are situated in arid and semi-arid northern China, and have been widely investigated. In contrast, attribution for runoff change in the humid and semi-humid climate zone is insufficiently studied [29]. More recently, Shen et al. [21] evaluated runoff variation and its causes within the Budyko framework across 224 catchments in China, including the humid climate regions. Zhai and Tao [3] studied the contributions of climate change and human activities to runoff change in seven typical catchments in China by using the hydrological model. However, separating contributions of land-use change from human activity and runoff attribution on multiple temporal scales still needs to be further studied.
In this study, the authors aim to quantitatively assess the contributions of climate variability, land-use change, and human activity to runoff change in the Qingliu River on multiple (monthly, seasonal, annual) scales over different periods (1985–2012, 1985–2000, and 2001–2012) by using a SWAT model. The objectives are to answer the following questions: (1) What changes have occurred in the runoff of the forest-dominated Qingliu River basin? (2) What are the dominant driving factors behind runoff change in the Qingliu River: climate variability, human activity, or land-use/cover change? (3) Will the dominant driving factor differ according to the different temporal scales and change over different periods?

2. Study Area and Data Acquisition

2.1. Study Area

The Qingliu River, a secondary order tributary of the lower Yangtze River, originates from the Huangfu and Mopan mountains, and flows southeast through Chuzhou city with a length of 84 km. The Qingliu River basin (36°21′–37°19′ N, 108°38′–110°29′ E; Figure 1) covers a drainage area of 1070 km2. The basin was dominated by evergreen broad-leaved forest, but has experienced climate variability, forest-cover change, and dam constructions in recent years [30,31,32]. The mean altitude of the basin is 77 m, and the mean slope of river channel is 1.23‰ [33]. The study area belongs to a humid subtropical climate zone that is hot and rainy in summer while mild and dry in winter. The mean annual temperature ranges from 11.1 °C to 17.2 °C, and the mean annual precipitation was about 1053 mm between 1960 and 2012 [34]. Seven rain gauges and one hydrological station were set up in the study area. The Shaheji reservoir and the Chengxi reservoir started operations since 1962 and 1965 with storage of 52.1 million m3 and 44 million m3, respectively [31].
Chuzhou city experienced rapid socio-economic development between 1960 and 2012. Specifically, statistical data indicate that the total population in Chuzhou has increased from 2.12 million in 1964 to 3.44 million in 1984 and 4.52 million in 2012 [35]. The mean annual growth rates of the population over the periods of 1964–1984, 1984–2000, and 2000–2012 were 24.40‰, 13.36‰, and 5.17‰, respectively. The gross domestic product (GDP) has grown from 2.45 billion CNY (China Yuan) in 1978 to 97.07 billion CNY in 2012. The structure of the primary, secondary, and tertiary industries has changed from 70.51:15.42:14.07 in 1974 to 19.8:52.3:27.9 in 2012 [35]. With the development of society and the economy, land use also has undergone changes, mainly transferring from forest and farmland to residential areas [32,36].
The basin also undergone extreme hydro-meteorological events such as floods in 1991, 2003, and 2008, and droughts in 1967–1969 and 2017. According to the hydrological record [33], the flood event from 2003 caused the flooding of an area of 2680 km2, and an economic loss of USD $0.65 billion. Besides, 2.43 million people in 163 counties were affected, 79,000 houses collapsed, 139 embankments were destroyed, and the Beijing–Shanghai railway was interrupted twice.

2.2. Data Acquisition

Climatic data of daily precipitation, temperature, wind speed, pan evaporation, and solar radiation from 1960–2012 were collected by the China Meteorological Data Service Center (http://data.cma.cn). Monthly runoff data of the Chuzhou hydrometric station were provided by the Anhui Hydrology Bureau (http://www.ahsl.gov.cn). The digital elevation data (DEM) data with a spatial resolution of 30 m were obtained from the Geospatial Data Cloud (http://www.gscloud.cn). Land-use maps from 1981 and 2010 were interpreted from Landsat imagery downloaded from the United States Geological Survey (USGS) (https://www.usgs.gov). Here, the land-use classification results in 1981 and 2010 were used to represent land-use status in the baseline period and the disturbed period, respectively. Soil type data were collected from the Harmonized World Soil Database (HWSD) (https://daac.ornl.gov/SOILS/guides/HWSD.html). Necessary soil attributes (e.g., soil depth, soil texture, and soil grain composition) were extracted from the Soil Topography of China. Sectional attributes were calculated in the Soil–Plant–Atmosphere–Water Model (SPAW) according to organic matter, soil texture, organic matter, and gravel content.

3. Methodology

3.1. Mann–Kendall Test for Trend Analysis

The non-parametric rank-based Mann–Kendall test [37], which has been recommended by the World Meteorological Organization to identify trends in the hydrological and meteorological time series [14], has been adopted for the purpose of this study. In the Mann–Kendall test, there is a null hypothesis (H0) that no trend exists in the data. For a data series x = {x1, x2, , xn} in which n > 10, the standard normal statistic Z is estimated by following Equations (1) to (4)):
Z = { S 1 v a r ( S )       S > 0 0                       S = 0   S + 1 v a r ( S )         S < 0
S = i = 1 n 1 j = i + 1 n s g n ( x j x i )
var ( S ) = n ( n 1 ) ( 2 n + 5 ) 18
s g n ( x j x i ) = { + 1       x j x i > 0 0         x j x i = 0 1       x j x i < 0
where n is the number of the data points. Given a certain level of confidence (α), the null hypothesis of no trend is rejected if | Z | Z 1 α 2 . When the significance levels are set at 0.01, 0.05, and 0.1, the values of | Z 1 α 2 | are 2.58, 1.96, and 1.65, respectively. A positive value of Z denotes an increasing trend, and the opposite corresponds to a decreasing one.

3.2. Mann–Kendall Method for Change Detection

A number of parametric and non-parametric methods have been widely used for abrupt change detection in time series [38]. Most parametric methods (e.g., the moving t-test technique [14] and Yamamoto method [39]) assume that the data series are independent and normally distributed. However, unknown probability distribution is frequently encountered in hydrological and meteorological records. Therefore, in this study, the authors selected the non-parametric Mann–Kendall method to detect the abrupt change point of the runoff series.
The Mann–Kendall method is based on the Mann–Kendall test (see Section 3.1) statistic, but it is calculated for sub-sets of the series. For the time series xi (1 ≤ ik), the numbers ai of elements xj preceding it (ji) have been calculated (Equations (5) and (6)). Under the null hypothesis (i.e., no trend assumed), the rank series Sk is normally distributed with mean and variance being E(Sk) (Equation (7)) and Var(Sk) (Equation (8)), respectively. Let UFk be the standard normal distribution (Equation (9)).
S k = i = 1 k a i ( k = 2 ,   3 ,   4 , , n )
a i = { 1   X i X j 0   X i < X j   ; 1 j i
E ( S k ) = k ( k + 1 ) 4
V a r ( S k ) = k ( k 1 ) ( 2 k + 5 ) / 72
U F k = [ S k E ( S k ) ] V a r ( S k )   ( k = 1 , 2 , , n )
For a specific level of significance α, if UFk is greater than Uα/2 then the sequence has a significant increasing or descending trend. UBk is the opposite of UFk; namely, UBk = −UFk and k = n + 1 − k (k = 1, 2, …, n). The intersection of the forward trend (UFk) and backward trend lines (UBk) within the confidence interval indicates an abrupt change point in the runoff series.

3.3. SWAT Model Construction, Calibration, and Validation

The SWAT model construction, calibration, and validation were all implemented via a visual user interface in the ArcSWAT version 2012. Firstly, the stream network was generated from the DEM of the Qingliu River catchment. A total of 23 sub-basins and 109 hydrological response units (HRU) were further created based on the land-use, soil, and slope layers. Afterwards, according to the abrupt change point (1984) of runoff, the entire study period was divided into two phases: the baseline period (natural phase, 1960–1984) without significant human activities, and the disturbed period (1985–2012) associated with intensive human activities. Considering the availability of clear Landsat imagery before 1984, the authors used a land-use map from 1981 to represent the land-use conditions over the baseline period. Regarding the land-use status over the disturbed period, the authors selected a land-use map in the almost middle year (2000) to represent. Subsequently, the SWAT model was calibrated over the period 1960–1971 and validated over the years 1972–1984 with the first three years (1957–1959) as the warm-up period. The partial parameters of the SWAT model that were determined in this study are listed in Table 1. CN2, ESCO, and GWQMN are the most sensitive parameters for runoff simulation. The SWAT model is configured to output monthly runoff.
To assess the performance of the SWAT model, the Nash–Sutcliffe coefficient (NSE) and the relative error (RE) were selected as evaluation indicators. The calculation formulas (Equations (10) and (11)) of NSE and RE are as follows.
NSE = 1 i = 1 n ( Q o b s ( i ) Q s i m ( i ) ) 2 i = 1 n ( Q o b s ( i ) Q ¯ o b s ) 2
RE = Q ¯ s i m Q ¯ o b s Q ¯ o b s × 100 %
where Qobs(i) is the observed runoff at time step i, Qsim(i) is the simulated runoff at time step i, Q ¯ o b s is the mean value of the observed runoff, Q ¯ s i m is the mean value of the simulated runoff, and n is the number of the data sequence.

3.4. Attribution Analysis

Based on the calibrated SWAT model, the authors run the SWAT model to simulate runoff under three different scenarios. Specifically, Scenario 1 (S1) takes climatic data during 1960–1984 and the land-use map for 1981. Scenario 2 (S2) uses climatic data during 1989–2012 and the land-use map for 1981. Scenario 3 (S3) is based on climatic data during 1960–1984 and the land-use map for 2000.
Comparing S1 and S2 with each other, the only difference is their climatic inputs. Thereby, the simulated runoff under Scenario 2 can be regarded as the naturalized runoff in the disturbed period, and its difference from the simulated runoff under S1 in the baseline period is primarily caused by climate variability. In contrast to Scenario 1, the only discrepancy in Scenario 3 is the input of land-use data. Hence, the difference of runoff simulation between Scenario 3 and Scenario 1 is induced by land-use change.
Finally, runoff variations caused by climate variability, land-use change, and human activity are quantified (as shown in Equations (12)–(15)), and their relative contributions to runoff changes relative to the baseline period are formulated (as written in Equations (16)–(18)) as follows:
Δ Q T o t a l = Q o b s , d Q o b s , b
Δ Q C l i m a t e = Q S 2 Q S 1  
Δ Q H a m a n   a c t i v i t y = Δ Q T o t a l Δ Q C l i m a t e
Δ Q L a n d   u s e = Q S 3 Q S 1
C C l i m a t e = Δ Q C l i m a t e Δ Q T o t a l × 100 %
C H u m a n   a c t i v i t y = Δ Q H u m a n   a c t i v i t y   Δ Q T o t a l × 100 %
C L a n d   u s e = Δ Q L a n d   u s e Δ Q T o t a l × 100 %
where ΔQTotal is the total change of runoff; Qobs,b and Qobs,d represent the mean observed runoff over the baseline period and the disturbed period, respectively; QS1, QS2, and QS3 are the mean simulated runoff under three different scenarios; ΔQClimate, ΔQLand use and ΔQHuman activity mean the runoff change induced by climate variability, land-use change and human activity, respectively; Page: 7 and CClimate, CLand use, and CHuman activity indicate the contributions in percentage of climate variability, land-use change, and human activity to runoff change, respectively.

4. Results and Discussion

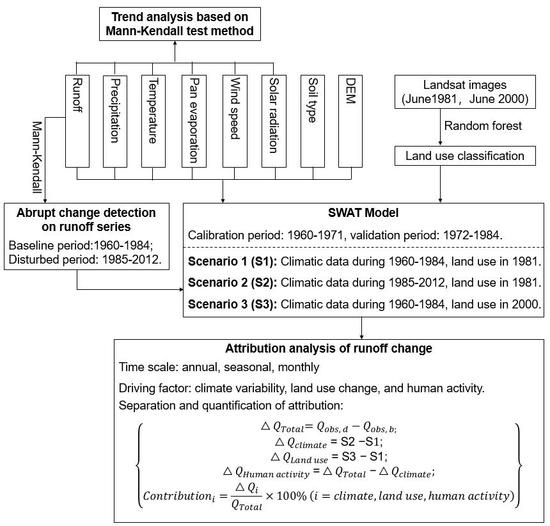
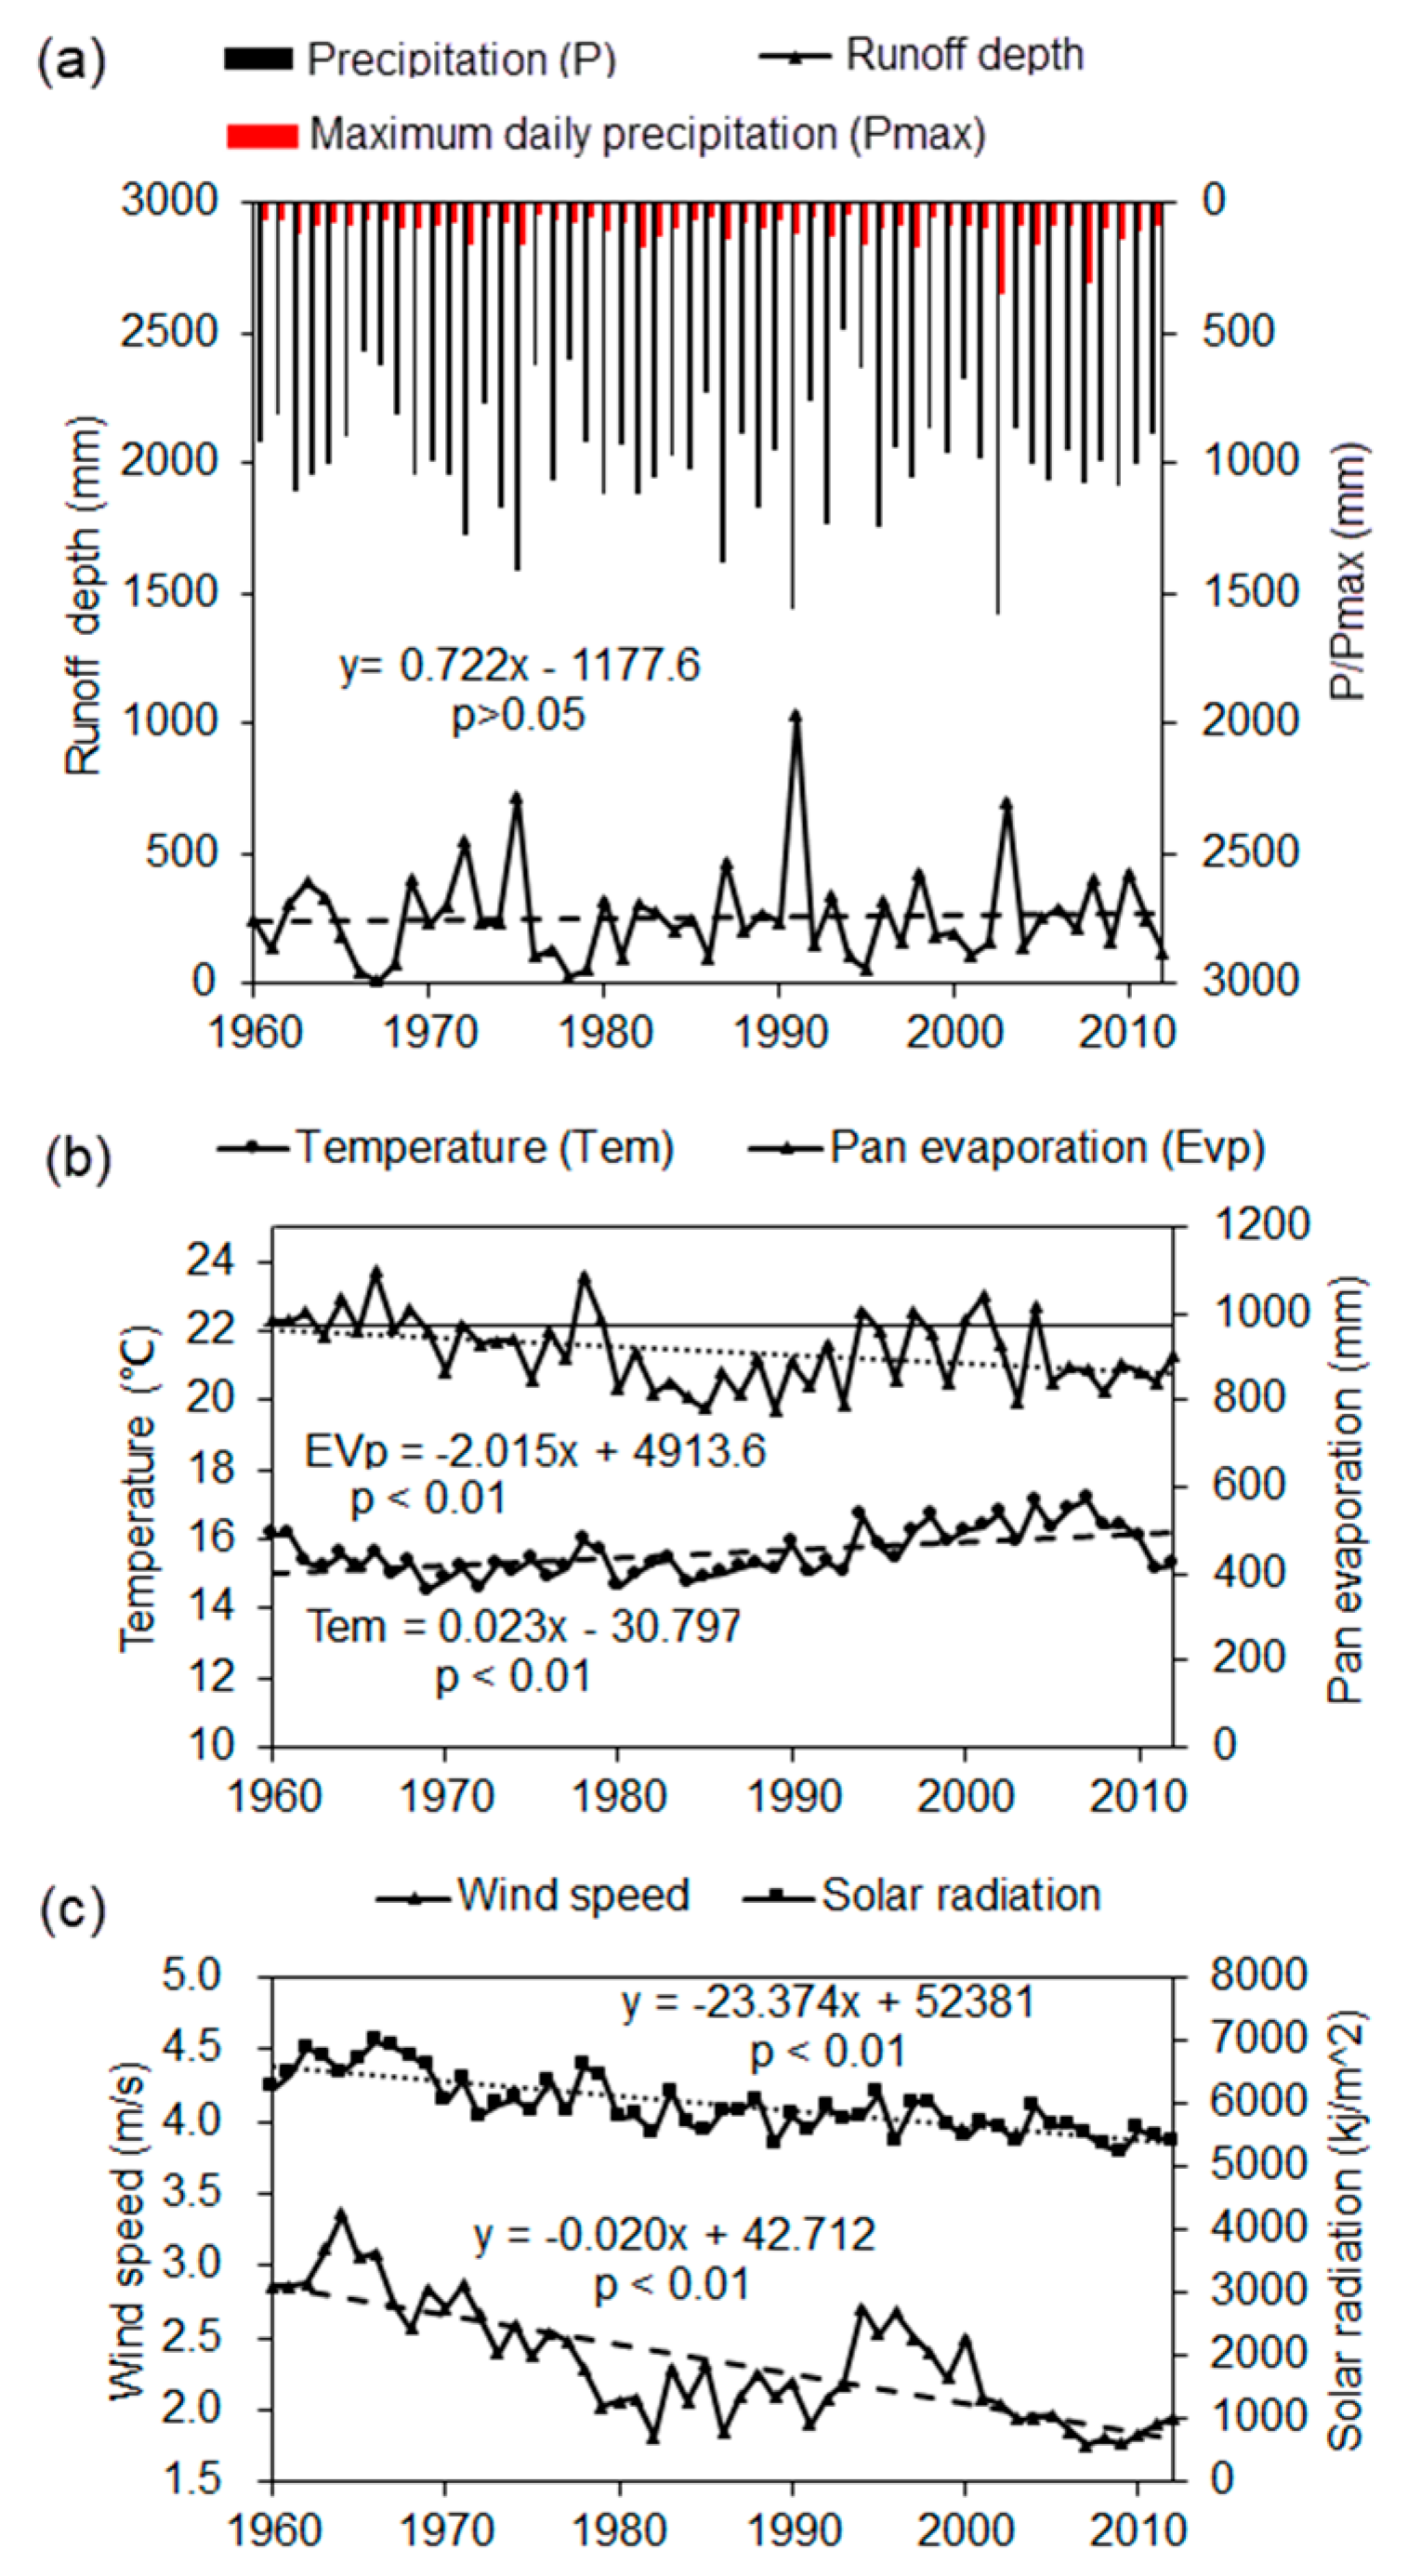
4.1. Change Trend of Hydro-Meteorological Variables

The trends of precipitation, temperature, pan evaporation, wind speed, solar radiation, and runoff depth over the period of 1960–2012 for the Qingliu River basin have been analyzed by using the simple linear regression method and the Mann–Kendall test method. Figure 2 illustrates the inter-annual change of these hydro-meteorological variables, and Table 2 shows the statistical information of the trend analysis on the annual and seasonal scales.
The results indicate that the mean annual runoff increased insignificantly, while the winter runoff increased significantly with a magnitude of 0.37 mm/year (Figure 2a). The mean annual temperature shows an upward trend during 1960–2012 with a rate of 0.02 °C/year (p < 0.01, Figure 2b). All of the seasonal temperatures increased significantly (p < 0.01) except for the summer temperature. In contrast, the average annual pan evaporation declined significantly with a magnitude of 2.01 mm/year (p < 0.01, Figure 2b). It infers that there exists an evaporation paradox, which has been widely observed across China [40,41]. The phenomenon of the evaporation paradox can be attributed to the significant decrease of solar radiation and wind speed (Figure 2c) in the study area. The findings are consistent with the results published by Han et al. [41,42].
The mean annual precipitation exhibited a weak increase trend (1.68 mm/year, p > 0.05) during 1960–2012, which was associated with insignificant decrease in spring and autumn, and a significant increase in winter (1.19 mm/year, p < 0.01) (Table 2). Correspondingly, it can be noted that the number of rainy days has decreased in the spring (p < 0.05) and autumn (p < 0.05), and increased in winter (p < 0.01). The annual maximum daily precipitation indicated an increasing trend (p = 0.018) over the study period. Similar trends can also be identified in the summer maximum daily precipitation and winter maximum daily precipitation. The number of days with daily precipitation over 25 mm increased significantly in winter. The results imply that: (1) the winter became wetter and warmer, while the spring and autumn became drier and warmer; (2) the maximum daily precipitation intensity on the annual, summer, and winter scales all tended to be higher; and (3) precipitation in winter became more intensive.

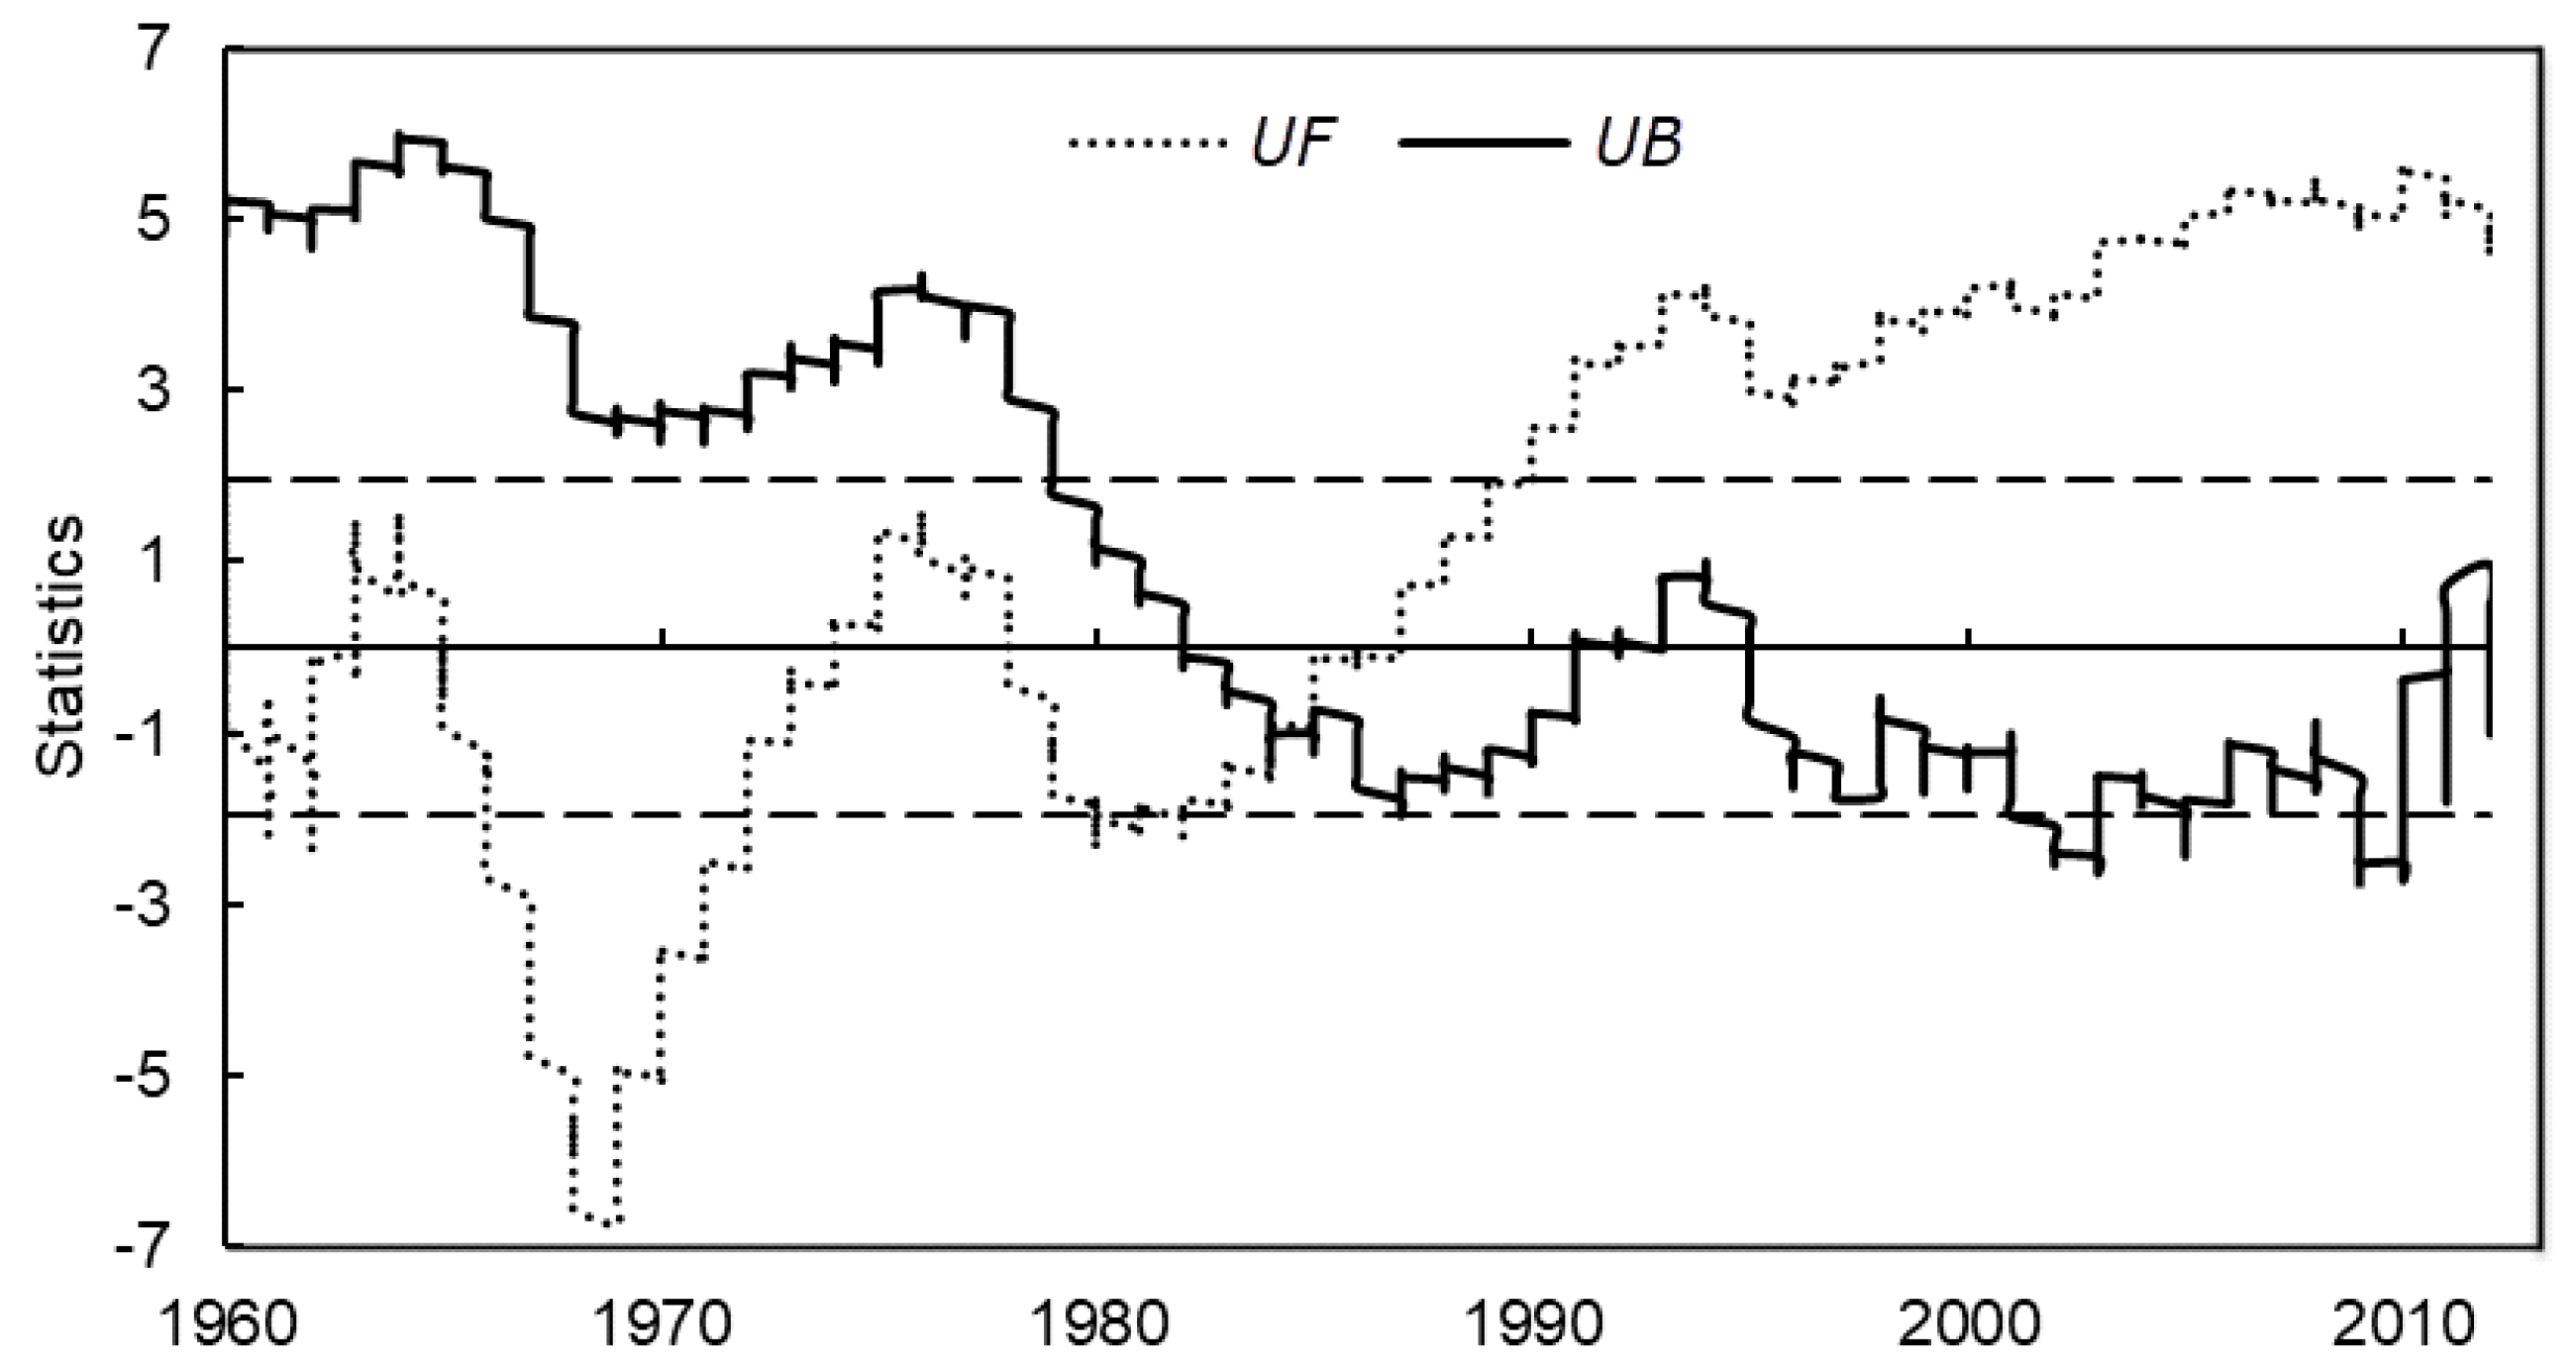
4.2. Abrupt Change Detection of Runoff Series

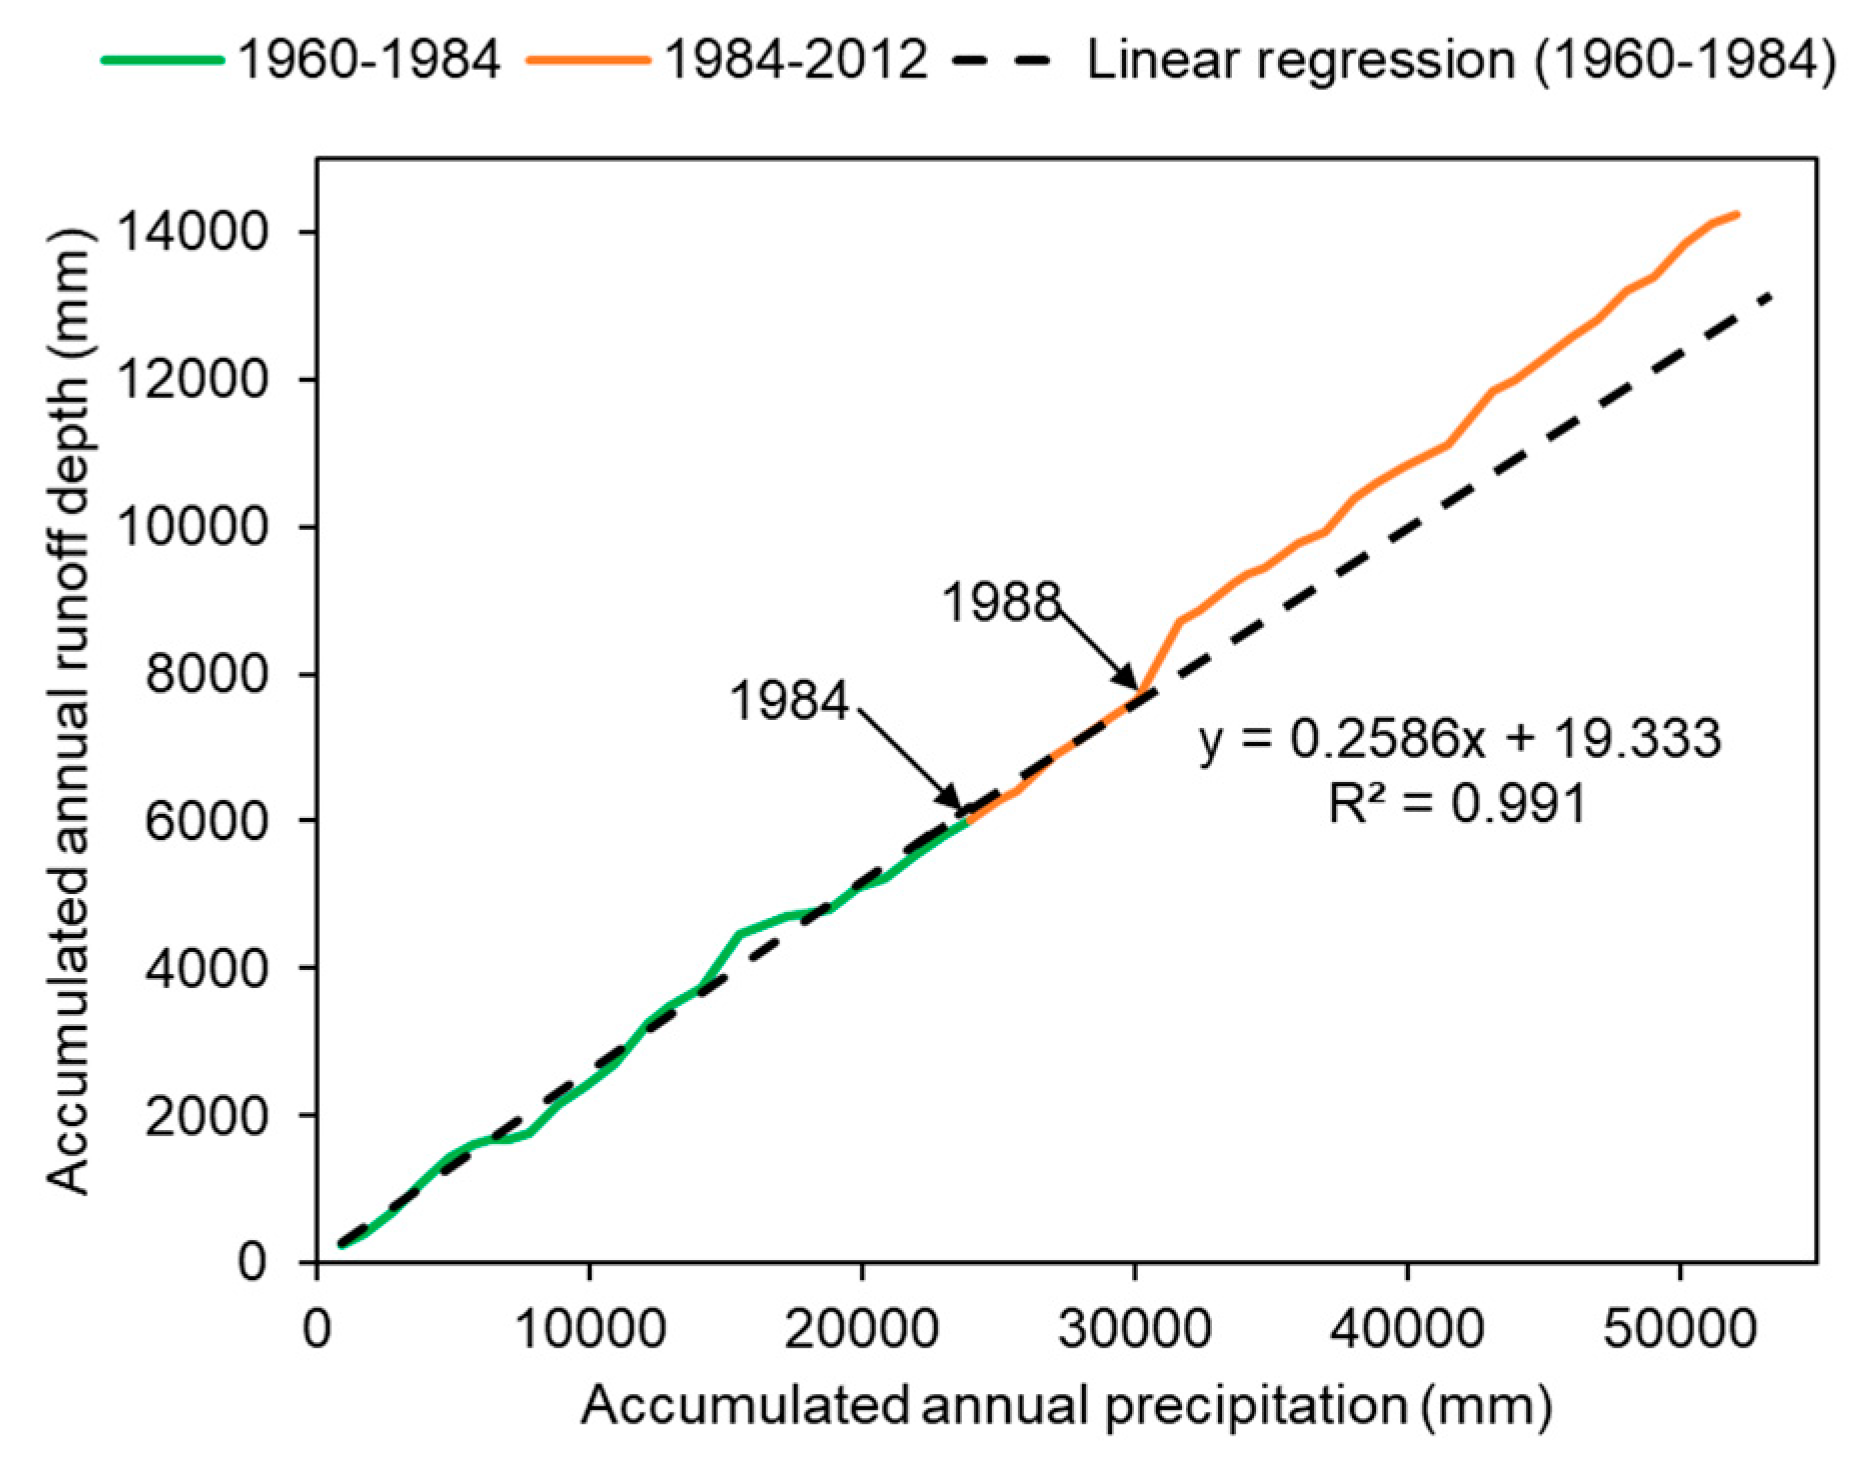
Based on the Mann–Kendall method, an abrupt change of runoff in the Qingliu River basin was detected in 1984 (as shown in Figure 3). The UF value for each year indicates the trend from the starting year (1960) to that specific year. In addition, Figure 4 presents the double-mass curve of the accumulated runoff depth and precipitation. It can be observed that since 1988, the curve started to deviate from the original regression line, which implies that human activities had more intensive impacts on runoff.
Furthermore, since 1984, the population has increased rapidly, with a mean annual growth rate of 13.36% during 1984–2000. Due to the reform of the economic system during 1978–1984, agriculture and partial industry have developed dramatically since 1984 [43]. Compared with the GDP in 1978 being 4.2 times that in 1949, the GDP in 1986 doubled from 1980, indicating a more rapid development [43]. With the growths of the population, agriculture, and industry, transportation and urbanization have developed, and water withdrawals have increased accordingly [43]. The Chengxi reservoir provided irrigation for an area of 70 km2 during 1960–1980, and was mainly used for domestic and industrial water supply since the mid-1980s.
According to the results of the Mann–Kendall method and the double-mass curve as well as the socio-economic development, we selected 1984 as the abrupt change point of the runoff series, and divided the study period into the baseline period (1960–1984) and the disturbed period (1985–2012).
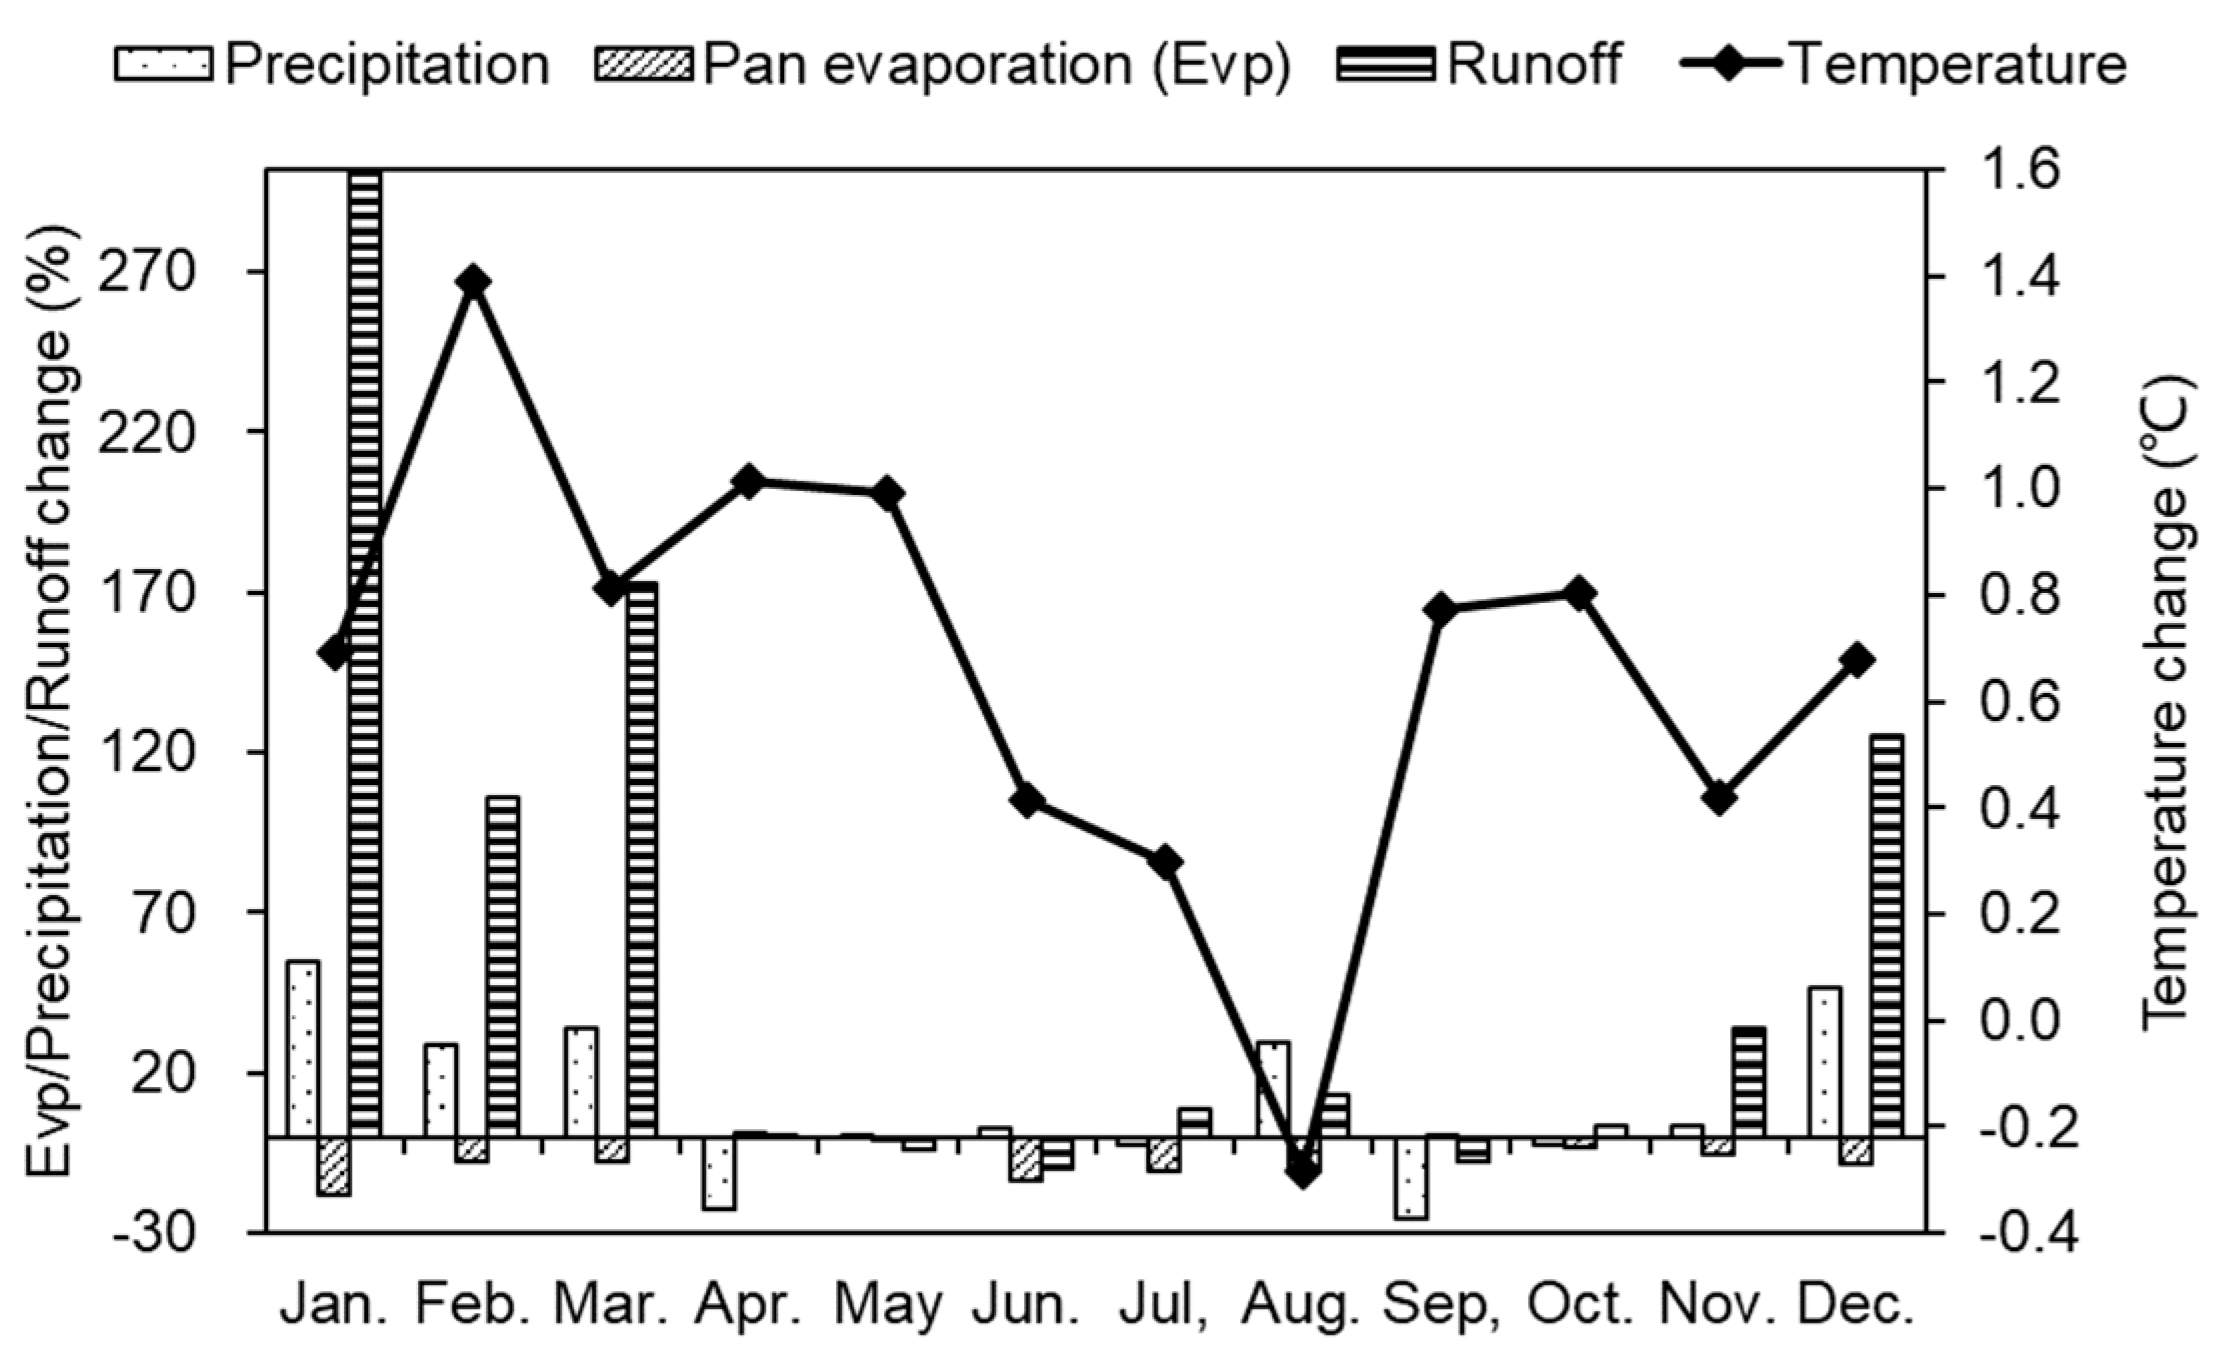
To investigate the variations of hydro-meteorological data before and after the abrupt change point, comparisons were made on the mean annual level and inner-annual level, respectively (illustrated in Table 3 and Figure 5, correspondingly). Table 3 indicates that during 1985–2012, the temperature rose by 0.67 °C, while precipitation, pan evaporation, and runoff changed by 4.65%, −6.67%, and 16.05% relative to 1960–1984, respectively. However, the variations were uneven over the year (Figure 5).
In general, the variations in winter and early spring were much higher than those between April and November. The larger the change magnitudes of precipitation and pan evaporation, the large change in the runoff. Runoff increases were often associated with an increase of precipitation and decline of pan evaporation. Specifically, the temperature rose in all the months except for August, ranging from −0.28 °C to 1.39 °C, with the highest rise occurring in February. The mean precipitation increased by 12.27%, with the largest increase (54.61%) in January and the largest reduction (−25.67%) in September. Pan evaporation declined in all months except for April, May, and September, with the highest decrease (−17.89%) occurring in January. As an integrated result, runoff increased in most months (especially for January, February, March, and December), ranging from 0.69% to 301.20%. Runoff increased the most in January, which is consistent with the change features of precipitation and pan evaporation. The largest decrease (−9.73%) of runoff occurred in June. The variations in April, May, and June imply that there should be some other factors affecting runoff.

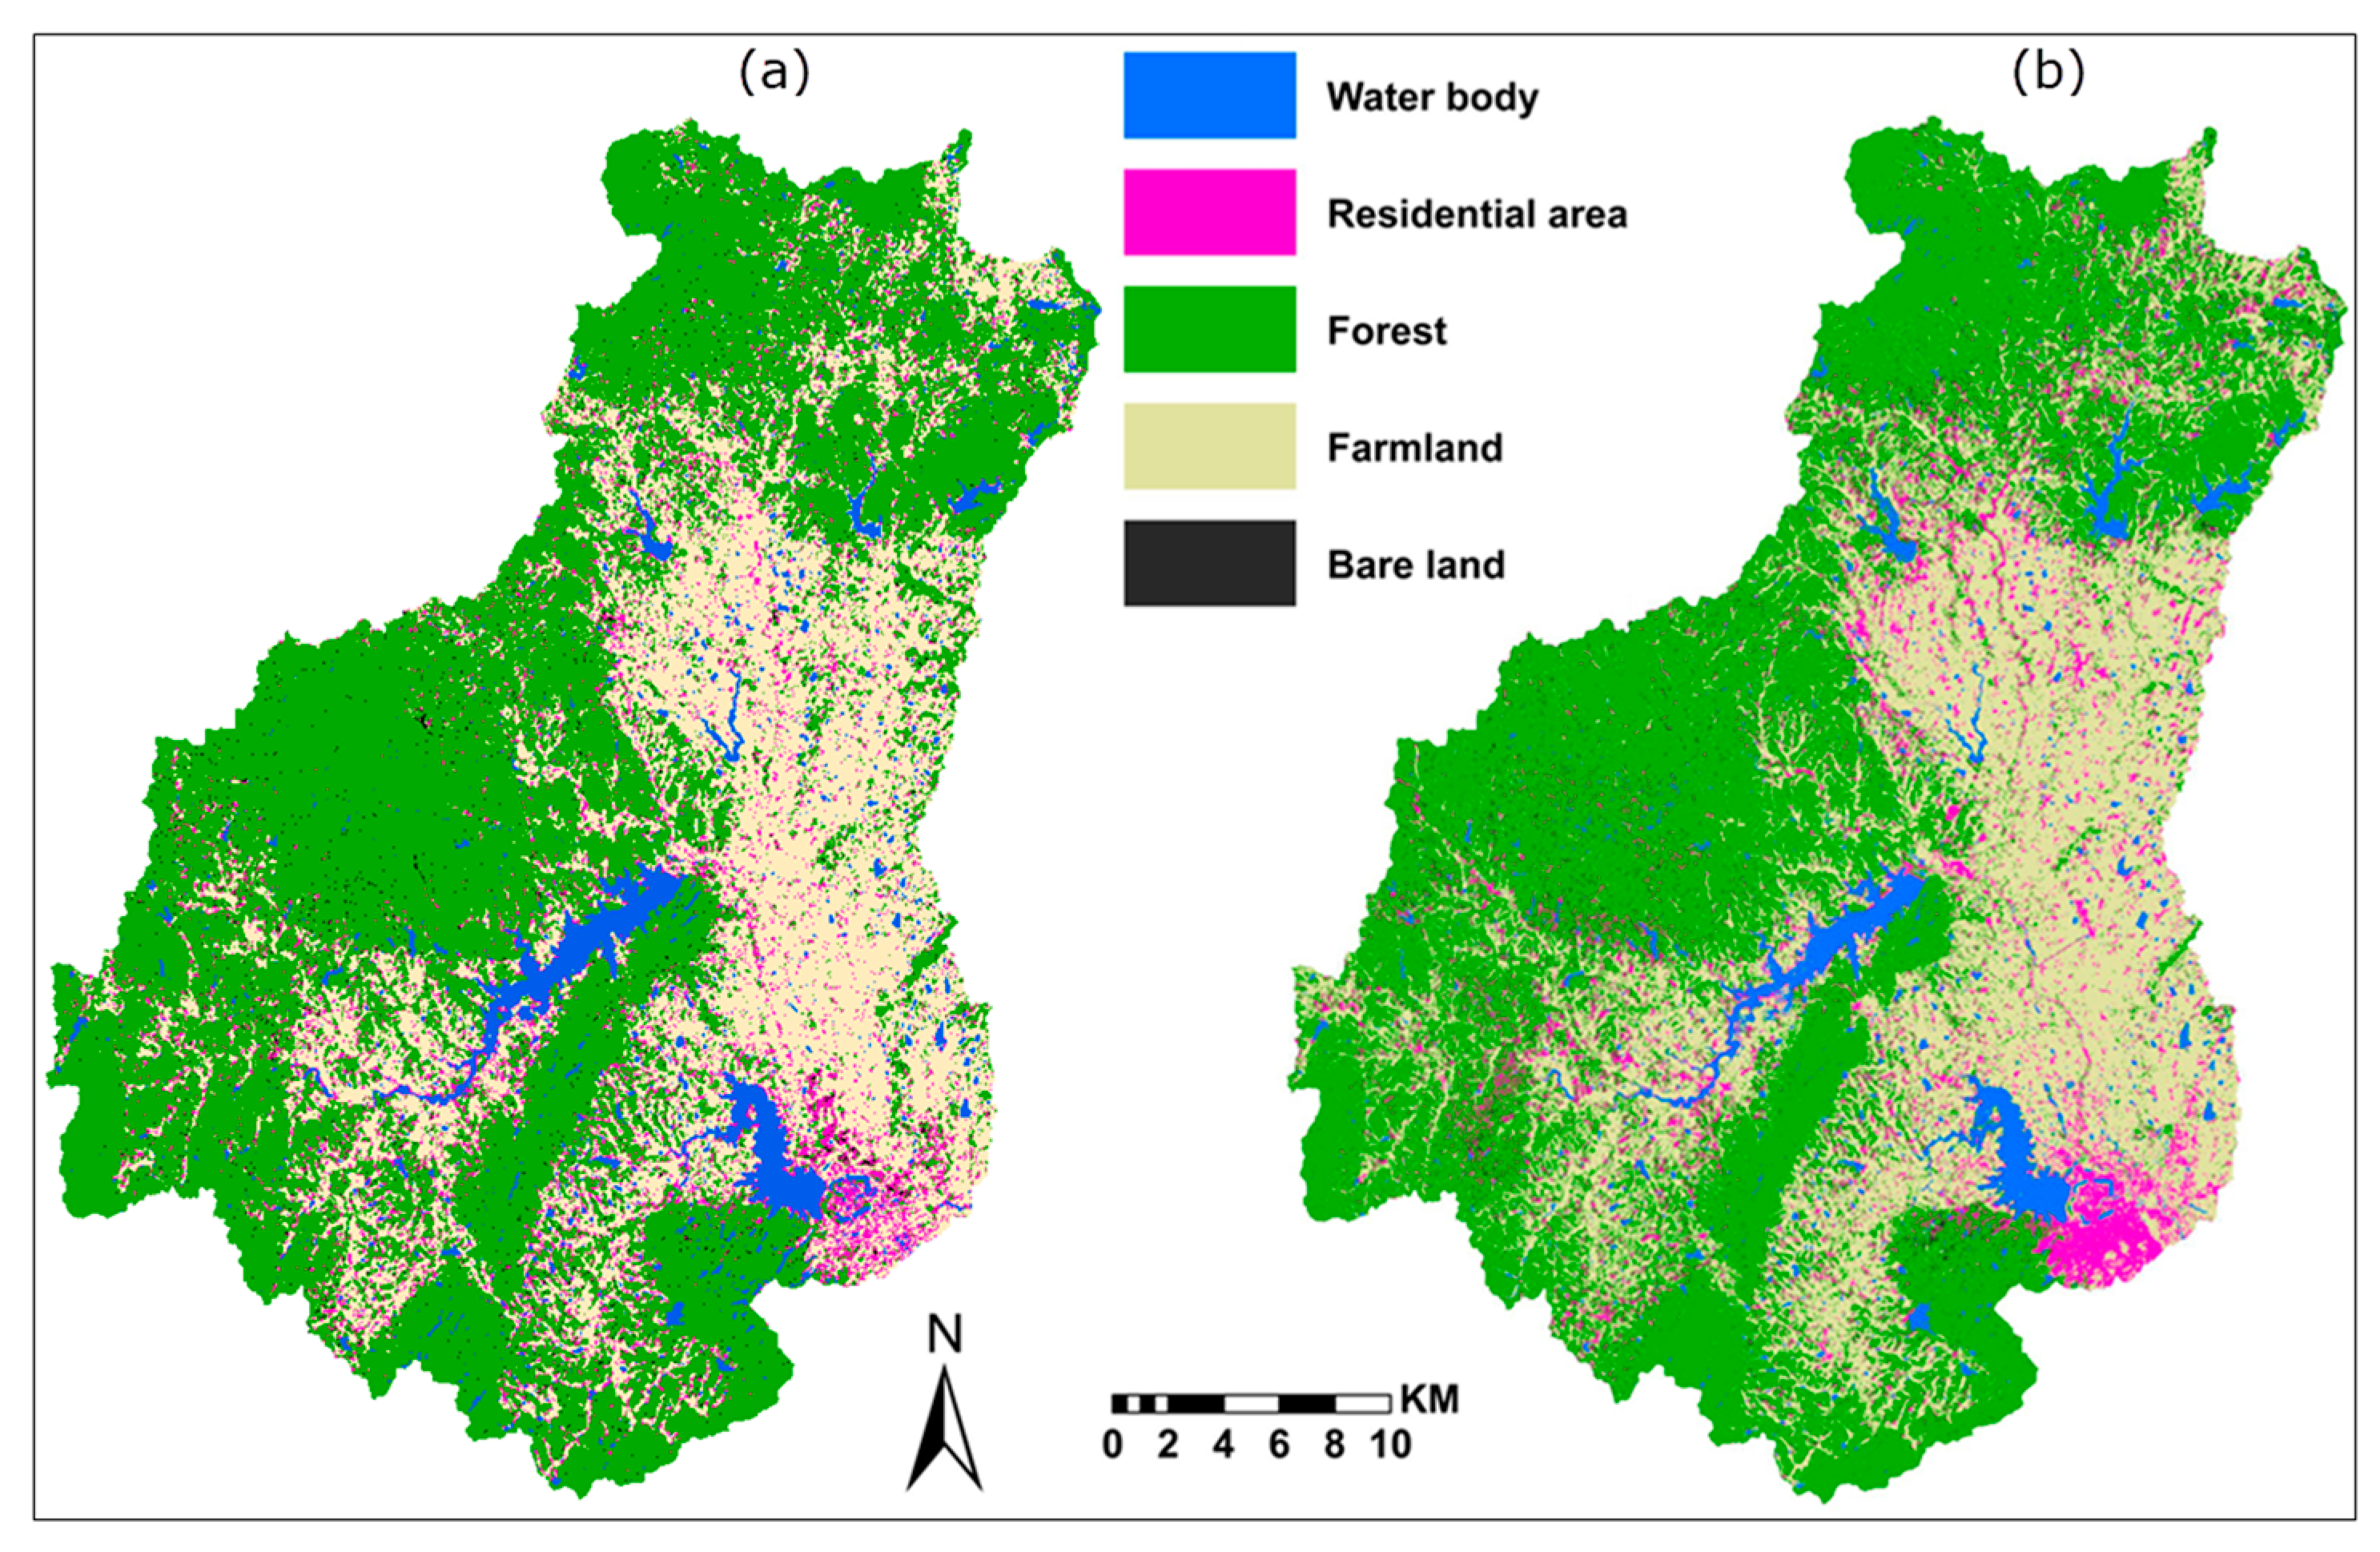
4.3. Land-Use Change for the Qingliu River Basin

Based on the Landsat imagery and random forest classifier, land use was classified into five categories, namely forest, farmland, residential area, water body, and barren land. Figure 6 shows the land-use classification results for 1981 and 2000, respectively. It can be observed that the forest dominates land use in the study area, and the residential area has expanded between 1981 and 2000. Table 4 displays the transmission matrix for land-use changes from 1981 to 2000. The results indicate that in total, 10.35% of the study area (110.79 km2) experienced land-use changes, which mainly refer to transmission among the forest, farmland, and residential area. Specifically, the residential area expanded from 52.40 km2 in 1981 to 73.64 km2 in 2000, increasing by 40.53% relative to 1981. However, the total increase of residential area (21.24 km2) only accounts for 1.99% of the whole research area. The forest decreased by 57.44 km2, while the farmland increased by 41.59 km2, accounting for 5.37% and 3.89% of the study region, respectively.

4.4. SWAT Model Calibration and Validation for Monthly Runoff Simulation

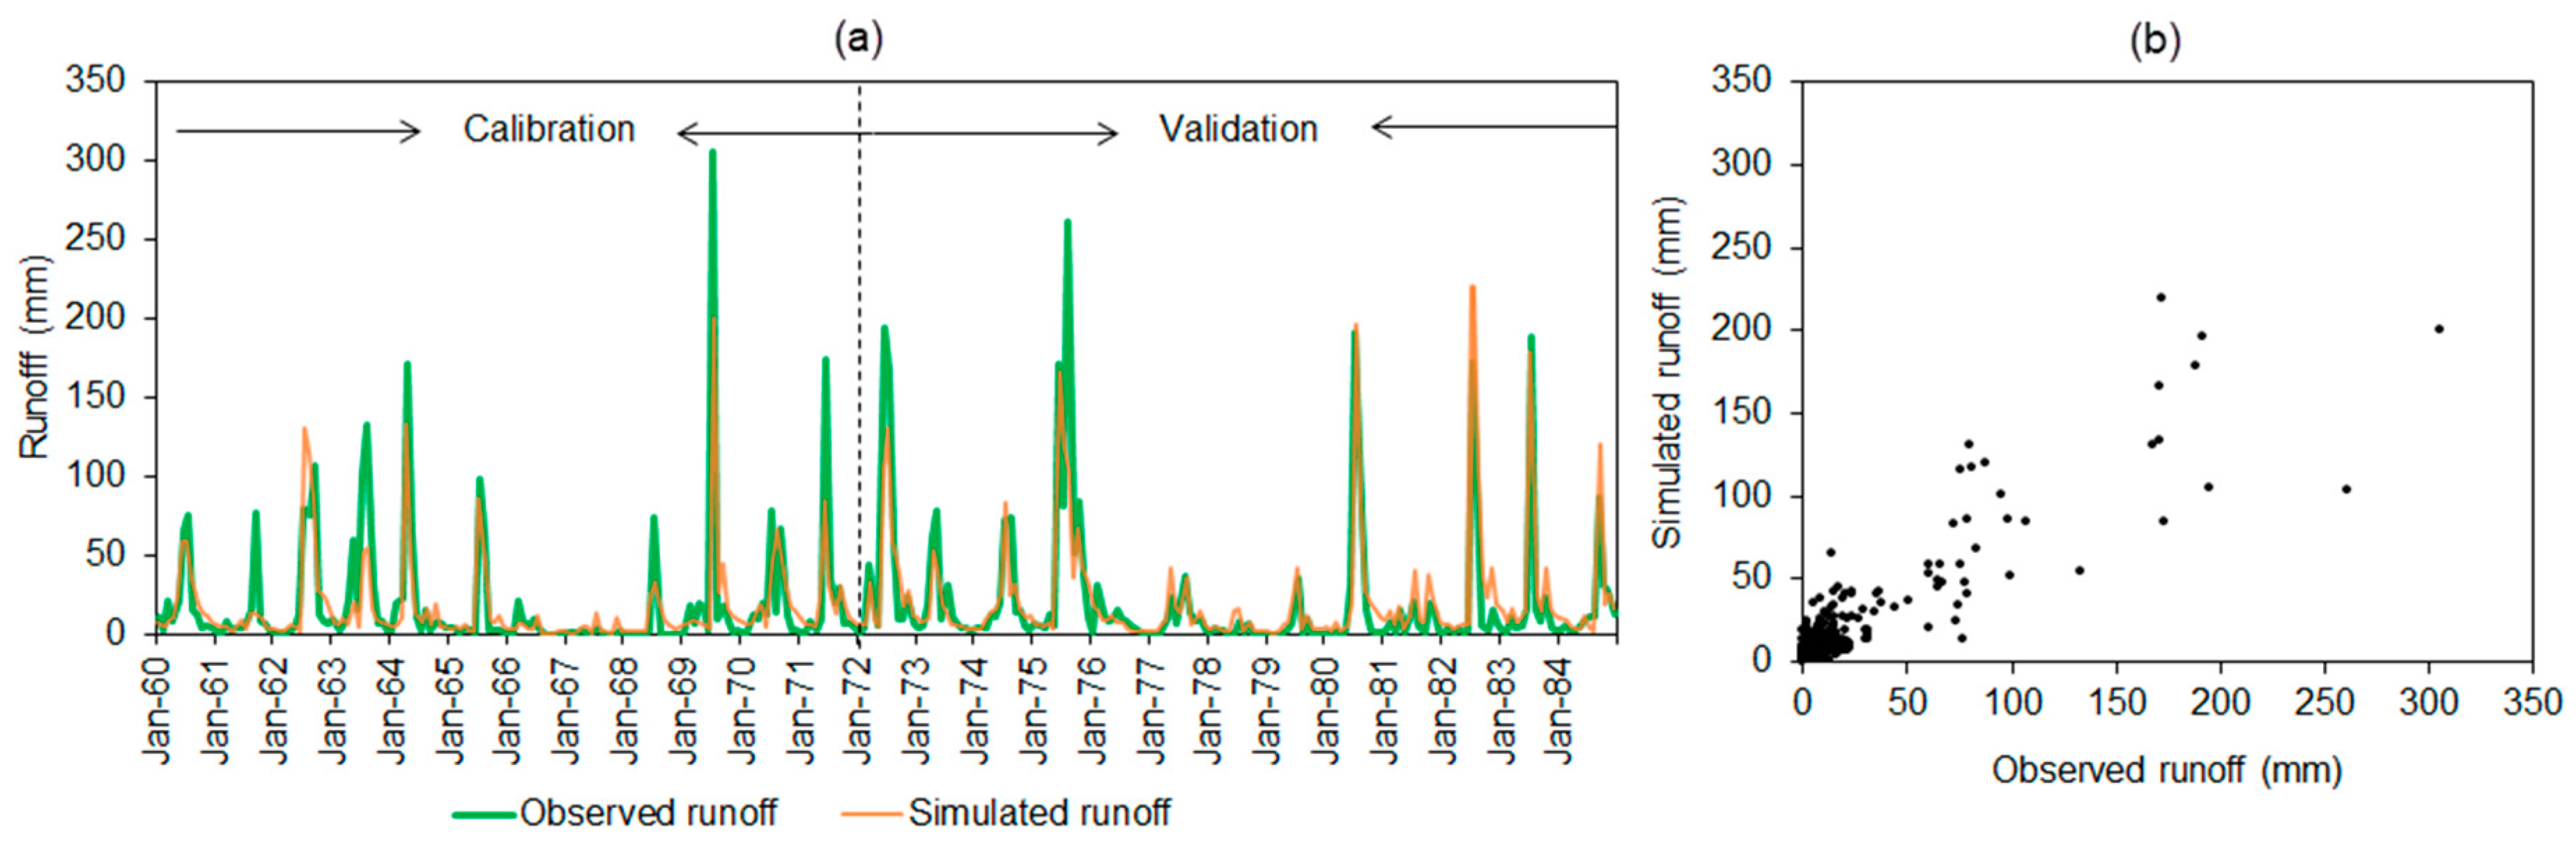
Taking the detected abrupt change in 1984 as a break point, the whole study period was divided into the baseline period (1960–1984) and the disturbed period (1985–2012). The SWAT model was calibrated and validated over the baseline period. Specifically, data during 1960–1971 were used for model calibration, while data during 1972–1984 were applied for model validation.
Figure 7 illustrates the simulated and observed monthly runoff between 1960 and 1984. The performance evaluation of the SWAT model is listed in Table 5. It indicates that on the monthly scale, the Nash–Shutcliffe efficiency (NSE) were 0.76 and 0.81 for the calibration and validation periods, respectively. The relative error values imply that the monthly runoff was underestimated in the calibration period, and overestimated in the validation period.
Over the validated period (1972–1984), in contrast to performance of the monthly runoff simulation, the SWAT model performed better on the annual runoff simulation (NSE = 0.83) and runoff simulation in the wet season (NSE = 0.87). The relative error of runoff simulation in the dry season (11.57%) was higher than that in wet season (−3.30%), which might be because the Qingliu River almost dried up in dry seasons between 1976 and 1980, but the SWAT model overestimated the runoff.

4.5. Attribution Analysis of Runoff Change for the Qingliu River Basin

Based on the runoff observations and runoff simulations derived from the SWAT model under three scenarios (S1, S2, and S3), the contributions of individual factors (climate variability, land-use change, and human activity) to runoff change in the Qingliu River were quantified at multiple scales (annual, seasonal, and monthly) over three periods (1985–2012, 1985–2000, and 2001–2012). Specially, the attribution to land-use change was only analyzed on the annual and seasonal scales over the whole disturbed period (1985–2012). One reason is that the computation of land use-induced runoff change (i.e., the discrepancies between runoff simulations under Scenario 3 and Scenario 1) requires the comparison period having the same length as the baseline period. Furthermore, land-use change is mostly characterized by annual and seasonal scale changes instead of at a monthly scale.
Table 6 presents the attribution analysis results for the Qingliu River on the annual scale. It indicates that annual runoff during 1985–2012 increased by 38.05 mm in total relative to 1960–1984. Climate variability, land-use change, and human activity contribute 95.36%, 4.64%, and 12.26% to the total change of runoff, respectively. The results imply that climate variability dominates runoff variation in the Qingliu River on the annual scale. Land-use changes (mainly for deforestation and urbanization) resulted in a runoff increase, which may be derived from the reduction of evaporation and interception, and the increase of impermeable area. Compared with land-use change, human activity showed a smaller contribution to runoff change. It infers that some other human activities caused runoff decrease such as water withdraw by irrigation due to the increase of farmland from 1981 to 2000 (41.59 km2).
It is worth noting that runoff change and its attribution vary over different periods. For instance, the total increase of runoff during 1985–2000 (42.81 mm) was larger than that during 2001–2012 (31.70 mm). Over the periods of 1985–2000 and 2001–2012, climate variability and human activity accounted for 58.64% and 41.36%, and 161.49% and −61.49% of runoff change, respectively. The results imply that human activity after 2000 has become more intensive, and runoff subsequently decreased. It may partially due to more water withdrawals for different sectors to support the socio-economic development.
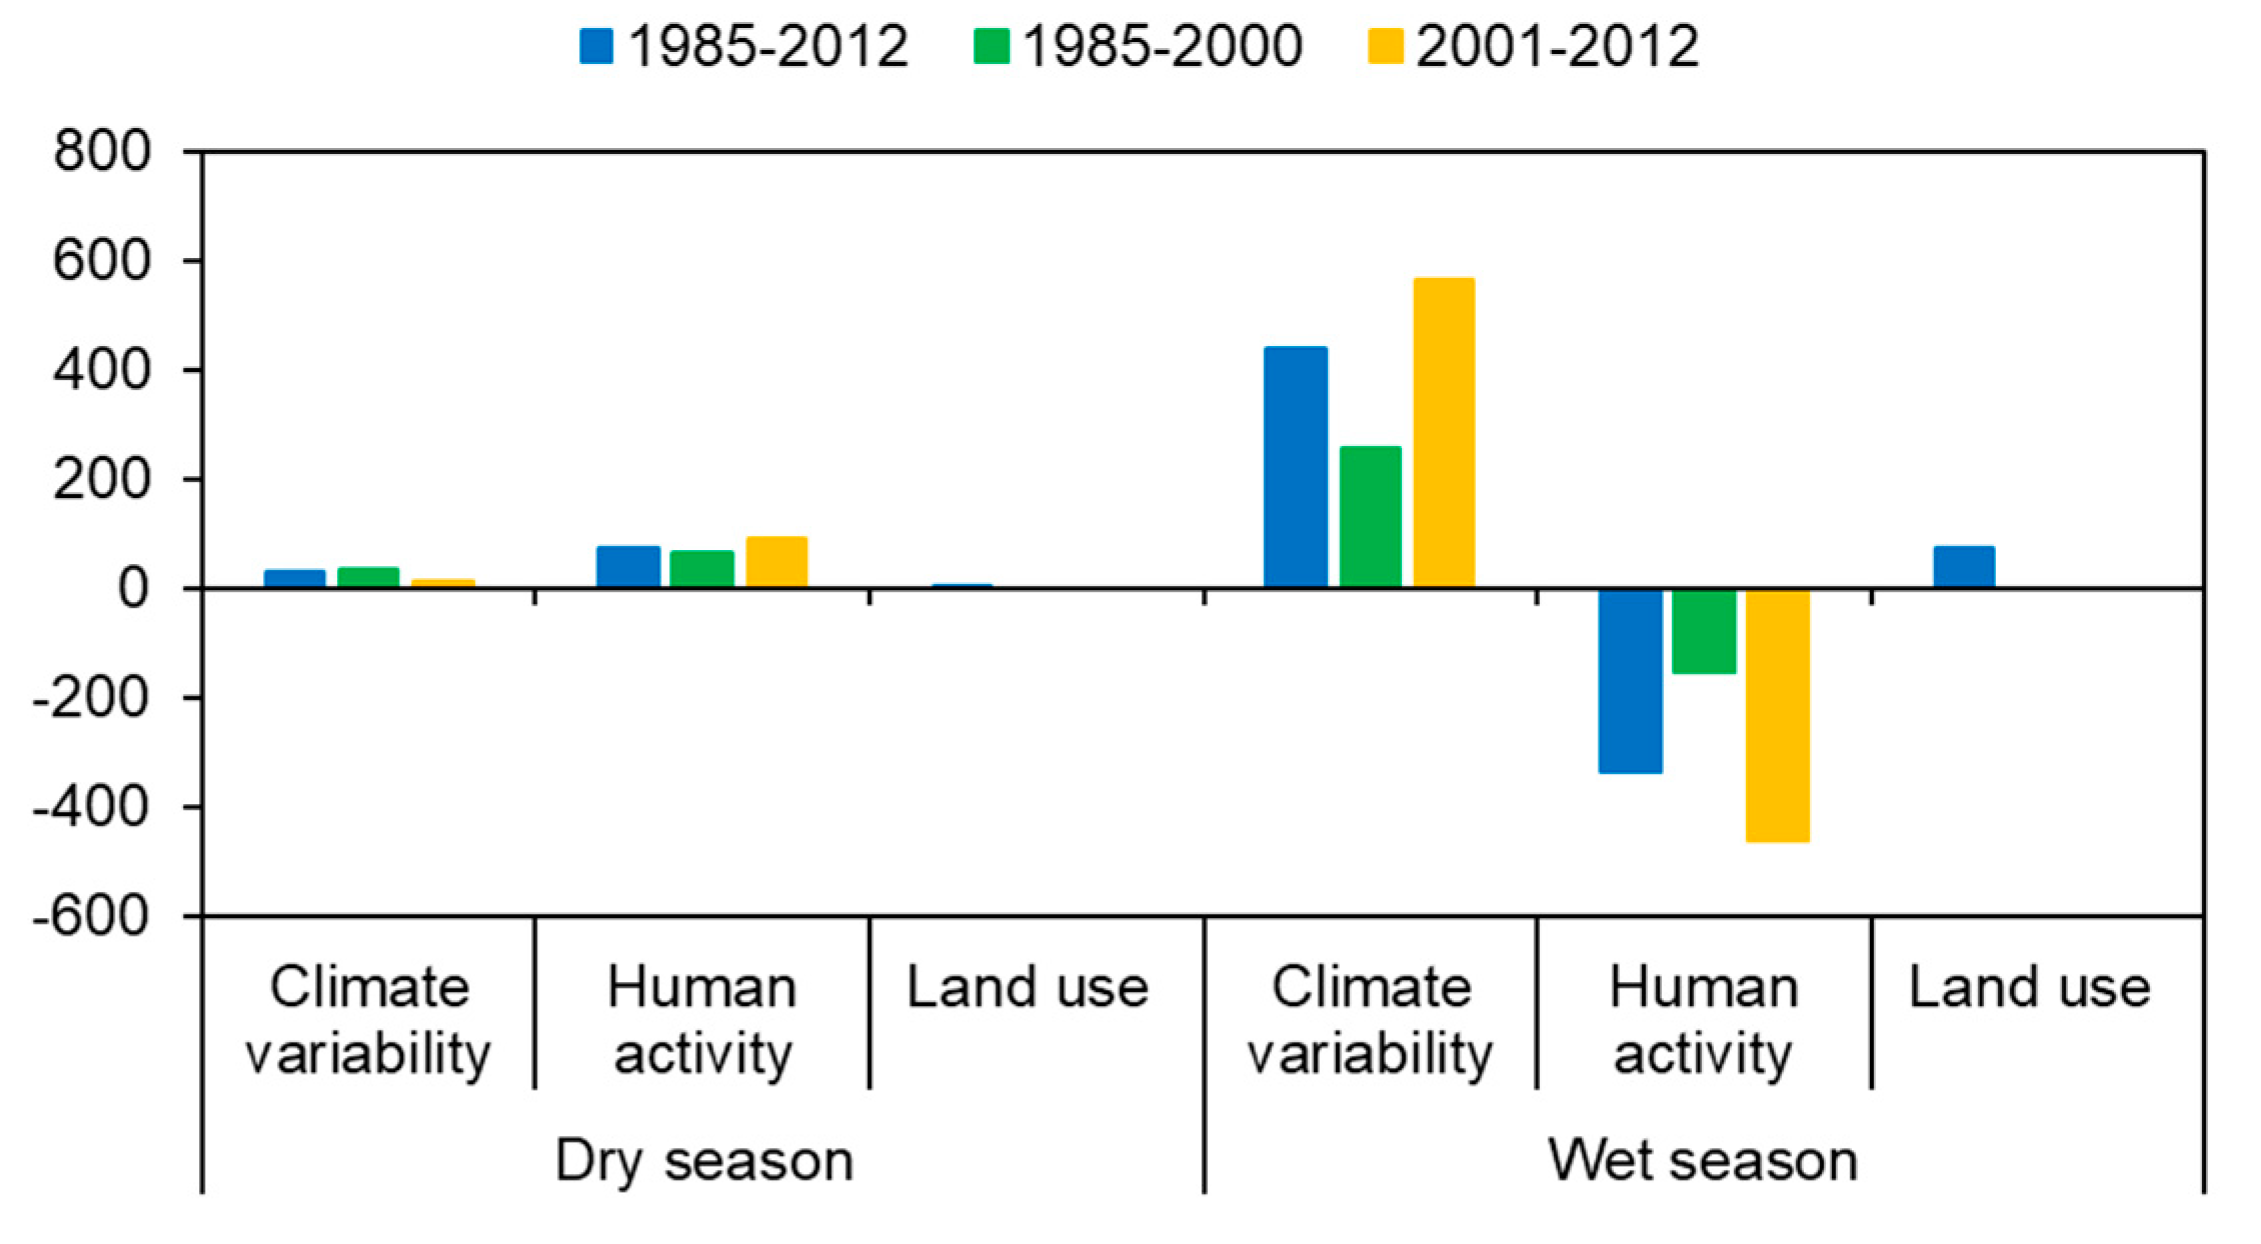
Here, considering the property of precipitation distribution, we divided the whole year into the wet season (from May to September) and the dry season (from January to April, and from October to December). Table 7 displays the results of attribution for runoff change in the Qingliu River on a seasonal scale during 1985–2012. The results indicate the total change of runoff in the wet season over the whole disturbed period increased by 6.26 mm relative to the baseline period. However, the runoff increased by 27.42 mm, which was induced by climate variability, and declined by 21.15 mm, which was induced by human activity, respectively. The finding implies that in the wet season, climate variability and human activity both have a major impact on the runoff, and their influences counteract with each other. In contrast, the total change of runoff in the dry season was 31.78 mm, accounting for 61.12% of that in the baseline period. The contributions of climate variability, land-use change, and human activity account for 27.89%, 0.18%, and 72.11% of runoff change in the dry season, respectively. It indicates that human activity is the primary contributor to runoff increase in the dry season, which might be because of the operations of reservoirs in the basin. However, due to the relative error of runoff simulation (−3.30% for the wet season, 11.57% for the dry season), uncertainties are associated with the attribution analysis results on the seasonal scale especially for the dry season.
Furthermore, Figure 8 shows the contributions of different drivers to runoff change in the dry season and the wet season over three periods (1985–2012, 1985–2000, and 2001–2012). Similar to 1985–2012, during the two sub-periods, human activity dominated runoff change in the dry season, while climate variability dominated runoff change in the wet season. In the dry season, both climate variability and human activity increased runoff. The impact of climate variability on runoff during 1985–2000 (10.36%) became weaker than that during 2001–2012 (35.80%), while the impact of human activity exhibited an opposite trend. Regarding the wet season, climate variability increased runoff, while human activity decreased runoff, and their effects became stronger during 2001–2012 compared with the period of 1985–2000. The impact of land use on runoff in the wet season was much higher than that in the dry season.
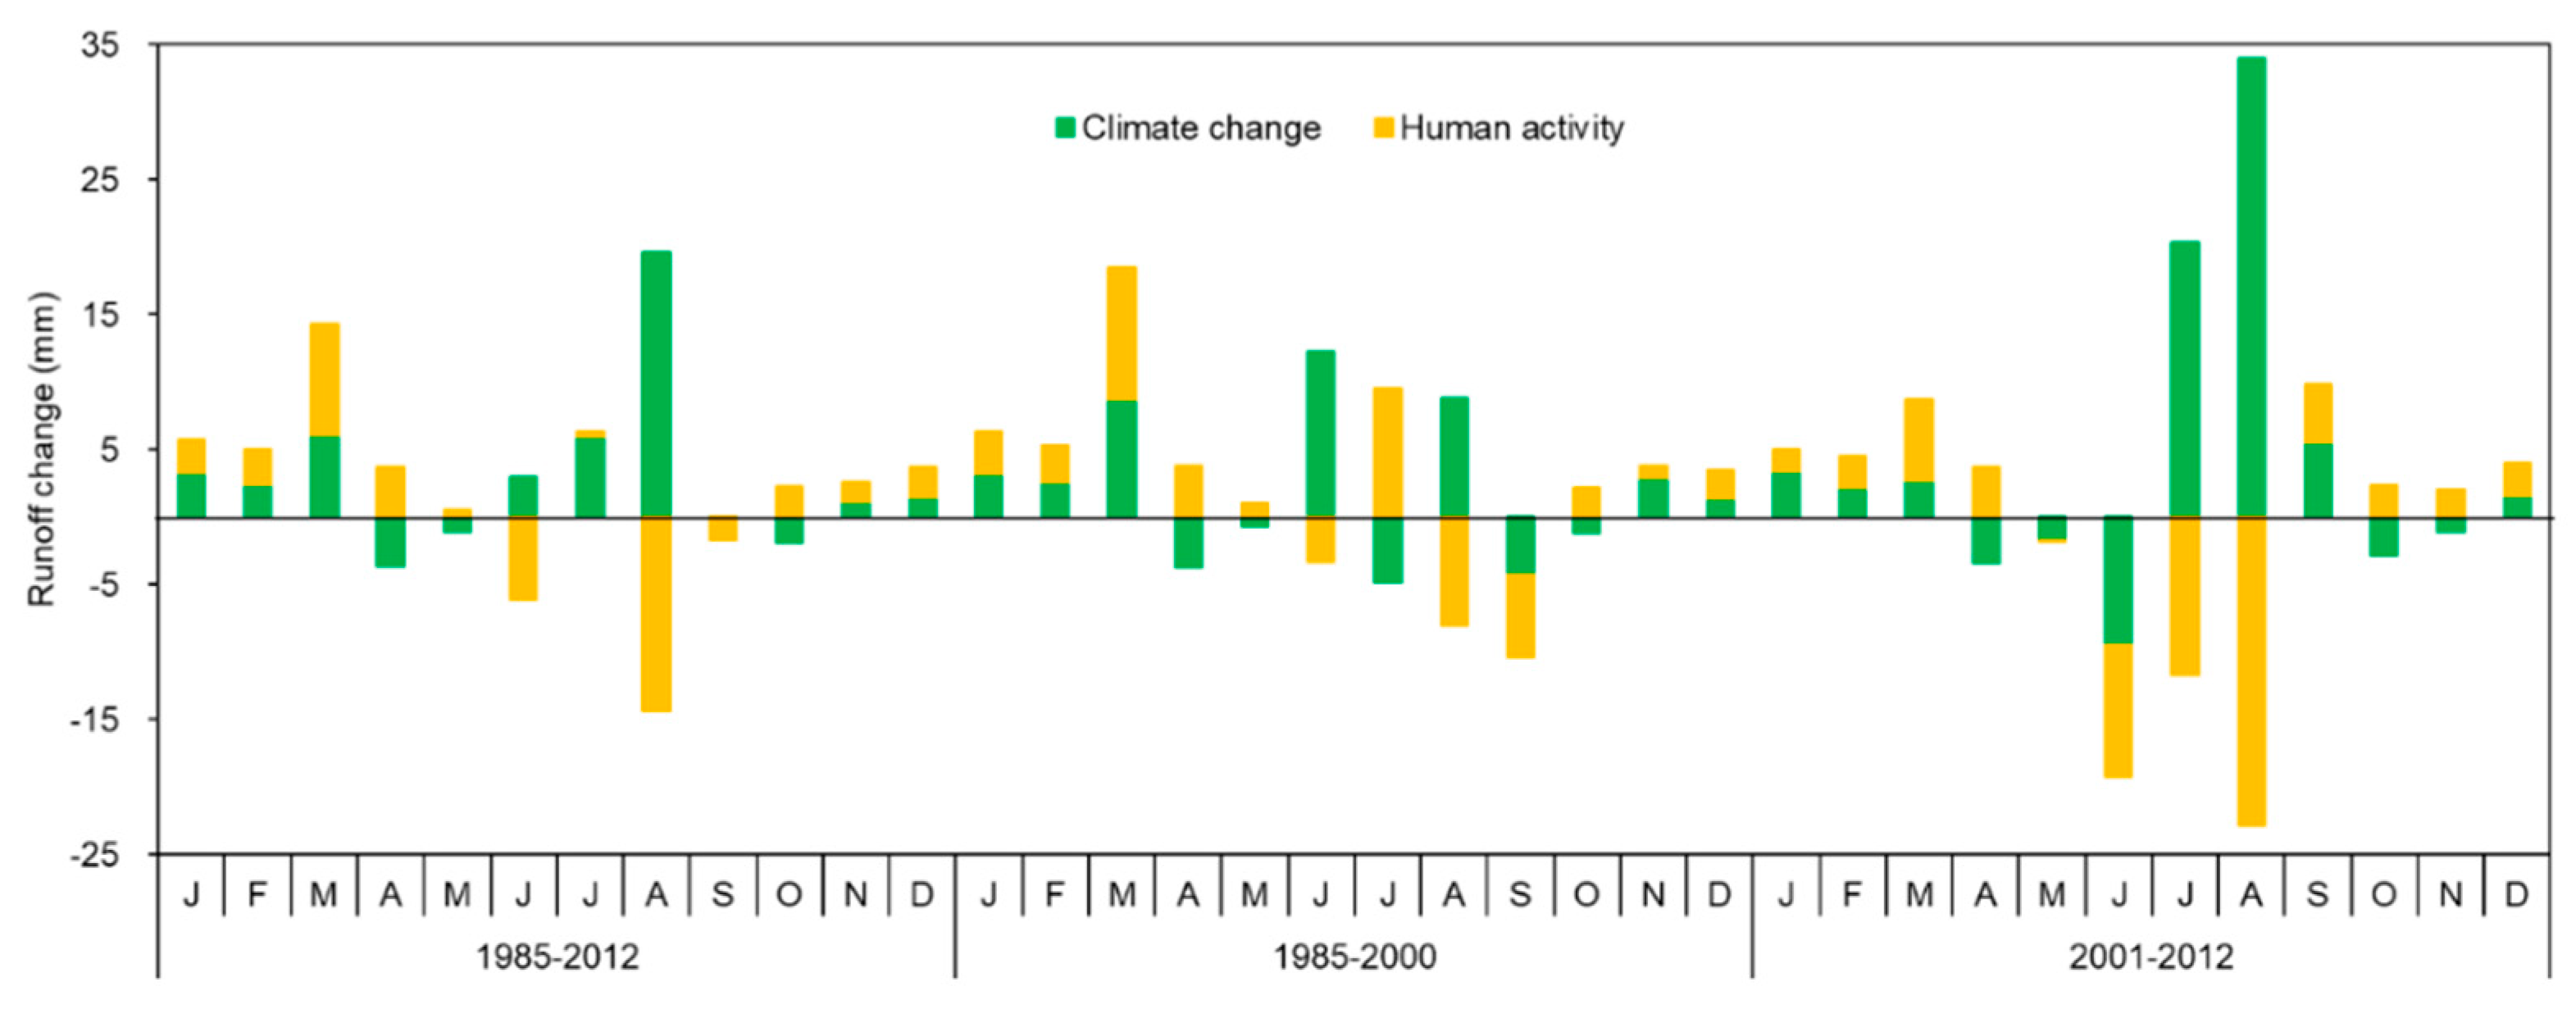
Runoff change and its attribution in individual months for the Qingliu River are illustrated in Figure 9. The results show that the impacts of driving factors (i.e., climate variability and human activity) differ across different months and over different periods. During 1985–2012, the largest total change (14.30 mm) appeared in March. The highest changes caused by climate variability and human activity both occurred in August, where runoff increased by 19.64 mm due to climate variability and decreased by 14.37 mm due to human activity. Human activity dominated runoff change in all months except January, May, July, and August, most of which belong to the wet season.
In contrast, during 1985–2000, the largest total change was 18.50 mm in March. Climate variability caused the largest increase in runoff in June (12.29 mm), while human activity mostly increased runoff in March. Over the period of 2001–2012, the largest changes induced by climate and human activity appeared in August as well, but with greater magnitudes. Compared with 1985–2000, human activity had a more intensive impact on runoff decline during 2001–2012.
In combination with Table 8, it can be noted that the largest total change of runoff and the largest runoff change induced by climate are highly related with the magnitude of precipitation change. For all three periods, the largest increase of runoff induced by human activity occurred in March, and the largest decrease of runoff induced by human activity occurred in August. The reason behind it might be related to reservoir operations, which also reflects the roles that human beings play in water resources management.
Comparing the findings on three different scales, people may find that attribution on finer (seasonal and monthly) scales would reveal more detailed information for runoff attribution analysis, which might be weakened or offset on a coarser (annual) scale. Investigating runoff change and its causes over different time periods can also benefit attribution analysis. It can deliver how the dominant drivers change along with time. Therefore, attributing runoff change to different driving forces on multiple scales over different periods would provide more detailed support for decision and policy makers on adaptive water resources management, sustainable utilization, and planning.
A previous study on runoff attribution in humid and semi-humid regions in southern China indicated that climate change dominated runoff change and contributed to runoff increase [21]. In this study, findings on the annual scale are consistent with the results in the previous work. Zhai et al. [3] reported that in the 2000s, climate variability contributed to runoff decrease, and human activity contributed more to runoff change than in the 1990s, and dominated runoff change in the Xixian basin and Changle basin. In this study, human activity during 2001–2012 exerted more impact on runoff change compared with that during 1985–2000, which is consistent with the findings in the literature published by Zhai et al. [3]. However, differently, we found that climate variability caused an increase in runoff and dominated runoff change in all periods.

4.6. Discussion on Uncertainty and Future Work

The attribution analysis in this study is based on comparison between the observed runoff and the simulated runoff derived from the SWAT model. Although the hydrological model performed well, there exist some differences between the simulations and the observations. Specifically, the relative errors of runoff simulations on annual and monthly scales (6.56%) were relatively lower than those in the dry season (11.57%) and higher than those in the wet season (−3.30%). Correspondingly, uncertainties are associated in the attribution results of runoff change and differ from different temporal scales. Briefly, attribution results of runoff variation in the wet season and on monthly and annual scales have lower uncertainty than those in the dry season. However, the conclusions drawn regarding the contributions trends of different driving factors (climate variability, land-use change, and human activity) to runoff change are sound.
In this study, the impact of land-use change on run variation was quantified separately from that of human activity. However, other human activities such as reservoir operations and water withdrawals were not analyzed separately due to the lack of detailed data. Nevertheless, different kinds of human activities may exert different impacts on runoff. Therefore, separation of the impacts of different kinds of human activities on runoff variation can be further investigated in the future.
It has been well-documented that climate variability and human activities are two main contributors to runoff changes. In this study, similar to many previous studies, the authors have assumed that the impacts of climate variability and human activities are independent. In reality, climate and human activities interact with each other, and it is difficult to separate their impacts on runoff. Therefore, more detailed assessments could be made on how to integrate the relationships among different driving factors into an attribution analysis of runoff change in future work.
Based on the Mann–Kendall test method, double-mass curve, and the facts of socio-economic development, the study period was divided into the baseline period and the disturbed period (which was further divided into two sub-periods), and the authors assumed that there was no human intervention in the baseline period. However, human activity existed over the whole period and exerted different magnitudes of impacts on runoff over different periods. Therefore, more dynamic attribution that considers changing attribution should be recommended in the future.

5. Conclusions

The mean annual runoff in the Qingliu River increased during 1960–2012 and changed abruptly in 1984. Relative to 1960–1984, the temperature rose by 0.67 °C; summer and winter got wetter and warmer, while spring and autumn became drier and warmer between 1985 and 2012. On the annual scale, climate variability, human activity, and land-use change contributed 95.36%, 4.64%, and 12.23% to runoff increase during 1985–2012, respectively. Impacts of climate variability and human activity on runoff during 2001–2012 became stronger than those during 1985–2000. On the seasonal scale, climate variability was the dominant contributor to runoff increase in the wet season, while human activity was the primary driving force to runoff increase in the dry season. Climate variability and human activity accounted for 27.89% and 72.11% of runoff change in the dry season during 1985–2012. Land-use change had more impact on runoff in the wet season than in the dry season. Compared with 1985–2000, the contribution of climate variability to runoff change decreased in the dry season and increased in the wet season, while the contribution of human activity increased over the year during 2001–2012. On the monthly scale, human activity was the dominant contributor to runoff change in all of the months except for January, May, July, and August. It can be concluded that the dominant driver of runoff change differs on different temporal scales and varies over different periods. The results on different scales imply that attribution analysis on finer (seasonal and monthly) scales would reveal more detailed information, which might be weakened or offset on a coarser (annual) scale. Uncertainties are associated with the attribution results of runoff change, especially for those in the dry season. The findings provide better understanding of runoff behavior in the Qingliu River and provide scientific support for decision and policy makers on local water resources management.

Author Contributions

Data interpretation, H.L. and G.W.; Data analysis, Q.Y., S.L., J.S. and H.W.; Manuscript drafting, Q.Y.; Research design, Q.Y. and J.S.; Manuscript revision, J.S., D.H., H.L. and G.W.

Funding

This research was funded by the National Key Research and Development Program of China [grant number 2016YFA0601501, 2016YFA0601601], National Natural Science Foundation of China [grant numbers 41601025, 41830863, and 41830752], State Key Laboratory of Hydrology-Water Resources and Hydraulic Engineering [grant number 2017490211], Science-Technology Foundation for Young Scientist of Sichuan Province [grant number 2016JQ0007], Fok Ying Tong Education Foundation for Young Teachers in the Higher Education Institutions of China [Grant number 161062], the International Exchange Grant from the UK Royal Society and China NSFC [grant number IEC\NSFC\170123], and the Fundamental Research Funds for the Central Universities (ZYGX2018J087).

Acknowledgments

We are grateful to the Editor and the three anonymous reviewers for their valuable advices and conscientious work.

Conflicts of Interest

The authors declare no conflict of interest.

References

  1. Dey, P.; Mishra, A. Separating the impacts of climate change and human activities on streamflow: A review of methodologies and critical assumptions. J. Hydrol. 2017, 548, 278–290. [Google Scholar]
  2. Li, R.; Zheng, H.; Huang, B.; Xu, H.; Li, Y. Dynamic impacts of climate and land-use changes on surface runoff in the mountainous region of the Haihe river basin, China. Adv. Meteorol. 2018. [Google Scholar] [CrossRef]
  3. Zhai, R.; Tao, F. Contributions of climate change and human activities to runoff change in seven typical catchments across China. Sci. Total Environ. 2017, 605, 219–229. [Google Scholar] [PubMed]
  4. Budyko, M.I. Climate and Life; Miller, D.H., Ed.; Academic Press: San Diego, CA, USA, 1974. [Google Scholar]
  5. Tomer, M.D.; Schilling, K.E. A simple approach to distinguish land-use and climate-change effects on watershed hydrology. J. Hydrol. 2009, 376, 24–33. [Google Scholar]
  6. Zhang, M.; Wei, X. The effects of cumulative forest disturbance on streamflow in a large watershed in the central interior of British Columbia, Canada. Hydrol. Earth Syst. Sci. 2012, 16, 2021–2034. [Google Scholar] [Green Version]
  7. Li, Q.; Wei, X.; Zhang, M.; Liu, W.; Giles-Hansen, K.; Wang, Y. The cumulative effects of forest disturbance and climate variability on streamflow components in a large forest-dominated watershed. J. Hydrol. 2018, 557, 448–459. [Google Scholar]
  8. Schaake, J.C. From climate to flow. In Climate Change and U.S. Water Resources; Waggoner, P.E., Ed.; John Wiley: New York, NY, USA, 1990. [Google Scholar]
  9. Milly, P.C.D.; Dunne, K.A. Macroscale water fluxes 2. Water and energy supply control of their interannual variability. Water Resour. Res. 2002, 38, 24-1–24-9. [Google Scholar]
  10. Wang, G.; Zhang, J.; Yang, Q. Attribution of runoff change for the Xinshui river catchment on the Loess Plateau of China in a changing environment. Water 2016, 8, 267–280. [Google Scholar]
  11. Hou, Y.; Zhang, M.; Liu, S.; Sun, P.; Yin, L.; Yang, T.; Li, Q.; Wei, X. The hydrological impact of extreme weather-induced forest disturbances in a tropical experimental watershed in south China. Forests 2018, 9, 734. [Google Scholar]
  12. Marhaento, H.; Booij, M.J.; Rientjes, T.H.M.; Hoekstra, A.Y. Attribution of changes in the water balance of a tropical catchment to land use change using the SWAT model. Hydrol. Process. 2017, 31, 2029–2040. [Google Scholar]
  13. Anand, J.; Gosain, A.K.; Khosa, R. Prediction of land use changes based on Land Change Modeler and attribution of changes in the water balance of Ganga basin to land use change using the SWAT model. Sci. Total Environ. 2018, 644, 503–519. [Google Scholar] [PubMed]
  14. Zuo, D.; Xu, Z.; Yao, W.; Jin, S.; Xiao, P.; Ran, D. Assessing the effects of changes in land use and climate on runoff and sediment yields from a watershed in the Loess Plateau of China. Sci. Total Environ. 2016, 544, 238–250. [Google Scholar] [PubMed]
  15. Ahn, K.H.; Merwade, V. Quantifying the relative impact of climate and human activities on streamflow. J. Hydrol. 2014, 515, 257–266. [Google Scholar]
  16. Montenegro, A.; Ragab, R. Hydrological response of a brazilian semi-arid catchment to different land use and climate change scenarios: A modelling study. Hydrol. Process. 2010, 24, 2705–2723. [Google Scholar]
  17. Poelmans, L.; Rompaey, A.V.; Ntegeka, V.; Willems, P. The relative impact of climate change and urban expansion on peak flows: A case study in central Belgium. Hydrol. Process. 2011, 25, 2846–2858. [Google Scholar]
  18. Zhao, F.; Zhang, L.; Xu, Z.; Scott, D.F. Evaluation of methods for estimating the effects of vegetation change and climate variability on streamflow. Water Resour. Res. 2010, 46, 742–750. [Google Scholar]
  19. Zhang, S.L.; Yang, D.W.; Yang, H.B.; Lei, H.M. Analysis of the dominant causes for runoff reduction in five major basins over China during 1960–2010. Adv. Water Sci. 2015, 26, 605–613. [Google Scholar]
  20. United Nations Disaster Assessment and Coordination Team (UNDAC)/United Nations Inter-Agency Mission). Final Report on 1998 Floods in the People’s Republic of China. UN Office for the Coordination of Humanitarian Affairs, 7–25. 1998. Available online: https://reliefweb.int/report/china/final-report-1998-floods-peoples-republic-china (accessed on 31 December 2018).
  21. Shen, Q.; Cong, Z.; Lei, H. Evaluating the impact of climate and underlying surface change on runoff within the Budyko framework: A study across 224 catchments in China. J. Hydrol. 2017, 554, 251–262. [Google Scholar]
  22. Zhang, M.; Liu, N.; Harper, R.; Li, Q.; Liu, K.; Wei, X. A global review on hydrological responses to forest change across multiple spatial scales: Importance of scale, climate, forest type and hydrological regime. J. Hydrol. 2017, 546, 44–59. [Google Scholar]
  23. Zheng, Y.; Huang, Y.; Zhou, S.; Wang, K.; Wang, G. Effect partition of climate and catchment changes on runoff variation at the headwater region of the Yellow River based on the Budyko complementary relationship. Sci. Total Environ. 2018, 643, 1166–1177. [Google Scholar]
  24. Wang, W.G.; Shao, Q.X.; Yang, T.; Peng, S.Z.; Xing, W.Q.; Sun, F.C.; Luo, Y.F. Quantitative assessment of the impact of climate variability and human activities on runoff changes: A case study in four catchments of the Haihe River basin, China. Hydrol. Process. 2013, 27, 1158–1174. [Google Scholar]
  25. Gao, C.; Tian, R. The influence of climate change and human activities on runoff in the middle reaches of the huaihe river basin, China. J. Geogr. Sci. 2018, 28, 79–92. [Google Scholar]
  26. Zhang, J.Y.; Wang, G.Q.; Pagano, T.C.; Jin, J.L.; Liu, C.S.; He, R.M.; Li, Y.L. Using hydrologic simulation to explore the impacts of climate change on runoff in the Huaihe River Basin of China. J. Hydrol. Eng. 2013, 18, 1393–1399. [Google Scholar]
  27. Meng, D.; Mo, X. Assessing the effect of climate change on mean annual runoff in the songhua river basin, China. Hydrol. Process. 2012, 26, 1050–1061. [Google Scholar]
  28. Xi, Y.; Peng, S.; Ciais, P.; Guimberteau, M.; Li, Y.; Piao, S.; Zhou, F. Contributions of climate change, CO2, land-use change and human activities to changes in river flow across ten Chinese basins. J. Hydrometeorol. 2018, 19, 1899–1914. [Google Scholar]
  29. Wu, L.; Wang, S.; Bai, X.; Luo, W.; Tian, Y.; Zeng, C.; He, S. Quantitative assessment of the impacts of climate change and human activities on runoff change in a typical karst watershed, SW China. Sci. Total Environ. 2017, 601, 1449–1465. [Google Scholar] [PubMed]
  30. Liu, J.; Zhang, Q.; Singh, V.P.; Shi, P. Contribution of multiple climatic variables and human activities to streamflow changes across China. J. Hydrol. 2017, 545, 145–162. [Google Scholar]
  31. Editorial Committee of Encyclopedia of Rivers and Lakes in China (EC-ERLC). Section of Yangtze River basin (Vol. 2). In Encyclopedia of Rivers and Lakes in China; China Water Power Press: Beijing, China, 2010. [Google Scholar]
  32. Yang, Q.; Zhang, H.; Peng, W.; Lan, Y.; Luo, S.; Shao, J.; Chen, D.; Wang, G. Assessing climate impact on forest cover in areas undergoing substantial land cover change using Landsat imagery. Sci. Total Environ. 2019, 659, 732–745. [Google Scholar]
  33. Cheng, J.; Xie, B. Trend analysis and countermeasures of flood peak flow trend of flood Peak water level in Qingliuhe County Station. South China Agric. 2017, 11, 118–120. (In Mandarin). Available online: http://www.cnki.com.cn/Article/CJFDTotal-NFNY201715064.htm (accessed on 30 July 2018).
  34. Yang, Q.; Zhang, H.; Wang, G.; Luo, S.; Chen, D.; Peng, W.; Shao, J. Dynamic runoff simulation in a changing environment: A data stream approach. Environ. Model. Softw. 2019, 112, 157–165. [Google Scholar]
  35. Zhang, J. A comparative study of population size prediction models in Chuzhou. J. Anhui Agric. Univ. 2007, 34, 405–409. Available online: http://www.airitilibrary.com/Publication/alDetailedMesh?docid=1672352x-200707-34-3-405-409-a (accessed on 30 July 2018).
  36. Zhang, J.; Pu, L. On coordination between urbanization and farmland area of Chuzhou city in recent 30 years. Soils 2008, 40, 523–528. (In Mandarin) [Google Scholar]
  37. Kendall, M.G. Rank Correlation Measures; Charles Griffin: London, UK, 1975. [Google Scholar]
  38. Pohlert, T. Non-Parametric Trend Tests and Change-Point Detection. Available online: http://cran.stat.upd.edu.ph/web/packages/trend/vignettes/trend.pdf (accessed on 30 July 2018).
  39. Yamamoto, R.; Iwashima, T.; Hoshiai, M. An analysis of climatic jump. J. Meteorol. Soc. Jpn. 1986, 64, 273–281. [Google Scholar]
  40. Cong, Z.T.; Yang, D.W.; Ni, G.H. Does evaporation paradox exist in china? Hydrol. Earth Syst. Sci. 2009, 13, 357–366. [Google Scholar]
  41. Han, S.; Xu, D.; Wang, S. Decreasing potential evaporation trends in China from 1956 to 2005: Accelerated in regions with significant agricultural influence? Agric. For. Meteorol. 2012, 154, 44–56. [Google Scholar]
  42. Han, S.; Tian, F.; Hu, H. Positive or negative correlation between actual and potential evaporation? Evaluating using a nonlinear complementary relationship model. Water Resour. Res. 2014, 50, 1322–1336. [Google Scholar] [Green Version]
  43. Chuzhou Local Chronicles Compilation Committee. Chuzhou Chorography. Available online: http://dfz.chuzhou.gov.cn/4290494.html (accessed on 9 February 2019).
Figure 1. Location of the Qingliu River basin, East China.
Forests 10 00184 g001
Figure 2. The inter-annual change of hydro-meteorological variables ((a) precipitation, maximum daily precipitation, and runoff depth; (b) temperature and pan evaporation; and (c) wind speed and solar radiation) between 1960 and 2012 for the Qingliu River basin.
Forests 10 00184 g002
Figure 3. Change detection of runoff during 1960–2012 for the Qingliu River basin, China. UF and UB present the forward trend and backward trend line of the runoff series. UF >0 and UF <0 indicate the increasing trend and decreasing trend, respectively.
Forests 10 00184 g003
Figure 4. Double-mass curve of the accumulated annual runoff depth and the accumulated annual precipitation.
Forests 10 00184 g004
Figure 5. Intra-annual variations of meteorological variables during the disturbed period (1985–2012) relative to the baseline period (1960–1984) for the Qingliu River basin, East China.
Forests 10 00184 g005
Figure 6. Land-use classification results in 1981 (a) and 2000 (b) for the Qinliu River basin, East China.
Forests 10 00184 g006
Figure 7. Comparison of the observed and simulated runoff in the Qingliu River for the calibration (1960–1971) and validation (1972–1984) periods (a), and the scatter plot of the observed versus simulated runoff (b). Jan means January.
Forests 10 00184 g007
Figure 8. Contributions of climate variability, human activity, and land-use change to runoff variation on the seasonal scale over three different periods (1985–2012, 1985–2000, and 2001–2012) for the Qingliu River basin, East China.
Forests 10 00184 g008
Figure 9. Runoff change (mm) induced by climate variability and human activity on the monthly scale over three different periods (1985–2012, 1985–2000, and 2001–2012) for the Qingliu River basin, East China. J–D are the abbreviations of January to December.
Forests 10 00184 g009
Table 1. Ranges and final values of parameters used in the SWAT model calibration.
ParameterParameter DescriptionRange of ValuesValue Used
CN2SCS curve number for Moisture Condition II35–9875
ESCOSoil Evaporation Compensation Factor0–10.142
GWQMNThreshold depth of water in the shallow aquifer required for return flow to occur0–50001.4
GW_REVAPGroundwater revap coefficient0.02–0.20.16
ALPHA_BFBase flow alpha factor (days)0–11
SOL_AWCAvailable water capacity of the soil layer (mm/mm soil)0–10.2
RCHRG-DPOsmosis ratio in deep aquifer0–10.28
USLE-PUSLE equation support practice0–10.52
SMTMPSnow melt base temperature−5–55
BIOMIXBiological mixing efficient0–11
GW-DELAYGroundwater delay0–50075
CH-N2Manning’s “n” value for the main channel−0.01–0.30.04
REVAPMNThreshold depth of water in the shallow aquifer for “revap” or percolation to the deep aquifer to occur (mm)0–5000
Note: SWAT: Soil and Water Assessment Tool; SCS: Soil Conservation Service; USLE: universal soil loss equation.
Table 2. Statistical information of trend analysis for the hydro-meteorological variables on annual and seasonal scales between 1960 and 2012 for the Qingliu River basin, East China.
StatisticAnnualSpringSummerAutumnWinter
SlopeZSlopeZSlopeZSlopeZSlopeZ
Precipitation (mm)1.680.71−0.69−0.691.741.00−0.47−0.391.19 *3.21 *
Temperature (°C)0.02 *3.63 *0.04 *3.86 *0.010.720.02 *3.51 *0.03 *3.06 *
Evp (mm)−2.01 *−2.79 *0.220.25−1.62 *−3.90 *−0.16−0.52−0.46 *−2.22 #
Runoff depth (mm)0.720.480.060.580.090.590.171.640.37 *2.75 *
D (P > 0 mm)0.030.12−0.16 *−2.51 #0.061.08−0.17 *−2.22 #0.28 *4.48 *
D (P > 25 mm)−0.002−0.15−0.02−0.650.0030.150.010.410.01 #1.5
D (P > 50 mm)0.0010.1800.710.010.48−0.004−0.5700
Pmax1.18 #2.148 #0.070.771.24 #2.10 #−0.01−0.230.13 #1.77
Note: Z means the statistic value derived from the Mann–Kendall test method. * and # indicate that the variable has a significant change at the significance level of 0.01 and 0.05, respectively. Evp: pan evaporation; D (P > 0 mm), D (P > 25 mm), and D (P > 50 mm) represent the number of days with daily precipitation large than 0 mm, 25 mm, and 50 mm, respectively; Pmax: maximum daily precipitation.
Table 3. Comparison of hydro-meteorological variables between the baseline period and the disturbed period.
Baseline Period (1960–1984)Disturbed Period (1985–2012)ChangeChange (%)
Temperature (°C)15.2515.920.67/
Precipitation (mm)957.831002.4044.564.65
Pan evaporation (mm)947.22884.06−63.16−6.67
Runoff depth (mm)236.67274.6537.9816.05
Table 4. Transition matrix of land-use changes from 1981 to 2000 for the Qingliu River basin (unit: km2).
19812000Percentage (%)
Water BodyResidential AreaForestFarmlandBare LandTotal
Water body39.961.062.681.18044.884.19
Residential area0.8743.753.334.420.0352.44.90
Forest0.4011.97556.5658.540.41627.8858.68
Farmland0.4416.046.6312.430.02335.5331.36
Bare land0.160.821.270.556.519.310.87
Total41.8373.64570.44377.126.971070
Percentage (%)3.916.8853.3135.240.65
Table 5. Performance of the SWAT model for runoff simulation for the Qingliu River basin, East China.
IndicatorCalibration Period (1960–1971)Validation Period (1972–1984)
MonthlyMonthlyAnnual Wet SeasonDry Season
NSE0.760.810.830.870.73
Relative error (%)−8.136.566.56−3.3011.57
Note: SWAT: Soil and Water Assessment Tool; NSE: Nash–Sutcliffe coefficient.
Table 6. Results of attribution analysis for runoff change in the Qingliu River basin on annual scale.
PeriodObserved Runoff (mm)Simulated Runoff—Land Use in 1981 (mm)Simulated Runoff—Land Use in 2000 (mm)Total Change (mm)Climate-Induced ChangeHuman-Induced ChangeLand Use-Induced Change
mm%mm%mm%
1960–1984236.67236.59241.26///////
1985–2012274.72272.87277.5338.0536.2895.361.774.644.6712.26
1985–2000279.48261.70266.1742.8125.1158.6417.7141.36
2001–2012268.36287.78292.6631.7051.19161.49−19.49−61.49
Table 7. Results of attribution analysis for runoff change in the Qingliu River basin on a seasonal scale.
PeriodSeasonObserved Runoff (mm)Simulated Runoff—Land Use in 1981 (mm)Simulated Runoff—Land Use in 2000 (mm)Total Change (mm)Climate-Induced ChangeHuman-Induced ChangeLand Use-Induced Change
mm%mm%mm%
1960–1984Dry season52.0069.8169.87///////
Wet season184.67166.78171.39///////
1985–2012Dry season83.7878.6878.7031.788.8727.8922.9272.110.060.18
Wet season190.94194.19198.836.2627.42437.68−21.15−337.684.6173.60
Table 8. Changes of precipitation (in mm) during different periods relative to the baseline period (1960–1984) for the Qingliu River basin, East China.
JanuaryFebruaryMarchAprilMayJuneJulyAugustSeptemberOctoberNovemberDecember
1985–200011.408.6429.14−25.1311.4726.90−31.8024.12−31.237.821.792.21
2001–201213.5111.124.91−8.96−14.29−27.9831.1457.76−16.29−13.391.1018.26
1989–201212.309.7018.75−18.200.433.38−4.8338.54−24.83−1.271.499.09
Note: The bold numbers indicate the maximum values of runoff changes.

