Semi-Automated Sample-Based Forest Degradation Monitoring with Photointerpretation of High-Resolution Imagery

1
USDA Forest Service, Forest Inventory and Analysis Unit, Northern Research Station, 3460 Industrial Highway, York, PA 17402, USA
2
USDA Forest Service, Forest Inventory and Analysis Unit, Rocky Mountain Research Station, 507 25th Street, Ogden, UT 84401, USA
*
Author to whom correspondence should be addressed.
Forests 2019, 10(10), 896; https://doi.org/10.3390/f10100896
Submission received: 4 September 2019
/
Revised: 26 September 2019
/
Accepted: 3 October 2019
/
Published: 10 October 2019
(This article belongs to the Special Issue Estimating change in forests: Merging Ground-, Photo-, and Space-Based Observations)
Abstract
:Forest fragmentation and degradation are a problem in many areas of the world and are a cause for concern to land managers. Similarly, countries interested in curtailing climate change have a keen interest in monitoring forest degradation. Traditional methods for measuring forested landscape pattern dynamics with maps made from classified satellite imagery fall short with respect to the compatibility of their forest definitions with information needs. In addition, they are not easily amenable to interpretation using tools like confidence intervals derived from survey sampling theory. In this paper, we described a novel landscape monitoring approach that helps fill these gaps. In it, a grid of photo plots is efficiently created and overlaid on high-resolution imagery, points are labeled with respect to their land-use by a human interpreter, and mean values and their variance are calculated for a suite of point-based fragmentation metrics related to forest degradation. We presented three case studies employing this approach from the US states of Maryland and Pennsylvania, highlighted different survey sampling paradigms, and discussed the strengths and weaknesses of the method relative to traditional, satellite imagery-based approaches. Results indicate that the scale of forest fragmentation in Maryland is between 250 and 1000 m, and this agrees with compatible estimates derived from raster analytical methods. There is a positive relationship between an index of housing construction and change in forest aggregation as measured by our metrics, and strong agreement between metric values collected by human interpretation of imagery and those obtained from a land cover map from the same period. We showed how the metrics respond to simulated degradation, and offered suggestions for practitioners interested in leveraging rapid photointerpretation for forest degradation monitoring.
1. Introduction
Links between forest fragmentation, forest loss, and forest degradation have drawn interest in recent years due to increased focus on carbon monitoring and climate change mitigation strategies. For example, the United Nations’ Reducing Emissions from Deforestation and Degradation (REDD) program [1] requires the measurement and monitoring of forest cover in exchange for donor support for various forest conservation activities. Forest fragmentation has been proposed as one indicator of forest degradation [2], and thus its measurement and monitoring show promise for providing the information needed for REDD reporting [3,4].
In order to satisfy the need for information on forest fragmentation, satellite-derived land cover maps are commonly relied upon for conducting fragmentation assessments [5,6,7]. National- or continent-scale satellite imagery products often provide accurate information for coarse-scale analysis and monitoring of forests and other valuable ecosystems, as well as serve as a base layer for many activities, like stratification of forest inventory plots for improved estimation of forest status and trends [8]. However, they are not suitable for all applications, such as when forest definitions from maps don’t align with information needs. For example, the US Department of Agriculture (USDA) Forest Service’s Forest Inventory and Analysis (FIA) program conducts the national forest inventory of the United States. FIA’s definition of “forest” includes areas of land at least 0.4 ha in size with ten percent or more tree cover, that are wider than 37 m at their narrowest point, that do not have structures or wide roads, and that are not affected by land-use practices that preclude forest regeneration [8]. Most candidate land cover maps, like the National Land Cover Database (NLCD) [9] and the global forest cover maps produced by Hansen et al. [10], do not use forest definitions that meet these requirements.
Definition incompatibility can have serious consequences. In the US state of Maryland, the estimate of forest cover derived by summing the area of forest classes from the 2006 version of the NLCD is 11% higher than that from the FIA program for a similar period; the differences were much larger for smaller areas [11]. Nowak and Greenfield [12] also found large discrepancies between known tree cover classifications and those contained in the NLCD, due mainly to the poor performance of classifiers in heterogeneous areas and definitional differences. On the other hand, Fassnacht et al. [13], while acknowledging limitations of satellite remote sensing, offered commonsense strategies for effectively leveraging the improved spatial, spectral, and temporal resolution of satellite images to meet users’ needs. There have been recent attempts to harmonize satellite-derived land cover maps with more complicated forest definitions using high-resolution data and image segmentation [14]. However, there is still a need for intensive and cost-efficient monitoring of land cover changes, forest fragmentation, and forest degradation at local or regional scales with definitions that meet specific user requirements.
Efficient digital photointerpretation (PI) is one way to fill this need. High-resolution, frequently-reacquired aerial imagery data, such as that from the National Aerial Imagery Program (NAIP) in the United States [15], or high-resolution imagery from the recently-launched constellations of small satellites [16,17], are readily available in many areas. Efficient PI-based sampling relies on the use of this imagery with GIS tools to collect data from a probabilistic sample of plots.
There are four main advantages of this type of PI:
- Classification systems often more closely align with information needs than those associated with maps made with classified satellite imagery. The short reacquisition cycle of many high-resolution imagery sources (for example, NAIP is reacquired every 3–5 years) also allows for the consistent monitoring of individual points with the same classification system and protocols.
- The use of a survey sampling estimation paradigm leverages estimators and error metrics like confidence intervals with which decision-makers are accustomed to making decisions. Generally speaking, uncertainty metrics provided with most remote sensing maps cannot be viewed through the lens of survey sampling theory.
- PI plot networks can be interwoven with existing ground plot networks, creating opportunities for harmonization of ground- and PI-based reporting cycles, definitions, and estimation tools. For example, if a ground plot-based inventory cycle is 10 years, PI can be conducted over the same area every 5 years to provide mid-cycle updates of certain attributes that can be perceived on imagery.
- Efficient, low-cost protocols can be designed using less specialized knowledge and training than that which is typically needed for production mapping, something appealing to many REDD participants.
Many recent forest and tree cover inventories have been conducted using high-efficiency PI [18,19,20,21,22,23], and several tools have been developed to facilitate PI data collection [24]. Recent advances include the augmentation of ocular PI with the information contained in temporal sequences of satellite imagery. This helps interpreters better understand landscape dynamics and improve classification accuracy using the phenological data contained in temporal sequences [18,25,26,27,28].
A logical extension of PI-based land cover assessment is PI-based forest fragmentation analysis. Fragmentation analysis has traditionally been conducted using a GIS to analyze spatial patterns depicted on wall-to-wall maps [5,29,30]. However efficient and useful these approaches might be, they suffer from the aforementioned risk of definitional incompatibility and procedural inconsistency as new sensors or classification algorithms are brought online. The wealth of plot-based inventory data and many new technologies for efficiently conducting PI have thus led to an interest in pursuing PI-based approaches [31]. For example, Nelson et al. [32], Meneguzzo and Hansen [33], Kleinn [34], and Ramezani [35] all used forest inventory ground plots to calculate metrics, such as patch size, patch number, edge length, and edge density from measurements of edges between land cover types. Ramezani et al. [36], Ramezani and Holm [37], and Ramezani and Ramezani [38] also used PI of points and line transects to calculate adjacency-based fragmentation metrics.
To our knowledge, however, there have not been previous efforts to monitor forest degradation using fragmentation indices calculated from efficient sample-based PI. PI datasets, like those collected with tools like Collect Earth Online [28] have been obtained at great expense, and their potential for use in fragmentation and degradation analysis has not been explored. Finally, compared with wall-to-wall approaches, there is a lack of guidance on how to use survey sampling theory to monitor changes in fragmentation indices in general. Comparisons with existing methods and implementation guidance are, therefore, needed so that practitioners become comfortable extending PI-based forest monitoring data to fragmentation studies.
Our study seeks to fill these gaps by advancing the basic science and providing case studies of PI-based forest fragmentation and degradation assessments that rely on survey sampling approaches. We presented two case studies of PI-based fragmentation and degradation assessments in the US state of Maryland—a multitemporal analysis at the state level (MD), and a single period analysis, conducted with a different design, within Prince George’s County (PG). A third case study is from the US state of Pennsylvania, in Schuylkill County (SC), where PI from a single period was conducted, forest degradation was simulated, and sampling-based change and precision estimates were calculated. We aimed to build on existing work in the fields of forest fragmentation analysis and sampling theory by developing and presenting new indices and analysis paradigms that allow data from intensive PI studies to be used in ways not previously foreseen. Through our presentation of case studies and distribution of computer code, our main objective was to show the value of this approach and provide tools and conceptual models that practitioners can use to improve upon their forest monitoring systems.
2. Materials and Methods
2.1. Study Sites and Sample Design
The study area we chose for MD is the land area of the eastern coastal state of Maryland, USA (25,142 km2), and for PG is the land area of Prince George’s County, Maryland (1290 km2), which is found in the southwest part of the state (Figure 1). Maryland is characterized by ecological conditions ranging from coastal plain ecosystems in the east to mountainous areas in the west, and a very highly urbanized corridor that runs through the center of the state. The SC study site (2028 km2) is in northeastern Pennsylvania and is dominated by the forested ridges of the Appalachian mountain range, with nonforest agricultural land and settlements in the valleys.
For MD and PG, the sampling design we used was chosen as part of a larger study of land-use in Maryland [19]. We used 5046 plots (described below) for the MD study and 3465 plots for the PG study. Both samples were chosen in a spatially-balanced manner, using the sample selection procedure described in Lister and Scott [39]. This procedure uses a fractal (a space-filling curve) that covers the entire study area to create a tessellation that partitions the sampling frame into units from which samples are drawn in a spatially uniform, equal probability manner; this is analogous to a systematic design but without the same degree of regularity. For SC, the sampling design was chosen as part of a forest inventory precision improvement study by Westfall et al. [23]. We used 2099 plots (described below), again chosen in the manner described by Lister and Scott [39].
2.2. Plot Design
The plot design of the MD sample was chosen as part of a larger land-use change study [19]. For that study, a cluster design was chosen, with four points separated by 500 m arranged in a square pattern (Figure 2a). This configuration minimized cost while maximizing land-use change estimate precision.
For PG, a plot design selection procedure was implemented, similar in principle to the concept of cyclic sampling described in Burrows et al. [40]. Based on PI heuristics established by Lister et al. [19], it was determined that a cluster plot with an array of 10 subplots (points) would conservatively allow us to finish all plots within the time and budget allotted for the study. Since the fragmentation metric used in this study, described below, relies upon grouping points into separation distance classes and summarizing land-use class adjacency frequencies, our goal was to select a 10-point configuration that would provide a roughly equal count of pairs of points per separation distance class. This would allow for the calculation of the metric with similar numbers of points in each class. To achieve this, we implemented a procedure in which a random set of 10 points was drawn, with replacement, 50,000 times from a grid of 25 equidistant (50 m spacing) points distributed on a square, 200 m × 200 m grid (Figure 2b). For each set of points drawn, we calculated the separation distance between each point and every other point in the 10-point sample. Next, we counted the number of pairs of points in each separation distance class and stored the result. We then randomly chose the final plot design from among the handful of configurations that yielded a uniform count of points per distance class, which, in our case, was nine pairs per plot (Figure 2b).
For SC, the plot consisted of an array of 52 points arranged uniformly within a circular area of 5810 square meters. This area was chosen because a circle of this size circumscribes a single FIA cluster plot, which was the focus of the study from which the data came [23]. Interpoint spacing was approximately 12 m.
2.3. Fragmentation and Degradation Indicators
For MD and PG, the forest fragmentation metric we chose to illustrate the point-based approach, what we call Point Aggregation Index (PAI) (Table 1), is based on the probabilities used to calculate Shannon and Weaver’s [41] conditional entropy. The metric uses class adjacency probabilities as its foundation, like entropy-based metrics, such as Q, the nearest neighbor probability metric [42], Cluster/Interspersion (CL) index [43], and the similar Aggregation Index (AI) [44]. PAI can be used as a component of several contagion indices calculated from the entropy of attribute adjacency [45], only using points instead of raster cells as the element with which probabilities are calculated. The minimum value of PAI is 0 (there are no adjacent points of the class of interest), and the maximum value is 1 (the entire landscape is made up of one class). Figure 3a–c give examples of PAI calculation under different landscape configurations.
One key feature of calculating contagion indices based on PAI is that it can be done with a user-specified definition of adjacency. With pixel-based approaches, adjacency is typically limited to different definitions of pixel contiguity (e.g., the 4- or 8 neighbor rule). With points, adjacency can be defined using an annular neighborhood approach—points are considered adjacent if they are found within a chosen distance band of one another. Figure 3d illustrates the calculation of PAI on the scenario depicted in Figure 3a, only using a larger neighborhood to define adjacency.
For SC, several adjacency metrics were adapted for use with points or developed with the goal of creating index values that can be used as plot-based values to use in survey sampling estimation procedures. Furthermore, at the recommendation of Li et al. [46], we focused on commonsense metrics that are related to biological functions forest provide. A list of these metrics is provided in Table 1.
2.4. Data Collection Methods and Metric Calculation for the MD and PG Study Areas
2.4.1. PI and Subpopulation-Level Estimation Procedures
The land-use category was assessed on each point on every plot by interpreting digital aerial imagery. The 1998 imagery (used as the time 1 dataset for the MD study) consisted of the panchromatic, leaf-on, 2-m-pixel resolution, digital orthophoto quadrangles (DOQs) from a state-level imagery dataset stored locally in an ArcGIS [47] raster catalog. The 2007 imagery (used as the time 2 MD data and for the PG study) consisted of the color infrared, leaf-on, 1-m-pixel resolution, digital images from the National Aerial Imagery Program (NAIP) served over the Internet using a web-mapping service (WMS). The definitions of the forest and nonforest land-use categories used were those used by FIA [8]. A single interpreter was trained and conducted all photo analyses for this study. Quality assurance protocols included a second assessment of a portion of the points by another interpreter and the requirement that the first interpreter re-interpret several hundred randomly-chosen points to assess consistency. In both cases, at least 95% of the interpreter’s work met quality standards (i.e., was correct and/or consistent).
To increase PI efficiency, an automation method was developed whereby an ArcGIS tool was used to create subsets of imagery from the WMS to areas encompassing and slightly beyond the extent of the footprint of each plot. In other words, “snapshots” of imagery at a scale of 1:4000 were generated, with each image centered on the plot and containing sufficient detail for the interpreter to assess land-use status. The sets of images for both studies were stored locally and displayed using a Microsoft Access form developed for the project (Figure 4a). A template of this form with all functionality is available in the supplementary material. The form was designed to display the images and allow for data entry in such a way that the number of mouse clicks, wait time for image loading, and data entry times were minimized. In addition, links to both “Google Maps” and “Bing Maps” were enabled for each point so that contextual information, and, where possible, Google’s “Street View”, could be used to guide the interpreter.
For the MD study area, we calculated PAI for five distance classes with cut-offs of 500, 1000, 2000, 3000, 4000, and 5000 m for each of two periods (1998 and 2007), and aggregated values by subpopulations consisting of county groups we created using county-level densities of new housing permits issued between 1990 and 2010 (# housing unit permits issued/area of county) [50]. The county groups, which we hypothesized would correspond with different levels of change in PAI, were formed by implementing Jenks’ optimization method [51], which iteratively chooses class breaks, seeking to minimize within-group and maximize the between-group variance of housing permit density (Figure 5). The goal of these efforts was to characterize the relationships between PAI and scale of analysis (point separation distance) and use them to assess fragmentation at different scales.
For the 2007 period used in the PG study area, we calculated a single PAI for each of the 50 m distance classes at the fine-scale (0–50, 50–100, 100–150, and 150–200 m separation distance classes) using all of the points in the study, and for the sake of efficiency, calculated it using just one of the points per plot at what we term the coarse-scale (500–5000 m), with the following distance class cut-offs: 250, 500, 750, 1000, 2000, 3000, 4000, and 5000 m.
2.4.2. Variance Estimation for PAI for the MD and PG Study Areas
PAI, as we calculated it for MD and PG, is an index calculated from the set of between-subplot and between-plot values collected on a subpopulation of our PI plots. Because the nature of the sampling distribution of this statistic is unknown, and for illustrative purposes, we chose to use a delete-one jackknife variance estimation approach, described in Thompson [52] and used by Kleinn [34] and Ramezani and Ramezani [38]. In this approach, one cluster plot is deleted from the sample, and PAI is calculated. This is repeated for each plot in succession, and the estimator of the variance of PAI is calculated as follows:
where n = the number of cluster plots used, is PAI generated from the ith deletion, and is the mean of the set of PAI’s calculated with n − 1 plots each. An approximate 100(1 − α)% confidence interval for is calculated as
where t is the value from the t distribution with n − 1 degrees of freedom.
2.4.3. Comparison with Traditional Raster Data and Methods for the PG Study Area
In order to compare our results with more traditional methods for the PG study area, we used the same sample and plot designs to calculate PAI by using a GIS to intersect the point locations with a raster forest/nonforest map derived from a reclassification of the NLCD 2001 land cover product. The reclassification consisted of grouping all NLCD classes in the 40 range (forest) and 91 (woody wetland) into a forest (f) category and everything else into the nonforest (nf) category. In addition to calculating PAI using this f/nf dataset, we also calculated average patch size by first assigning each pixel to a patch based on its contiguity with other pixels of the same class (using an 8 neighbor rule), and then averaging the areas of the patches that were formed.
As an improvement to the traditional, raster-based patch size calculation, we also developed an alternative measure of a property for which patch size is often used as a surrogate—a variable we called mean traversal width-length index (TWL). Mean TWL statistics are calculated by summarizing the area of the class of interest on a per-patch or analysis unit basis using a set of perpendicular transects established through the landscape (Figure 6):
where Li is the length of a transect found within patch i of n patches found on the landscape.
The intent is to characterize that property of a patch or set of patches relates to unidirectional flow, as occurs with many materials (wildlife, propagules, wind, water, etc.) that traverse an ecosystem.
We calculated TWL by first establishing what amounts to sets of 30-m wide northerly- and southerly- transects through the 30-m resolution f/nf image by assigning to each pixel the value of its Albers NAD83 Easting and Northing. We then attached to each pixel the f or nf value from the f/nf map and used the ArcGIS 10.0 [47] command “regiongroup” to attach a unique region identifier to each segment of contiguous f pixels formed by both the Easting and Northing transects. This created a set of uniquely-identified, 30-m wide strips of contiguous forest pixels in both the north-south and the east-west directions. The length of each strip (area/30) was then obtained, and a histogram of TWL values was generated.
We acknowledge that TWL is not rotation invariant, but we assumed that the two perpendicular directions would give an adequate characterization of TWL because we saw no evidence of anisotropic pattern on the landscape; if a pattern of north-south or east-west orientation of features is suspected, a random rotation of the land cover image can be easily applied in a GIS prior to TWL generation.
2.5. Data Collection Methods, Metric Calculation, and Estimation Procedures for the SC Study Area
The land-use category was assessed on each point of each plot by interpreting 1-m-pixel resolution color NAIP imagery from 2015, obtained from a WMS [15]. The definitions of the forest and nonforest categories used were the same as those for the MD and PG study areas. A single interpreter was trained and conducted all photo analyses for this study using the same image preparation procedure and the Microsoft Access form approach described above (Figure 4b). The dataset used and the form are available in the supplementary material. Quality assurance protocols were similar to those described previously for MD and PG.
The metrics shown in Table 1 were calculated using code written in the R Statistical Software language [53], provided in the supplementary material. For SC, the paradigm of estimate calculation is plot-based; i.e., metrics for individual plots were calculated and, thus, treated as plot-level random variables. In order to demonstrate how to estimate change and forest degradation using this set of random variables and estimators from survey sampling, a random number drawn from a uniform distribution ranging from 0 to 1 was assigned to each point where forest cover was detected. Points with a random number value between 0.99 and 1 were removed in order to simulate a random, uniform degradation (loss) of 1% of the forest across the study area; hereafter, we have referred to this simulated degradation dataset as the Time 2 dataset. Metrics in Table 1 were again calculated with the Time 2 data, and estimates of change and their variance were generated. For each estimate, including plot-level change, the following estimators were applied for the (sub)population mean () and its variance (), assuming simple random sampling:
where yi = the attribute of interest on plot i expressed as the value of the index calculated as described in Table 1; for change estimation, the attribute on each plot is calculated as IT2–IT1, where I is the calculated index from Table 1, and T1 and T2 are time periods 1 and 2, respectively, and n = number of plots used in the estimation. For n used in our study, see Table 1. For change estimation, the subset of plots that have per-plot index values calculated at both periods is used.
The variance of the (sub)population mean is estimated as:
where yi and n are defined as before and s2 is the sample variance, ignoring the finite population correction factor when sample sizes are sufficiently large.
3. Results and Discussion
3.1. PG and MD Study Areas
3.1.1. PAI and NLCD Metrics in the PG Study Area
The plot of PAI vs. separation distance class for both the PI and the NLCD f/nf map is shown in Figure 7. As expected, PAI varied at different scales of observation, or in our parlance, for different definitions of adjacency. The fact that PAI from both PI and NLCD track each other so closely supports our assumption that our human interpreter and PI method is compatible with automated methods and maps derived from image classification.
The pattern of the decay of PAI with distance was expected. The NLCD 2001 map showing the f/nf pattern in Prince George’s County indicates a mosaic of irregularly shaped and sized forest patches (e.g., Figure 6). This led us to expect a broad range of values, with smaller separation distances yielding a higher PAI (the existence of larger, aggregated patches would lead to this), and larger separation distances yielding lower values (separation distances beyond the average patch width, among other things, would cause this). The phenomenon that leads to this pattern of decay of PAI with separation distance is related to spatial autocorrelation, a condition whereby phenomena located closer together are more similar than those located farther apart. Spatial autocorrelation is a characteristic of landscape pattern, and its causes and effects are well-described in the literature [54].
Monitoring changes in the shape of the PAI-separation distance class relationship can offer information relevant to landscape-scale forest dynamics. The form of the relationship between PAI and separation distance indicates that beyond the separation distance range of approximately 250–1000 m, there is a relatively small decrease in the likelihood that two points chosen at random will both be a forest. In other words, the effect of local pattern on PAI diminishes, and the effect of the landscape-scale pattern has begun to take over. This hypothesis is supported by our analysis of the NLCD dataset. The average patch area was 21.2 ha, or, if a square patch is assumed, 460 m on a side (520 m diameter if a circular patch is assumed). The frequency distribution (Figure 8) and associated summary statistics of the components of the TWL metric, which characterize a property of the landscape related to the linear flow of materials, indicate a relatively similar size range: average TWL was 240 m, and median TWL was 120 m.
3.1.2. Temporal Differences in PAI across Different Scales and Historical Housing Permit Densities in the MD Study Area
The relationship between historical housing permit density (Figure 5), separation distance, and change in PAI over time can be seen in Figure 9. A pattern of decay of PAI with separation distance, similar to that seen in the PG study area, occurs at the state level. Almost all of the distance classes showed a significant (non-overlapping 95% confidence intervals) difference in PAI values between housing unit density levels. For the medium and high housing unit density levels, there was a consistent trend of reductions in PAI between 1998 and 2007 for all distance classes. These findings align with our assumption that PAI differences would be correlated with processes that affect landscape pattern status and dynamics; housing unit density permits can be thought of as a surrogate for development activity, leading to forest degradation and loss. The lower PAI values and greater reduction in PAI over time are found in the counties in the more populous, less-forested portions of the state—those affected most by development during the decade under study (Figure 5).
It is important to note that for PG and MD, PAI results were calculated as a ratio of counts of point adjacencies at the estimation unit level, not first for individual plots, and then summarized for estimation units. Under this paradigm, our estimates of PAI and the precisions of the estimates are interpreted as characteristics of a subpopulation of unknown size within the analysis unit. The subpopulation must consist of the set of population elements with at least one forested point on them; otherwise, PAI calculation would be impossible because there would be a zero in the denominator (Table 1, PAI). Because of this and the fact that plots contribute unequally to the subpopulation-level, ratio-based estimate, the form of the sampling distribution of PAI is difficult to know. The jackknife variance estimator, therefore, appears to be a reasonable approach to addressing this situation, as it does not require distributional assumptions. Both Kleinn [34] and Ramezani and Ramezani [38] used the jackknife variance estimator when calculating landscape metrics based on forest inventory plots.
It must be noted, however, that procedures for comparing means using this method are not straightforward. For example, we inferred significant differences between county-group PAI values for all distance classes because confidence intervals do not overlap. However, inferring the significance of differences in means using confidence interval overlap is not strictly correct as it assumes additivity of standard errors [55]. In our case, since the confidence interval for the difference is inflated due to this unfounded assumption, our conclusion is justified, but clearly, this is not a satisfactory approach to use in all cases, and better ways to compare means with jackknife variance estimators are needed.
3.2. Sample-Based Estimates of Metrics and Change in the SC Study Area
In contrast to the “single observation unit” paradigm employed in the PG and MD study areas, we chose a traditional survey sampling paradigm for the SC study area. In other words, we performed estimation by first aggregating adjacency counts and other information to the plot level, calculating the metrics in Table 1 by plot, and then calculating means and their variances using this set of plot-level metric values. This does two things—it allows us to use traditional estimators of mean and variance of means, and it shifts the focus to the subpopulation of existing forest and the plot-scale, which in the case of SC is tied to our plot geometry, approximately 1-ha. Under this paradigm, the subpopulation sample size is a random variable, but Thompson [52] (p. 63) showed that for sufficiently large sample sizes, an unbiased estimator of the conditional variance, given the subpopulation sample size, is the same as that shown in equation 5. For forest degradation, estimates of changes in ~hectare-scale metrics calculated only within a specific subpopulation of forested points are arguably more relevant than those calculated at the landscape scale with these metrics.
For the metrics Mean Forest Proportion 18-m window (MFP18), SD Forest Proportion 18-m window (SDFP18), and Proportion Forest (PF), which are calculated using all plots and points, there is no distinction between the estimation paradigms, as parameter estimates are interpreted the same (all plots have equal impact and selection probability, and the population is the entire area of SC). However, with metrics that rely on either one or two forested points per plot, the subpopulation of interest is defined in the somewhat ambiguous way as “the subset of population elements having at least one (or two for some metrics) forest points within a circle of 82 m diameter”. The plot-level values, in this case, are considered equal-impact measurements of some local characteristics of forest-related to its spatial configuration. Changes in plot-level mean values of these metrics can thus be seen as a way to track degradation in a manner that more closely addresses the concerns about changes in ecological function that originally motivated interest in degradation monitoring, at the appropriate scale.
Table 2 contains results obtained under this paradigm for the PI analysis of the SC study area, alongside results obtained from a degradation simulation that represents 1% forest loss, randomly assigned to the set of all initially-forested points. Sample-based estimates of metric differences (degraded—original), with their standard errors and 95% confidence intervals, are also provided. The trajectory of change in metric values was as expected; when simulated degradation was applied, metrics related to adjacency counts (PAI, NA (Number of forest-forest point adjacencies), and rNA (Relative number of adjacencies)) decreased. This suggests that in the average ~1-ha area containing forest, forested points became more dispersed.
Similar conclusions can be drawn from changes in metrics related to the intra-plot distance between forested points (traveling salesperson problem distance (TSPd), relative TSP distance (rTSPd), nearest neighbor distance (NNd), and mean interpoint distance (MId)). It is noteworthy that while mean TSPd (the total distance required to visit each forested point on the plot and return to the first point) decreased, the relative value (i.e., the per-point total distance) increased, again suggesting that functions of forest that rely on networks of interconnected forest points at the ~1-ha scale, such as providing habitat to forest-dwelling wildlife species, have become degraded. Finally, MFP18, SDFP18, and PF, which were calculated with all points in SC, show that within the land area of SC, on average, there is not only less forest overall, but points in this area have less forest immediately surrounding them, and the proportion of forest surrounding them is more variable. All differences in means given in Table 2 (except for NNd) are significantly different from zero, given the large sample sizes; this, however, is not relevant if the magnitudes of the differences do not have a practical impact.
3.3. Additional Considerations for Landscape Metrics and Sample-Based Estimation
3.3.1. The Validity of Fragmentation Metrics and Functional Significance
We would like to emphasize that none of the metrics or change estimators we used could effectively measure what we term functional degradation or the level of forest fragmentation or degradation that has ecological meaning [56,57]. Similarly, many landscape configurations could yield the same value for each of these metrics. Since a full comparison of the performance of our metrics under different scenarios is beyond the scope of the current research, we refer the reader to excellent reviews of this topic [34,46,58,59], and will suffice it to say that in general, the metrics should be seen as components of some multidimensional property of a landscape related to forest quantity, distribution, and patch shape, not necessarily as physical properties with a direct biological meaning. In other words, these types of analyses should serve as guides that will alert managers to the trajectory of forest degradation.
3.3.2. Costs
With respect to costs, our method allowed for the interpretation of roughly one plot (10 points) every 13 seconds for PG, one plot (4 points) every 6 seconds for MD, and one plot (52 points) every 45 seconds for SC. Knowing the time and cost per sampling unit, and the expected frequency of the attribute of interest on the landscape, project managers can very precisely calculate the budgets for PI-based land cover assessments with an expected level of precision [19]. They can also easily conduct quality assurance, and when change is detected, examine and document the details of the change from the imagery. Forest monitoring groups that are required to characterize forest status or degradation in a detailed way with a limited budget can benefit from the PI-based monitoring approach we present. Future work will involve refining the set of landscape metrics presented in Table 1 and assessing their performance under different heterogeneity and change scenarios.
3.3.3. Applications
This research was motivated by the need for information on forest degradation using definitions that correspond precisely with what a human interpreter would choose, as well as interest in leveraging the abundance of georeferenced national forest inventory data [34,38,60] and PI-based forest monitoring information [28] that has become readily available. Potential applications include multi-scale comparisons of changes in metric values or differences between analysis units (e.g., county groups, Figure 5, and related discussion), or use as a covariate in assessments of forest condition and health, as has been done with other fragmentation metrics [61,62]. Finally, results can be used by planners and land managers as a component of a forest monitoring system like that required for participation in REDD+ to help prepare resource assessments and management plans.
4. Conclusions
We conclude that our approach to using data collected from PI for monitoring landscape pattern status and trends, and inferring degradation, offers many benefits. Results are similar to those obtained from summaries of raster maps, and we showed that the values of the metrics are correlated with the intensity of processes that lead to degradation. Our case studies illustrate two workflows and sampling paradigms and highlight the pros and cons of each. Overall, we find that leveraging existing PI data, like those being collected with tools like Collect Earth Online and other rapid PI methods, has great potential for filling information needs that are not currently met by more traditional degradation monitoring approaches relying on satellite imagery classification.
Supplementary Materials
The following are available online at https://www.mdpi.com/1999-4907/10/10/896/s1: Input datasets for SC study area, R code for generating results tables for SC study area, and form for collecting data in SC with 20 images as an example.
Author Contributions
Conceptualization: A.L. and T.L.; methodology: A.L.; software: A.L.; validation: A.L., T.L. and T.W.; formal analysis: A.L. and T.L.; investigation: A.L. and T.L.; resources: A.L. and T.W.; data curation: A.L. and T.W.; writing—original draft preparation, A.L. and T.L.; writing—review and editing: A.L., T.L. and T.W.; visualization, A.L.; supervision, A.L.; project administration, A.L.; funding acquisition N/A.
Funding
This research received no external funding.
Acknowledgments
We gratefully acknowledge the hard work of James Doyle and Eunice Alexander, who helped collect the PI data used in the MD and PG portions of the study.
Conflicts of Interest
The authors declare no conflict of interest.
References
- UNFCCC Secretariat. Key Decisions Relevant for Reducing Emissions from Deforestation and Forest Degradation in Developing Countries (REDD+); UNFCCC Secretariat: Bonn, Germany, 2016. [Google Scholar]
- Thompson, I.; Guariguata, M.; Okabe, K.; Bahamondez, C.; Nasi, R.; Heymell, V.; Sabogal, C. An operational framework for defining and monitoring forest degradation. Ecol. Soc. 2013, 18, 20. [Google Scholar] [CrossRef]
- FAO. Assessing Forest Degradation: Towards the Development of Globally Applicable Guidelines; Forest Resources Assessment Working Paper 177; Food and Agriculture Organization of the United Nations: Rome, Italy, 2011. [Google Scholar]
- Shapiro, A.C.; Aguilar-Amuchastegui, N.; Hostert, P.; Bastin, J.-F. Using fragmentation to assess degradation of forest edges in Democratic Republic of Congo. Carbon Balance Manag. 2016, 11, 11. [Google Scholar] [CrossRef] [PubMed]
- Riitters, K.; Wickham, J.; Costanza, J.; Vogt, P. A global evaluation of forest interior area dynamics using tree cover data from 2000 to 2012. Landsc. Ecol. 2016, 31, 137–148. [Google Scholar] [CrossRef]
- Riitters, K.; Wickham, J.; O’Neill, R.; Jones, B.; Smith, E. Global-scale patterns of forest fragmentation. Conserv. Ecol. 2000, 4, 3. [Google Scholar] [CrossRef]
- Wulder, M.; White, J.; Han, T.; Coops, N.; Cardille, J.; Holland, T.; Grills, D. Monitoring Canada’s forests. Part 2: National forest fragmentation and pattern. Can. J. Remote Sens. 2008, 34, 563–584. [Google Scholar] [CrossRef]
- US Department of Agriculture, Forest Service. Forest Inventory and Analysis National Core Field Guide, Volume 1: Field Data Collection Procedures for Phase 2 Plots, Version 8.0; U.S. Department of Agriculture, Forest Service, Forest Inventory and Analysis, Washington Office: Washington, DC, USA, 2019. Available online: https://www.fia.fs.fed.us/library/field-guides-methods-proc/docs/2018/core_ver8-0_10_2018_final.pdf (accessed on 3 September 2019).
- Homer, C.; Dewitz, J.; Fry, J.; Coan, M.; Hossain, N.; Larson, C.; Herold, N.; McKerrow, A.; Vandriel, J.N.; Wickham, J. Completion of the 2001 National Land Cover Database for the Conterminous United States. Photogramm. Eng. Remote Sens. 2007, 73, 337–341. [Google Scholar]
- Hansen, M.C.; Potapov, P.V.; Moore, R.; Hancher, M.; Turubanova, S.A.; Tyukavina, A.; Thau, D.; Stehman, S.V.; Goetz, S.J.; Loveland, T.R.; et al. High-resolution global maps of 21st-century forest cover change. Science 2013, 342, 850–853. [Google Scholar] [CrossRef]
- US Department of Agriculture, Forest Service. EVALIDator Web-Application. 2019. Available online: http://fsxopsx1056.fdc.fs.usda.gov:900/Evalidator/evalidator.jsp (accessed on 19 June 2019).
- Nowak, D.J.; Greenfield, E.J. Evaluating the national land cover database tree canopy and impervious cover estimates across the conterminous United States: A comparison with photo-interpreted estimates. Environ. Manag. 2010, 46, 378–390. [Google Scholar] [CrossRef]
- Fassnacht, K.S.; Cohen, W.B.; Spies, T.A. Key issues in making and using satellite-based maps in ecology: A primer. For. Ecol. Manag. 2006, 222, 167–181. [Google Scholar] [CrossRef]
- O’Neil-Dunne, J.P.M.; MacFaden, S.W.; Royar, A.R.; Pelletier, K.C. An object-based system for LiDAR data fusion and feature extraction. Geocarto Int. 2013, 28, 227–242. [Google Scholar] [CrossRef]
- APFO. National Aerial Imagery Program Imagery (NAIP) Information Sheet. 2018. Available online: https://www.fsa.usda.gov/Internet/FSA_File/naip_info_sheet_2015.pdf (accessed on 3 September 2019).
- Belward, A.S.; Skøien, J.O. Who launched what, when and why; trends in global land-cover observation capacity from civilian earth observation satellites. ISPRS J. Photogramm. Remote Sens. 2015, 103, 115–128. [Google Scholar] [CrossRef]
- Dash, J.; Ogutu, B.O. Recent advances in space-borne optical remote sensing systems for monitoring global terrestrial ecosystems. Prog. Phys. Geogr. 2016, 40, 322–351. [Google Scholar] [CrossRef]
- Bey, A.; Sánchez-Paus Díaz, A.; Maniatis, D.; Marchi, G.; Mollicone, D.; Ricci, S.; Bastin, J.-F.; Moore, R.; Federici, S.; Rezende, M.; et al. Collect Earth: Land use and land cover assessment through augmented visual interpretation. Remote Sens. 2016, 8, 807. [Google Scholar] [CrossRef]
- Lister, T.W.; Lister, A.J.; Alexander, E. Land use change monitoring in Maryland using a probabilistic sample and rapid photointerpretation. Appl. Geogr. 2014, 51, 1–7. [Google Scholar] [CrossRef]
- Megown, K.; Lister, A.; Patterson, P.; Frescino, T.; Jacobs, D.; Webb, J.; Daniels, N.; Finco, M. Image-based change estimation (ICE): Monitoring land use, land cover and agent of change information for all lands. In Proceedings of the Forest Inventory and Analysis (FIA) Symposium 2015, Gen. Tech. Rep. PNW-GTR-931, Portland, OR, USA, 8–10 December 2015; Stanton, S., Christensen, G.A., Eds.; USDA Forest Service, Pacific Northwest Research Station: Portland, OR, USA, 2015; p. 218. [Google Scholar]
- Nowak, D.J.; Greenfield, E.J. Declining urban and community tree cover in the United States. Urban For. Urban Green 2018, 32, 32–55. [Google Scholar] [CrossRef]
- Nowak, D.J.; Greenfield, E.J. Tree and impervious cover in the United States. Landsc. Urban Plan. 2012, 107, 21–30. [Google Scholar] [CrossRef] [Green Version]
- Westfall, J.A.; Lister, A.J.; Scott, C.T.; Weber, T.A. Double sampling for post-stratification in forest inventory. Eur. J. For. Res. 2019, 138, 375–382. [Google Scholar] [CrossRef]
- Schepaschenko, D.; See, L.; Lesiv, M.; Bastin, J.-F.; Mollicone, D.; Tsendbazar, N.-E.; Bastin, L.; McCallum, I.; Laso Bayas, J.C.; Baklanov, A.; et al. Recent advances in forest observation with visual interpretation of very high-resolution imagery. Surv. Geophys. 2019, 40, 839–862. [Google Scholar] [CrossRef]
- Kennedy, R.E.; Yang, Z.; Cohen, W.B. Detecting trends in forest disturbance and recovery using yearly Landsat time series: 1. LandTrendr—Temporal segmentation algorithms. Remote Sens. Environ. 2010, 114, 2897–2910. [Google Scholar] [CrossRef]
- Lister, A.J.; Leites, L.P. A Sentinel satellite-based forest ecosystem change detection system. In Doing More with the Core, Proceedings of the 2017 Forest Inventory and Analysis (FIA) Science Stakeholder Meeting, Vol. RMRS-P-75, Park City, UT, USA, 24–26 October 2017; USDA Forest Service, Rocky Mountain Research Station: Park City, UT, USA, 2017; pp. 45–48. [Google Scholar]
- Pflugmacher, D.; Cohen, W.B.; Kennedy, R.E. Using Landsat-derived disturbance history (1972–2010) to predict current forest structure. Remote Sens. Environ. 2012, 122, 146–165. [Google Scholar] [CrossRef]
- Saah, D.; Johnson, G.; Ashmall, B.; Tondapu, G.; Tenneson, K.; Patterson, M.; Poortinga, A.; Markert, K.; Quyen, N.H.; San Aung, K.; et al. Collect Earth: An online tool for systematic reference data collection in land cover and use applications. Environ. Model. Softw. 2019, 118, 166–171. [Google Scholar] [CrossRef]
- McGarigal, K.; Cushman, S.A.; Neel, M.C.; Ene, E. FRAGSTATS: Spatial Pattern Analysis Program for Categorical Maps; University of Massachusetts, Amherst: Amherst, MA, USA, 2002. [Google Scholar]
- Mladenoff, D.J.; DeZonia, B. APACK 2.17 User’s Guide; University of Wisconsin, Forest Landscape Ecology Lab: Madison, WI, USA, 2001. [Google Scholar]
- Kleinn, C.; Traub, B. Describing landscape pattern by sampling methods. In Advances in Forest Inventory for Sustainable Forest Management and Biodiversity Monitoring; Corona, P., Köhl, M., Marchetti, M., Eds.; Springer: Dordrecht, The Netherlands, 2003; pp. 175–189. [Google Scholar]
- Nelson, M.; Lister, A.; Hansen, M. Estimating number and size of forest patches from FIA plot data. In Proceedings of the Eighth Annual Forest Inventory and Analysis Symposium, Gen. Tech. Report WO-79, Monterey, CA, USA, 16–19 October 2006; U.S. Department of Agriculture, Forest Service: Washington, DC, USA, 2009; pp. 159–164. [Google Scholar]
- Meneguzzo, D.; Hansen, M. Quantifying forest fragmentation using Geographic Information Systems and Forest Inventory and Analysis plot data. In Proceedings of the Eighth Annual Forest Inventory and Analysis Symposium, Monterey, CA, USA, 16–19 October 2006; U.S. Department of Agriculture, Forest Service: Washington, DC, USA, 2009; pp. 143–147. [Google Scholar]
- Kleinn, C. Estimating metrics of forest spatial pattern from large area forest inventory cluster samples. For. Sci. 2000, 46, 548–557. [Google Scholar]
- Ramezani, H. Forest edge length estimation—A case study using the Swedish National Forest Inventory (NFI). Scand. J. For. Res. 2017, 32, 782–788. [Google Scholar] [CrossRef]
- Ramezani, H.; Holm, S.; Allard, A.; Stahl, G. Monitoring landscape metrics by point sampling: Accuracy in estimating Shannon’s diversity and edge density. Environ. Monit. Assess. 2010, 164, 403–421. [Google Scholar] [CrossRef] [PubMed]
- Ramezani, H.; Holm, S. Sample based estimation of landscape metrics; accuracy of line intersect sampling for estimating edge density and Shannon’s diversity index. Environ. Ecol. Stat. 2011, 18, 109–130. [Google Scholar] [CrossRef]
- Ramezani, H.; Ramezani, F. Potential for the wider application of national forest inventories to estimate the contagion metric for landscapes. Environ. Monit. Assess. 2015, 187, 116. [Google Scholar] [CrossRef] [PubMed]
- Lister, A.; Scott, C. Use of space-filling curves to select sample locations in natural resource monitoring studies. Environ. Monit. Assess. 2009, 149, 71–80. [Google Scholar] [CrossRef]
- Burrows, S.N.; Gower, S.T.; Clayton, M.K.; Mackay, D.S.; Ahl, D.E.; Norman, J.M.; Diak, G. Application of geostatistics to characterize leaf area index (LAI) from flux tower to landscape scales using a cyclic sampling design. Ecosystems 2002, 5, 667–679. [Google Scholar]
- Shannon, C.E.; Weaver, W. The Mathematical Theory of Communication; University of Illinois Press: Urbana, IL, USA, 1962. [Google Scholar]
- Turner, M.G. Landscape ecology: The effect of pattern on process. Annu. Rev. Ecol. Syst. 1989, 20, 171–197. [Google Scholar] [CrossRef]
- Miller, J.N.; Brooks, R.P.; Croonquist, M.J. Effects of landscape patterns on biotic communities. Landsc. Ecol. 1997, 12, 137–153. [Google Scholar] [CrossRef]
- He, H.S.; DeZonia, B.; Mladenoff, D.J. An aggregation index (AI) to quantify spatial patterns of landscapes. Landsc. Ecol. 2000, 15, 591–601. [Google Scholar] [CrossRef]
- Riitters, K.H.; Oneill, R.V.; Wickham, J.D.; Jones, K.B. A note on contagion indices for landscape analysis. Landsc. Ecol. 1996, 11, 197–202. [Google Scholar] [CrossRef]
- Li, X.; He, H.S.; Bu, R.; Wen, Q.; Chang, Y.; Hu, Y.; Li, Y. The adequacy of different landscape metrics for various landscape patterns. Pattern Recognit. 2005, 38, 2626–2638. [Google Scholar] [CrossRef]
- ESRI. ArcGIS Desktop; ESRI: Redlands, CA, USA, 2018. [Google Scholar]
- Rosenkrantz, D.J.; Stearns, R.E.; Lewis, P.M. An analysis of several heuristics for the traveling salesman problem. In Fundamental Problems in Computing: Essays in Honor of Professor Daniel J. Rosenkrantz; Ravi, S.S., Shukla, S.K., Eds.; Springer: Dordrecht, The Netherlands, 2009; pp. 45–69. [Google Scholar]
- Hasler, M.; Hornik, K. TSP: Traveling Salesperson Problem; R Package. 2018. Available online: https://CRAN.R-project.org/package=TSP (accessed on 3 September 2019).
- U.S. Department of Commerce. 2010 & 2009 Maryland Comparison of Total and Single Family Housing Units; Bureau of the Census, Manufacturing Mining and Construction Statistics Division: Washington, DC, USA, 2010. Available online: https://planning.maryland.gov/msdc/Pages/newhh/2010/annual2010.aspx (accessed on 3 September 2019).
- Jenks, G.F. The data model concept in statistical mapping. Int. Yearb. Cartogr. 1967, 7, 186–190. [Google Scholar]
- Thompson, S.K. Sampling, 3rd ed.; John Wiley and Sons, Inc.: Hoboken, NJ, USA, 2012. [Google Scholar]
- R Core Team. R: A Language and Environment for Statistical Computing; R Foundation for Statistical Computing: Vienna, Austria, 2017. [Google Scholar]
- Curran, P.J. The semivariogram in remote sensing: An introduction. Remote Sens. Environ. 1988, 24, 493–507. [Google Scholar] [CrossRef]
- Westfall, J.A.; Pugh, S.A.; Coulston, J.W. Conducting Tests for Statistically Significant Differences Using Forest Inventory Data; U.S. Department of Agriculture, Forest Service, Northern Research Station: Newtown Square, PA, USA, 2013; p. 10.
- Forman, R.T.T. Land Mosaics: The Ecology of Landscapes and Regions; Cambridge University Press: Cambridge, MA, USA, 1995. [Google Scholar]
- Turner, M.G.; Gardner, R.H.; O’Neill, R.V. Landscape Ecology in Theory and Practice: Pattern and Process; Springer: New York, NY, USA, 2001. [Google Scholar]
- Ramezani, H.; Holm, S.; Allard, A.; Ståhl, G. A review of sampling-based approaches for estimating landscape metrics. Nor. Geogr. Tidsskr. Nor. J. Geogr. 2013, 67, 61–71. [Google Scholar] [CrossRef]
- Riitters, K.H.; O’Neill, R.V.; Hunsacker, C.T.; Wickham, J.D.; Yankee, D.H.; Timmins, S.P.; Jones, K.B.; Jackson, B.L. A factor analysis of landscape pattern and structure metrics. Landsc. Ecol. 1995, 10, 23–39. [Google Scholar] [CrossRef]
- Tinkham, W.T.; Mahoney, P.R.; Hudak, A.T.; Domke, G.M.; Falkowski, M.J.; Woodall, C.W.; Smith, A.M.S. Applications of the United States Forest Inventory and Analysis dataset: A review and future directions. Can. J. For. Res. 2018, 48, 1–18. [Google Scholar] [CrossRef]
- Crow, T.R. Moving to the big picture: Applying knowledge from landscape ecology to managing U.S. National Forests. In Forest Landscape Ecology: Transferring Knowledge to Practice; Perera, A.H., Buse, L.J., Crow, T.R., Eds.; Springer: New York, NY, USA, 2006; pp. 157–180. [Google Scholar]
- Morin, R.S.; Lister, A.; Doyle, J. Use of FIA data and GIS to characterize the effects of fragmentation on the forests of New Hampshire. In Proceedings of the 2009 Society of American Foresters National Convention, Opportunities in a Forested World, Orlando, FL, USA, 30 September–4 October 2009; Society of American Foresters: Bethesda, MD, USA, 2009. [Google Scholar]
Figure 1.
Study areas in Maryland (MD), Prince George’s County (PG), and Schuylkill County (SC), Pennsylvania, USA. Forest/nonforest map from the reclassified 2011 version NLCD (National Land Cover Database) product [9].
Figure 1.
Study areas in Maryland (MD), Prince George’s County (PG), and Schuylkill County (SC), Pennsylvania, USA. Forest/nonforest map from the reclassified 2011 version NLCD (National Land Cover Database) product [9].
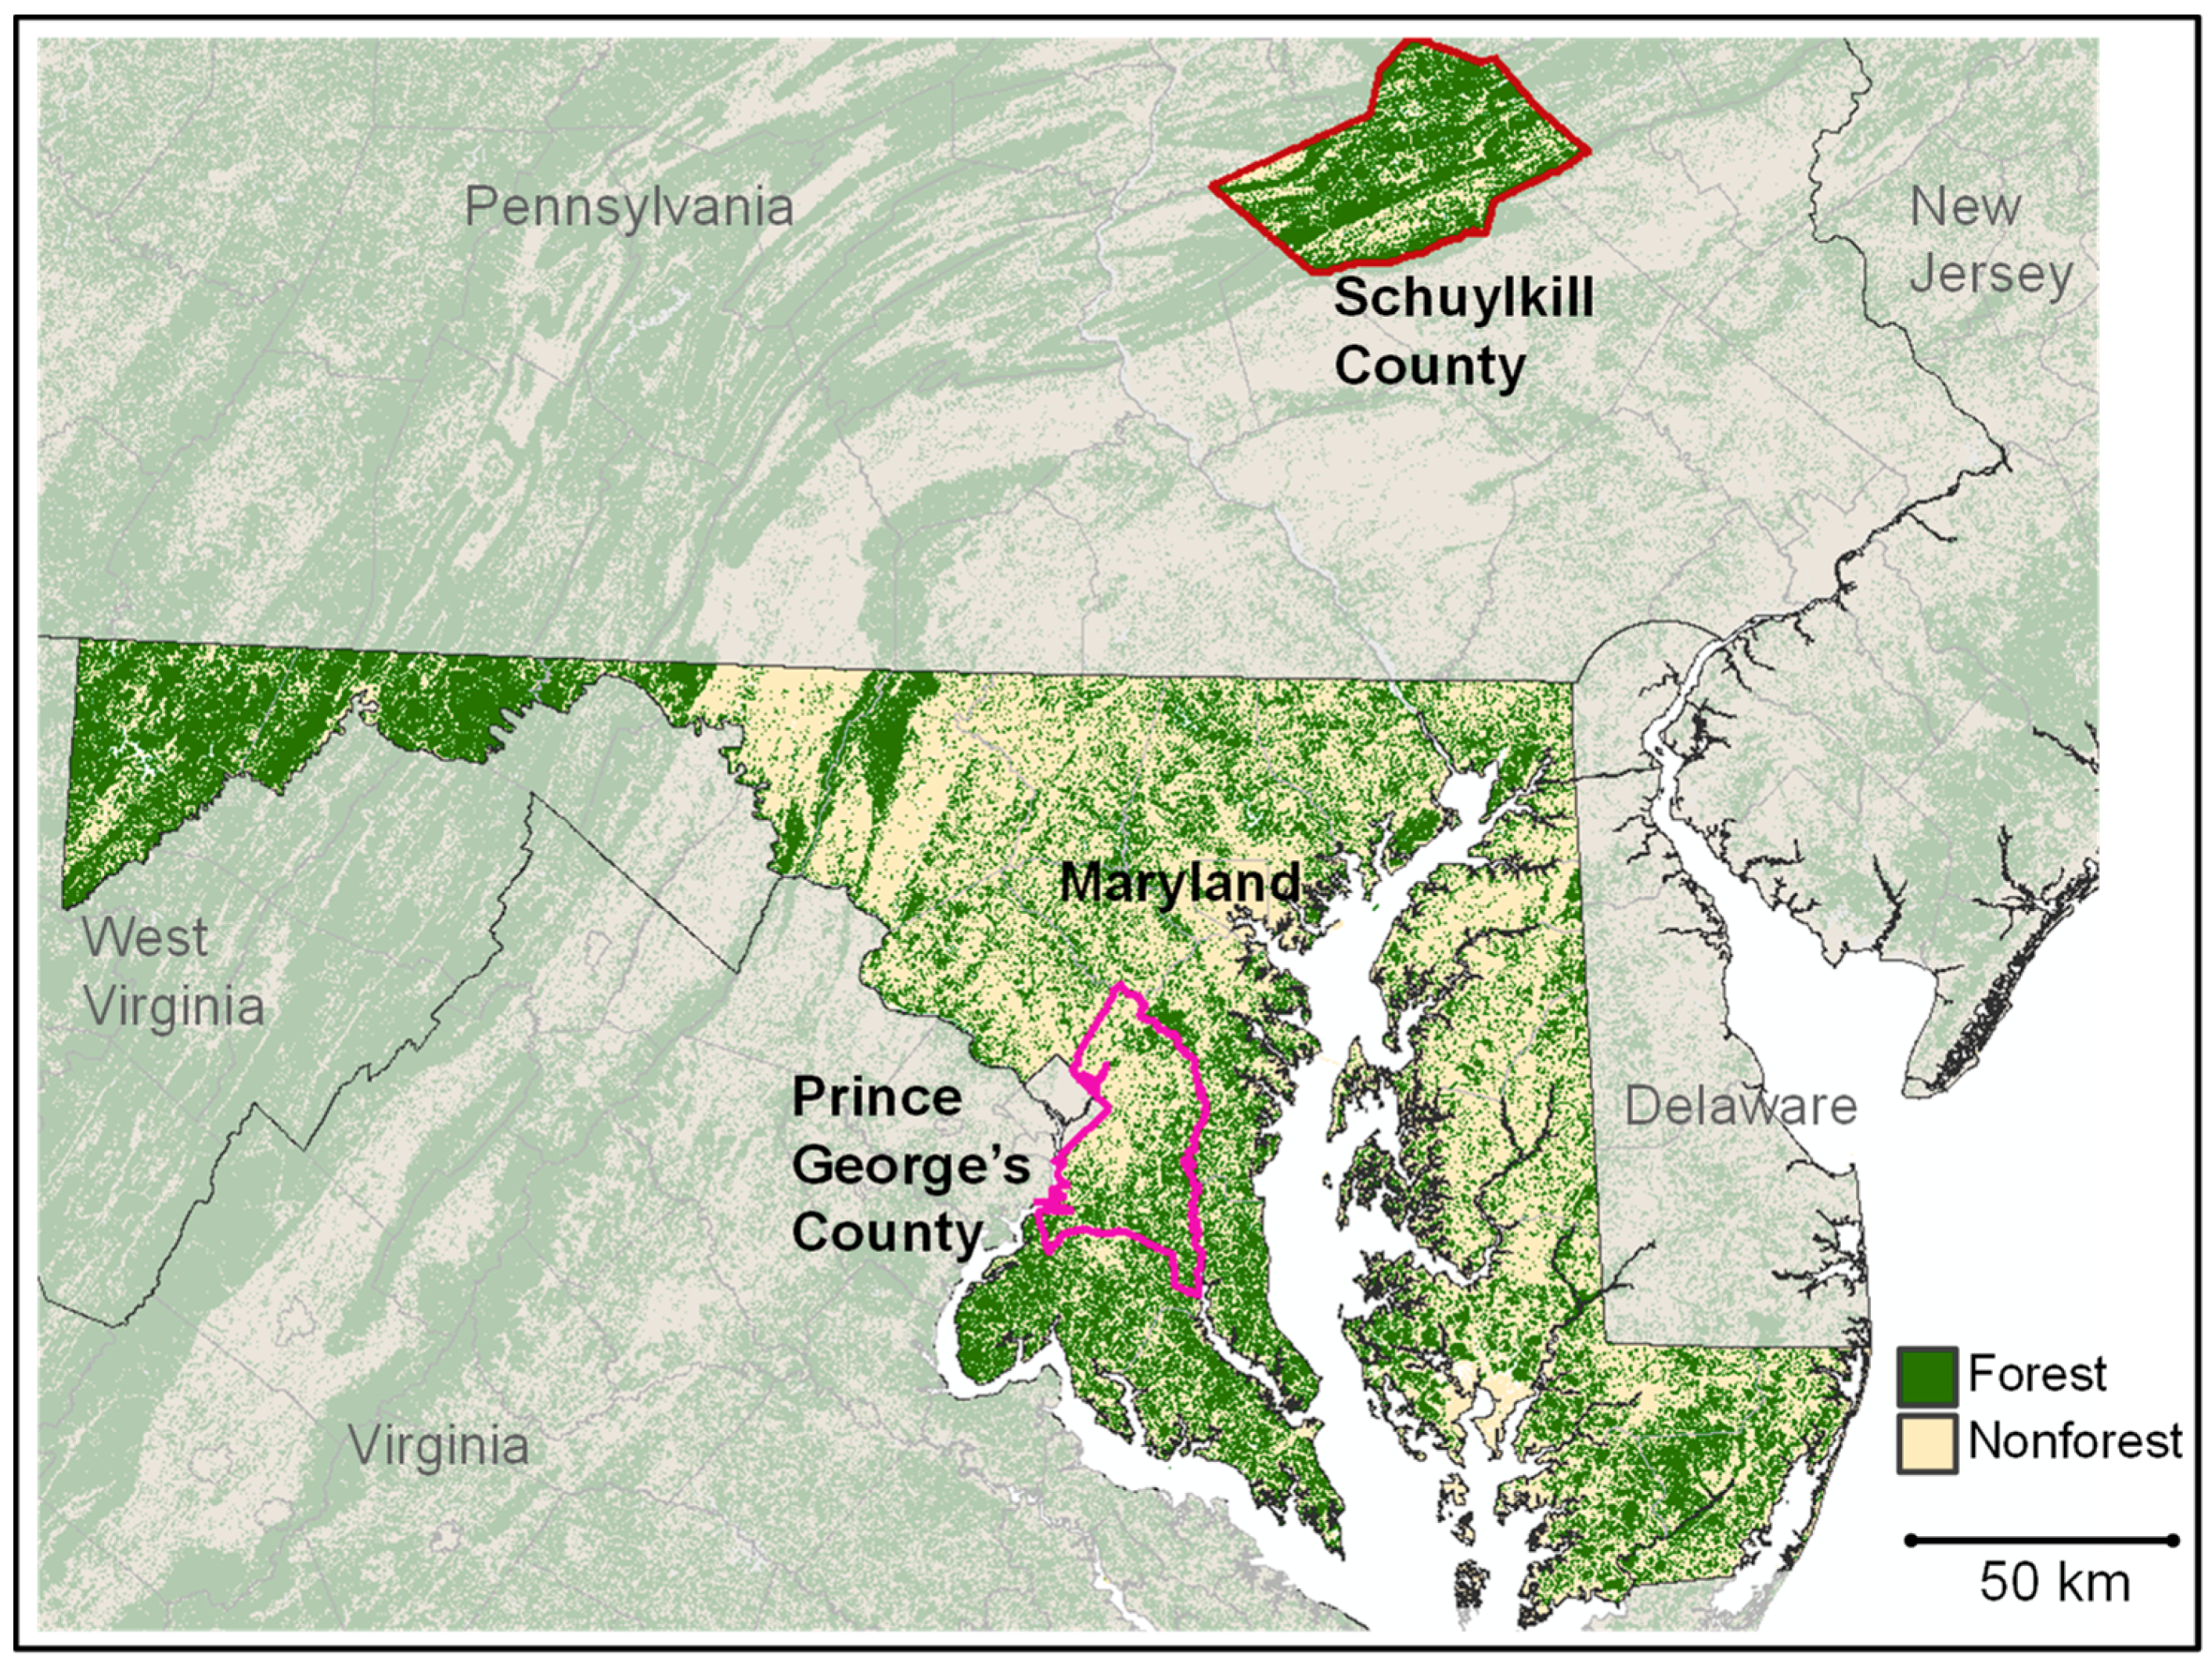
Figure 2.
Plot designs for photointerpretation (PI)-based study. (a) The plot design for MD, which was chosen as part of a larger study. (b) The design for PG, which was chosen in order to achieve a roughly equal number of pairs of points per separation distance class. (c) The design for SC, which was chosen as part of a larger study on forest inventory precision.

Figure 3.
(a–c). Examples of the calculation of PAI (Point Aggregation Index) for the 0–10.5 m separation distance class in a small study area and an artificial network of sample points. (d) Example of PAI calculation at a different scale (the 20–25 m separation distance class). The black dots are sample plots; the blue polygons represent patches of class i, e.g., forest; and the white background represents the other landscape classes. Solid lines represent adjacencies between class i and itself, and the dashed lines show the same for class i and the other landscape class (J). Adjacency, in this example, is defined as plots being within the separation distance class. The equation used for calculations is given in Table 1.

Figure 4.
(a) Example of Microsoft Access form used in the PG study area. i. Links to Google and Bing maps, centered on plot center; ii. Interface for selecting cover change class (e.g., af = Agriculture to Forest transition); iii. An array of points that comprise the cluster plot, with a 0.4-ha template rectangle superimposed for reference. (b) Example of an Microsoft Access form used for the SC study area. i. Google and Bing maps links; ii. An array of points comprising the cluster plot. Points touching forest canopy are “painted” by holding the shift key while passing the mouse over them; iii. Record navigation tools to facilitate switching between plots and selected sets of points.

Figure 5.
Subpopulations of counties created based on a grouping algorithm and housing unit permit information. PAI was calculated for each subpopulation (low, medium, and high housing permit density) for 2 periods and multiple separation distances. Locations of county groups and forest/nonforest map from NLCD 2011 are shown for reference.

Figure 6.
Example of inputs to the traversal width/length (TWL) metric. Continuous north-south and east-west strips are created across forested portions of the image using ArcGIS software. (a) The forest (green) and nonforest (yellow) land cover classes on a portion of the NLCD image from the PG study area. (b) The east-west and (c) the north-south strips used in the calculation of TWL (Equation (3)).

Figure 7.
PAI vs. separation distance class for the PG study area, calculated with both photointerpreted (PI) and NLCD-based change maps. Error bars represent 95% confidence intervals.
Figure 7.
PAI vs. separation distance class for the PG study area, calculated with both photointerpreted (PI) and NLCD-based change maps. Error bars represent 95% confidence intervals.

Figure 8.
Relative frequency histogram of TWL components, or lengths of a combination of horizontal and vertical 30-m wide transects through forested portions of an NLCD image from the PG study area.
Figure 8.
Relative frequency histogram of TWL components, or lengths of a combination of horizontal and vertical 30-m wide transects through forested portions of an NLCD image from the PG study area.

Figure 9.
The relationship between three counties grouped by historical housing permit density levels (low, medium, and high), imagery date (1998 and 2007), and the fragmentation metric PAI across different separation distance classes.
Figure 9.
The relationship between three counties grouped by historical housing permit density levels (low, medium, and high), imagery date (1998 and 2007), and the fragmentation metric PAI across different separation distance classes.


Table 1.
Landscape metrics calculated at the plot-level for the forest fragmentation and degradation analysis conducted in the Schuylkill County (SC) study area. For Maryland (MD) and Prince George’s County (PG), only PAI (Point Aggregation Index) was calculated, summarized at the landscape-level. The subset of plots used represents the subset of the total number of plots in the population for which calculation of the metric is feasible. Infeasible calculations can consist of scenarios leading to division by zero, or, for some metrics, distance calculations between forested points on plots with 1 or fewer forested points. Sample sizes (n) used for each metric in the SC study area are given.
| Metric | Subset of Plots Used | Equation | Description |
|---|---|---|---|
| Point Aggregation Index (PAI) 1 | Plots with at least 1 forested point (n = 1602) | The number of forest-forest point adjacencies divided by the total number of adjacencies between forest and any other type (including forest) in the estimation area. Calculated with Aij, an i × j (i = j = 1…m points in the estimation area) adjacency matrix with binary elements (1= a forested point adjacent to another forested point, 0 otherwise) and Bij, an i × j adjacency matrix with binary elements (1 = a forested point adjacent to any point type, 0 otherwise). Values can range from 0 (the case where there are no adjacent forest points) to 1 (the case where all points are forest). | |
| TSP distance (TSPd) | Plots with at least 2 forested points (n = 1599) | The shortest path distance (meters) calculated using an algorithmic solution to what is known as the Traveling Salesperson Problem (TSP), farthest insertion method [48] found within the R package TSP [49]. di = the ith member of the set D of interpoint distances leading to the shortest overall distance between all forested points on the plot, returning to the first point. Values range from the minimum distance between two adjacent points (the case where there are 2 adjacent forested points on the plot; 12 m in the case of SC) to the sum of the shortest path roundtrip distance between all points on the plot (the case where all points on the plot are forest; approximately 675 m in the case of SC). | |
| Relative TSP distance (rTSPd) | Plots with at least 2 forested points (n = 1599) | Relative (average per point) distance along the shortest path between all forested points on the plot, returning to point 1. k = the number of forested points in the plot. Values range from ½ the distance between 2 adjacent points (the case where there are k = 2 adjacent forested points on the plot) to 1/kth of the sum of the shortest path roundtrip distance between all points on the plot (the case where all points on the plot are forest; in the case of SC, k = 52). | |
| Nearest Neighbour distance (NNd) | Plots with at least 2 forested points (n = 1599) | Nearest neighbor distance, calculated as the nonzero minimum of the i × j (i = j = 1…k forested points on the plot) distance matrix C with elements comprised of geographic distance between forested points i and j. Values range from the minimum distance between two adjacent points (the case where there are k = 2 adjacent forested points on the plot; 12 m in the case of SC) to the maximum distance between 2 points on the plot (the case where there are k = 2 forest points located at the extreme ends of the plot; approximately 82 m in the case of SC). | |
| Mean Interpoint Distance (MId) | Plots with at least 2 forested points (n = 1599) | The average distance between forested points on the plot, calculated as the mean of the i × j (i = j = 1…k forested points on the plot) distance matrix D with elements comprised of geographic distance between forested points i and j. Values range from ½ the distance between 2 adjacent points (the case where there are 2 adjacent forested points on the plot) to ½ the distance between the 2 points located at extreme ends of the plot (the case where there are 2 forested points located at the extreme ends of the plot). | |
| Number of f-f point adjacencies (NA) | Plots with at least 1 forested point (n = 1602) | The number of forest-forest point adjacencies on the plot, summarized from Aij, the i × j (i = j = 1…m points in the plot) adjacency matrix with binary elements (1= a forested point adjacent to another forested point, 0 otherwise). Values range from 0 (the case where there are no forest-forest adjacencies) to the total count of possible point to point adjacencies on the plot (the case where all points are forest; 170 m in the case of SC). | |
| Relative number of adjacencies (rNA) | Plots with at least 1 forested point (n = 1602) | The number of forest-forest point adjacencies divided by the total number of possible adjacencies of any type on the plot, calculated with NA and Dij, the i × j (i = j = 1…m points in the plot) adjacency matrix obtained when all points are a forest. Values range between 0 (the case where there are no forest-forest adjacencies) and 1 (the case where all points are forest). | |
| Mean Forest Proportion 18-m window (MFP18) | All plots (n = 2099) | Mean of the proportions of forested points surrounding each of the m points on the plot. pl = the proportion of forest points around point l. Values range from 0 (the case where there are no forested points on the plot) to 1 (the case where all points on the plot are forest). The radius of the buffer used will vary by plot design (for the SC area, 18 m was chosen). | |
| SD Forest Proportion 18-m window (SDFP18) | All plots (n = 2099) | The standard deviation of the proportions of forested points surrounding each of the m points on the plot. Values range from 0 (all points are either forest or nonforest) to a maximum value of approximately 0.5 (when half of the points on the plot are surrounded by forest). |
1 For MD and PG, the estimation area referred to in the description is the analysis unit as a whole; for SC, the estimation area is individual plots.
Table 2.
Plot-based mean and precision values of metrics and change described in Table 1 and Equations (4) and (5), calculated for the SC study area. Entries consist of means, absolute and relative (%) standard errors (SE), and, for change, the 95% confidence interval half-widths (SE*1.96). Estimates are from the original photointerpretation (PI) dataset (Original); the same plots, but with 1% random forest loss applied (Degraded); and the mean difference (Degraded − Original). PF, which is not a fragmentation metric included in Table 1, is the population-level estimate of forest proportion.
| Original | Degraded | Change (Degraded − Original) | |||||
|---|---|---|---|---|---|---|---|
| Metric | Mean | SE | Mean | SE | Mean | SE | CI Half-Width |
| PAI | 0.84 | 0.0055 (0.7%) | 0.82 | 0.0054 (0.7%) | −0.02 | 0.0006 (4%) | 0.001 |
| TSPd | 528.46 | 4.2896 (0.8%) | 525.25 | 4.2727 (0.8%) | −3.21 | 0.2075 (6.5%) | 0.407 |
| rTSPd | 12.83 | 0.0354 (0.3%) | 12.88 | 0.0356 (0.3%) | 0.05 | 0.0061 (11.6%) | 0.012 |
| NNd | 10.09 | 0.0156 (0.2%) | 10.09 | 0.0157 (0.2%) | 0.00 | 0.0013 (92.7%) | 0.002 |
| MID | 41.15 | 0.1724 (0.4%) | 41.13 | 0.173 (0.4%) | −0.01 | 0.0068 (46.1%) | 0.013 |
| NA | 130.60 | 1.3301 (1%) | 128.01 | 1.3086 (1%) | −2.59 | 0.1013 (3.9%) | 0.199 |
| rNA | 0.77 | 0.0078 (1%) | 0.75 | 0.0077 (1%) | −0.02 | 0.0006 (3.9%) | 0.001 |
| MFP18 | 0.62 | 0.0106 (1.7%) | 0.61 | 0.0105 (1.7%) | −0.01 | 0.0003 (4.6%) | 0.001 |
| SDFP18 | 0.09 | 0.0033 (3.6%) | 0.10 | 0.0032 (3.2%) | 0.01 | 0.0005 (6.3%) | 0.001 |
| PF | 0.62 | 0.0106 (1.7%) | 0.61 | 0.0105 (1.7%) | −0.01 | 0.0003 (4.5%) | 0.001 |
© 2019 by the authors. Licensee MDPI, Basel, Switzerland. This article is an open access article distributed under the terms and conditions of the Creative Commons Attribution (CC BY) license (http://creativecommons.org/licenses/by/4.0/).
Share and Cite
MDPI and ACS Style
Lister, A.; Lister, T.; Weber, T. Semi-Automated Sample-Based Forest Degradation Monitoring with Photointerpretation of High-Resolution Imagery. Forests 2019, 10, 896. https://doi.org/10.3390/f10100896
AMA Style
Lister A, Lister T, Weber T. Semi-Automated Sample-Based Forest Degradation Monitoring with Photointerpretation of High-Resolution Imagery. Forests. 2019; 10(10):896. https://doi.org/10.3390/f10100896
Chicago/Turabian StyleLister, Andrew, Tonya Lister, and Thomas Weber. 2019. "Semi-Automated Sample-Based Forest Degradation Monitoring with Photointerpretation of High-Resolution Imagery" Forests 10, no. 10: 896. https://doi.org/10.3390/f10100896
Note that from the first issue of 2016, this journal uses article numbers instead of page numbers. See further details here.